3M 2017 Financial Results
|
|
|
- Oswald Phelps
- 6 years ago
- Views:
Transcription
1 3M 2017 Financial Results Financial Analysts Call Friday, May 5 th, 2017
2 1 1 Financial highlights 2 Commercial & Risk overview 3 Year-to-Date Results 4 Appendices 2
3 3M 2017 Financial highlights Turnover reaches 657 million, down 0.7% at constant exchange rates vs Q1 2016, but up +2.2% vs Q at constant FX. Net loss ratio all attachment years is 52.8%, down 1.1 pts vs Q Attritional claims are at a low level after a continuous decrease during Net cost ratio at 25.6%, slightly above last year by +0.2 pt. Ordinary operating income amounts to 109 million, up 5.2% year on year due to the improved net combined ratio, which is at its lowest quarterly level since Q Net income Group Share stands at 88 million, down 13.0 million. The decrease is explained by the exceptional gain realized last year on the sale of Bürgel last year in Germany ( 22.4 million after tax). 3
4 2 1 Financial highlights 2 Commercial & Risk overview 3 Year-to-Date Results 4 Appendices 4

5 Commercial performance Q Q1 New Business reached 96 million, which is 4 million above the level of Q1 last year. The positive contribution is from the multinational segment, US and Northern Europe. Retention 86% 89% 92% 90% 90% 90% 87% 89% At the end of Q1 2017, the retention rate stands at 89% which is slightly better than the level of Q Q1 +8% Rate variation -5% -2% -0% -2% -2% -0.3% -0.5% Renewal rate evolution is still slightly negative (-0.5%) but improved vs Q (-1.5%) Q1 Volume variation -3% +8% +0% -1% +0% -1% -0.6% -0.3% Q1 Contribution from customers insured turnover is almost flat. Positive volume variation from Western European countries is offset by negative contributions from emerging markets. Commercial data in this slide is credit insurance only (excluding bonding and fidelity) and does not include figures related to non-consolidated entities. 5
6 Exposure is almost flat year on year and covered amounts are still decreasing Exposure is stabilizing at the average 2016 level In EUR bn % Grade weight 4Q Q Q Q % 85.8% 86.2% 86.3% % 14.2% 13.8% 13.7% 1Q 2Q 3Q 4Q 1Q 2Q 3Q 4Q 1Q 2Q 3Q 4Q 1Q Claims covered amounts continue to trend downwards Amount (EUR mn) Information in this slide is credit insurance only (i.e. excludes bonding and fidelity) 385 Number (thousand) Q 2Q 3Q 4Q 1Q 2Q 3Q 4Q 1Q 2Q 3Q 4Q 1Q Covered amount Number of declared
7 3 1 Financial highlights 2 Commercial & Risk overview 3 Year-to-Date Results 4 Appendices 7
8 Operating profit and net income higher than last year excluding Bürgel impacts -0.6% -0.7% Gross earned premium -0.3% -0.4% Net Expense ratio 78.4% 25.6% 79.3% 25.4% -14.4% 24 Bürgel -12.8% 22 Bürgel Service revenues Net Loss ratio 52.8% 53.9% M M 2016 Turnover (EUR mn) 3M 2016 cst FX 3M M 2016 Net Combined ratio (in %) 3M M 2016 Operating income (EUR mn) 3M M 2016 (1) (2) Net income, Group share (EUR mn) (1) Of which 24.3m realized gain before tax from the sales of the Bürgel entities. (2) Of which 22.4m realized gain net of tax from the sales of the Bürgel entities. 8
9 Turnover is slightly lower than last year but growth is picking up in Europe, mainly in Northern Europe and France (1) (1) 3M M 2016 Published EUR mn DACH % % France % % Northern Europe % % Med. Countries, Middle East & Africa % % Americas % % Asia Pacific % % Inward from non-consolidated OEs & Other (1) % % Turnover % % % 3M 2016 cst Fx % (1) Inter-region elimination 9
10 3M 2017 Net Loss ratio is 1.1 points lower year on year 70% 65.2% 71.8% 67.5% 67.3% 61.9% 63.1% 62.2% 61.0% 60.7% 63.3% 63.7% 61.8% 61.7% 59.5% 60.7% 63.6% 61.5% 61.1% 60.9% 59.9% 60.4% 50% 50.6% 51.3% 49.6% 51.7% 57.7% 52.5% 52.6% 50.5% 49.1% 46.8% 48.2% 48.8% 50.8% 48.0% 51.1% 53.3% 53.9% 53.3% 52.7% 52.2% 52.8% YTD 30% 10% -10% -30% 70% -14.6% 65.2% -20.6% 78.1% -17.9% -15.5% 59.2% 66.5% -4.3% 61.9% -10.6% -9.6% -10.5% -11.7% -16.5% -15.6% -13.0% -10.9% -11.5% -9.7% -10.3% 72.5% 65.9% 64.7% 64.2% 60.7% 60.2% 57.7% 56.0% 61.7% 63.2% 57.3% -7.6% -7.8% -8.2% -7.6% -7.6% 61.5% 60.6% 60.4% 60.4% 56.9% Quarterly 50% 30% 50.6% 51.9% 46.5% 57.9% 57.7% 47.8% 52.8% 44.3% 49.1% 44.4% 50.9% 50.6% 50.8% 45.2% 57.3% 60.3% 53.9% 52.6% 51.5% 50.9% 52.8% 10% -10% -30% -4.3% -5.4% -8.6% -7.4% -5.9% -14.6% -12.7% -13.3% -11.7% -7.6% -8.0% -6.0% -13.7% -10.9% -8.9% -7.6% -12.1% -12.2% -16.4% -21.5% -26.2% 1Q 2Q 3Q 4Q 1Q 2Q 3Q 4Q 1Q 2Q 3Q 4Q 1Q 2Q 3Q 4Q 1Q 2Q 3Q 4Q 1Q Net Loss ratio current year Net Loss ratio prior years Net Loss ratio all attachment years 10
11 Net Combined ratio lowest since 9M % 72.9% 72.3% 74.6% 80.7% 76.4% 76.8% 75.3% 74.6% 73.1% 74.7% 75.4% 76.1% 75.0% 78.3% 80.1% 79.3% 79.8% 79.7% 79.8% 78.4% 50.6% 51.3% 49.6% 51.7% 57.7% 52.5% 52.6% 50.5% 49.1% 46.8% 48.2% 48.8% 50.8% 48.0% 51.1% 53.3% 53.9% 53.3% 52.7% 52.2% 52.8% 23.0% 21.6% 22.7% 22.9% 23.0% 23.9% 24.2% 24.8% 25.5% 26.3% 26.5% 26.6% 25.3% 27.0% 27.3% 26.8% 25.4% 26.6% 27.0% 27.6% 25.6% 3M 6M 9M 12M 3M 6M 9M 12M 3M 6M 9M 12M 3M 6M 9M 12M 3M 6M 9M 12M 3M (1) Net Expense ratio Net Loss ratio all attachment years (1) Restated for IAS 19 11
12 Net financial income stable due to favorable FX impact variation year on year, which compensates for lower realized gains Net financial result (EUR mn) -2.7% Total asset base (EUR bn) (1) 4,631 4,759 3M M 2016 Current investment income Investment management charges Net change in foreign currency Net gain (loss) on sales of investments less impairment and depreciation write-downs (2) Net financial result before financing expense and before at equity result (3) (1) Market value (2) 2016 s FX result reflected the long position in GBP, where the depreciation drove the FX loss. (3) Share of income from companies accounted by the equity method 12
 (2) (1) In 2016, other non")
 from the sale of Bürgel.")
13 Net income at 88 million, down compared to last year, which included the sale of Bürgel in Germany (1) (2) (1) In 2016, other non ordinary operating income and expense included a 24.3m gain (pre-tax) from the sale of Bürgel. Impact in the net result was 22.4m (after-tax). 13
14 4 1 Financial highlights 2 Commercial & Risk overview 3 Year-to-Date Results 4 Appendices 14
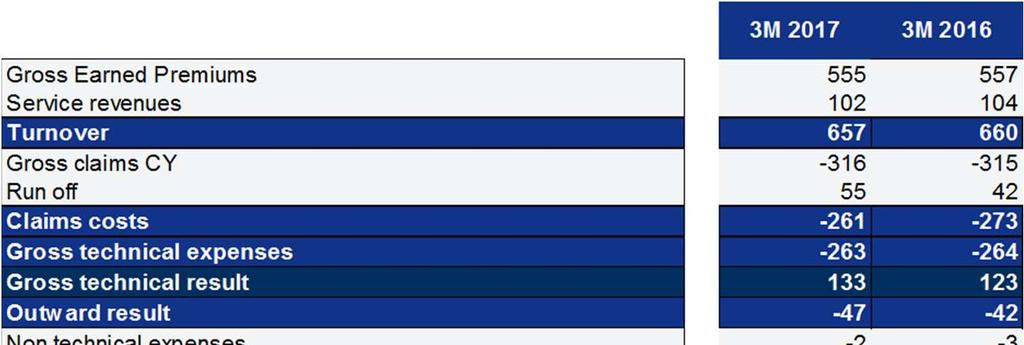
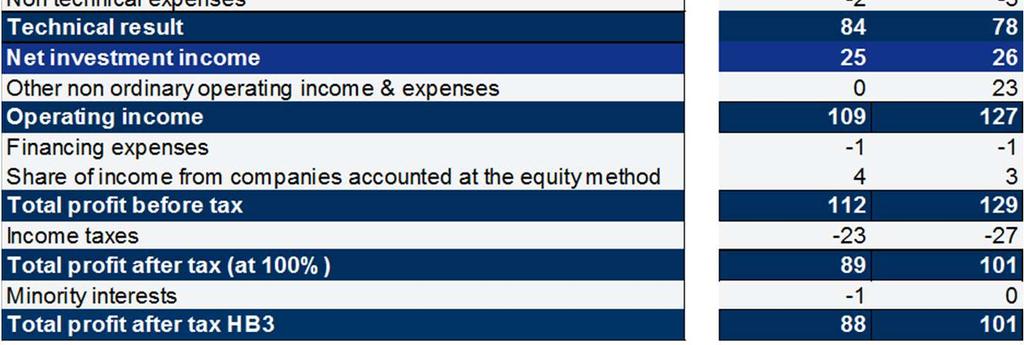
15 Simplified P&L 15
16 Investor Relations Next Events General Assembly 2Q 2017 Earnings (webcast) 3Q 2017 Earnings (webcast) Dates May 24 th 2017 July 27 th 2017 November 7 th 2017 Stock Market Data As of 03/31/2017 Listing Euronext Paris Code ELE.PA Shares outstanding 42,641,635 Market cap. ( mn) 3,673 Investor Relations Contact Etienne DEFRAIGNE, Group Finance Director +33 (0) etienne.defraigne@eulerhermes.com Shareholding Structure (03/31/2017) 2% Allianz Free Float Treasury stocks 35% 63% 16
17 Glossary Ceded Claims Costs: Gross Claims Costs corresponding to business assigned to reinsurers Ceded Premium: Premium corresponding to business assigned to reinsurers Cession Rate: Ceded Premium divided by Gross Earned Premium Combined Ratio: Sum of the Cost ratio and the Loss ratio Cost ratio (or Expense ratio): Overheads and service margin as a proportion of earned premiums Credit insurance: Insurance against the risks of non-payment of companies trade receivables Gross Claims Costs: Claims Costs before reinsurance Gross Earned Premium: Earned premium before reinsurance Gross Technical Result: Result from insurance activities (excluding reinsurance operations and including service income and expenses) Loss: Situation in which a risk is realized and which entitles the policyholder to indemnification, thus triggering application of the indemnification provided for in the credit insurance policy. Loss ratio (or Claim ratio): Claims costs as a proportion of the earned premiums Net Claims Costs: Gross Claims Costs net of reinsurance Net Earned Premium: Gross Earned Premiums net of reinsurance Net Technical Result: Result from insurance activities (including reinsurance operations and service income and expenses) Outward commission: Remuneration paid by the reinsurer to the ceding insurer for the premiums ceded Premium: Amount paid by the policyholder to the insurance company in exchange for risk coverage. A distinction is made between: -Written premium: Amount invoiced during the period for coverage against the risks stipulated in the policy -Earned premium: Portion of the premium written during the period or earlier corresponding to the coverage of risks during the period concerned Reinsurance: An operation by which an insurer obtains cover from a third party (the reinsurer) for part of the risks that it has guaranteed, in exchange for the payment of a premium Retention Rate: Net Earned Premium divided by Gross Earned Premium Run-off: Claims reserves release related to previous years policies whose risks are over Information services: Research and analysis carried out to provide our policyholders with the required credit insurance cover, and monitoring of the solvency of their customers Collection services: Extra-judicial and/or judicial procedure conducted by Euler Hermes to secure payment of a receivable from the debtor Turnover: Turnover is composed of gross earned premiums and service revenues 17
18 Disclaimer These assessments are, as always, subject to the disclaimer provided below. Cautionary Note Regarding Forward-Looking Statements The statements contained herein may include statements of future expectations and other forward-looking statements that are based on management s current views and assumptions and involve known and unknown risks and uncertainties that could cause actual results, performance or events to differ materially from those expressed or implied in such statements. In addition to statements which are forward-looking by reason of context, the words "may", "will", "should", "expects", "plans", "intends", "anticipates", "believes", "estimates", "predicts", "potential", or "continue" and similar expressions identify forward-looking statements. Actual results, performance or events may differ materially from those in such statements due to, without limitation, (i) general economic conditions, including in particular economic conditions in the Euler Hermes Group s core business and core markets, (ii) performance of financial markets, including emerging markets, and including market volatility, liquidity and credit events (iii) the frequency and severity of insured loss events, including from natural catastrophes and including the development of loss expenses, (iv) persistency levels, (v) the extent of credit defaults, (vi) interest rate levels, (vii) currency exchange rates including the Euro/U.S. Dollar exchange rate, (viii) changing levels of competition, (ix) changes in laws and regulations, including monetary convergence and the European Monetary Union, (x) changes in the policies of central banks and/or foreign governments, (xi) the impact of acquisitions, including related integration issues, (xii) reorganization measures, and (xiii) general competitive factors, in each case on a local, regional, national and/or global basis. Many of these factors may be more likely to occur, or more pronounced, as a result of terrorist activities and their consequences. No duty to update. The company assumes no obligation to update any information contained herein. 18
19 Thank you for your attention
12M 2017 Financial Results. Financial Analysts Call Friday, February 9 th, 2018
 12M 2017 Financial Results Financial Analysts Call Friday, February 9 th, 2018 1 1 Highlights 2 Commercial & Risk Overview 3 Quarterly Results 4 Year-to-Date Results 5 Solvency & Dividend 6 Appendices
9M 2017 Financial Results. Financial Analysts Call Tuesday, November 7 th, 2017
 9M 2017 Financial Results Financial Analysts Call Tuesday, November 7 th, 2017 1 1 Highlights 2 Commercial & Risk Overview 3 Quarterly Results 4 Year-to-Date Results 5 Appendices 2 9M 2017 Operational
12M 2016 Financial Results
 12M 2016 Financial Results Financial Analysts Meeting February 9 th, 2017 1 1 1 Highlights 2 Commercial & Risk Overview 3 Quarterly Results 4 Year-to-Date Results 5 Dividend & Solvency 6 Appendices 2 Operational
9M 2016 Financial Results
 9M 2016 Financial Results Financial Analysts Meeting November 8 th, 2016 1 1 1 Highlights 2 Commercial & Risk Overview 3 Quarterly Results 4 Year-to-Date Results 5 Appendices 2 9M 2016 Operational highlights
H Financial results
 H1 2014 Financial results Financial analysts meeting July 30, 2014 1 1 Highlights 2 Commercial & Risk overview 3 Quarterly results 4 Year-to-date results 5 Appendices 2 1H 2014 Operational highlights Improving
12M 2013 Financial results
 12M 2013 Financial results Financial analysts meeting February 13, 2014 1 1 Highlights 2 Commercial & Risk overview 3 Quarterly results 4 Year-to-date results 5 Shareholders equity & Economic solvency
Euler Hermes 2017 half-year results: Sustained profitability, improved commercial developments in Europe
 Press Release Euler Hermes 2017 half-year results: Sustained profitability, improved commercial developments in Europe PARIS 27 July 2017 Revenues at 1,286.0 million, down 1.1pt at constant exchange rates
Q Financial Results. Financial analysts 6 May 2011
 Financial analysts 6 May Contents 1 Economic outlook 2 Q1 Review - Commercial - Risk 3 Q1 Financial results 2 Contents 1 Economic outlook 2 Q1 Review - Commercial - Risk 3 Q1 Financial results 3 Economic
HR Fact Book 2010 Allianz Group. HR Controlling Munich / April 2011
 HR Fact Book 2010 Allianz Group HR Controlling Munich / April 2011 Scope of HR reporting As of December 31, 2010 Total number of employees 1 151,338 = total number of employees with an employment contract
Delivering. Oliver Bäte Chief Executive Officer. Deutsche Bank Conference New York, May 31, Allianz Investor Relations App
 Oliver Bäte Chief Executive Officer Deutsche Bank Conference New York, May 31, 2017 Allianz Investor Relations App Apple App Store Google Play Store Allianz at a glance a globally leading financial services
Allianz Malaysia Berhad (12428-W) Financial Results 1Q Analyst Briefing 28 May 2015
 Financial Results 1Q Analyst Briefing 28 May 2015") Allianz Malaysia Berhad (12428-W) Financial Results 1Q 2015 Analyst Briefing 28 May 2015 1 2015 Campaigns 2 2 AMB Group Results 3 Allianz Malaysia Berhad (12428-W) Good start for 2015 Operating revenue
Allianz Malaysia Berhad (12428-W) Financial Results 1Q 2015 Analyst Briefing 28 May 2015 1 2015 Campaigns 2 2 AMB Group Results 3 Allianz Malaysia Berhad (12428-W) Good start for 2015 Operating revenue
Euler Hermes Q financial results. Analysts conference call 9 November 2009
 Euler Hermes Q3 2009 financial results Analysts conference call 9 November 2009 Contents 1 Economic environment 2 Euler Hermes actions and achievements 3 Q3 2009 consolidated results 4 YTD September 2009
Half-Year Financial Report
 Half-Year Financial Report As at June 30, 2016 REPORT OF THE GROUP MANAGEMENT BOARD... 3 Key events of the period... 3 Subsequent events... 4 Activity of Euler Hermes Group SA... 5 Euler Hermes Group consolidated
Euler Hermes 2009 H1 financial results. 28 July 2009
 Euler Hermes 2009 H1 financial results Contents 1 Economic environment 2 Euler Hermes actions and achievements 3 Q2 2009 consolidated results 4 S1 2009 consolidated results 2 Contents 1 Economic environment
Financial Analysts Meeting. 4 th November 2010
 Financial Analysts Meeting 4 th November EH world macro economic scenario -2011 World economy has registered a clear rebound World GDP rebounded by +5,8% between Q1- and Q2-. with a strong upturn of world
International Debt Collection: the 2018 edition of collection complexity
 Economic Insight International Debt Collection: the 2018 edition of collection complexity February 1, 2018 Authors: Maxime Lemerle +33 1 84 11 54 01 maxime.lemerle@eulerhermes.com Executive Summary The
Ordinary Annual General Meeting of Allianz SE Munich, May 21, 2008
 Ordinary Annual General Meeting of Allianz SE 2008 Munich, May 21, 2008 2007: another record year for Allianz Operating profit (EUR bn) CAGR 1 +17% Net income (EUR bn) CAGR +35% Earnings per share (EUR)
Half-Year Financial Report
 Half-Year Financial Report As at June 30, 2017 REPORT OF THE GROUP MANAGEMENT BOARD... 4 Key events of the period... 4 Subsequent events... 5 Activity of Euler Hermes Group SA... 6 Euler Hermes Group consolidated
In good shape. Clement B. Booth Member of the Board of Management. Morgan Stanley European Financials conference March 27th, 2012
 In good shape Clement B. Booth Member of the Board of Management Morgan Stanley European Financials conference March 27th, 2012 A 1 2 3 2011 assessment Strategic priorities 2012 Sovereign debt crisis Business
Coface results for Q1-2017: Net income at 7.3m driven by an improvement in net loss ratio Fit to Win progressing as planned
 Paris, 26 April 2017 17h35 Coface results for Q1-2017: Net income at 7.3m driven by an improvement in net loss ratio Fit to Win progressing as planned Turnover reaches 348.3m down (2.2)% at constant FX
Sustainable Development at Allianz. Nomura European Sustainable & Responsible Investment Conference Paris, 17 th March 2011
 Sustainable Development at Allianz Nomura European Sustainable & Responsible Investment Conference Paris, 17 th March 2011 1 1 2 3 4 About Allianz Our sustainability strategy Our activities Further information
Aon Risk Solution Seminar -AGCS perspective. Axel Theis, CEO Allianz Global Corporate & Specialty September 16, 2010
 Aon Risk Solution Seminar -AGCS perspective Axel Theis, CEO Allianz Global Corporate & Specialty September 16, 010 Content 1 Corporate & Specialty Market: Snapshot and Outlook 3 What drives the outlook
Coface H Results: Operating income up 17.5% and net income at 20.2m Improving guidance for 2017: net loss ratio 3pts better, at below 58%
 Paris, 28 July 2017 7.30am Coface H1-2017 Results: Operating income up 17.5% and net income at 20.2m Improving guidance for 2017: net loss ratio 3pts better, at below 58% Turnover: 691.7m down (0.5)% at
Allianz Group Fiscal Year 2012
 Allianz Group Fiscal Year 2012 Michael Diekmann CEO Allianz SE Financial press conference February 21, 2013 Based on preliminary figures Overview 2012 EUR 106.4bn Total revenues EUR 9.5bn Operating profit
Group financial results for the first nine months 2003
 Group financial results for the first nine months 2003 Helmut Perlet, Chief Financial Officer Analysts Conference Call November 14, 2003 The first nine months 2003 Key developments Substantial progress
+ One. Annual General Meeting 2005 of Allianz AG
 + One Annual General Meeting 2005 of Allianz AG Another significant improvement in earnings in 2004 Overview of the year under review in mn 2003 2004 04/03 Operating result 4,066 6,856 2,790 Earnings before
Lasting economic success cannot be taken for granted
 Economic Insight Lasting economic success cannot be taken for granted 7 September 2017 Authors: GREGOR EDER +49.69.24431-3358 gregor.eder@allianz.com DR ROLF SCHNEIDER +49.69.24431-5790 rolf.schneider@allianz.com
Allianz Re. Company Presentation. May Understanding Risk Creating Value
 Allianz Re Company Presentation May 2015 Understanding Risk Creating Value Content 1 Allianz Group 2 Our company 3 Our financial results 4 Our people 5 Our solutions & services 6 Our global presence 2
CONTENTS. Property and Casualty Insurance 4. Life and Health Insurance 6. Banking 9. Asset Management 11 OVERVIEW 2 SEGMENT REPORTING 4 OUTLOOK 12
 Interim Report 1. Quarter of 2002 ALLIANZ GROUP 1 CONTENTS OVERVIEW 2 SEGMENT REPORTING 4 Property and Casualty Insurance 4 Life and Health Insurance 6 Banking 9 Asset Management 11 OUTLOOK 12 CONSOLIDATED
Public Hearing on Financial Regulation and Supervision
 Bettina Corves-Wunderer Public Hearing on Financial Regulation and Supervision Panel I: To what extent did financial regulation and supervision fail in preventing the crisis? Brussels, February 25 th,
Paul Achleitner. Allianz in +One-Mode. Goldman Sachs 10th Annual European Financials Conference June 7, 2006
 Paul Achleitner Allianz in +One-Mode Goldman Sachs 10th Annual European Financials Conference June 7, 2006 Group overview: very good start into 2006 Total revenues (EUR bn) +4.9% Internal growth: +2.9%
Investor Relations Release
 Munich, November 6, 2015 oliver.schmidt@allianz.com +49 89 3800-3963 peter.hardy@allianz.com +49 89 3800-18180 reinhard.lahusen@allianz.com +49 89 3800-17224 christian.lamprecht@allianz.com +49 89 3800-3892
Glossary. Annual Media Conference Munich, February 16, 2018
 Glossary Annual Media Conference Munich, February 16, 2018 Glossary (1) AFS AGCS AllianzGI AM AP APE APR Attritional LR AuM AY LR AZ Available-for-sale: Non-derivative financial assets which have been
In good shape. Jay Ralph, Member of the Board of Management of Allianz SE. Commerzbank German Investment Seminar. New York, January 2015
 In good shape Jay Ralph, Member of the Board of Management of Allianz SE Commerzbank German Investment Seminar New York, January 2015 Allianz at a glance 1 Segments 5 Operating profit in % Regions 5 Operating
Economic Insight. German growth outlook remains favorable. Executive Summary. Author: Economy temporarily shifts down a gear in the first quarter
 Economic Insight German growth outlook remains favorable June 8, 2018 Author: GREGOR EDER +49.69.24431.3358 gregor.eder@allianz.com Executive Summary The German economy got off to a weak start in 2018,
Allianz 1Q results signal good start into 2018, on track to meet targets
 Investor Relations Release Munich, May 15, 2018 oliver.schmidt@allianz.com +49 89 3800 3963 reinhard.lahusen@allianz.com +49 89 3800 17224 christian.lamprecht@allianz.com +49 89 3800 3892 frank.stoffel@allianz.com
Profitability & solidity
 Profitability & solidity Group Treasury & Corporate Finance Group Investor Relations Allianz SE Bank of America Merrill Lynch European Credit Conference London, September 2018 Allianz Investor Relations
ECB: A secret tapering recipe?
 Economic Insight ECB: A secret tapering recipe? September 6, 2017 Authors: ANA BOATA +33.1.84.11.48.73 ana.boata@eulerhermes.com CLAUDIA BROYER +49.69.24431-3667 claudia.broyer@allianz.com GEORGES DIB
Moving forward. Oliver Bäte Member of the Board of Management. Morgan Stanley European Financials Conference London, March 19, 2013
 Moving forward Oliver Bäte Member of the Board of Management Morgan Stanley European Financials Conference London, March 19, 2013 1 Moving forward 1 2012 results review 2 Strategic priorities in Europe
Allianz achieves an operating profit of 3 billion euros in the third quarter of 2018
 Investor Relations Release Munich, November 9, 2018 oliver.schmidt@allianz.com +49 89 3800 3963 reinhard.lahusen@allianz.com +49 89 3800 17224 christian.lamprecht@allianz.com +49 89 3800 3892 frank.stoffel@allianz.com
Investor Relations Release
 Investor Relations Release Munich, November 7, 2008 oliver.schmidt@allianz.com +49 89 3800-3963 andrea.foerterer@allianz.com +49 89 3800-6677 peter.hardy@allianz.com +49 89 3800-18180 holger.klotz@allianz.com
Group financial results 1Q 2014
 Group financial results 1Q 2014 Dieter Wemmer Chief Financial Officer Journalists conference call May 14, 2014 1 Group financial results 1Q 2014 1 Highlights 2 Additional information a) Group b) Property-Casualty
Allianz Group: First Half of 2015
 Allianz Group: First Half of 2015 Oliver Bäte, CEO Allianz SE Journalist Telephone Conference August 7, 2015 Agenda 1 Status: results for the first half of 2015 2 Environment: global economic factors 3
Allianz in growth markets
 Helmut Perlet Allianz in growth markets UBS Global Insurance Conference London, June 25th, 2009 Agenda 1 Allianz at a glance 2 Financial crisis thoughts 3 Allianz in growth markets 2 Key figures 2008 Split
MACRON-OMICS THE SEQUEL CONTENTS. September France s economic pulse one year on. 05 What s next?
 Economic Research MACRON-OMICS THE SEQUEL September 2018 Image courtesy of skeeze, pixabay.com CONTENTS 04 France s economic pulse one year on 05 What s next? 07 So, what is the net impact of Macron-omics?
Allianz Group Fiscal Year 2014
 Allianz Group Fiscal Year 2014 Michael Diekmann CEO Allianz SE Financial Press Conference February 26, 2015 Based on preliminary figures Agenda 1 Global economic environment 2 Fiscal year 2014 3 Digitalization
9M-2014 results. Financial analysts presentation. October 29 th, 2014
 9M-2014 results Financial analysts presentation October 29 th, 2014 Important legal information IMPORTANT NOTICE: This presentation has been prepared exclusively for the purpose of the conference call
Investment and capital management
 Based on Preliminary Figures Paul Achleitner, Member of the Board of Management Investment and capital management Annual press conference February 26, 2009 Financing and investment highlights 2008 2008
Oliver Schmidt. Allianz at a glance. HypoVereinsbank German Investment Conference September 28, 2006
 Oliver Schmidt Allianz at a glance HypoVereinsbank German Investment Conference September 28, 2006 Agenda I. Financials II. Strategic initiatives III. Outlook IV. Appendix 2 I. Financials Allianz Group
Corporate Responsibility. at Allianz Group Communications and. Group Investor Relations. Paris, November 2017
 Corporate Responsibility at Allianz Group Communications and Corporate Responsibility Group Investor Relations Paris, November 2017 1 1 Allianz Group at a glance 2 Corporate Responsibility strategy & approach
Operating and financial review (unaudited) 2015
 2015") Zurich Insurance Group Operating and financial review (unaudited) 2015 2 Group performance review Zurich Insurance Group Operating and financial review The Operating and financial review is the management
Zurich Insurance Group Operating and financial review (unaudited) 2015 2 Group performance review Zurich Insurance Group Operating and financial review The Operating and financial review is the management
Working Paper 141. Eurozone debt crisis: Impact on the economy. June 28, 2010 ECONOMIC RESEARCH & CORPORATE DEVELOPMENT
 ECONOMIC RESEARCH & CORPORATE DEVELOPMENT Working Paper 141 June 28, 2010 } MACROECONOMICS } FINANCIAL MARKETS } ECONOMIC POLICY } SECTORS Thomas Hofmann, Dr. Rolf Schneider Eurozone debt crisis: Impact
Allianz Group Financial information as of 31 March 2018
 Allianz Group Financial information as of 31 March 2018 Reporting by business segments and quarters (starting from 1Q 2017) Consolidated Balance Sheets Asset allocation Allianz Group overview Property-Casualty
Building a global asset manager
 Joachim Faber, Member of the Board Building a global asset manager German Corporate Conference June 1, 2006 Agenda Group overview and results Allianz Global Investors Additional information 2 11 23 2 Allianz
Glossary (1) AFS APE. Allianz. Bps Basis points = 0.01% Allianz SE 2016
 AFS APE. Allianz. Bps Basis points = 0.01% Allianz SE 2016") Glossary (1) AFS AGCS AllianzGI AM APE APR AuM AWP Available-for-sale: Securities which have been acquired neither for sale in the near term nor to be held to maturity. Available-for-sale investments are
Glossary (1) AFS AGCS AllianzGI AM APE APR AuM AWP Available-for-sale: Securities which have been acquired neither for sale in the near term nor to be held to maturity. Available-for-sale investments are
Allianz reports strong results for the second quarter of 2018 and confirms full-year outlook
 Investor Relations Release Munich, August 3, 2018 oliver.schmidt@allianz.com +49 89 3800 3963 reinhard.lahusen@allianz.com +49 89 3800 17224 christian.lamprecht@allianz.com +49 89 3800 3892 frank.stoffel@allianz.com
Condensed Consolidated Financial Statements
 Condensed Consolidated Financial Statements For the 1 st quarter ended March 31, 2011 Contents Consolidated statement of financial position... 3 Consolidated income statement... 4 Consolidated statement
Allianz delivers strong 2017 results, proposes 5 percent dividend increase
 Investor Relations Release Munich, February 16, 2018 oliver.schmidt@allianz.com +49 89 3800 3963 reinhard.lahusen@allianz.com +49 89 3800 17224 christian.lamprecht@allianz.com +49 89 3800 3892 frank.stoffel@allianz.com
H results in line with July 4th announcement Strategic plan Fit to Win
 Paris, 27 July 2016 H1-2016 results in line with July 4 th announcement Strategic plan Fit to Win designed to transform Coface into the most agile global trade credit partner in the industry Net income
Global Life (GL) continues to deliver consistent results in line with previous guidance.
 continues to deliver consistent results in line with previous guidance.") Comments on Q2-16 results Slide 4: Key messages Zurich s underlying results continued to improve in the second quarter as a result of management actions outlined previously. The Q2-16 result also benefited
Comments on Q2-16 results Slide 4: Key messages Zurich s underlying results continued to improve in the second quarter as a result of management actions outlined previously. The Q2-16 result also benefited
INSOLVENCIES February 2018
 Photo by Jose Fontano on Unsplash Economic Research INSOLVENCIES February 201 FEWER CASES, BIGGER CRASHES Insolvencies Decline, Major Failures Rise 04 Global Forecast: Less Cases, Regional Disparities
Press Release 06 November 2013 N
 (p.1/6) SCOR delivers a strong performance for the first nine months of 2013, recording net income of EUR 302 million In the first nine months of 2013, SCOR records strong results and good progress towards
Supplementary information (unaudited)
") Zurich Insurance Group Supplementary information (unaudited) Results for the three months ended March 31, 2016 Zurich Insurance Group Results for the three months to March 31, 2016 Supplementary information
Zurich Insurance Group Supplementary information (unaudited) Results for the three months ended March 31, 2016 Zurich Insurance Group Results for the three months to March 31, 2016 Supplementary information
FIT for the New Normal
 Based on Preliminary Figures Paul Achleitner, Member of the Board of Management FIT for the New Normal Financial Press Conference February 25, 2010 F inancing I T nvestments ransactions 2 Financing and
1Q Dieter Wemmer Chief Financial Officer. Media conference call May 11, 2016
 1Q 2016 Dieter Wemmer Chief Financial Officer Media conference call May 11, 2016 1 Group financial results 1Q 2016 1 Highlights 2 Glossary 2 Status quo and ambitions for 2018 1Q 16 2018 1Q 16 2018 32.5%
Digital evolution transforms the insurance. Christof Mascher KBW London / 3 March 2016
 Digital evolution transforms the insurance Christof Mascher KBW London / 3 March 2016 The digital business model: Enhanced capabilities at the customer interface and along the entire value chain Identified
EMERGING CONSUMERS 2018 HALF YEAR REPORT
 EMERGING CONSUMERS 2018 HALF YEAR REPORT Allianz SE Public Copyright Allianz 2018 CONTENT Business Background News 01 WHAT IS EMERGING CONSUMERS BUSINESS FOR ALLIANZ 04 HALF-YEAR RESULTS 2018 02 HOW WE
Overview 2. Property and Casualty Insurance 5. Life and Health Insurance 8. Asset Management 10. Banking 12. Outlook 14
 Interim Report First three quarters of 2001 Allianz Group 1 CONTENTS Overview 2 Segment Reporting Property and Casualty Insurance 5 Life and Health Insurance 8 Asset Management 10 Banking 12 Outlook 14
Zurich reports business operating profit of USD 2.3 billion in a period impacted by significant weather-related events
 News Release August 15, 2013 Zurich reports business operating profit of USD 2.3 billion in a period impacted by significant weather-related events H1 BOP of USD 2.3 billion, down 9% compared with prior
Understanding RISK Creating VALUE
 Understanding RISK Creating VALUE Allianz Reinsurance Facts & Figures March 2018 Copyright Allianz CONTENT 01 ALLIANZ GROUP 05 OUR SOLUTIONS & SERVICES 02 OUR COMPANY 06 OUR GLOBAL PRESENCE 03 OUR FINANCIAL
Quarterly and first nine months Earnings Release
 Quarterly and first nine months Earnings Release Allianz achieves an operating profit of 3 billion euros in the third quarter of 2018 Internal revenue growth of 9.8 percent in 3Q 2018 3Q 2018 net income
Annual Review. Allianz Risk Transfer
 Annual Review Allianz Risk Transfer Financial Results 2013 1 2 Financial Information Allianz Risk Transfer Group Headquartered in Zurich, Allianz Risk Transfer Group (ART Group) operates through affiliated
DEBT COLLECTION THE 2018 GLOBAL RANKING. February The Worst and Best Places in the World to Collect Your Debts.
 DEBT COLLECTION Photo by Joshua Ness on Unsplash February 2018 THE 2018 GLOBAL RANKING The Worst and Best Places in the World to Collect Your Debts 04 Overview by Country and Region 07 Overview by Source
Moving forward. Michael Diekmann Chief Executive Officer. BoA Merrill Lynch Banking and Insurance CEO Conference London, September 2013
 Moving forward Michael Diekmann Chief Executive Officer BoA Merrill Lynch Banking and Insurance CEO Conference London, September 2013 Agenda 1 Allianz at a glance 2 Key topics 2.1 Interest rates 2.2 Capital
Operating and financial review (unaudited) 2017
 2017") Operating and financial review (unaudited) 207 Results for the year ended December 3, 207 2 Operating and financial review The operating and financial review is the management analysis of the business
Operating and financial review (unaudited) 207 Results for the year ended December 3, 207 2 Operating and financial review The operating and financial review is the management analysis of the business
PAYMENT BEHAVIOR. Payment delays up 2 days globally: Don t lower your guard too early! May Economic Research. 04 Overview by Country and Region
 Source: Pexels Economic Research PAYMENT BEHAVIOR May 2018 Payment delays up 2 days globally: Don t lower your guard too early! 04 Overview by Country and Region 06 Overview by Sector Global DSO (number
Zurich s top-line for the first three quarters shows good growth
 News Release November 9, 2017 Zurich s top-line for the first three quarters shows good growth Property & Casualty (P&C) gross written premiums up 1% on a like-for-like basis, with improved new business
ALLIANZ REAL ESTATE REAL ESTATE INVESTMENTS FROM A GLOBAL INVESTOR S PERSPECTIVE
 ALLIANZ REAL ESTATE REAL ESTATE INVESTMENTS FROM A GLOBAL INVESTOR S PERSPECTIVE Investors Forum 2018 Alexander Gebauer CEO Western Europe Brussels, January 18 th 2018 Vertigo, Luxembourg AGENDA 01 at
European Investing Summit 2015 Euler Hermes (ENXTPA:ELE) Robert Leitz, iolite Partners
 Robert Leitz, iolite Partners") European Investing Summit 2015 Euler Hermes (ENXTPA:ELE) Robert Leitz, iolite Partners www.iolitepartners.com TRADE IDEA: LONG EQUITY EULER HERMES AT EUR 85/SHARE HQ at La Defense, Paris, France A key
European Investing Summit 2015 Euler Hermes (ENXTPA:ELE) Robert Leitz, iolite Partners www.iolitepartners.com TRADE IDEA: LONG EQUITY EULER HERMES AT EUR 85/SHARE HQ at La Defense, Paris, France A key
Allianz delivers as promised
 Investor Relations Release Munich, February 15, 2019 oliver.schmidt@allianz.com +49 89 3800 3963 reinhard.lahusen@allianz.com +49 89 3800 17224 christian.lamprecht@allianz.com +49 89 3800 3892 frank.stoffel@allianz.com
Preliminary FY 2012 Results MTU Aero Engines Conference Call with Investors and Analysts February 19, 2013
 Preliminary FY 2012 Results MTU Aero Engines Conference Call with Investors and Analysts February 19, 2013 Agenda Business Highlights Financial Highlights Segment Reporting Group Key Figures Guidance Appendix
IMPROVEMENT CONFIRMED 2010 OBJECTIVES CONFIRMED.
 2010 HALF YEAR RESULTS PRESS RELEASE Paris, August 6, 2010 IMPROVEMENT CONFIRMED PROGRESSION OF RESULTS MARGIN IMPROVEMENT STRONG CASH FLOW GENERATION 2010 OBJECTIVES CONFIRMED RETURN OF REVENUE GROWTH
9M08 Activity Indicators: Total Revenues down 0.9% 1 to Euro 69,458 million.
 PRESS RELEASE 9M08 Activity Indicators: Total Revenues down 0.9% 1 to Euro 69,458 million. November 6, 2008 Life & Savings Property & Casualty Positive net inflows of +7.8 billion New Business Volume (APE)
CONTENTS. Coface Notes to the interim consolidated financial statements Board of Directors November 2, 2015
 Unaudited interim consolidated financial statements (free translation) Nine months ending September 30 th, 2015 CONTENTS CONSOLIDATED FINANCIAL STATEMENTS... 3 Consolidated balance sheet... 3 Consolidated
2016 Annual Results. SCOR records net income of EUR 603 million, increases its dividend to EUR 1.65 and envisages share buy-backs
 2016 Annual Results SCOR records net income of EUR 603 million, increases its dividend to EUR 1.65 and envisages share buy-backs In 2016, SCOR delivers a strong set of results and continues to successfully
PRESS RELEASE FIRST HALF 2004 RESULTS: UNDERLYING EARNINGS: UP 32% TO EURO 1.4 BILLION (37% AT CONSTANT EXCHANGE RATES 1 )
") PRESS RELEASE August 6, 2004 FIRST HALF 2004 RESULTS: UNDERLYING EARNINGS: UP 32% TO EURO 1.4 BILLION (37% AT CONSTANT EXCHANGE RATES 1 ) LIFE NEW BUSINESS CONTRIBUTION UP 15% TO EURO 368 MILLION (21%
PRESS RELEASE August 6, 2004 FIRST HALF 2004 RESULTS: UNDERLYING EARNINGS: UP 32% TO EURO 1.4 BILLION (37% AT CONSTANT EXCHANGE RATES 1 ) LIFE NEW BUSINESS CONTRIBUTION UP 15% TO EURO 368 MILLION (21%
Rising dividend after good result Preliminary financial statements as at 31 December 2014
 Rising dividend after good result 5 February 205 Jörg Schneider Munich Re (Group) Financial highlights Q4 204 Good annual profit of 3.2bn Dividend increasing to 7.75 per share Munich Re (Group) Q4 204
REXEL. Q3 & 9-month 2009 results. November 12, 2009
 REXEL Q3 & 9-month 2009 results November 12, 2009 Q3 2009 & 9-month results Q3 and 9-month 2009 at a glance Financial review Outlook 3 Q3 & 9-month 2009 at a glance Q3 & 9-month 2009 highlights: Quarter-on-quarter
Sustainable Development at Allianz. Nomura European SRI Conference Paris, 23rd May 2013
 Sustainable Development at Allianz Nomura European SRI Conference Paris, 23rd May 2013 1 1 About Allianz 2 Sustainability strategy and management 3 Sustainability performance 4 Further information 2 About
Conference Call on Interim Report 3/2017
 Conference Call on Interim Report 3/2017 Hannover, 8 November 2017 Q3 losses absorbed within quarterly earnings Positive Q3 result supported by sale of listed equities Group Gross written premium: EUR
PRESS RELEASE AXA CONSOLIDATED REVENUES UP 4.6% ON A COMPARABLE BASIS TO EURO 74.7 BILLION FOR THE FULL YEAR 2002
 PRESS RELEASE February 5, 2003 AXA CONSOLIDATED REVENUES UP 4.6% ON A COMPARABLE BASIS TO EURO 74.7 BILLION FOR THE FULL YEAR 2002 Life & Savings revenues increased by 5.5% to Euro 48.6 billion, boosted
Q Results - MTU Aero Engines. Conference Call with Investors and Analysts, 23 October 2013
 Q3 2013 Results - MTU Aero Engines Conference Call with Investors and Analysts, 23 October 2013 Agenda Business Highlights Financial Highlights Segment Reporting Group Key Figures Guidance Appendix 2 Business
Q Results. The Hague November 13, 2014
 Q3 2014 Results The Hague November 13, 2014 Alex Wynaendts CEO Darryl Button CFO Q3 performance impacted by exceptional charges Underlying earnings and return on equity lower due to assumption changes
Preliminary financial statements as at 31 December 2016
 plainpicture/fstop/ralf Hiemisch 7 February 2017 Jörg Schneider Munich Re (Group) Financial highlights 2016 2016 net result of 2.6bn meets annual guidance Increased dividend of 8.60 per share 1 Munich
An Insurance Perspective of Opportunities in Risk
 Allianz Global Corporate & Specialty An Insurance Perspective of Opportunities in Risk Paul O Neill Oslo / September 2013 The Structure of a Global Composite Insurers MidCorp Allianz Worldwide Partners
Economic Update February 2014
 Allianz SE Economic Research https://www.allianz.com/economic-research/en Economic Update February 2014 Claudia Broyer Phone +49.69.24431-3667 claudia.broyer@allianz.com Ann-Katrin Petersen Phone +49.69.24431-3790
SCOR demonstrates its shock-absorbing capacity
 Third Quarter and First Nine Months Results SCOR demonstrates its shock-absorbing capacity Key highlights The third quarter of is marked by an exceptional series of large natural catastrophes, with hurricanes
Zurich reports business operating profit of USD 4.6 billion for 2014 and proposes dividend of CHF 17
 News Release February 12, 2015 Zurich reports business operating profit of USD 4.6 billion for 2014 and proposes dividend of CHF 17 BOP of USD 4.6 billion, down 1% compared with prior year NIAS of USD
Conference Call on Q1/2018 results
 Conference Call on Q1/2018 results Hannover, 7 May 2018 Favourable start to 2018 EBIT increase of +8.5% outperforms NPE growth GWP 4,547 in m. NPE in m. EBIT in m. Group net income in m. 5,345 +17.6% 3,738
H Results MTU Aero Engines Conference Call with Investors and Analysts August 1, 2011
 H1 2011 Results MTU Aero Engines Conference Call with Investors and Analysts August 1, 2011 Agenda Business Highlights Financial Highlights Segment Reporting Group Key Figures Guidance Appendix 1 Aug 2011