ANNUAL REP OR T. Autorité de Contrôle Prudentiel. The French banking and insurance market in figures
|
|
|
- Egbert Reed
- 6 years ago
- Views:
Transcription
1 ANNUAL REP OR T Autorité de Contrôle Prudentiel The French banking and insurance market in figures 2009
2 The French banking and insurance market in figures 2009 The Autorité de contrôle prudentiel (ACP) is an independent administrative authority backed by the Banque de France. Established by executive order on 21 January 2010, it was formed from the merger of the licensing authorities (CECEI, CEA) and supervisory authorities responsible for the banking and insurance sectors (Commission Bancaire, ACAM). The ACP is responsible for authorising and overseeing banks and insurers. It has a statutory remit to maintain the stability of the financial system and protect the customers, policyholders and beneficiaries of the entities under its supervision.
3 Contents Banking sector 1. Population Population of credit institutions and investment firms French banking in 2009: an open sector Widespread use of the European passport Banking system profitability and risks in Strong earnings growth Enhanced solvency and capital Risks kept in check Refocusing on customers The major groups balance sheets show a reduction in trading books Structure of the French banking system Business activity...23 Annexes
4 Population INSURANCE sector 1. Population Financial data Balance sheet Analysis by type of insurer Prudential ratios Origin of unrealised gains and losses results New subscriptions Annexes


5 Banking sector 1. Population 1.1 Population of credit institutions and investment firms France s banking and financial system continued to consolidate and adjust in as a result, the population of credit institutions shrank still further, from 722 at the end of 2008 to 706 at the end of The bulk of the decline was accounted for by banks (8 fewer institutions), mutual and cooperative banks (3 fewer) and financial companies (4 fewer). The number of investment firms supervised by the CECEI contracted by 4 to 151. and the number of credit institutions authorised to do business in Monaco decreased by three to 26. Credit institutions and investment firms in France and credit institutions in Monaco: (a) Data provided by the Autorité des marchés financiers. 4


6 Population 1.2 French banking in 2009: an open sector diversified ownership The French banking and financial system is very open. At the end of 2009, 70% or 492 of the 706 credit institutions doing business in France were under French ownership, and 30%, or 214, were foreign owned. Of this total, 74% were owned by banking groups, including 38% by French mutual banking groups, and 26% were controlled by shareholders in other economic sectors, with 9% belonging to manufacturing, trade and service groups, 3% owned by insurance groups, 7% owned by other financial groups or a mix of shareholders, 4% were in the public sector and 3% had private individuals as their majority shareholders. Industrial and trade groups have always held a significant stake in France s population of credit institutions, which is not always the case in comparable countries such as Germany, Italy or the United States. By contrast, insurance groups hold a relatively small stake in banks in France. French-owned credit institutions by type of ownership at the end of 2009 (*) Municipal credit banks and specialised financial corporations. analysis of foreign-owned credit institutions by type of ownership and geographical origin at the end of

7 Banking sector Ownership of investment firms is more diversified and often open to private individuals, usually professionals. The owners are bound by a shareholders agreement. At the end of 2009, 23% of the 151 investment firms doing business in France were controlled by private individuals, 35% of the firms belonged to banking groups (with 10% belonging to French mutual banking groups), 7% were held by insurance groups, 26% belonged to other financial groups and 9% were owned by shareholders in industry, trade or other sectors. The French banking and financial system is also very open to international markets. This is evidenced in the large number of foreign-owned institutions in France and the presence of French-owned credit institutions in other countries Open to foreign capital France s banking and financial system is very open to foreign-owned institutions (1) At the end of 2009 a total of 214 foreign-controlled credit institutions were doing business in France. This breaks down into 147 banks, 66 financial companies and 1 specialised financial institution, along with 71 investment firms and 77 representative offices. Of the 214 foreign-controlled credit institutions, most were from the European Union. This was the case of 136 institutions, including 36 from the United Kingdom, 27 from Germany, 16 from Belgium, 13 from the Netherlands and 12 from Italy. The 78 credit institutions controlled by third-country owners are mainly from the Americas, with 33 of the 34 from the United States, including 11 banks, 21 financial companies and one specialised financial institution, and one Brazilian bank. Foreign presence in France s banking and financial system (1) This paragraph deals only with majority holdings in credit institutions doing business in France. 6

8 Population 1.3 Widespread use of the european passport access to the French market Briefing Freedom of establishment Freedom of establishment means that a market participant from a Member State of the European Economic Area is entitled to provide services in another Member State through a permanent establishment such as a branch. Freedom to provide services Freedom to provide services means that a market participant from a Member State is entitled to provide services in another Member State without having a permanent establishment there. Freedom of establishment Of a total of 168 branches of foreign credit institutions and investment firms in France, those belonging to UK parent companies form the largest contingent, with 60 business locations in This population increased sharply after the Markets in Financial Instruments Directive (MiFID) was implemented. MiFID gave investment firms incorporated in European Union countries the benefit of mutual recognition for a wider range of services and instruments, and, more particularly for instruments such as contracts for difference and commodities derivatives. The directive also allows firms to use tied agents. Many investment firms have sought to seize MiFID-driven opportunities. However, these branches are very often small, with fewer than 10 employees. The European passport is widely used to set up establishments in France, but it is also used by institutions from outside the European Economic Area (EEA). With just a single authorised entity in one of the EEA countries, these institutions can exercise their passport rights to do business in one or more other EEA countries. Of the total number of passported branches in France at 31 December 2009, 45 belonged to 43 groups owned by shareholders from outside the EEA. These branches accounted for 25% of the passported branches located in France. credit institutions or investment firms branches doing business in France 7

9 Banking sector Freedom to provide services Freedom to provide services is the other way of using the EEA passport to do business in another EEA country without having a permanent establishment there. The only metrics available for assessing this activity are the number and change in the number of institutions notifying their intention to exercise the freedom to provide services. As of 31 December 2009, 501 European credit institutions and 1,883 European investment firms were authorised to do business in France under the freedom to provide services (see table below). The number of institutions giving notice of their intention to do business in France increased by 5% over the year, compared with an increase of 23% in 2008, which was largely attributable to MiFID. Free provision of services in France 8

10 Population Passporting by French institutions Freedom of establishment French institutions use EEA passports primarily to open establishments in Germany, Italy, the United Kingdom, Spain and, to a lesser extent, Belgium. The number of French institutions branches opened in other EEA countries has increased steadily since However, in contrast to the inward trends (see above), the transposition of MiFID into French law on 1 November 2007 has yet to spur French investment firms to open large numbers of new branches or to expand their EEA passported business into the new areas covered by mutual recognition. branches opened by French credit institutions and investment firms in other eea countries Freedom to provide services As of 31 December 2009 a total of 1,144 notifications had been received from 152 French credit institutions and 573 notifications from 52 French investment firms wishing to do business in another EEA country. The main countries targeted by French credit institutions are Italy (97 notifications), the United Kingdom (91), Belgium (86), Germany (78), Spain (72); while French investment firms are targeting Belgium (48 notifications), the Netherlands (44), the United Kingdom (40), Germany (39) and Italy (37). 9


11 Banking sector Free provision of services in other European Economic Area countries 10
 French institutions reported a substantial improvement in results for 2009, with strong revenue")
 returned to the level of first half 2008, having plummeted 137% in second half 2008 in the wake of the Lehman")
12 Profitability Population and risks 2. Banking system profitability and risks in Strong earnings growth After being impacted by the financial crisis in 2008, the seven largest (2) French institutions reported a substantial improvement in results for 2009, with strong revenue growth offsetting higher risk-related costs. Intermediate operating totals Source: banks IFRS data Consolidated net income (3) returned to the level of first half 2008, having plummeted 137% in second half 2008 in the wake of the Lehman Brothers collapse and the deepening financial crisis. Earnings for 2009 as a whole nearly tripled, rising 187.5%, but were still lower than in Consolidated net income Source: banks (2) BNP Paribas, Société Générale, Crédit Agricole Group, Crédit Mutuel Group, BPCE Group, HSBC France and Dexia Crédit Local. (3) The net income attributable to the group (or group share) does not include income attributable to minority interests. 11


13 Banking sector income rises across all business lines Following slower growth in 2007 and a slump in 2008, net banking income (nbi) increased by 22.5% in The improvement was observed in all business lines. net banking income by business line Source: banks retail banking income grew strongly in However, this business line had remained profitable through the worst of the financial crisis, with net interest income proving the most resilient component of NBI, accounting for 60% in December 2009 and growing 39% over the year. Part of this strong performance was due to a fall in financing costs, stemming at first from support measures taken by the government, with EUR 111 billion in state-guaranteed financing from Société de financement de l économie française (SFEF), which stopped issuing securities in October 2009, and also from the monetary policy of the european central bank (ecb), which cut its minimum bid rate from 2% to 1%. Later on in the year, market financing terms improved as 3-month Euribor fell from 3.29% to 0.71%. cost of financing index * Jun 06 Oct 06 Feb 07 Jun 07 Oct 07 Feb 08 Jun 08 Oct 08 Feb 09 Jun 09 Oct 09 Feb 10 Jun 10 1-year issues 3-year issues 7-year issues 15-year issues Sources: Markit, Bloomberg calculations of the General Secretariat of the ACP *This index represents the cost of risk-free securities issues (swap rates against 3-month Euribor) plus a liquidity premium (iboxx Financial AA). It is a proxy for market financing difficulties.. 12


14 Profitability and risks After a difficult year in 2008, corporate and investment banking earnings recovered sharply in 2009, with a 142.3% rise. Banks benefited from sustained capital market activity as conditions returned to normal and risk aversion abated but risk-related costs are still high despite a 7.5% increase in operating expenses, a steep rise in net banking income drove gross operating income sharply higher than in previous years, offsetting the increase in risk-related costs. Risk-related costs rose by a further 32.8% in 2009, taking the total increase since 2007 to more than 300%. As economic conditions worsened, these higher costs affected all business lines, particularly retail banking. In corporate and investment banking, asset impairments and writedowns of exposures to subprime-related assets, especially structured products (notably collateralised debt obligations) and monoline insurer guarantees, continued to put a damper on earnings, though to a lesser extent than in Writedowns of cdo and monoline guarantees Sources: banks (four leading banking groups) banks need to maintain sufficient income to cope with loss rates that could remain high. risk-related costs by business line Source: banks 13
, which subscribed EUR 9.")

15 Banking sector 2.2 enhanced solvency and capital The leading banking groups substantially increased their total capital in 2009, which rose 15% during the year to eur 277 billion. The groups received injections of public capital through Société de prise de participation de l État (SPPE), which subscribed EUR 9.25 billion in deeply subordinated notes (TSS) and preferred stock in the first half of 2009, following a first wave of TSS issuance worth EUR 10.5 billion in December 2008 and the purchase of a EUR 1 billion equity stake in Dexia in September However, these measures played only a temporary role. The five French banking groups that received this support repaid sppe in full or in part in the second half of 2009 and replaced public capital with retained earnings or by issuing market instruments with equivalent or higher ratings. Total capital and its components The increase in total capital stems primarily from the increase in original own funds, which stand at more than eur 226 billion, reflecting an improvement in total own funds. By end 2009, the aggregate Tier One Ratio of major French banking groups had reached a historical high of more than 10%. Tier One ratio 14


16 Profitability and risks 2.3 risks kept in check capital requirements stabilise Other reasons for the improvement in solvency ratios are sound risk management and the levelling-off of capital requirements at eur 180 billion, down 2.8%. capital requirements Jun 08 Dec 08 Jun 09 Dec 09 Credit risk CR Market risk CR Operational risk CR Other CRs credit risk still accounted for the bulk of capital requirements at 82.7% of the total. The 5.4% increase in credit risk-weighted assets over the year stems primarily from the acquisition of Fortis by BNP Paribas in May Stripping out BNP Paribas, the increase is only 2%. credit risk-weighted assets Mar 08 Jun 08 Sep 08 Dec 08 Mar 09 Jun 09 Sep 09 Dec 09 Weighted corporate assets Weighted retail customer assets Other weighted assets capital requirements for market risk declined by 29% in absolute terms and shrank as a percentage of total capital requirements. 15

, attributable to two factors: lesser volatility in 2009 than in 2008; a policy of")

17 Banking sector capital requirements for market risk Jun 08 Dec 08 Jun 09 Dec 09 Market risk CR Share of total CR (righthand scale) Briefing Value at Risk (VaR) is the maximum potential loss that an institution could incur in the value of a portfolio of financial assets in the event of adverse developments under normal market conditions, with regard to a given holding period and confidence interval. The lower capital requirements are due to a reduction in Value at Risk (VAR), attributable to two factors: lesser volatility in 2009 than in 2008; a policy of disengaging from the riskiest transactions, which was reflected to varying degrees, e.g. total discontinuation of some activities, lower limits or, at the very least, offsetting between transactions. 1-day Var Sep 07 Dec 07 Mar 08 Jun 08 Sep 08 Dec 08 Mar 09 Jun 09 Sep 09 Dec 09 Mar 10 Credit Forex and other Average quarterly VaR Interest rates Commodities Commodities Clearing Source: banks (BNP Paribas and Société Générale) 16
 2.3.")
18 Profitability and risks The overall decline in capital requirements was attenuated by the increase in requirements for operational risk, which rose by 15% between december 2008 and december capital requirements for operational risk Jun 08 Dec 08 Jun 09 Dec 09 Operational risk CR Share of total CR (righthand scale) Liquidity pressures ease Briefing The Overnight Indexed Swap rate (OIS) is the overnight financing rate on the interbank market, whereas 3-month Euribor is the rate for uncollateralised financing up to three months. The differential between the two rates is commonly used to show a loss of confidence on the interbank market. successive moves to loosen monetary policy since fourth quarter 2008 and easing pressures on the money market brought short-term financing rates down to low levels at the end of short-term rates (Overnight indexed swap rate and 3-month euribor) Jun 07 Sep 07 Dec 07 Mar 08 Jun 08 Sep 08 Dec 08 Mar 09 Jun 09 Sep. 09 Dec 09 Mar 10 Jun 10 Overnight Indexed Swap rate EURIBOR 3M Source: Bloomberg 17
 reached all-time highs in first quarter 2009. These premiums fell sharply in second half 2009, but remained high nonetheless.")
19 Banking sector More broadly, the government s support measures vented the strong pressures observed at the start of the year. As a result, the premiums on French banks credit default swaps (CDS) reached all-time highs in first quarter These premiums fell sharply in second half 2009, but remained high nonetheless. The increase seen at the start of 2010 underscores the need to remain vigilant. cds premiums senior debt, 5-year contracts Basis point Jun 07 Dec 07 Jun 08 Dec 08 Jun 09 Dec 09 Jun 10 BNP PARIBAS CREDIT AGRICOLE SA ITRAXX Financier SOCIETE GENERALE NATIXIS Source: Bloomberg diminishing loan book quality gross non-performing loans grew rapidly, both in comparison to gross lending and in absolute terms. They peaked at EUR 77.5 billion for customer loans at the end of 2009 and EUR 90 billion for all non-performing assets. As a share of all assets, they reached a level close to that at end gross non-performing loans as a percent of gross lending Aggregated parent-company data Dec 02 Dec 03 Dec 04 Dec 05 Dec 06 Dec 07 Dec 08 Dec 09 All loans Metropolitan France only Others countries 18


20 Profitability and risks The share of loans in default has risen substantially since the second quarter of 2009 retail customers are still the most vulnerable to default: loans in default as a proportion of sound assets in the previous period stood at 4.9% at the end of December, an increase of 1.3 percentage points over one year. but the sharpest drop in loan quality was seen in business loans, with a doubling of the default rate between March and September, followed by a further rise in the fourth quarter. default rates of the main loan books Seven leading banking groups Sep 08 Dec 08 Mar 09 Jun 09 Sep 09 Dec 09 Corporate customer default rate Retail customer default rate Aggregate default rate (as a proportion of sound loans in the previous period) The ratios of provisions to non-performing customer loans in 2009 continued to decrease, as they did in In view of the risk-mitigation measures taken for some of these loans, such as collateralisation, these ratios are generally not very high. Even so, they are now at their lowest level in a decade at around 50%. ratio of provisions to non-performing customer loans Aggregated parent-company data Dec 02 Dec 03 Dec 04 Dec 05 Dec 06 Dec 07 Dec 08 Dec 09 Gross non-performing customer loans Provisioning rate 19

21 Banking sector 3. refocusing on customers 3.1 The major groups balance sheets show a reduction in trading books aggregated consolidated balance sheet of the seven leading banking groups The leading groups consolidated balance sheets were affected by changes in consolidation structure over the year, with the acquisition of Fortis by BNP Paribas and the merger of the Banques Populaires and Caisses d Epargne groups. Total assets were down nearly 6% in This decline is due primarily to the 30% fall in assets and liabilities held for trading, echoing the trend observed at international level. banks also shifted their focus back to customer business. Transactions with customers now account for 47% of total assets, while assets held for trading represent slightly less than one third. Amounts owed to customers increased to one third of total liabilities, while liabilities held for trading shrank to a quarter of the total. 20

22 refocusing on customers 3.2 structure of the French banking system Briefing The analysis in the previous section consolidates the earnings and activity of a sample of the seven leading banking groups, in both accounting and prudential terms. It therefore includes all transactions, including those carried out by subsidiaries in other countries. The following analysis looks at aggregated parent company data, which provide more detailed information about all credit institutions and investment firms. The discrepancies between these two complementary views stem from differences in consolidation structure, consolidation methods and accounting standards. assets Aggregated parent-company data Dec 02 Dec 03 Dec 04 Dec 05 Dec 06 Dec 07 Dec 08 Dec 09 Cash transactions Securities transactions Loans to credit institutions Fixed assets Customer loans Miscellaneous French institutions maintained their customer business as they reduced their securities portfolios. Outstanding loans remained stable on the assets side of the balance sheet, but customer deposits posted substantial growth of 6%. customer deposits provided a sound financing base for French banks in difficult market conditions. 21


23 Banking sector Liabilities Aggregated parent-company data Dec 02 Dec 03 Dec 04 Dec 05 Dec 06 Dec 07 Dec 08 Dec 09 Central bank and post office Funds owed to customers Provisions, equity and retained earnings Borrowing from credit institutions Securities transactions Miscellaneous On the assets side, after some securities were reclassified in 2008 and switched from the trading book to the banking book, the trading book stagnated, as did the other books. credit institutions securities portfolios Aggregated parent-company data Dec 02 Dec 03 Dec 04 Dec 05 Dec 06 Dec 07 Dec 08 Dec 09 Dec 07 Dec 08 Mar 09 Jun 09 Sep 09 Dec 09 22


24 refocusing on customers 3.3 business activity Outstanding loans stable Outstanding customer loans in metropolitan France were stable overall, with an increase of 0.2%. but this figure conceals contrasting developments in different types of lending. The increases of 16.6% in export credits, 5.1% in equipment loans and 3.7% in housing loans offset the decline in other types of lending. The growth of housing loans was slower than in previous years, despite low lending rates. Financing for the economy provided by the French banking system Metropolitan activity Dec 07 Mar 08 Jun 08 Sep 08 Dec 08 Mar 09 Jun 09 Sep 09 Dec 09 Total financing Non-residents (righthandscale) Financing for the economy by loan type Dec 07 Dec 08 Dec 09 23


25 Banking sector Financing for the economy by category of agent Dec 07 Dec 08 Dec deposits In addition to the 47.6% growth in lending to financial customers, the strong 6.1% increase in customer deposits is noteworthy and stems from a 12.6% rise in passbook savings deposits. customer deposits Aggregated parent-company data Dec 07 Dec 08 Dec 09 The strongest growth in passbook savings deposits was on Livret a accounts, which increased 74%. This growth was driven by deregulation of Livret A distribution as well as the attractive 4% interest rate being paid at the start of But as the interest rate declined over the year to reach 1.25% for the period from August to December 2009, deposits shrank slightly in the second quarter of however, total deposits were still much higher than at the end of 2008, as savers preferred passbook accounts as a means of building up precautionary savings. 24


26 refocusing on customers savings accounts subject to special rules Aggregated parent-company data, metropolitan France only People s savings schemes/plans Other ordinary passbook accounts A, Blue and sustainable development passbooks Home savings schemes/plans Dec 07 Dec 08 Dec 09 debts evidenced by a certificate Aggregated parent-company data debt evidenced by a certificate remained unchanged from 2008, as institutions managed to renew some of their deposits despite a difficult economic environment. Dec 07 Dec 08 Dec 09 interbank transactions Aggregated parent-company data Dec 07 Dec 08 Mar 09 Jun 09 Sep 09 Dec 09 Advances Repos with delivery of the securities Repos without delivery of the securities Repos without delivery of the securities Advances Repos with delivery of the securities 25
 32 annex 8")
27 Banking sector annexes annex 1 Business data 27 annex 2 Earnings data 27 annex 3 Summary of the main ratios relating to business and earnings 27 annex 4 Aggregate financial position of credit institutions 28 annex 5 Off-balance sheet commitments of credit institutions 30 annex 6 Change in aggregate financial position 31 annex 7 Financing for the economy (at 31 December 2009) 32 annex 8 Funds owed to customers 33 annex 9 Overall non-performing loan cover ratio 34 annex 10 Aggregate income statement of credit institutions 35 annex 11 Intermediate operating totals 36 annex 12 Cost-to-income ratio 36 annex 13 Provisions compared to gross operating income 37 annex 14 Average costs and returns 37 annex 15 Aggregate financial situation of investment firms 38 annex 16 Aggregate income statement of investment firms 40 26


28 annexes annex 1 business data annex 2 earnings data annex 3 summary of the main ratios relating to business and earnings* * The data are for metropolitan France only. All ratios, except cost-to-income are calculated on the basis of average capital 27

29 Banking sector annex 4 Total assets, all credit institutions 28

30 Annexes 29

31 Banking sector annex 5 Off-balance sheet commitments of credit institutions 30

32 annexes annex 6 change in total assets Dec 02 Dec 03 Dec 04 Dec 05 Dec 06 Dec 07 Dec 08 Dec 09 Metropolitan France only All branches 31
* * The data are for metropolitan France")
33 Banking sector annex 7 Lending to the economy (at 31 december 2009)* * The data are for metropolitan France only. 32

34 annexes annex 8 Funds owed to customers* * The data are for metropolitan France only. 33


35 Banking sector annex 9 Overall non-performing loan cover ratio * Dec 02 Dec 03 Dec 04 Dec 05 Dec 06 Dec 07 Dec 08 Dec 09 Gross non-performing loans Overall cover ratio * The overall cover ratio includes specific provisions and general provisions. 34
 Including allocations to provisions for impairment of securities held for sale and portfolio securities (5) Including interest on non-performing loans")
36 annexes annex 10 aggregate income statement of credit institutions (1) Final figures (2) Estimated figures (3) Excluding interest on non-performing loans (4) Including allocations to provisions for impairment of securities held for sale and portfolio securities (5) Including interest on non-performing loans 35

37 Banking sector annex 11 intermediate operating totals annex 12 cost-to-income ratio 36


38 Annexes Annex 13 Provisions compared to gross operating income Net allocations to provisions for risk and liabilities Net allocations to provision for loans losses Risk-related costs as a percentage of gross operating income (righthand scale) Annex 14 Average costs and returns* * The data are for metropolitan France only. 37


39 Banking sector Annex 15 Total assets, all investment firms 38

40 annexes 39


41 Banking sector Annex 16 Aggregate income statement of investment firms 40
 Including interest on non-performing")
42 annexes (1) Excluding interest on non-performing loans (2) Including interest on non-performing loans 41
43 Insurance sector 42
44 Les données financières C O N T E N T S 1. Population Financial data Balance sheet Analysis by type of insurer Prudential ratios Origin of unrealised gains and losses results New subscriptions Annexes


45 InSurance Sector Scope of the study The figures presented in this section are taken from data that insurance entities under the prudential supervision of the Autorité de contrôle prudentiel (ACP) are required to file annually. The study does not include the activity of European insurance companies that have been conducting business in France since 1995 under the freedom of establishment or the freedom to provide services. These companies are subject to the supervisory authorities of their home countries under the European passport. However, such companies account for less than 2% of the activity in France. 1. Population Concentration in the insurance market, which started in the mid-1990s, continued in The total number of authorised insurance entities fell from 1,420 in 2008 to 1,313 in The decline in numbers primarily concerned mutual insurers governed by the Mutual Insurance Code. Insurance entities Briefing Insurance business is regulated by a set of European directives. Insurance entities in France are subject to three separate sets of regulations: the Insurance Code, the Mutual Insurance Code and the Social Security Code. The three codes are similar with regard to prudential regulations; and a single supervisory authority, ACP, is responsible for enforcing their provisions. In 2009 some one hundred insurance entities, most of them mutual insurers, disappeared as a result of the concentration underway in the sector in recent years. This movement stems mainly from keen competition between insurers and the increasing complexity of supplementary health insurance, which has prompted many insurers to adjust their strategies and seek critical mass for their long-term development. Insurance entities 44
46 Financial data 2. Financial data 2.1 Balance sheet At the end of 2009 the aggregate total assets of all insurance and re-insurance entities under ACP supervision stood at EUR 1,822 billion at book value, corresponding to EUR 1901 billion in assets at market value, including unrealised gains (4) aggregate summary balance sheet in EUR billion 2008 aggregate summary balance sheet in EUR billion The total assets of the insurance sector, at book value, continued to grow in 2009 compared with the previous year, with a 7% increase to EUR 119 billion. The general trend conceals contrasting developments in different balance sheet components. Unit-linked contracts, where the policyholder bears the risk of a loss of asset value, were up by 14%. (4) Not counting the provision for liquidity risks of 9 billion euros in

47 InSurance Sector Briefing The provisions item in the insurance sector represents insurers commitments to policyholders. It provides an assessment of the future cost of the claims and benefits to be paid to policyholders. For the purposes of analysis, the balance sheet is often expressed as a percentage of this estimated item, as shown below. Summary balance sheet as a percentage of 2009 provisions Summary balance sheet as a percentage of 2008 provisions The structure of the balance sheet, expressed as a proportion of the provisions expressed in euros, shows no significant change from the previous year. 2.2 Analysis by type of insurer Briefing A single set of European Insurance Directives governs the insurance entities under ACP supervision, but these entities have different business profiles that stem from their history and legal structure, as well as from different insurance specialisations. 46

48 Financial data Analysis by category of insurers shares of the main balance sheet components (31 December 2009) Because of the nature of their business, life and composite insurers write most of their contracts with a view to accumulating savings in euros or in units of account. Consequently, they hold a large share of the assets in the sector. At the end of 2009, these contracts recorded unrealised gains and made a positive contribution to the differential between the book value and the market value of the assets. However, life insurers share of the sector s equity is 40.8%, smaller than their share of total assets, which stands at 80.3%, as life insurance business requires less capital than other, riskier, business lines. Provident institutions operating in the field of employee insurance schemes offer both long-term coverage, such as retirement, disability and incapacity benefits, which are capital consuming, and short-term coverage, such as group health insurance. Many of the mutual insurers governed by the Mutual Insurance Code offer individual health coverage. Rapid settlement of claims means that they are not required to hold substantial investments. By contrast, some mutual insurers specialising in life insurance hold large volumes of assets. Under the specialisation principle, non-life insurers do not cover risks linked to human lifespan; they cover only personal risks, such as incapacity, disability and health. Furthermore, non-life insurers are the only insurers authorised to cover third-party liability and most property and casualty risks. Consequently, they have large amounts of equity. Re-insurers, on the other hand, are allowed to accept all types of risks from insurers. Their balance sheets therefore combine the whole spectrum of risks covered by the insurance sector. 2.3 Prudential ratios At the end of 2009 the average coverage ratio for regulatory requirements in the insurance sector as a whole was between 103% and 125% depending on the category of insurers. Overall, insurers assets exceeded the regulatory requirements. Cover ratio for regulated commitments (%) Compared to 2008 the coverage of commitments to policyholders declined slightly for all insurance companies, but still exceeded the regulatory requirements. On the other hand, mutual insurers coverage increased sharply. For provident institutions, the ratio was unchanged from the previous year. 47

49 InSurance Sector At the end of 2009 the solvency margin requirement was covered 129% for life insurers and 522% for provident institutions, excluding unrealised gains. It should be noted, however, that some of the components of the coverage ratio are prone to major volatility, hence the need to maintain a safety margin. Balance sheet margin cover ratio, without and with unrealised gains (%) Compared with 2008 the coverage of margin requirements by balance sheet assets increased in every area. This increase was even more marked for the ratio that includes unrealised gains. The improvement of this ratio reflects the rebuilding of unrealised gains at the end of 2009 (5). 2.4 Origin of unrealised gains and losses Unrealised gains and losses on different asset classes in 2009 Insurance sector total (5) Coverage of commitments and coverage of the solvency margin move in opposite directions because of the varying influence of their components, e.g. changes in asset values from one year to the next with the valuation of each instrument and as a result of portfolio reallocation, increase in commitments to policyholders, impact of the end of the earnings smoothing measures in
50 Financial data Briefing Unrealised gains are the difference between the book value of investments and their market value. At the end of 2009 the insurance sector s situation had improved sharply from an unrealised loss of EUR 21 billion to an unrealised gain of nearly EUR 68 billion. On the whole, unrealised gains on government securities and property investments held steady during At the end of the first half most exposures to listed equities and corporate bonds showed unrealised losses. The biggest improvement was a EUR 42 billion year-on-year increase in non-sovereign debt securities, equities and collective investment schemes. Overall, 2009 saw a substantial rebound in unrealised gains on bonds, which returned to pre-crisis levels results After declining in 2008, turnover in the insurance sector rose 8% in Most of this increase stems from life insurance business, which was up 13% and matched the level of activity seen in Briefing Underwriting income and net income: to make certain that insurers financial statements are comparable, insurance accounting regulations call for underwriting income to be reported separately. This means that equity investments, non-recurring income and expenses and income tax charges have an impact on net income only. Furthermore, the regulations break down underwriting income into two components: life and non-life. In 2009 life underwriting income increased by 74% compared with 2008 to stand at EUR 4.7 billion, while non-life underwriting income declined 46% to EUR 3.1 billion. After counting capitalised investment income, non-recurring items and tax expenses recorded in the non-underwriting income statement, net income for the sector stood at EUR 8.2 billion in 2009, compared with EUR 11.8 billion in One of the reasons for the trend in non-life insurance was an increase in claims. Benefits paid and investment income under life insurance contracts returned to levels near those observed in Comparisons with 2008 data are harder to make because of the financial crisis and its impact (6). (6) In 2008, the recognition of assets held for unit-linked contracts at market value disrupted the analysis of changes in investment income. The investment risk that policyholders bear in such transactions was recognised as a decrease in benefits and a simultaneous decrease in investment income. 49

51 InSurance Sector The margin rate for the sector as a whole, i.e. net income as a percentage of premiums, narrowed from 4.8% in 2008 to 3.1% in summary income statement in EUR billion * benefits and claims paid, excluding adjustments for unit-linked life insurance: EUR 188 billion ** of which adjustments for unit-linked life insurance investment income: EUR 45.9 billion 2008 summary income statement in EUR billion 50


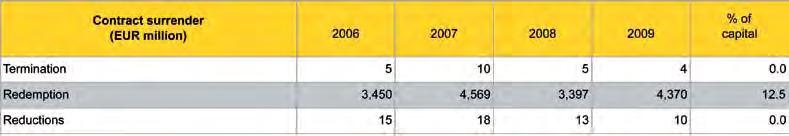
52 Financial data 2.6 New subscriptions An analysis by category shows a slight fall in new subscriptions to unit-linked contracts in They declined by 10% from 2008 to stand at EUR 18 billion. In the past, sales of this type of contract have always been heavily dependent on stock market index performances. New subscriptions to unit-linked contracts and CAC 40 index Redemptions of life insurance contracts started to increase towards the end of 2008 in the wake of events such as the Lehman Brothers bankruptcy and the Madoff affair, as well as a sharp fall in stock prices. This spurred the supervisor to pay closer attention to outflows from life insurance. Ultimately the redemptions were quite limited, given the poor economic and financial context, and were reflected in a decline in actuarial reserves for unit-linked contracts. The pattern did not continue in 2009, and average redemptions in 2009 returned to the levels seen in 2007 and previous years. Actuarial reserves for life insurance contracts UC euros 51
 57 Annex 6 Motor insurance 58 Annex 7 Property")
53 InSurance Sector annexes Insurance sector results by business category Annex 1 Life and capital redemption insurance 53 Annex 2 Euro or foreign currency individual and group insurance contracts 54 Annex 3 Whole life and term life group insurance 55 Annex 4 Unit-linked life insurance 56 Annex 5 Occupational retirement insurance (class 26 and PERP) 57 Annex 6 Motor insurance 58 Annex 7 Property insurance 59 Annex 8 General liability insurance 60 Annex 9 Natural disaster insurance 61 Annex 10 Other insurance 62 Annex 11 Transport insurance 63 Annex 12 Construction insurance 64 Annex 13 Credit insurance and surety bonding 65 52


54 annexes Annex 1 Life and capital redemption insurance 53


55 InSurance Sector Annex 2 Euro or foreign currency individual and group insurance contracts 54


56 annexes Annex 3 Whole life and term life group insurance 55

57 InSurance Sector Annex 4 Unit-linked life insurance In addition to a 40% decline in new premiums, unit-linked life insurance suffered from transfers of more than EUR 7 billion to other categories of insurance contracts, as reflected in the figures for individual life insurance. 56


58 annexes Annex 5 Occupational retirement insurance (class 26 and PERP) 57


59 InSurance Sector Annex 6 Motor insurance Simplified income statement Change in claims ratio (claims/premiums, including claims processing expense) 58


60 annexes Annex 7 Property insurance Simplified income statement Change in claims ratio (claims/premiums, including claims processing expense) 59


61 InSurance Sector Annex 8 General liability insurance Simplified income statement Change in claims ratio (claims/premiums, including claims processing expense) 60

62 annexes Annex 9 Natural disaster insurance Simplified income statement 61


63 InSurance Sector Annex 10 Other insurance Other insurance includes assistance, legal expenses and sundry financial losses. Simplified income statements Change in claims ratio (claims/premiums, including claims processing expense) 62

64 annexes Annex 11 Transport insurance Simplified income statement 63


65 InSurance Sector Annex 12 Construction insurance Simplified income statement 64

66 annexes Annex 13 Credit insurance and surety bonding Simplified income statement 65
67
68 Editor: Danièle NOUY, General Secretary of the Autorité de contrôle prudentiel Design and production: Service communication de l ACP
69 61, rue Taitbout Paris Phone: + 33 (0) Fax: + 33 (0) ISSN en cours
ANNUAL REPORT 2008 THE FRENCH INSURANCE MARKET IN FIGURES
 ANNUAL REPORT 2008 THE FRENCH INSURANCE MARKET IN FIGURES C O N T E N T S Introduction 2 Financial data 4 1. Population 4 2. The insurance market in 2008 5 2.1. Balance sheet 5 2.2. Analysis by type of
French banks lending to the professional real estate sector in the second half of 2015
 French banks lending to the professional real estate sector in the second half of 2015 n 68 July 2016 1 Table of contents 1. COMMERCIAL REAL ESTATE MARKETS IN 2015 5 1.1. The European commercial real estate
EUR 7,709 billion EUR 460 billion EUR 2,823 billion 14.4% EUR billion EUR billion EUR billion non-performing
 sector, insurance undertakings investments amounted to EUR 2,659 billion at 31 December 2017. These were principally composed of bonds (51%), of which 29% were corporate bonds. At 31 December 2017, the
PRESS RELEASE. Results of the EU-wide stress test French banks among the strongest in Europe
 July 23, 2010 The Committee of European Banking Supervisors (CEBS), in conjunction with national supervisory authorities, has just completed a stress test exercise designed to assess the financial strength
French banks financing of property market professionals in 2013
 French banks financing of property market professionals in 2013 No. 34 September 2014 1 CONTENTS 1. TRENDS IN PROFESSIONAL PROPERTY MARKETS IN 2013 5 1.1. The French commercial property market 5 1.1.1.
Summary of Government Interventions in Financial Markets France
 Summary of Government Interventions in Financial Markets France Overview In addition to the steps undertaken by the ECB, the French government has provided the following main types of support to the French
Council of the European Union Brussels, 12 April 2018 (OR. en) Mr Vladislav GORANOV, Minister of Finance of Bulgaria
 Mr Vladislav GORANOV, Minister of Finance of Bulgaria") Council of the European Union Brussels, 12 April 2018 (OR. en) 7885/18 EF 105 ECOFIN 313 COVER NOTE From: date of receipt: 11 April 2018 To: No. Cion doc.: Subject: Mr Olivier GUERST, Director General
Council of the European Union Brussels, 12 April 2018 (OR. en) 7885/18 EF 105 ECOFIN 313 COVER NOTE From: date of receipt: 11 April 2018 To: No. Cion doc.: Subject: Mr Olivier GUERST, Director General
RESULTS AT SEPTEMBER 30, 2008
 Paris, November 12, 28 RESULTS AT SEPTEMBER 3, 28 THIRD QUARTER 28 FIRST 9 MONTHS OF 28 NBI before impact of the crisis: 1.53BN NBI: 1.154BN GOI: 56M U/l net income (gp. share): 221M NBI before impact
Portuguese Banking System: latest developments. 4 th quarter 2017
 Portuguese Banking System: latest developments 4 th quarter 217 Lisbon, 218 www.bportugal.pt Prepared with data available up to 2 th March of 218. Macroeconomic indicators and banking system data are
Portuguese Banking System: latest developments. 2 nd quarter 2018
 Portuguese Banking System: latest developments 2 nd quarter 218 Lisbon, 218 www.bportugal.pt Prepared with data available up to 26 th September of 218. Macroeconomic indicators and banking system data
Note to the reader. Enjoy your reading.
 Note to the reader This annual ACPR statistical report on "The French banking and insurance market in figures" has been substantially revised even more so than the 2015 report compared with previous years.
Portuguese Banking System: latest developments. 1 st quarter 2018
 Portuguese Banking System: latest developments 1 st quarter 218 Lisbon, 218 www.bportugal.pt Prepared with data available up to 27 th June of 218. Macroeconomic indicators and banking system data are quarterly
Bulletin. Decline in profitability since 2005: French banks hold their own. +10% for US banks. +66% for European banks +97% for French banks +10
 Decline in profitability since 2005: hold their own In a context of low interest rates and the strengthening of regulatory requirements, the profitability of French and deteriorated between 2005 and 2016.
FINANCIAL MARKETS IN EARLY AUGUST 2011 AND THE ECB S MONETARY POLICY MEASURES
 Chart 28 Implied forward overnight interest rates (percentages per annum; daily data) 5. 4.5 4. 3.5 3. 2.5 2. 1.5 1..5 7 September 211 31 May 211.. 211 213 215 217 219 221 Sources:, EuroMTS (underlying
May 9, Results for the 1st quarter of 2012
 May 9, 2012 Results for the 1st quarter of 2012 Disclaimer This presentation may contain forward-looking statements and comments relating to the objectives and strategy of Groupe BPCE. By their very nature,
PRESENTATION OF INFORMATION
 PRESENTATION OF INFORMATION This document comprises additional information regarding HSBC Bank plc ( the bank ) and its subsidiary undertakings (together the group ). References to HSBC or the Group within
Banco Santander attributable profit rose 22% to EUR billion in the first quarter of 2008
 Press Release Banco Santander attributable profit rose 22% to EUR 2.206 billion in the first quarter of 2008 The efficiency ratio stood at 41.9%, an improvement of 4.4 percentage points from a year earlier
BANKING SECTOR IN SERBIA
 ADMINISTRATION FOR SUPERVISION OF FINANCIAL INSTITUTIONS BANK SUPERVISION DEPARTMENT BANKING SECTOR IN SERBIA Fourth Quarter Report 2017 June 2018 Contents: 1 BASIC INFORMATION ON SERBIAN BANKING SECTOR...
French banks performance in 2013
 French banks performance in 2013 No 29 May 2014 1 CONTENTS 1. FINANCIAL PERFORMANCE OF FRENCH BANKING GROUPS IN 2013... 5 1.1. Earnings up strongly relative to 2012... 5 1.2. Profits rise on better control
Pohjola Bank plc Interim Report for 1 January 30 June 2010
 Pohjola Bank plc s Interim Report for 1 January 1 Pohjola Bank plc Company Release, 4 August, 8.00 am Release category: Interim Report Pohjola Bank plc Interim Report for 1 January January June Year on
Update to the Registration Document filed with the Autorité des Marchés Financiers on 29 April 2009 under reference number D.
 Update to the Registration Document filed with the Autorité des Marchés Financiers on 29 April 2009 under reference number D.09-0344 Update filed with the Autorité des Marchés Financiers 28 August 2009
RESULTS AS AT 31 MARCH 2009
 RESULTS AS AT 31 MARCH 2009 Paris, 6 May 2009 A NET PROFIT OF 1.56 BILLION EUROS (GROUP SHARE) IN AN ENVIRONMENT STILL CHALLENGING 1Q09/1Q08 REVENUES 9,477mn +28.2% OPERATING EXPENSES - 5,348mn +16.1%
EBA REPORT ON ASSET ENCUMBRANCE SEPTEMBER 2018
 EBA REPORT ON ASSET ENCUMBRANCE SEPTEMBER 2018 1 Contents List of figures 3 Executive summary 4 Analysis of the asset encumbrance of European banks 7 Sample 7 Scope of the report 7 Total encumbrance 8
20 October 2010 EUROPEAN COVERED BONDS (CB) MARKET
 MARKET") EUROPEAN COVERED BONDS (CB) MARKET 20 October 2010 Covered bonds are debt obligations that are backed by a dedicated underlying assets portfolio. These assets give to the bearers of these debt obligations
EUROPEAN COVERED BONDS (CB) MARKET 20 October 2010 Covered bonds are debt obligations that are backed by a dedicated underlying assets portfolio. These assets give to the bearers of these debt obligations
Santander s profit rose 77% to EUR 3,310 million in the first nine months
 Press Release Santander s profit rose 77% to EUR 3,310 million in the first nine months BUSINESS Deposits rose 5% to EUR 633,433 million, while loans fell 2%, to EUR 686,821 million In emerging markets,
CONTENTS FINANCIAL STATEMENTS 3 COMBINED BALANCE SHEET... 4 COMBINED INCOME STATEMENT... 6
 CONTENTS FINANCIAL STATEMENTS 3 COMBINED BALANCE SHEET... 4 COMBINED INCOME STATEMENT... 6 STATEMENT OF NET INCOME AND GAINS (LOSSES) RECOGNISED DIRECTLY IN SHAREHOLDERS EQUITY... 7 CASH FLOW STATEMENT...
CONSOLIDATED FINANCIAL STATEMENTS
 CONSOLIDATED FINANCIAL STATEMENTS Results as at 2004 1 30 JUNE 2004 - C O N T E N T S - Note 1 Note 2 Note 3 Note 4 Note 5 Note 6 Consolidated balance sheet Consolidated profit and loss account Consolidated
Consolidated financial statements of BPCE SA group
 Consolidated financial statements of BPCE SA group at June 30, 2018 BPCE SA GROUP Consolidated financial statements at June 30, 2018-1 5 FINANCIAL REPORT 5.3 IFRS Consolidated Financial Statements of BPCE
Nexgen Capital Limited
 Background and context ( NCL ), a company incorporated in Ireland, is the capital markets trading company of the Group. NCL s ultimate parent is BPCE a French banking group created from the merger of the
Sharp increase in operating income: +32.4%* vs. H1 03 ROE after tax: 19.1% (vs. 15.6% in H1 03) EPS: EUR 3.79 (+31.8% vs. H1 03) Change vs.
 EPS: EUR 3.79 (+31.8% vs. H1 03) Change vs.") Paris, July 30th 2004 PRESS RELEASE CONTACTS GOOD RESULTS SECOND QUARTER 2004: Robust growth in franchises and sound revenues Tight cost control Low risk provisioning Record level of operating income:
Paris, July 30th 2004 PRESS RELEASE CONTACTS GOOD RESULTS SECOND QUARTER 2004: Robust growth in franchises and sound revenues Tight cost control Low risk provisioning Record level of operating income:
SEPTEMBER 2017 KEY FIGURES FOR ASSET MANAGEMENT IN 2016 MANAGEMENT COMPANY FINANCIAL DATA AND PROFITABILITY
 SEPTEMBER 2017 KEY FIGURES FOR ASSET MANAGEMENT IN 2016 MANAGEMENT COMPANY FINANCIAL DATA AND PROFITABILITY amf france.org After rising for three years in a row, the operating profit of the French asset
Housing finance in France in 2016
 Housing finance in France in 2016 No. 82 July 2017 1 CONTENTS 1. MAIN FEATURES OF THE HOUSING LOAN MARKET... 6 1.1. Prices and sales were up... 6 1.2. Historically low interest rates fuelled an acceleration
Finland's Balance of Payments. Preliminary Review 2007
 Finland's Balance of Payments Preliminary Review 27 1 Current account, 198 27 1 Credit Net - -1 198 198 199 199 2 2 Current transfers Income Services Goods Curent account, net Debit Bank of Finland Financial
Portuguese Banking System: latest developments. 2 nd quarter 2017
 Portuguese Banking System: latest developments nd quarter 17 Lisbon, 17 www.bportugal.pt Prepared with data available up to th September of 17. Portuguese Banking System: latest developments Banco de Portugal
MIFID II LEAFLET CORPORATE INVESTMENT BANKING (SGCIB)
") Since its implementation in November 2007, the Markets in Financial Instruments Directive ( MiFID I ) has been the cornerstone of capital markets regulation in Europe. MiFID I was recast by the Markets
Since its implementation in November 2007, the Markets in Financial Instruments Directive ( MiFID I ) has been the cornerstone of capital markets regulation in Europe. MiFID I was recast by the Markets
CNP Assurances Press Release Financial Indicators for the First Nine Months of 2012
 Paris, 14 November Press Release Financial Indicators for the First Nine Months of Revenue: 19.4bn (down 14) Net insurance revenue: 2,283m (up 4) Recurring net profit: stable at 755m Attributable net profit:
MIFID II LEAFLET CORPORATE INVESTMENT BANKING (SGCIB)
") Since its implementation in November 2007, the Markets in Financial Instruments Directive ( MiFID I ) has been the cornerstone of capital markets regulation in Europe. MiFID I was recast by the Markets
Since its implementation in November 2007, the Markets in Financial Instruments Directive ( MiFID I ) has been the cornerstone of capital markets regulation in Europe. MiFID I was recast by the Markets
BANKING SECTOR IN SERBIA
 BANK SUPERVISION DEPARTMENT BANKING SECTOR IN SERBIA First Quarter Report 2018 September 2018 Contents: 1 BASIC INFORMATION ON SERBIAN BANKING SECTOR... 3 1.1 Selected parameters of the Serbian banking
EBA REPORT ON ASSET ENCUMBRANCE JULY 2017
 EBA REPORT ON ASSET ENCUMBRANCE JULY 2017 1 Contents List of figures 3 Executive summary 4 Analysis of the asset encumbrance of European banks 6 Sample 6 Scope of the report 6 Total encumbrance 7 Encumbrance
Strategic development of the banking sector
 II BANKING SECTOR STABILITY AND RISKS Strategic development of the banking sector Estonia s financial system is predominantly bankbased owing to the smallness of the domestic market (see Figure 1). In
COUNCIL OF THE EUROPEAN UNION. Brussels, 9 June /09 ADD 1 ECOFIN 429 UEM 158 EF 89 RC 9
 COUNCIL OF THE EUROPEAN UNION Brussels, 9 June 2009 10772/09 ADD 1 ECOFIN 429 UEM 158 EF 89 RC 9 NOTE from: to: Subject: Council (Ecofin) European Council Annex to the Council (Ecofin) Report to the 18-19
International economy in the first quarter of 2009
 The article is based on data with cutoff date as of June, 9. I volume, 8/9B International economy in the first quarter of 9 GLOBAL ECONOMY The GDP development in OECD countries recorded a further decrease
FIRST QUARTER 2012 RESULTS
 FIRST QUARTER 2012 RESULTS PRESS RELEASE Paris, 4 May 2012 DOMESTIC MARKETS: GROWING BUSINESS ACTIVITY DEPOSITS: +3.6% VS. 1Q11; LOANS: +2.9% VS. 1Q11 GOOD RESILIENCE OF CAPITAL MARKETS REVENUES: -4.0%
COMMISSION OF THE EUROPEAN COMMUNITIES COMMISSION STAFF WORKING DOCUMENT. Annex to the. Report from the Commission
 COMMISSION OF THE OPEAN COMMUNITIES Brussels, 29.5.2008 SEC(2008)1938 COMMISSION STAFF WORKING DOCUMENT Annex to the Report from the Commission Annual Report from the Commission on the Guarantee Fund and
Interim Report January June
 Interim Report January June INTERIM REPORT JANUARY JUNE Handelsbanken s Interim Report JANUARY JUNE Summary January June, compared with January June Profit after tax for total operations went up by 12
The consolidation process in the German banking sector gained momentum last year.
 Bank office report 2016 Development of the bank office network in 2016 Development of the bank office network in 2016 I Number of credit institutions (see Annex 1) The consolidation process in the German
RESULTS 1 FOR THE FIRST QUARTER OF 2016 OF GROUPE BPCE
 Paris, May 10, 2016 RESULTS 1 FOR THE FIRST QUARTER OF 2016 OF GROUPE BPCE Good commercial performance against a background of low interest rates and adverse market conditions. Net income attributable
CM11-CIC GROUP Growth in commercial activity and financial results
 Paris, July 31, 2013 CM11-CIC GROUP Growth in commercial activity and financial results CM11-CIC, whose core business is retail banking (75% of net banking income), recorded commercial gains and improved
Financial Highlights
 November 16, 2011 Financial Highlights Federal Reserve Balance Sheet 1 Europe European Bond Spreads 2 Mortgage Markets Mortgage Rates 3 Mortgage Applications Consumer Credit Revolving and Nonrevolving
ABI MONTHLY REPORT 1 July 2018 (Main evidence)
") ABI MONTHLY REPORT 1 July 2018 (Main evidence) LOANS AND DEPOSITS 1. In June 2018, loans to customers granted by banks operating in Italy, totalling 1,773.8 billion euro (cf. Table 1) was 37 billion higher
ABI MONTHLY REPORT 1 July 2018 (Main evidence) LOANS AND DEPOSITS 1. In June 2018, loans to customers granted by banks operating in Italy, totalling 1,773.8 billion euro (cf. Table 1) was 37 billion higher
Portuguese Banking System: latest developments. 1 st quarter 2017
 Portuguese Banking System: latest developments 1 st quarter 17 Lisbon, 17 www.bportugal.pt Prepared with data available up to 7 th June of 17. Portuguese Banking System: latest developments Banco de Portugal
Survey on the access to finance of enterprises in the euro area. October 2014 to March 2015
 Survey on the access to finance of enterprises in the euro area October 2014 to March 2015 June 2015 Contents 1 The financial situation of SMEs in the euro area 1 2 External sources of financing and needs
European Investment Fund Industry in 2013 p. 44. Net Assets under Management in Luxembourg Funds p. 46
 statistics European Investment Fund Industry in 2013 p. 44 Net Assets under Management in Luxembourg Funds p. 46 Growth Factors in Luxembourg Investment Funds p. 47 Number of Luxembourg Investment Funds
Nexgen Capital Limited
 Background and context ( NCL ), a company incorporated in Ireland, is the capital markets trading company of the Group. NCL s ultimate parent is BPCE a French banking group created from the merger of the
ABI MONTHLY REPORT 1 March 2018 (Main evidence)
") ABI MONTHLY REPORT 1 March 2018 (Main evidence) LOANS AND DEPOSITS 1. In February 2018, loans to customers granted by banks operating in Italy, totalling 1,777.2 billion euro (cf. Table 1) was almost 70
ABI MONTHLY REPORT 1 March 2018 (Main evidence) LOANS AND DEPOSITS 1. In February 2018, loans to customers granted by banks operating in Italy, totalling 1,777.2 billion euro (cf. Table 1) was almost 70
Agence France Locale - Société Territoriale Consolidated accounts (IFRS GAAP)
") Agence France Locale - Société Territoriale Consolidated accounts (IFRS GAAP) BALANCE SHEET Assets as of December 31, 2015 Note Cash, central banks Financial assets at fair value through profit or loss
Agence France Locale - Société Territoriale Consolidated accounts (IFRS GAAP) BALANCE SHEET Assets as of December 31, 2015 Note Cash, central banks Financial assets at fair value through profit or loss
General debt-related data. page 3
 18 19 1 3 4 5 6 7 8 9 3 31 3 33 34 35 36 37 38 39 4 41 4 43 44 45 46 47 MonthlyBulletin n 3 3 4 M a r c h 1 8 Publication manager: Anthony Requin Editor: Agence France Trésor Available in Arabic, Chinese,
ANNUAL REPORT THE FRENCH BALANCE OF PAYMENTS AND INTERNATIONAL INVESTMENT POSITION
 2014 ANNUAL REPORT THE FRENCH BALANCE OF PAYMENTS AND INTERNATIONAL INVESTMENT POSITION BANQUE DE FRANCE DIRECTORATE GENERAL STATISTICS Balance of Payments Directorate Sectoral Surveys and Statistics
Global liquidity: selected indicators 1
 8 October 14 Global liquidity: selected indicators 1 Highlights Indicators of global liquidity point to a continued strengthening of risk appetite and loosening of credit conditions in the spring and summer
FIRST UPDATE TO THE 2016 REGISTRATION DOCUMENT
 A French corporation with share capital of EUR 1,009,380,011.25 Registered office: 29 boulevard Haussmann - 75009 PARIS 552 120 222 R.C.S. PARIS FIRST UPDATE TO THE 2016 REGISTRATION DOCUMENT Registration
I t a l i a n i n s u r a n c e i n / ANIA. Associazione Nazionale fra le Imprese Assicuratrici
 I t a l i a n i n s u r a n c e i n 2 0 1 0 / 2 0 1 1 I t a l i a n i n s u r a n c e i n 2 0 1 0 / 2 0 1 1 ANIA Associazione Nazionale fra le Imprese Assicuratrici I t a l i a n i n s u r a n c e i n
The position of firms in 2009: a decline in business and a reluctance to invest during the crisis. Companies Directorate Companies Observatory
 The position of firms in 9: a decline in business and a reluctance to invest during the crisis Companies Directorate Companies Observatory During the second year of the economic and fi nancial crisis,
African Bank Holdings Limited and African Bank Limited
 African Bank Holdings Limited and African Bank Limited Public Pillar III Disclosures in terms of the Banks Act, Regulation 43 CONTENTS 1. Executive summary... 3 2. Basis of compilation... 7 3. Supplementary
EUROPEAN NON-LIFE INSURANCE GROUPS RANKING 2010
 EUROPEAN NON-LIFE INSURANCE GROUPS RANKING 2010 June 2011 Table of contents: 1. Presentation 2. Methodology 3. General Comments 4. Comments by Group Annexes Partial reproduction of the information contained
Banking Activity Review
 Banking Activity Review 18 / Q1 ISSN 233-8319 (ONLINE) Reproduction for educational and non-commercial purposes is permitted provided that the source is acknowledged. Lietuvos bankas, 18 Gedimino pr. 6,
Private non-financial sector indebtedness: where do we stand?
 HCSF/217/1-2-1 15 e séance Private non-financial sector indebtedness: where do we stand? The French private non-financial sector (households and firms) indebtedness registered a steady increase since the
Press conference of Monday, 28 May Speech by François Villeroy de Galhau, Governor of the Banque de France, Chairman of the ACPR
 Press conference of Monday, 28 May 2018 Speech by François Villeroy de Galhau, Governor of the Banque de France, Chairman of the ACPR Presentation of the 2017 annual report of the Autorité de contrôle
REPORT MONETARY POLICY INSTRUMENTS OF THE NATIONAL BANK OF POLAND IN 2007 BANKING SECTOR LIQUIDITY
 REPORT MONETARY POLICY INSTRUMENTS OF THE NATIONAL BANK OF POLAND IN 2007 BANKING SECTOR LIQUIDITY Warsaw 2008 2 Banking sector liquidity Executive summary Pursuant to Article 227 para. 1 of the Constitution
European Smart Beta ETF Market Trends Q in brief
 LYXOR ETF Research APRIL 217 OR PROFESSIONAL CLIENTS WITHIN THE MEANING OF MARKETS IN FINANCIAL INSTRUMENTS DIRECTIVE 24/39/EC. IT IS NOT DIRECTED AT RETAIL CLIENTS. 1 European Smart Beta ETF Market Trends
Highlights of Handelsbanken s annual report
 Highlights of Handelsbanken s annual report January - December 2008 * Summary of Q4 2008, compared with Q3 2008 Operating profits rose by 39% to SEK 5,216m (3,758). Excluding capital gains, operating profits
JANUARY-SEPTEMBER 2012 RESULTS
 Press Release JANUARY-SEPTEMBER 2012 RESULTS Santander registered attributable net profit of EUR 1.804 billion (-66%), after covering 90% of real estate provisions required by the latest Spanish regulations
CNP ASSURANCES INTERIM CONSOLIDATED FINANCIAL STATEMENTS SIX MONTHS ENDED 30 JUNE 2018
 CNP ASSURANCES INTERIM CONSOLIDATED FINANCIAL STATEMENTS SIX MONTHS ENDED 30 JUNE 2018 Only the French language version is binding on the Company. 1 Contents FIRST-HALF 2018 CONSOLIDATED FINANCIAL STATEMENTS
Interim earnings update 15 October 2008
 Interim earnings update 15 October 2008 Publication scheme for 15 October 2008 8.00 a.m. CEST - Press release and Powerpoint presentation available on www.kbc.com 9.30 a.m. CEST - Teleconference for financial
Results for the fourth quarter and full year 2012 Crédit Agricole turns a page and is now in marching order to deliver a sustainable performance
 Results for the fourth quarter and full year 2012 Crédit Agricole turns a page and is now in marching order to deliver a sustainable performance Montrouge, 20 February 2013 Risks reduced, swift adjustment
Santander s profit rose 77% to EUR 3,310 million in the first nine months
 Press Release Santander s profit rose 77% to EUR 3,310 million in the first nine months BUSINESS Deposits rose 5% to EUR 633,433 million, while loans fell 2%, to EUR 686,821 million In emerging markets,
African Bank Holdings Limited and African Bank Limited
 African Bank Holdings Limited and African Bank Limited Public Pillar III Disclosures in terms of the Banks Act, Regulation 43 CONTENTS 1. Executive summary... 3 2. Basis of compilation... 9 3. Supplementary
Change vs. Q3 03. Change vs. 9M 03 Net banking income 4, % 12, % On a like-for-like basis* +5.2% +4.7%
 Paris, November 9th 2004 PRESS RELEASE CONTACTS THIRD QUARTER 2004 RESULTS: Robust revenue momentum Tight cost control Gross operating income: +7.9 %* vs. Q3 03 Operating income: +35.7%* with very low
Bank of Ireland Presentation October As at 1 Oct 2014
 Bank of Ireland Presentation October 2014 As at 1 Oct 2014 1 Forward-Looking statement This document contains certain forward-looking statements within the meaning of Section 21E of the US Securities Exchange
Market performance in 2016
 Market performance in 2016 The ECB's monetary policy decisions once again shaped the performance of the markets in 2016, in addition to external factors such as Brexit and the US elections. In March, the
OKO BANK PLC INTERIM REPORT 1 APRIL 30 JUNE 2007 WITH PRESIDENT AND CEO'S COMMENTS
 OKO BANK PLC Company Release 9 August 2007 at 8.00 am OKO BANK PLC INTERIM REPORT 1 APRIL 30 JUNE 2007 WITH PRESIDENT AND CEO'S COMMENTS President and CEO's comments: "In the second quarter, consolidated
Summary of Government Interventions France
 21 April 2009 Summary of Government Interventions France Overview In addition to the steps undertaken by the ECB, the French government has provided the following main types of support to the French financial
RESULTS AS AT 31 MARCH 2010
 RESULTS AS AT 31 MARCH 2010 Paris, 6 May 2010 NET EARNINGS GROUP SHARE: 2.3 BILLION EUROS GREATER PROFIT GENERATING CAPACITY THANKS TO THE GROUP S NEW DIMENSION 1Q10 1Q10 / 1Q09 1Q10 / 1Q09 At constant
Monetary policy assessment of 12 March 2009 Swiss National Bank takes decisive action to forcefully relax monetary conditions
 Communications P.O. Box, CH-8022 Zurich Telephone +41 44 631 31 11 Fax +41 44 631 39 10 Zurich, 12 March 2009 Monetary policy assessment of 12 March 2009 Swiss National Bank takes decisive action to forcefully
Banking Digest Q1-2014
 QUARTERLY Banking Digest Q1-14 BERMUDA MONETARY AUTHORITY PERFORMANCE HIGHLIGHTS Sector capital levels improved during the quarter as risk-based exposures decreased. The capital position increased during
Transformation plan ahead of target Net profit of EUR 1,010 million in 2009 and EUR 202 million in 4Q 2009
 - - - Regulated information* Brussels, Paris, February 24, 2010 05.45 pm Transformation plan ahead of target Net profit of EUR 1,010 million in 2009 and EUR 202 million in 4Q 2009 Highlights Transformation
Commerzbank: Successful first half of Commerzbank 4.0 strategy net result of 865m for 2018
 Press release For business editors 14 February 2019 Commerzbank: Successful first half of Commerzbank 4.0 strategy net result of 865m for 2018 Operating profit of 1.2bn (2017: 1.1bn) and of 240m for (
Improvement Non-Life operating performance confirmed Group combined ratio at 101.2%, vs %
 PRESS RELEASE Brussels/Utrecht, 9 November 2011-7.30 CET Regulated Information First nine months results 2011 Insurance net result affected by financial market turmoil Intrinsic Insurance performance remains
Morgan Stanley Conference. March 30, 2011
 Morgan Stanley Conference Disclaimer This media release may contain objectives and comments relating to the objectives and strategy of Natixis. Any such objectives inherently depend on assumptions, project
Crédit Agricole Group* Net income - Group share: 427 million Tier 1 ratio: 9.2% Crédit Agricole S.A.
 Paris, 14 May 2009 Crédit Agricole Group* First quarter 2009 Net income - Group share: 427 million Tier 1 ratio: 9.2% * Crédit Agricole S.A. and the Regional Banks fully consolidated Crédit Agricole S.A.
What is the economic outlook for OECD countries?
 What is the economic outlook for OECD countries? An interim assessment Paris, 3 rd September 2009 11h00 Paris time Jørgen Elmeskov Acting Head of Economics Department Corporate bond spreads have come down
BANKS USE OF THE WHOLESALE GUARANTEE 1
 BANKS USE OF THE WHOLESALE GUARANTEE 1 Susan Black and Carl Schwartz, Reserve Bank of Australia Abstract At the peak of the financial crisis, the Australian Government announced that it would offer to
1.1. Low yield environment
 1. Key developments The overall macroeconomic environment remains very challenging for the European insurance and pension sector. The yields have been further compressed and are substantially below the
DEXIA SA/NV. Place du Champ de Mars Brussels RPM/RPR Brussels VAT BE
 DEXIA SA/NV Place du Champ de Mars 5 1050 Brussels RPM/RPR Brussels VAT BE 458.548.296 SPECIAL REPORT OF THE BOARD OF DIRECTORS NET ASSETS BELOW A QUARTER OF THE SHARE CAPITAL - Article 633 of the Belgian
CECIMO Statistical Toolbox
 European Association of the Machine Tool Industries where manufacturing begins Inside this edition... 0 Executive Summary 1 Machine Tool Orders 1.1 Orders per Country 1.2 Peter Meier s Forecast CECIMO
3 rd QUARTER 2010 ACTIVITY REPORT
 Reuters>bcp.Is Exchange>MCP Bloomberg>bcp pl ISIN PTBCP0AM00007 In accordance with Article 10 of the CMVM Regulation nr.5/2008 we are pleased to transcribe the 3 rd QUARTER 2010 ACTIVITY REPORT BANCO COMERCIAL
Financial Policy Committee Statement from its policy meeting, 12 March 2018
 Press Office Threadneedle Street London EC2R 8AH T 020 7601 4411 F 020 7601 5460 press@bankofengland.co.uk www.bankofengland.co.uk 16 March 2018 Financial Policy Committee Statement from its policy meeting,
INVESTOR PRESENTATION. September 2014
 1 INVESTOR PRESENTATION September 2014 Table of contents CNP Assurances - Investor presentation September 2014 Company overview 3 A resilient and conservative business model 6 Diversified and stable sources
IN EUROPEAN BANKING SYSTEMS 1
 Reinhard H. Schmidt * Dilek Bülbül ** Ulrich Schüwer *** IN EUROPEAN BANKING SYSTEMS 1 Germany, as this country is almost unique in so far as the German savings banks and the place and role of savings
C.I.B Report on asset quality as of June 30, 2013 Caisse Française de Financement Local (Instruction n 2011-I-07 of June 15, 2011)
") C.I.B 14 388 Report on asset quality as of June 30, 2013 Caisse Française de Financement Local (Instruction n 2011-I-07 of June 15, 2011) The report on cover pool quality, consistent with Instruction No.
C.I.B 14 388 Report on asset quality as of June 30, 2013 Caisse Française de Financement Local (Instruction n 2011-I-07 of June 15, 2011) The report on cover pool quality, consistent with Instruction No.
BREAKDOWN OF THE USE OF NON-CASH PAYMENT INSTRUMENTS assessment (2015 data)
") 5 BREAKDOWN OF THE USE OF NON-CASH PAYMENT INSTRUMENTS assessment (5 data) Banque de France 3, rue Croix-des-Petits-Champs 75 PARIS Managing editor: Denis Beau, Director General Financial Stability and
5 BREAKDOWN OF THE USE OF NON-CASH PAYMENT INSTRUMENTS assessment (5 data) Banque de France 3, rue Croix-des-Petits-Champs 75 PARIS Managing editor: Denis Beau, Director General Financial Stability and