Trends in Total and Out-of- Pocket Spending in Metro Areas:
|
|
|
- Brian Riley
- 6 years ago
- Views:
Transcription
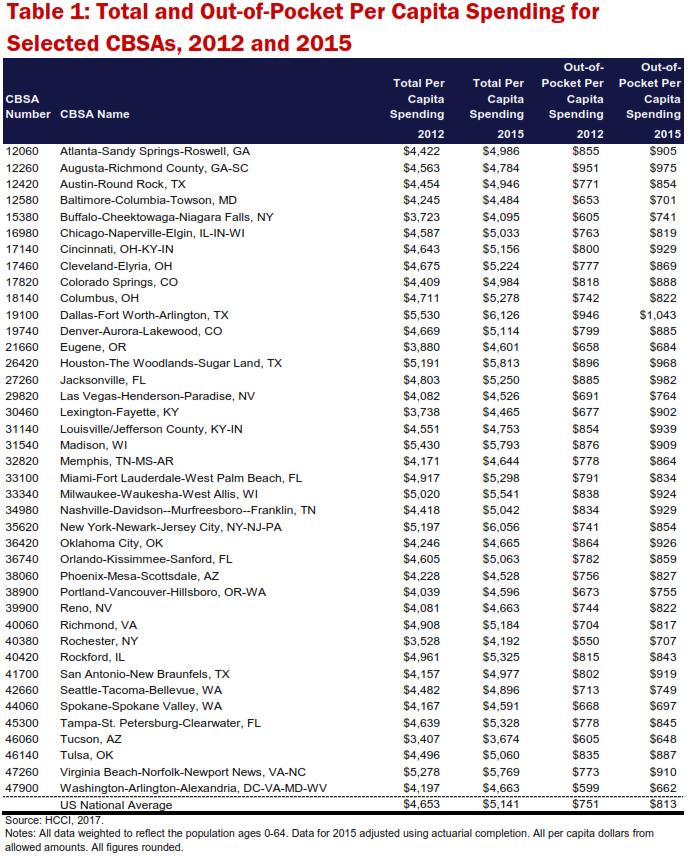
1 Trends in Total and Out-of- Pocket Spending in Metro Areas: It is well-documented that health care prices vary widely by geography. 1 These variations can also lead to differences in health care costs to consumers. This data brief examines geographic variation per capita in health care spending, with a focus on consumer out -of-pocket spending. This is an understudied topic, largely because of the lack of data on out-of-pocket spending by the commercially insured. Our study population is individuals ages 0 through 64 and covered by employee-sponsored insurance (ESI) for 40 core-based statistical areas (CSBAs) for the years 2012 and ,3 Total health care spending In 2012, national average per capita spending was $4,653 (Table 1). By 2015, spending had increased by $488 to $5,141 per capita, an average annual growth rate of 3.4% (Table 2). 4 In 2015, per capita spending in fourteen CBSAs was above the national average ($5,141). The highest per capita spending was in Dallas ($6,126), which was 12% above the national average (Figure 1). High spending per capita also occurred in New York City ($6,056) and Houston ($5,813), where spending was 18% and 13% higher than the national average, respectively. Average annual per capita spending growth rates over the study period in Dallas and Houston were 3.5% and 3.8%, respectively, slightly faster than the national growth rate (Figure 2). In New York City, per capita spending grew an average annual 5.2%. The lowest per capita spending in 2015 was in Tucson ($3,674), which was 40% lower than the national average and 67% lower than the Dallas average. Buffalo ($4,095) and Rochester ($4,192) had the second and thirdlowest spending per capita, which was 26% and 23% lower than the national average, respectively (Figure 3). Average annual per capita spending growth rates over the study period were 2.6% in Tucson, 3.4% in Buffalo, and 5.9% in Rochester (Figure 4). In general, there was very little change in CBSA spending rankings from 2012 to 2015: Dallas and Tucson had the highest and lowest spending, respectively in both 2012 and Of the ten CBSAs with the lowest per capita spending in 2015, eight of them were also in the ten lowest spending CBSAs in Similarly eight of the ten highest spending CBSAs in 2015, were also in the top 10 in 2012 (Table 1). Out-of-pocket spending Nationally, consumers with employersponsored insurance spent $751 per capita on average in 2012 (Table 1). By 2015, this number increased to $813 per person, an average annual growth rate of 2.7% (Table 2). The CBSA with the highest per capita out-of-pocket spending in 2015 was Dallas ($1,043), 28% higher than the national average (Figure 1). The second Data Brief #8 August 2017 KEY FINDINGS Out-of-pocket per capita spending was 61% higher in the highest spending CBSA than the lowest in 2015, and 72% higher in The fastest out-of-pocket spending growth rate was in Lexington, it grew an average annual 10.1% from 2012 to 2015, over 3.5 times as fast as the national average growth rate. In 2015, the CBSA with the largest consumer spending burden was in Augusta with 20.4% of total spending paid out of pocket, while the lowest was New York City with 14.1%. and third per capita highest out-ofpocket spending occurred in Jacksonville, FL ($982) and Augusta, GA ($975); those numbers were 21% and 20% higher than the national average, respectively. Out-of-pocket spending per person rose at an average annual rate of 3.3% in Dallas and 3.6% in Jacksonville, both slightly higher than the national average growth rate (Figure 2). Out-of-pocket spending in Augusta, however, rose just 1.1% annually, the slowest annual growth rate of any CBSA studied. In 2015, ten of the CBSAs studied had per capita out-of-pocket spending that was lower than the national average. Tucson had the lowest per capita out-of -pocket spending ($648), which was 25% lower than the national average and 61% lower than spending in Dallas. Washington DC had the second-lowest out-of-pocket spending ($662), which was 23% lower than the national aver- 1
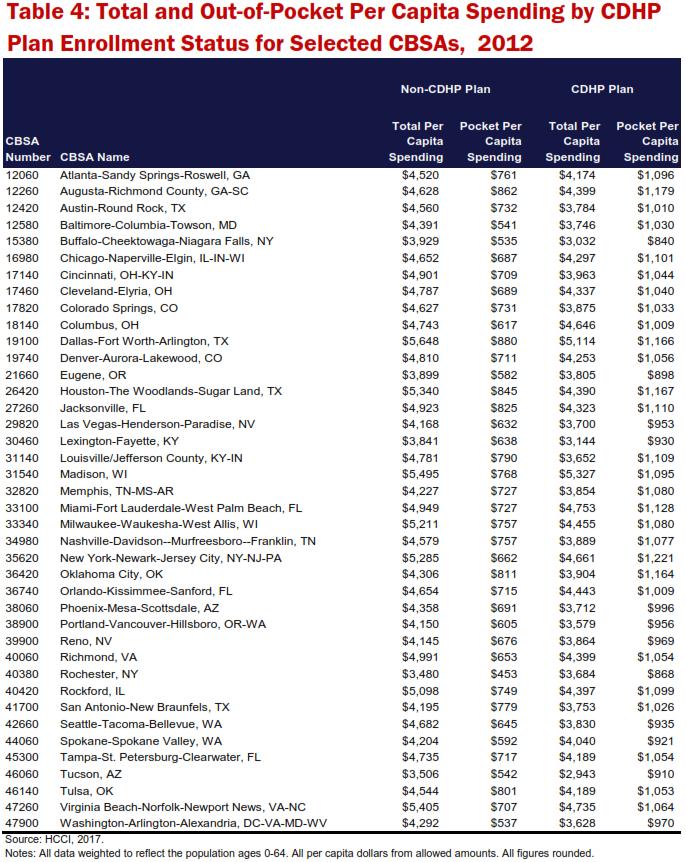
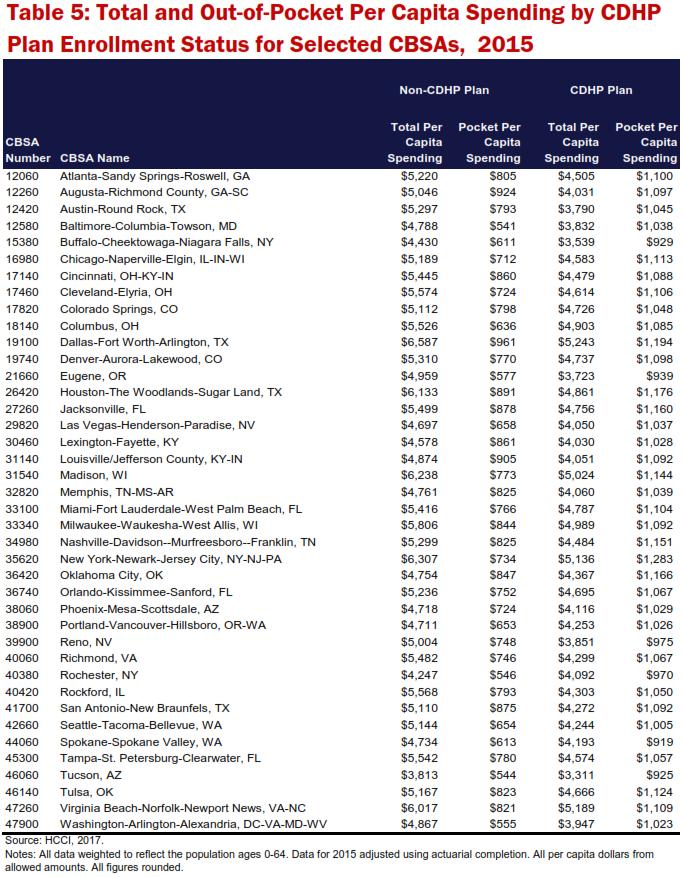
2 age (Figure 3). There were relatively few overlaps between the top ten highest out-of-pocket spending CBSAs and the top ten highest total per capita spending CBSAs. Only Dallas, Houston, and Milwaukee had both high total and out-of-pocket per capita spending in 2012 and Most of the CBSAs with the highest out-ofpocket spending ranked near the middle of the group of CBSAs in terms of total per capita spending. Consumer out-of-pocket spending burden In 2015, out-of-pocket spending was 15.8% of total health care per capita spending (Table 2). This was down slightly from 2012, when national average consumer spending was 16.1% of total spend. On the high end, Augusta and Lexington had consumer out-of-pocket spending of greater than 20% of total, about 26% higher than the national average. The lowest out-of-pocket spending as a percent of total were in Washington DC (14.2%) and New York City (14.1%), about 13% lower than the national average (Figures 1 and 3). Between 2012 and 2015, the largest increase in out-of-pocket spend as a percent of total occurred in Lexington, where it increased by 10.1%, followed by Rochester at 8.8% (Figures 2 and 4). CDHP enrollment and non-utilizers To better understand the factors contributing to the geographic variation in these out-of-pocket spending numbers, we explored whether the proportion of people enrolled in consumer-driven health plans (CDHPs) or the proportion not utilizing health care services had any influence on out-of-pocket spending. CDHP enrollment: Nationally, in % of people with ESI were enrolled in a CDHP nationally. Among our study population, CDHP enrollment ranged from a low of 17.4% in Louisville to a high of 42.5% in Columbus (Table 3). HCCI previously reported that, on average, people enrolled in CHDP paid more out-of-pocket, on average, than people enrolled in a traditional type of health plan: $1,083 per capita compared to $709 per capita, respectively in While consumers enrolled in CDHPs paid more per capita than those enrolled in traditional plans in every CBSA studied (Tables 4 and 5), there was no relationship between the proportion enrolled in a CDHP and the amount paid out of pocket. 6 In fact, the CBSA with the lowest enrollment in a CDHP, Louisville (17.4%, Table 3), had comparatively high out-of-pocket per capita spending ($939, Table 1). In contrast, the CBSA with the second highest rate of CDHP enrollment, Buffalo (41.5%), had relatively low out-ofpocket per capita spending ($741). Non-utilizers: We calculated the percentage of the population that did not file a medical or prescription claim with their health insurer in 2015 in each CBSA. 7 We expected that CBSAs with a lower percentage of non-utilizers would be associated with higher out-ofpocket per capita costs. Our study did confirm this relationship: a higher percentage of non-utilizers was related to lower per capita out-of-pocket spending. 8 It is noteworthy that the most important influence on out-of-pocket spending may be insurance benefit design. With the exception of whether the insured is enrolled in a CDHP, the HCCI dataset does not include information on benefit design. Future studies that include features of benefit design will be able to further examine variation in out -of-pocket spending. Data and methods This data brief used an analytic dataset that consisted of population weighted and aggregated claims data for people younger than age 65 and covered by ESI for calendar years 2012 and The analytic dataset was derived from health care claims for around 40 million Americans per year contributed by Aetna, Humana, Kaiser Permanente, and UnitedHealthcare. This was the same data set used by HCCI for the 2015 Health Care Cost and Utilization Report. 4 All data used for this study were de-identified and compliant with the Health Insurance Portability and Accountability Act. Total spending and out-of-pocket spending per capita measures were calculated at the CBSA, state, and national level. Individuals were considered to be living in a CBSA if their state or residence matched the state(s) listed as a component of the CBSA. If an individual s state did not match their CBSA they were excluded from the analysis. All spending measures were based on where insureds lived. Spending measures for CBSAs are the average for people who live in that CBSA, rather than the average of all care received in that CBSA. Our findings are estimates for the United States ESI population based on a sample of approximately 25% of ESI insureds younger than age 65. The estimates for numbers of insured individuals were weighted to account for any 2
3 demographic differences between the HCCI sample and population estimates based on the United States Census, making the dataset representative of the national, ESI population younger than age 65. All trends presented here should be treated as population estimates. For this study, HCCI did not seek to determine what role premiums, services covered, or specific aspects or changes in benefit designs played in the spending rates observed. Claims for 2015 were adjusted using actuarial completion to account for claims incurred but not adjudicated. HCCI used these weighted and adjusted claims to calculate total and out-of-pocket expenditures for 2012 and HCCI did not correct dollars for inflation; thus, all reported expenditures are in nominal dollars. For a more detailed description of the analytic dataset and methods used in this study, see 2015 Health Care Cost and Utilization Report and the corresponding methodology document, available on the HCCI Website. Endnotes 1. Health Care Cost Institute National Chartbook of Health Care Prices HCCI, April, Web. 2. Geographic Terms and Concepts - Core Based Statistical Areas and Related Statistical Areas. U. S. Census Bureau. Dec Web. 3. CBSAs provide an easy way of analyzing trends in metropolitan areas. The boundaries are drawn around where people live, rather than drawn around political boundaries, and they frequently cross multiple cities, counties, and states. For simplicity, in this data brief CBSAs are referred to by name of the largest city within the CBSA. For example, the CBSA named Chicago-Naperville -Elgin (CBSA 16980) covers part of Illinois, Indiana, and Wisconsin and is referred to here as Chicago. The per capita spending and out-ofpocket spending numbers presented in this data brief are methodologically identical and directly comparable to the numbers in the 2015 Health Care Cost and Utilization Report. For CBSA numbers and full names see the Tables. In 2013, the US Census Bureau redefined the names and boundaries of many CBSAs. This affected 13 of the studied CBSAs. The CBSA names referenced in the Tables are the post names. In this study, for the 2012 data the analysis utilized the pre-2013 names and boundaries, while the analysis of the 2015 data utilized the post-2013 names and boundaries. 4. Health Care Cost Institute Health Care Cost and Utilization Report. HCCI, Nov Web. 5. Health Care Cost Institute. Consumer-Driven Health Plans: A Cost and Utilization Analysis. HCCI, September Web. 6. This was based on a Pearson correlation with a value of 0.02 between the percentage enrollment in a CDHP and per capita out-of-pocket spending numbers. 7. This was calculated as the number of members who did not file a claim (the non-utilizers) divided by the total number of members in the population. The per capita out-ofpocket spending numbers are created by dividing all of the dollars spent by the population, including those who did and did not file a claim with their insurance. 8. This was based on a Pearson correlation with a value of between the percentage of the insureds who did not file an insurance claim and per capita out-of-pocket spending numbers. Author Amanda Frost Health Care Cost Institute, Inc G Street NW, Suite 600 Washington, DC Copyright 2017 Health Care Cost Institute, Inc. Unless explicitly noted, the content of this report is licensed under a Creative Commons Attribution Non- Commercial No Derivatives 4.0 International License This HCCI research product originated in response to suggestions by an independent third party with no commercial interest in the results. The author retained control over all methods, content, and dissemination of the results. 3
4 Figure 1: Total and Out-of-Pocket Spending Per Capita and Percentage Share of Spending for CBSAs With Highest Out-of-Pocket Spending and National Average, 2015 $5,141 $6,056 $4,465 $5,813 $4,784 $5,250 $6, % 14.1% 20.2% 16.6% 20.4% 18.7% 17.0% $813 $854 $902 $968 $975 $982 $1,043 US Average New York City Lexington Houston Augusta Jacksonville Dallas Total Spending Out-of-Pocket Spending Source: HCCI, Notes: All All data weighted to reflect the national, younger 0-64 ESI than population. 65 ESI population. Data from 2015 adjusted using actuarial completion. Figure 2: Average Annual Changes in Total and Out-of-Pocket Spending Per Capita for CBSAs With Highest Out-of-Pocket Spending and National Average, US Average New York City Lexington Houston Augusta Jacksonville Dallas Total Spending Source: Source: HCCI, HCCI, Notes: Notes: All All data data weighted weighted to to reflect reflect the the national, national, younger 0-64 ESI than population. age 65 ESI population. Data Data from from adjusted adjusted using using actuarial actuarial completion. completion. Out-of-Pocket 4
5 Figure 3: Total and Out-of-Pocket Spending Per Capita and Percentage Share of Spending for CBSAs With Lowest Out-of-Pocket Spending and National Average, 2015 $3,674 $4,663 $4,601 $4,591 $4,192 $4,095 $5, % 14.2% 14.9% 15.2% 16.9% 18.1% 15.8% $648 $662 $684 $697 $707 $741 $813 Tucson Washington DC Eugene Spokane Rochester Buffalo US Average Total Spending Source: Source: HCCI, HCCI, Notes: Notes: All All data data weighted weighted to to reflect reflect the the national, national, younger 0-64 ESI than population. 65 ESI population. Data Data from from adjusted adjusted using using actuarial actuarial completion. completion. Out-of-Pocket Spending Figure 4: Average Annual Changes in Total and Out-of-Pocket Spending Per Capita for CBSAs With Lowest Out-of-Pocket Spending and National Average, Tucson Washington DC Eugene Spokane Rochester Buffalo US Average Total Spending Source: Source: HCCI, HCCI, Notes: Notes: All All data data weighted weighted to to reflect the national, younger 0-64 ESI than population. age 65 ESI population. Data Data from from adjusted using using actuarial completion. Out-of-Pocket 5
6 6
7 Table 2: Changes in Total and Out-of-Pocket Per Capita Spending and Percentage of Costs Paid Out of Pocket for Selected CBSAs, CBSA Number CBSA Name Average Annual Change in Total Spending Average Annual Change in Outof-Pocket Spending Percentage of Costs Outof-Pocket Percentage of Costs Out-of- Pocket Atlanta-Sandy Springs-Roswell, GA 4.1% 2.1% 19.3% 18.2% Augusta-Richmond County, GA-SC 1.7% 1.1% 20.8% 20.4% Austin-Round Rock, TX 3.6% 3.5% 17.3% 17.3% Baltimore-Columbia-Towson, MD 1.9% 2.4% 15.4% 15.6% Buffalo-Cheektowaga-Niagara Falls, NY 3.4% 7.1% 16.2% 18.1% Chicago-Naperville-Elgin, IL-IN-WI 3.1% 2.4% 16.6% 16.3% Cincinnati, OH-KY-IN 3.6% 5.1% 17.2% 18.0% Cleveland-Elyria, OH 3.8% 3.8% 16.6% 16.6% Colorado Springs, CO 4.2% 2.7% 18.6% 17.8% Columbus, OH 3.9% 3.5% 15.7% 15.6% Dallas-Fort Worth-Arlington, TX 3.5% 3.3% 17.1% 17.0% Denver-Aurora-Lakewood, CO 3.1% 3.5% 17.1% 17.3% Eugene, OR 5.9% 1.3% 16.9% 14.9% Houston-The Woodlands-Sugar Land, TX 3.8% 2.6% 17.3% 16.6% Jacksonville, FL 3.0% 3.6% 18.4% 18.7% Las Vegas-Henderson-Paradise, NV 3.5% 3.4% 16.9% 16.9% Lexington-Fayette, KY 6.3% 10.1% 18.1% 20.2% Louisville/Jefferson County, KY-IN 1.5% 3.2% 18.8% 19.7% Madison, WI 2.4% 1.2% 16.1% 15.7% Memphis, TN-MS-AR 3.6% 3.6% 18.6% 18.6% Miami-Fort Lauderdale-West Palm Beach, FL 2.5% 1.8% 16.1% 15.7% Milwaukee-Waukesha-West Allis, WI 3.4% 3.3% 16.7% 16.7% Nashville-Davidson--Murfreesboro--Franklin, TN 4.5% 3.7% 18.9% 18.4% New York-Newark-Jersey City, NY-NJ-PA 5.2% 4.8% 14.3% 14.1% Oklahoma City, OK 3.2% 2.3% 20.4% 19.8% Orlando-Kissimmee-Sanford, FL 3.2% 3.2% 17.0% 17.0% Phoenix-Mesa-Scottsdale, AZ 2.3% 3.1% 17.9% 18.3% Portland-Vancouver-Hillsboro, OR-WA 4.4% 3.9% 16.7% 16.4% Reno, NV 4.6% 3.4% 18.2% 17.6% Richmond, VA 1.9% 5.1% 14.3% 15.8% Rochester, NY 5.9% 8.8% 15.6% 16.9% Rockford, IL 2.5% 1.2% 16.4% 15.8% San Antonio-New Braunfels, TX 6.2% 4.6% 19.3% 18.5% Seattle-Tacoma-Bellevue, WA 3.0% 1.7% 15.9% 15.3% Spokane-Spokane Valley, WA 3.3% 1.5% 16.0% 15.2% Tampa-St. Petersburg-Clearwater, FL 4.7% 2.8% 16.8% 15.9% Tucson, AZ 2.6% 2.4% 17.7% 17.6% Tulsa, OK 4.1% 2.0% 18.6% 17.5% Virginia Beach-Norfolk-Newport News, VA-NC 3.0% 5.6% 14.7% 15.8% Washington-Arlington-Alexandria, DC-VA-MD-WV 3.6% 3.4% 14.3% 14.2% US National Average 3.4% 2.7% 16.1% 15.8% Source: HCCI, Notes: All data w eighted to reflect the population ages Data for 2015 adjusted using actuarial completion. All figures rounded. 7

8 Source: HCCI, 2017 Notes: All data weighted to reflect the population ages Data for 2015 adjusted using actuarial completion. All figures rounded. 8
9 9
10 10
Healthy Marketplace Index: Medical Service Category Price Index
 Healthy Marketplace Index: Medical Service Category Price Index Comparing medical service category prices within and across geographies and over time For a second year, the Health Care Cost Institute (HCCI),
ERRATA. To: Recipients of MG-388-RC, Estimating Terrorism Risk, RAND Corporation Publications Department. Date: December 2005
 ERRATA To: Recipients of MG-388-RC, Estimating Terrorism Risk, 25 From: RAND Corporation Publications Department Date: December 25 Re: Corrected pages (pp. 23 24, Table 4.1,, Density, Density- Weighted,
HIGH AND WIDE: INCOME INEQUALITY GAP IN THE DISTRICT ONE OF BIGGEST IN THE U.S. By Wes Rivers
 An Affiliate of the Center on Budget and Policy Priorities 820 First Street NE, Suite 510 Washington, DC 20002 (202) 408-1080 Fax (202) 325-8839 www.dcfpi.org March 13, 2014 HIGH AND WIDE: INCOME INEQUALITY
Data Brief. Trends in Employer-Sponsored Health Insurance Premiums and Employee Contributions in Major Metropolitan Areas,
 December 2012 Data Brief Trends in Employer-Sponsored Health Insurance Premiums and Employee Contributions in Major Metropolitan Areas, 2003 2011 The mission of The Commonwealth Fund is to promote a high
Structured Finance. U.S. RMBS Sustainable Home Price Report. First-Quarter 2017 Update Special Report RMBS / U.S.A.
 U.S. RMBS Sustainable Home Price Report First-Quarter 2017 Update Special Report RMBS / U.S.A. U.S. Prices Grow at a Sustainable Pace: National inflation-adjusted home prices continue to grow at a rate
50-State Property Tax Comparison Study: For Taxes Paid in Executive Summary
 50-State Property Tax Comparison Study: For Taxes Paid in 2017 Executive Summary By Lincoln Institute of Land Policy and Minnesota Center for Fiscal Excellence April 2018 As the largest source of revenue
Traditional Regional Economic Indicators
 Cleveland State University EngagedScholarship@CSU Urban Publications Maxine Goodman Levin College of Urban Affairs 2-1-2005 Traditional Regional Economic Indicators Robert Sadowski How does access to this
Barriers to Accessing Homeownership
 HOUSING FINANCE POLICY CENTER Barriers to Accessing Homeownership Down Payment, Credit, and Affordability September 2018 Laurie Goodman, Alanna McCargo, Edward Golding, Bing Bai, and Sarah Strochak AB
AEI Center on Housing Markets and Finance Announces Ten Best and Worst Metro Areas to Be a First Time Homebuyer
 AEI Center on Housing Markets and Finance Announces Ten Best and Worst Metro Areas to Be a First Time Homebuyer Edward Pinto and Tobias Peter November 28th, 2018 New AEI study ranks 50 metros by home price
Equity Report FOURTH QUARTER 2014
 Equity Report FOURTH QUARTER 2014 Negative equity continued to be a serious issue for the housing market and the U.S. economy at the end of 2014 with 5.4 million homeowners still underwater. We expect
Small Business Sale Prices Reach Record Highs to Start 2018
 Small Business Sale s Reach Record Highs to Start 2018 BizBuySell.com's First Quarter 2018 Insight Report shows a recordbreaking quarter for the business-for-sale market for sales prices and completed
Equity Report THIRD QUARTER 2014
 Equity Report THIRD QUARTER 2014 Negative equity continued to decrease in the third quarter as did the level of homes mired in the foreclosure process. This should hopefully translate into less friction
2014 U.S. Census (2015) Median African-American Household Income Rank, Memphis Included. Household Median Income Ranking, African American Population
 Median African-American Household Income Rank, Memphis Included. Household Median Income Ranking, African American Population") 2015 2015 Rankings Report Prepared by Elena Delavega, PhD, MSW Department of Social Work Benjamin L. Hooks Institute for Social Change University of Memphis 2014 U.S. Census (2015) - Rank, Memphis Included
2015 2015 Rankings Report Prepared by Elena Delavega, PhD, MSW Department of Social Work Benjamin L. Hooks Institute for Social Change University of Memphis 2014 U.S. Census (2015) - Rank, Memphis Included
FOR IMMEDIATE RELEASE February 8, 2012
 Contact Information Below CoreLogic Reports 830,000 Completed s Nationally in 2011, a Decrease of 24 Percent from One Year Ago 1.4 Million Homes in the Inventory at the End of 2011 SANTA ANA, Calif., CoreLogic
Carroll Co-Invest Fund II, LP Investor Update, Q4 2013
 Carroll Co-Invest Fund II, LP Investor Update, Q4 2013 January 31, 2014 We are pleased to report that Carroll Co-Invest Fund II experienced a successful 4th quarter 2013. Our work at ARIUM Resort, Carroll
Nationwide s Health of Housing Markets (HoHM) Report
 Report") Nationwide s Health of Housing Markets (HoHM) Report Nationwide Economics 2016 Q4 Data as of 2016 Q3 HoHM Report Executive Summary: The national LIHHM* suggests that the overall U.S. housing market continues
Nationwide s Health of Housing Markets (HoHM) Report Nationwide Economics 2016 Q4 Data as of 2016 Q3 HoHM Report Executive Summary: The national LIHHM* suggests that the overall U.S. housing market continues
CoreLogic Equity Report
 CoreLogic Equity Report REPORT NATIONAL OVERVIEW Equity Distribution Improves as Price Gains Extend from 2012 into 2013 850,000 Residential Properties Returned to Positive Equity During the First Quarter
Appendix 1: CBSA List
 CBSA Code Appendix 1: CBSA List CBSA Name CBSA Code CBSA Name 10580 Albany-Schenectady-Troy, NY 33340 Milwaukee-Waukesha-West Allis, WI 10740 Albuquerque, NM 33460 Minneapolis-St. Paul-Bloomington, MN-WI
Canary Rental Index shows where rental investors can secure double-digit returns
 Canary Rental Index Canary Rental Index shows where rental investors can secure double-digit returns Where there s smoke, there s fire. So where home prices are rising, there must be great opportunities
Office. Office. IRR Viewpoint 2015
 IRR Viewpoint 05 Above: Designed in 95 in the Art Deco style by architect Timothy Pflueger as the Pacific Telephone and Telegraph Building, 40 New Montgomery Street, San Francisco, CA has been the subject
Housing and Mortgage Market Review
 Housing and Mortgage Market Review Fall 2017 IN THIS ISSUE Is a Housing Bubble Forming in the US? (Page 1) Home Prices Not as High as They Seem (Page 4) Are America s Hottest Housing Markets Overheating?
Analysis Based on U.S. County Business Patterns. June Part of the Kiva Visa Partnership for U.S. Small Businesses
 KIVA AND VISa study of small business trouble spots Analysis Based on County Patterns June 2011 Part of the Kiva Visa Partnership for Small es research objectives research objectives In late 2010, Visa
Employee Benefits Alert
 Employee Benefits Alert Issue 110 June 2007 The Massachusetts Health Care Reform Act: What s an Employer to Do? The Massachusetts Health Care Reform Act became law in April 2006; the July 1, 2007 effective
American Jobs Act - Preventing Teacher Layoffs Estimated Jobs Impact by State
 American Jobs Act - Preventing Teacher Layoffs Estimated Jobs Impact by Funds Allocated Estimate of Jobs Supported for 1 School Year Alabama $ 451,477,775 7,000 Alaska $ 70,483,533 900 Arizona $ 625,502,087
Nationwide s Health of Housing Markets (HoHM) Report
 Report") Nationwide s Health of Housing Markets (HoHM) Report Nationwide Economics 2016 Q2 Data as of 2016 Q1 HoHM Report Executive Summary: The national LIHHM* remains above the break-even level of 100 and suggests
Nationwide s Health of Housing Markets (HoHM) Report Nationwide Economics 2016 Q2 Data as of 2016 Q1 HoHM Report Executive Summary: The national LIHHM* remains above the break-even level of 100 and suggests
MetroMonitor Tracking Economic Recession and Recovery in America s 100 Largest Metropolitan Areas
 MetroMonitor Tracking Economic Recession and Recovery in America s 100 Largest Metropolitan Areas Howard Wial and Richard Shearer June 2011 (Updated on June 24, 2011) With job growth slowing and housing
Nationwide s Health of Housing Markets (HoHM) Report
 Report") Nationwide s Health of Housing Markets (HoHM) Report Nationwide Economics 2017 Q3 Data as of 2017 Q2 HoHM Report Executive Summary: The national LIHHM* edged down this quarter as unsustainably rapid house
Nationwide s Health of Housing Markets (HoHM) Report Nationwide Economics 2017 Q3 Data as of 2017 Q2 HoHM Report Executive Summary: The national LIHHM* edged down this quarter as unsustainably rapid house
Nationwide s Health of Housing Markets (HoHM) Report
 Report") Nationwide s Health of Housing Markets (HoHM) Report High prices lower the housing market outlook 2017 Q4 (Data as of 2017 Q3) The national LIHHM* declined modestly this quarter as rapid home appreciation
Nationwide s Health of Housing Markets (HoHM) Report High prices lower the housing market outlook 2017 Q4 (Data as of 2017 Q3) The national LIHHM* declined modestly this quarter as rapid home appreciation
Who are the credit invisibles?
 December 2016 Who are the credit invisibles? How to help people with limited credit histories Table of contents Table of contents... 1 Who are the credit invisibles?... 2 Where do the credit invisible
MY PLAN IS GETTING A REBATE FROM THE INSURER WHAT DO I DO WITH IT?
 HUMAN CAPITAL PRACTICE ALERT: HEALTH CARE REFORM BILL August 2012 www.willis.com MY PLAN IS GETTING A REBATE FROM THE INSURER WHAT DO I DO WITH IT? EXECUTIVE SUMMARY All insured employer group medical
Economic Recovery and the EITC: Expanding the Earned Income Tax Credit to Benefit Families and Places Elizabeth Kneebone
 Economic Recovery and the EITC: Expanding the Earned Income Tax Credit to Benefit Families and Places Elizabeth Kneebone The economic recovery package currently under consideration by the U.S. House of
Brown Sugar: Deriving Satisfaction through Data Analysis
 Brown Sugar: Deriving Satisfaction through Data Analysis By: Anirban Basu Sage Policy Group, Inc. December 20 th, 2018 On Behalf of The Mid-Atlantic CIO Forum Disclaimer: Any resemblance between the presentation
Paying Out-of-Pocket
 September 2017 Paying Out-of-Pocket The Healthcare Spending of 2 Million US Families Healthcare costs are rising for families. In 2015 the US spent 18 percent of Gross Domestic Product (GDP) on healthcare,
Employee Benefits Alert
 Employee Benefits Alert September 2005 Issue No. 48 Health Saving Accounts: Comparability Rules The IRS and Treasury recently published proposed regulations concerning the comparability rules for employer
Nationwide s Health of Housing Markets (HoHM) Report
 Report") Nationwide s Health of Housing Markets (HoHM) Report Nationwide Economics 2017 Q2 Data as of 2017 Q1 HoHM Report Executive Summary: The national LIHHM* ticked down just a tad, but the U.S. housing market
Nationwide s Health of Housing Markets (HoHM) Report Nationwide Economics 2017 Q2 Data as of 2017 Q1 HoHM Report Executive Summary: The national LIHHM* ticked down just a tad, but the U.S. housing market
FINANCIAL STATE OF THE CITIES
 FINANCIAL STATE OF THE CITIES An Annual Report by Truth in Accounting www.statedatalab.org January 2019 1 Table of Contents Executive Summary 4 Introduction and Background 5 Summary of Findings 6 Sunshine
Nationwide s Health of Housing Markets (HoHM) Report
 Report") Nationwide s Health of Housing Markets (HoHM) Report Housing outlook still mixed heading into 2019 2018 Q4 (Data as of 2018 Q3) The national LIHHM* has a neutral rating again this quarter, indicative of
Nationwide s Health of Housing Markets (HoHM) Report Housing outlook still mixed heading into 2019 2018 Q4 (Data as of 2018 Q3) The national LIHHM* has a neutral rating again this quarter, indicative of
Nationwide s Health of Housing Markets (HoHM) Report
 Report") Nationwide s Health of Housing Markets (HoHM) Report 2018 Q1 (Data as of 2017 Q4) Low housing inventory heading into selling season The national LIHHM* edged lower this quarter as unsustainably rapid house
Nationwide s Health of Housing Markets (HoHM) Report 2018 Q1 (Data as of 2017 Q4) Low housing inventory heading into selling season The national LIHHM* edged lower this quarter as unsustainably rapid house
Nationwide s Health of Housing Markets (HoHM) Report
 Report") Nationwide s Health of Housing Markets (HoHM) Report Nationwide Economics 2016 Q1 Data as of 2015 Q4 HoHM Report Executive Summary: The national LIHHM* remains above the break-even level of 100, despite
Nationwide s Health of Housing Markets (HoHM) Report Nationwide Economics 2016 Q1 Data as of 2015 Q4 HoHM Report Executive Summary: The national LIHHM* remains above the break-even level of 100, despite
Nationwide s Health of Housing Markets (HoHM) Report
 Report") Nationwide s Health of Housing Markets (HoHM) Report Nationwide Economics 2015 Q3 Data as of 2015 Q2 HoHM Report Executive Summary: The national LIHHM* remains at a level l well over the break-even of
Nationwide s Health of Housing Markets (HoHM) Report Nationwide Economics 2015 Q3 Data as of 2015 Q2 HoHM Report Executive Summary: The national LIHHM* remains at a level l well over the break-even of
Making Home Affordable Program Servicer Performance Report Through December 2009
 EXHIBIT 6 Overview of Administration Housing Stability Initiatives Initiatives to Support Access to Affordable Mortgage Credit and Housing Initiatives to Prevent Avoidable Foreclosures and Stabilize Neighborhoods
Employee Benefits Alert
 Legal & Research Group Benefits Alert Issue No. 24 October 2004 Benefits Brokerage & Consulting Services Rx Purchasing Coalition HR Consulting Data Analysis Benefits Administration Retirement Services
2018 Mortgage Fraud Report SEPTEMBER Mortgage Fraud Report g September 2018
 2018 Mortgage Fraud Report g September 2018 2018 Mortgage Fraud Report SEPTEMBER 2018 i 2018 CoreLogic Proprietary. This material may not be reproduced in any form without express written permission. Table
CoreLogic National Foreclosure Report
 CoreLogic National Report s National Overview through The Inventory Is Down 3 Percent Month Over Month and the Rate Is Back to January 2009 Levels The Seriously Delinquent Rate Is Just Under 5 Percent
We began 2006 in an unusual
 ECONOMIC& REAL ESTATE SM TRENDS In This Issue Local Economic Patterns and MSA Indicators Metropolitan Area Economic Indicators Geographic Distribution of House Price Risk MARK F. MILNER Chief Risk Officer
Mattress Firm s Pending Acquisition of Sleepy s November 30, 2015
 Mattress Firm s Pending Acquisition of Sleepy s November 0, 2015 Forward Looking Statements and Non-GAAP Information This presentation contains forward-looking statements within the meaning of federal
Employee Benefits Alert
 Legal & Research Group Employee Benefits Alert Issue No. 40 June 2005 Legislative & Compliance Benefits Brokerage & HR Consulting Services Rx Purchasing Coalition Data Analysis Benefits Administration
Brown Sugar: Deriving Satisfaction through Data Analysis
 Brown Sugar: Deriving Satisfaction through Data Analysis By: Anirban Basu Sage Policy Group, Inc. March 29 th, 2018 On Behalf of The 2018 Carroll County Economic Outlook Disclaimer: Any resemblance between
Get off of My Cloud 7/20/2018. Brown Sugar: Deriving Satisfaction through Data Analysis CONSUMER CONFIDENCE GLOBAL SNAPSHOT
 Brown Sugar: Deriving Satisfaction through Data Analysis By: Anirban Basu Sage Policy Group, Inc. July 16 th, 2018 On Behalf of Michigan Land Title Association Summer Convention Disclaimer: Any resemblance
Metro Monitor. An index of inclusive economic growth in the 100 largest U.S. metropolitan areas
 Metro Monitor An index of inclusive economic growth in the 100 largest U.S. metropolitan areas By Richard Shearer, Alec Friedhoff, Isha Shah, and Alan Berube March 2017 Summary As 2017 begins, the economy
Barriers to Accessing Homeownership Down Payment, Credit, and Affordability November 2017 HOUSING FINANCE POLICY CENTER
 HOUSING FINANCE POLICY CENTER Barriers to Accessing Homeownership Down Payment, Credit, and Affordability November 2017 Laurie Goodman, Alanna McCargo, Edward Golding, Bing Bai, Bhargavi Ganesh, and Sarah
Nationwide s Health of Housing Markets (HoHM) Report
 Report") Nationwide s Health of Housing Markets (HoHM) Report Nationwide Economics 2015 Q4 Data as of 2015 Q3 HoHM Report Executive Summary: Although down modestly from its peak, the national LIHHM* remains at
Nationwide s Health of Housing Markets (HoHM) Report Nationwide Economics 2015 Q4 Data as of 2015 Q3 HoHM Report Executive Summary: Although down modestly from its peak, the national LIHHM* remains at
PMI MORTGAGE INSURANCE CO. an enhanced U.S. Market Risk Index SM.
 ECONOMIC& REAL ESTATE SM TRENDS In This Issue SUMMER 2007 PMI MORTGAGE INSURANCE CO. New Market; New Model By Mark F. Milner, Chief Risk Officer, PMI Mortgage Insurance Co. SM Risk Overview for Selected
ehealth Inventory Report of Major Medical Health Plans Available Off of Government Exchanges
 ehealth Inventory Report of Major Medical Health Available Off of Government Exchanges February 2014 Introduction Beginning January 1, 2014, all new major medical health insurance plans were required to
CoreLogic National Foreclosure Report
 CoreLogic National Foreclosure Report June 2014 3.9% In June, the foreclosure inventory was down 3.9 percent from May 2014, representing 32 months of consecutive year-over-year declines. While 32 straight
Differences in Health Care Spending of Children and Adults
 Issue Brief #2 July 2012 Differences in Health Care Spending of and Adults 2007 2010 This research brief highlights findings from the Health Care Cost Institute's (HCCI) 's Health Care Spending Report:
Fiscal Fact. Sales Tax Rates in Major U.S. Cities. By Scott Drenkard, Alex Raut, and Kevin Duncan. Executive Summary
 April 11 th, 2012 No. 296 Fiscal Fact Sales Tax Rates in Major U.S. Cities By Scott Drenkard, Alex Raut, and Kevin Duncan Executive Summary Sales taxes in the United States are levied not only by state
FILED: NEW YORK COUNTY CLERK 12/22/ :58 AM INDEX NO /2013 NYSCEF DOC. NO. 95 RECEIVED NYSCEF: 12/22/2017
 Buckingham Badler Assoc., Inc. 286 Richmond Valley Road Staten Island, NY 10309 09/20/2011 Attention: Celeste Regarding: Allerand LLC 500 Greenwich Street #401 New York, NY 10013 Quote Number: XX582725
Employee Benefits Alert
 Employee Benefits Alert Issue No. 21 Legal & Research Group September 2004 Benefits Brokerage & Consulting Services Rx Purchasing Coalition HR Consulting Data Analysis Benefits Administration Retirement
Public Transit: The Funding Crisis and A Need for Action
 Attachment 1 Public Transit: The Funding Crisis and A Need for Action #141603 November 25, 2008 1 Southeastern Wisconsin Needs a Good Public Transit System To meet the travel needs work, education, healthcare,
Coverage Expansion Under the ACA: Challenges for Government, Health Plans, and Providers
 Research Brief Coverage Expansion Under the ACA: Challenges for Government, Health Plans, and Providers Dennis Dunn, PhD Gary Pickens, PhD Beth Schneider, MBA Table of Contents Executive Summary...................................
GWIPP WORKING PAPER SERIES. Have central cities come back? Kimberly Furdell Edward W. (Ned) Hill Harold Wolman
 Hill Harold Wolman") GWIPP WORKING PAPER SERIES Have central cities come back? Kimberly Furdell Edward W. (Ned) Hill Harold Wolman Working Paper Number 5 http://www.gwu.edu/~gwipp/papers/wp005 March 2004 George Washington
GWIPP WORKING PAPER SERIES Have central cities come back? Kimberly Furdell Edward W. (Ned) Hill Harold Wolman Working Paper Number 5 http://www.gwu.edu/~gwipp/papers/wp005 March 2004 George Washington
Economic Risks and Their Meaning for the Southwest STEVE COCHRANE, MANAGING DIRECTOR
 Economic Risks and Their Meaning for the Southwest STEVE COCHRANE, MANAGING DIRECTOR The Europeans Are All-in Composition of the European Central Bank s balance sheet, bil 5,000 Other assets Emergency
For more information, please contact Arch MI at or visit archmi.com. Housing & Mortgage Market Review WINTER 2017
 Housing & Mortgage Market Review WINTER 217 Predictions for 217, 218, and Beyond! 216 was a solid year for housing, with many positive trends. Will these continue? Below are 1 housing market predictions
The 2017 Housing & Economic Outlook
 The 2017 Housing & Economic Outlook Frank E. Nothaft, CoreLogic SVP & Chief Economist @DrFrankNothaft @CoreLogicEcon The views, opinions, forecasts and estimates herein are those of the CoreLogic Office
Comparative Revenues and Revenue Forecasts Prepared By: Bureau of Legislative Research Fiscal Services Division State of Arkansas
 Comparative Revenues and Revenue Forecasts 2010-2014 Prepared By: Bureau of Legislative Research Fiscal Services Division State of Arkansas Comparative Revenues and Revenue Forecasts This data shows tax
2017 Mortgage Fraud Report
 2017 Mortgage Fraud Report Table of Contents Fraud Report National Overview... 1 Factors Affecting Fraud Risk... 2 National Mortgage Fraud Risk Overview...4 National Mortgage Fraud Type Indicators...6
A Local Ladder for Low- Income Workers: Recent Trends in the Earned Income Tax Credit
 The EITC, and increasingly the ACTC, played an important role over the first half of this decade in supplementing the wages earned by lowincome working families. T h e B r o o k i n g s I n s t i t u t
Mortgage Loan Fraud Update
 Financial Crimes Enforcement Network Mortgage Loan Fraud Update Suspicious Activity Report Filings In 3rd Quarter 2011 March 2012 i Table of Contents Introduction 1 Overall Filings 2 Subject Locations
National Foreclosure Report
 National Foreclosure Report AUGUST 20 3.2% In August, the foreclosure inventory was down 3.2 percent from July 20, representing 58 months of consecutive year-over-year declines. Foreclosure inventory fell
Update: 50-State Survey of Retiree Health Care Liabilities Most recent data show changes to benefits, funding policies could help manage rising costs
 A fact sheet from Dec 2018 Update: 50-State Survey of Retiree Health Care Liabilities Most recent data show changes to benefits, funding policies could help manage rising costs Getty Images Overview States
Tax Rates and Tax Burdens in the District of Columbia - A Nationwide Comparison
 Government of the District of Columbia Natwar M. Gandhi Chief Financial Officer Tax Rates and Tax Burdens in the District of Columbia - A Nationwide Comparison 2010 Issued September 2011 Tax Rates and
The Fiscal Year of Memphis Light, Gas and Water has not changed. The fiscal year end remains December 31.
 Electric System Subordinate Revenue Refunding Bonds Series 2008 - Section 4(a)(iii) Electric System Subordinate Revenue Refunding Bonds Series 2010 - Section 4(a)(iii) Electric System Revenue Bonds Series
Magnification of the China Shock Through the U.S. Housing Market
 Magnification of the China Shock Through the U.S. Housing Market Robert C. Feenstra University of California, Davis & NBER Hong Ma Tsinghua University Yuan Xu Tsinghua University January 5, 2019 1 / 27
Economic & Real Estate Trends
 PMI MORTGAGE INSURANCE CO. Economic & Real Estate Trends WINTER 2005 MARCO VAN AKKEREN Economist - Director AYA OGISHI Analyst In This Issue Short Term Interest Rates Continue to Rise Local Economic Patterns
CAPITALIZATION RATES BY PROPERTY TYPE
 RATES BY PROPERTY TYPE MID-YEAR 2014 0 RATES BY ASSET TYPE MID-YEAR 2014 O V E R V I E W Capital continues to flow steadily into the U.S. real estate market, as both domestic and foreign investors increase
Brown Sugar: Deriving Satisfaction through Data Analysis
 Brown Sugar: Deriving Satisfaction through Data Analysis By: Anirban Basu Sage Policy Group, Inc. April 18 th, 2018 WWEMA On Behalf of Washington Forum 45 th Disclaimer: Any resemblance between the presentation
INDUSTRIAL REPORT VIEWPOINT 2017 / COMMERCIAL REAL ESTATE TRENDS. By: Hugh F. Kelly, PhD, CRE. irr.com. An Integra Realty Resources Publication
 INDUSTRIAL REPORT VIEWPOINT 2017 / COMMERCIAL REAL ESTATE TRENDS By: Hugh F. Kelly, PhD, CRE Growing Consumption Fuels the Industrial Sector IRR research indicates that more than half of U.S. industrial
Changes in Health Care Spending in 2011
 Issue Brief #3 September 2012 KEY FINDINGS Changes in Health Care Spending in 2011 A summary of HCCI s Health Care Cost and Utilization Report: 2011 Rising prices drove spending increases for all major
REPORT ON LOCALITY-BASED COMPARABILITY PAYMENTS FOR THE GENERAL SCHEDULE ANNUAL REPORT OF THE PRESIDENT S PAY AGENT 2016 (FOR LOCALITY PAY IN 2018)
") REPORT ON LOCALITY-BASED COMPARABILITY PAYMENTS FOR THE GENERAL SCHEDULE ANNUAL REPORT OF THE PRESIDENT S PAY AGENT 2016 (FOR LOCALITY PAY IN 2018) The President s Pay Agent Washington, DC December 20,
REPORT ON LOCALITY-BASED COMPARABILITY PAYMENTS FOR THE GENERAL SCHEDULE ANNUAL REPORT OF THE PRESIDENT S PAY AGENT 2016 (FOR LOCALITY PAY IN 2018) The President s Pay Agent Washington, DC December 20,
Transmission of material in this release is embargoed until 8:30 a.m. (EDT) Wednesday, October 31, 2012
 Wednesday, October 31, 2012") Transmission of material in this release is embargoed until 8:30 a.m. (EDT) Wednesday, October 31, USDL-12-2162 Technical information: Media contact: (202) 691-6199 NCSinfo@bls.gov www.bls.gov/ect (202)
Transmission of material in this release is embargoed until 8:30 a.m. (EDT) Wednesday, October 31, USDL-12-2162 Technical information: Media contact: (202) 691-6199 NCSinfo@bls.gov www.bls.gov/ect (202)
How Can We Reduce Poverty When It s Spreading Out? Reducing Poverty By Reducing Transportation Burden
 How Can We Reduce Poverty When It s Spreading Out? Reducing Poverty By Reducing Transportation Burden Scott Bernstein, CNT NASEO Annual Meeting September 19, 2017 Issues Where do the poor live? Why are
ROBERTA WYN, STEPHANIE TELEKI, AND E. RICHARD BROWN
 Differences in Access to Health Care Among The Moderate- and Low-Income Population Across Urban Areas ROBERTA WYN, STEPHANIE TELEKI, AND E. RICHARD BROWN Urban areas in the United States vary widely in
ABA Bank Capture Robbery Analysis
 - ABA Bank Capture Robbery Analysis Prepared for: Prepared by: OUTSMART CRIME About the ABA Bank Capture System The ABA Bank Capture system provides a platform for banks to report, share, and analyze bank
Affordable Coverage: Short-Term Health Insurance and the ACA
 Affordable Coverage: Short-Term Health Insurance and the ACA JULY 2018 2 Short-Term Health Plan s Cost 80 Percent Less than Obamacare Plans, ehealth Analysis Finds Short-term health insurance premiums
County of Sonoma Agenda Item Summary Report
 Revision No. 20151201-1 County of Sonoma Agenda Item Summary Report Agenda Item Number: 31h (This Section for use by Clerk of the Board Only.) Clerk of the Board 575 Administration Drive Santa Rosa, CA
City Income Inequality
 CSLF REPORT #1 JUNE 17, 2014 City Income Inequality Lakshmi Pandey David L. Sjoquist Laura Wheeler 2 Introduction A recent report from the Brookings Institution (Berube 2014) explored the income inequality
Regarding: Suspicious Vehicle Collision Questionable Claim Referrals in the United States, 2010 and 2011 (External Dissemination) Executive Summary
 Executive Summary") Date: Regarding: Suspicious Vehicle Collision Questionable Claim Referrals in the United States, 2010 and 2011 (External Dissemination) Prepared By: Kaneidra Everson, Analyst Executive Summary This ForeCAST
Date: Regarding: Suspicious Vehicle Collision Questionable Claim Referrals in the United States, 2010 and 2011 (External Dissemination) Prepared By: Kaneidra Everson, Analyst Executive Summary This ForeCAST
PMI MORTGAGE INSURANCE CO.
 ECONOMIC& REAL ESTATE SM TRENDS SPRING 2008 PMI MORTGAGE INSURANCE CO. In This Issue Economic Trends in the Nation s MSAs PMI U.S. Market Risk Index Model Geographic Distribution of House Price Risk DAVID
Insufficient and Negative Equity
 Insufficient and Negative Equity Lack Of Equity Impedes The Real Estate Market Mark Fleming Chief Economist December, 2011 70% 60% 50% 40% 30% Negative Equity Highly Concentrated Negative Equity Share,
medicaid a n d t h e How will the Medicaid Expansion for Adults Impact Eligibility and Coverage? Key Findings in Brief
 on medicaid a n d t h e uninsured July 2012 How will the Medicaid Expansion for Adults Impact Eligibility and Coverage? Key Findings in Brief Effective January 2014, the ACA establishes a new minimum Medicaid
Medicare Secondary Payer Rules Tighter Enforcement?
 Executive Signal Issue 5 October 2007 Medicare Secondary Payer Rules Tighter Enforcement? Earlier this year the White House web site featured an article outlining President Bush s proposed budget for 2008.
State of the U.S. Multifamily Market. Q Review and Forecast
 State of the U.S. Multifamily Market Q1 2015 Review and Forecast Agenda Economy Leasing Fundamentals Rent and NOI Trends Single-Family Market Capital Markets Economy page 3 GDP Growth Contributions To
FORM G-37. Name of Regulated Entity: Citigroup Global Markets Inc. Report Period: Fourth Quarter of 2017
 FORM G-37 Name of Regulated Entity: Citigroup Global Markets Inc. Report Period: Fourth Quarter of 2017 I. CONTRIBUTIONS made to officials of a municipal entity (list by state) Complete name, title (including
Markets, He Wrote. Northeastern Economy and Multifamily Real Estate. By: Anirban Basu Sage Policy Group, Inc.
 Markets, He Wrote Northeastern Economy and Multifamily Real Estate On Behalf of Eastern Lenders Association 2017 Annual Conference By: Anirban Basu Sage Policy Group, Inc. February 7 th, 2017 Macro P.I.
2015 Hilton Head Island Wingfest
 2015 Hilton Head Island Wingfest March 20 and 21, 2015 Lowcountry and Resort Islands Tourism Institute at USCB Kelli Brunson Adam Davis Catherine Moorman Dr. John Salazar 406 Total Responses Date Created:
FORM G-37. Name of Regulated Entity: J.P. Morgan Securities LLC. Report Period: Fourth Quarter of 2016
 Name of Regulated Entity: J.P. Morgan Securities LLC Report Period: Fourth Quarter of 2016 I. CONTRIBUTIONS made to officials of a municipal entity (list by state) Complete name, title (including any city/county/state
2014 Hilton Head Island Burgers and Brew Festival
 2014 Hilton Head Island Burgers and Brew Festival Lowcountry and Resort Islands Tourism Institute at USC Beaufort Kelli Brunson Catherine Moorman Timothy Luke Stiltner Dr. John Salazar 325 Total Responses
Tax Freedom Day 2019 is April 16th
 Apr. 2019 Tax Freedom Day 2019 is April 16th Erica York Economist Madison Mauro Research Assistant Emma Wei Research Assistant Key Findings This year, Tax Freedom Day falls on April 16, or 105 days into
Paycheck to Paycheck:
 New Century Housing Volume 2, Issue 2 Center for Housing Policy/National Housing Conference May 2003 Paycheck to Paycheck: Wages and the Cost of Housing in America Paycheck to Paycheck: Wages and the Cost