Forester Life Limited and Forester Holdings (Europe) Limited. Solvency and Financial Condition Report ( SFCR )
|
|
|
- August Wiggins
- 5 years ago
- Views:
Transcription
 31 December,")
1 Forester Life Limited and Forester Holdings (Europe) Limited Solvency and Financial Condition Report ( SFCR ) 31 December,
2 Contents 1. Summary Business and performance summary System of governance summary Risk profile summary Valuation for solvency purposes summary Capital management summary A Business and Performance A.1 Business A.2 Underwriting performance A.3 Investment performance A.4 Performance of other activities B System of governance B.1 General information on the system of governance B.2 Fit and proper requirements B.3 Risk management system including the ORSA B.4 Internal control system B.5 Internal audit function B.6 Actuarial function B.7 Outsourcing C Risk Profile C.0 Overview of the company risk profile C.1 Underwriting risk - Life insurance (including health similar to life) C.2 Market risk C.3 Credit risk C.4 Counterparty risk C.5 Liquidity risk C.6 Operational risk C.7 Changes to the risk profile in the reporting period C.8 Future changes to risk profile D Valuation for Solvency Purposes D.1 Assets D.2 Technical provisions D.3 Other liabilities E Capital Management E.1 Own Funds
3 E.2 Solvency Capital Requirement and Minimum Capital Requirement F Templates G Validations H Approval by the Administrative, Management or Supervisory Body AMSB of the SFCR and reporting templates Independent Auditors' Report
4 1. Summary 1.1 Business and performance summary Forester Holdings (Europe) Limited ( FHE ) is a holding company for the UK business of the Independent Order of Foresters ( IOF ). The Group comprises Forester Life Ltd ( the Company or FLL ) and its subsidiaries Forester Investments Ltd ( FIL ) and Forester Fund Management Ltd ( FFML ). The principle entity within the Group is FLL which is a life insurance company based in the United Kingdom, which offers personal insurance products, mortgage protection solutions, individual savings accounts and investment solutions, pension planning solutions, and savings solutions for children. FIL acts as a holding company of FFML which is a UK based company whose principle activity was to provide Child Trust Fund and Junior ISA accounts as long-term savings products for children. In January 2017 all of the business of FFML was transferred into the Company. FFML was de-authorised in 2018 as a regulated entity following this transfer. Structure of the Group The UK Group ( the Group ) includes all active UK legal entities (see chart below). The Group carries out business in the UK, currently consisting of: Investment business, principally stakeholder products, in FLL together with a large book of Child Trust Funds ( CTFs ) (formerly in FFML but transferred to FLL in January 2017); Administration of three closed with profits funds; Annuity and protection business. The following chart details the operational subsidiaries of the Group. FLL operates four ring-fenced funds ( RFFs ) alongside the Ongoing Business Fund ( OBF ) and Shareholder Fund ( SHF ) as set out below: FHE FLL FIL FFML Tunbridge Wells Fund (TWF) Communications Workers Fund (CWF) Foresters With- Profits Fund (FLWPF) Deferred Pensions Fund (DPF) Ongoing Business Fund (OBF) Shareholder Fund (SHF) Ring-fenced fund 4
5 The RFFs consist of: Tunbridge Wells Fund ( TWF ): The TWF was transferred to the Company in 2013 from Tunbridge Wells Equitable Friendly Society ( TWEFS ) and is closed to new business. Existing policyholders hold various investment and insurance based products, including pensions, annuities, traditional life, unit-linked and with-profits. Communication Workers Fund ( CWF ) The CWF was transferred to the Company in 2011 from the Communication Workers Friendly Society ( CWFS ) and is closed to new business. Existing policyholders hold various investment and insurance based products, including with-profits. Existing policyholders are eligible for policyholder loans. Forester Life With-Profits Fund ( FLWPF ) The FLWPF was originally a branch of its Canadian parent providing protection and savings products. The business of the FLWPF was transferred to the Company in This fund is closed to new business, although premiums on in-force business continue to be paid into it. Existing policyholders are eligible for policyholder loans. Deferred Pensions Fund ( DPF ) This business was originally part of the on-going business fund and was ringfenced in It consists of pension products whereby contributions are invested on the policyholder s behalf by the Company. On retirement or transfer out on or after the original selected retirement date, or on death, a terminal bonus may be added to the policyholder s notional fund. The terminal bonus rates allow for one-ninth of the terminal bonuses to be distributed to the Company. Policyholders of the On-going business fund ( OBF ) hold various investment and insurance based products including unit-linked, traditional life and annuities. The largest proportion of the fund is in respect of the open book of unit linked business. A summary of the performance of the Group during 2017 is set out below: Sales of unit linked business, including CTFs previously reported within FFML, measured by the accepted method of counting single premiums and contributions as 10% of the amount received for the year were 53.8m, 28% higher than 2016 ( 41.9m). Overall contributions and premium income were 345.4m, a 7.5% increase from 2016 ( 321.2m) as the contributions from the open unit linked book continue to grow while the premium income from the closed book of with-profit funds decline. 5
6 Total assets under management rose by 9.6% to 4.2bn (2016: 3.8bn) with the unit linked business bringing in an additional 402.2m driven by both net inflows and investment returns. A small decrease of 45.9m from invested assets of insurance business is driven by net outflows offset by investment returns in the year. The significant increase in gross investment returns arose from favourable markets, particularly the global equity market. Operating expenses were 32.1m, a fall of 47.1% from m. Against the prior year, with the exception of the one off 23.2m relating to the Capita termination fee and other insourcing related costs, the cost saving is mainly driven from the inhouse expenses for managing the CTF business being substantially lower than the outsourced service provider. Offsetting the decrease in operating expenses are higher project costs and increased cost of sales associated with higher sales. See Section A for further details on the business and performance of the Group. 6


7 1.2 System of governance summary The Group recognises the importance of strong corporate governance and has established a well-defined governance framework, system of control and committee structure. An overview of the Board and its committees is set out below: FLL and FHE Board Audit & Compliance Committee Risk & Investment Committee With Profit Fund Advisory Panels The Board sets and monitors adherence to the risk strategy, risk appetite and risk framework. The Board has established a risk management model that separates the business s risk management responsibilities into three lines of defence as shown in the diagram below. Coresters UK Droup Risk Dovernance Three Lines of Defence 1 st Line of Defence 2 nd Line of Defence 3 rd Line of Defence Day to day risk management and control Risk oversight, policy and methodologies Independent Assurance FORESTERS UK GROUP BOARDS Delegates To Delegates To Delegates To UK ELT AUDIT AND COMPLIANCE COMMITTEE RISK AND INVESTMENT COMMITTEE AUDIT AND COMPLIANCE COMMITTEE Activity is Carried hut By Activity is Carried hut By Activity is Carried hut By Forester Staff Risk Management function Internal Audit Compliance Function 7
8 1st Line of Defence Under the first line of defence, operational management has ownership, responsibility and accountability for assessing, controlling and mitigating risks. In particular the first line owns and manages its risks within the agreed risk appetite and in compliance with the risk policy framework. Risk matters are discussed on a regular basis by the UK Executive Leadership Team ( UK ELT ) based on a report produced by the Risk team. 2nd Line of Defence The second line of defence is responsible for the provision of proportionate oversight of risks, issues and events through the Risk Management and Compliance functions. It determines and develops the risk management framework and tools for agreement by the Board which the 1 st line uses to discharge its responsibilities. It advises the Board on its risk appetite and supporting the business in its application and monitors and reports on key risks against risk appetite. The second line provides oversight, challenge and support to the 1 st line in the management of their risks. The Chief Risk Officer is independent of the business functions and works closely with the Global Chief Risk Officer to ensure the effective and efficient operation of the risk framework. The Audit & Compliance and Risk & Investment Committees take reports from the Risk Management and Compliance functions on the Board s behalf and provide recommendations to the Board as appropriate. 3rd Line of Defence This recognises that, aside from the reports received from the Risk Management and Compliance functions, the Board requires independent assurance that the control framework in place exercised through the 1st and 2nd lines of defence is operating in line with expectations and that therefore risk appetite limits are being observed. This assurance is gained through the Internal Audit function performing risk based audits under the guidance of the Audit & Compliance Committee and providing an objective view of the effectiveness of risk management and controls. See Section B for further details on the system of governance of the Group. 8
9 1.3 Risk profile summary The Standard Formula risk profile for the Group, pre diversification, is set out below: Capital Requirements by risk: Pre-Diversification 8% 2% 5% 2% 5% 8% 31% 39% Persistency Risk Equity Risk Expense Risk Currency Risk Mortality Risk Counterparty Default Risk Operational Risk Other The main standard formula Solvency Capital Requirement ( SCR ) risks are persistency and equity risks. Included within other risks is Property risk, Mortality risk, Longevity risk and Catastrophe risk. See Section C for further details on the risk profile and Section E.2 for SCR results. 1.4 Valuation for solvency purposes summary A summary of the differences between International Financial Reporting Standards ( IFRS ) and Solvency II ( SII ) valuations for assets and liabilities are set out below: 31 December, 2017 ( '000) FLL FHE Group Total IFRS equity 96, ,935 Adjustments for Solvency II Difference in assets (29,959) (38,314) Difference in technical provisions 280, ,331 Difference in other liabilities (21,641) (40,112) SII value of assets over liabilities 325, ,839 9
10 31 December, 2016 ( '000) FLL FHE Group Total IFRS equity 98,840 95,957 Adjustments for Solvency II Difference in assets (44,927) (56,633) Difference in technical provisions 109, ,480 Difference in other liabilities (8,813) (3,162) SII value of assets over liabilities 154, ,643 The valuation of assets and liabilities for Solvency II purposes are the same as IFRS apart from the following key differences: differences in the valuation of technical provisions and associated reinsurance recoverables; intangible assets are permitted under IFRS, but not under Solvency II; and differences in deferred tax liabilities due to the above adjustments. The key valuation differences for assets and liabilities between FHE Group and FLL are as follows: Investment in FFML: FFML is held on the balance sheet of FLL at the fair value of net assets. For FHE Group, FFML is not consolidated, but included in the Group balance sheet based on sectoral rules. Following the de-authorisation of FFML in 2018 the requirement for valuation of FFML under sectoral rules ceases. See Section D.1 for further details. Technical provisions: Technical provisions within FLL include a service charge with FHE. On consolidation this charge is eliminated, which is why technical provisions are higher within FLL compared to FHE Group. See Section D.2 for further details. Deferred tax: the deferred tax liability valuation differs between FLL and FHE Group due to the adjustments mentioned above. See Section D.3 for further details. Pensions liability: The Group has two staff pension schemes; Forester Group Employee Pension Scheme ( FGEPS ), which is held in FHE and Tunbridge Wells Retirement Benefit Scheme ( TWRBS ), which is held within FLL, therefore there is no allowance for FGEPS in the FLL balance sheet. However, in the Group balance sheet, the deficit and expected future contributions of FGEPS are held as a liability. See Section D for further details on the valuation for solvency purposes of the Group. 10
11 1.5 Capital management summary The key highlights of the Group and FLL Solo Solvency II position at Year End 2017 and 2016 are set out below: 31 December, 2017 ( 000) FLL FHE Group SII value of assets over liabilities 325, ,839 Own Fund adjustments (49,932) (50,613) SII Own Funds 275, ,226 Solvency Capital Requirement ('SCR') 195, ,148 Minimum Capital Requirement ('MCR') 48,806 49,537 SCR coverage ratio 141% 139% MCR coverage ratio 564% 558% 31 December, 2016 ( 000) FLL FHE Group SII value of assets over liabilities 154, ,643 Own Fund adjustments (51,843) (43,395) SII Own Funds 103, ,248 Solvency Capital Requirement ('SCR') 73,653 75,773 Minimum Capital Requirement ('MCR') 18,413 18,943 SCR coverage ratio 140% 138% MCR coverage ratio 531% 492% The key valuation differences for Own Funds between FHE Group and FLL are as follows: The value of FFML within the solo balance sheet of FLL is based on IFRS valuation restricted to 10% of unrestricted Own Funds. The value of FFML within FHE is based on sectoral rules and is not impacted by the 10% restriction. While in 2016 this resulted in a different valuation on these two bases, in 2017 there is no impact on solvency. The value of FFML in FLL has been impaired on an IFRS basis and the 10% rule does not require any further restriction on valuation of FFML in FLL. See Section E.1 for further details. The key differences for the SCR between the FHE Group and the FLL Company are with regards to net assets held on the FHE balance sheet (principally a defined benefit pension scheme), the expense margin charge by FHE to FLL and the recognition of capital requirement of FFML under asset management rules for the assessment of the overall Group solvency position. Post de-authorisation of FFML in 2018 this requirement no longer applies. See Section E.2 for further details. The objective of the Group s capital management framework is to maintain sufficient Own Funds to cover the SCR and MCR with an appropriate buffer. The Group carries out regular reviews of the Solvency Ratio as part of the Group s risk monitoring and capital management system. See Section E for further details on the capital management of the Group. 11
 is a Canadian based entity and is the ultimate parent of the Foresters worldwide group.")
12 A Business and Performance Section A is unaudited A.1 Business A.1.1 Group structure The full UK corporate structure including the overseas parent is shown below. The Independent Order of Foresters ( IOF, the Enterprise ) is a Canadian based entity and is the ultimate parent of the Foresters worldwide group. Foresters Holdings (Europe) Ltd ( FHE ) is a private limited company and is the parent company of the UK Group. Forester Holdings (Europe) Ltd ( FHE ) is the UK insurance holding company Forester Life Ltd ( FLL ): This is an insurance company authorised and regulated by the Prudential Regulation Authority ( PRA ) and regulated by the Financial Conduct Authority ( FCA ). Forester Fund Management Ltd ( FFML ): This is an asset management business and was authorised and regulated by the Financial Conduct Authority ( FCA ). Following transfer of its business into FLL the entity was de-authorised early in All UK subsidiaries are wholly owned. The principal operating subsidiary is FLL. The remaining entities are non-trading or dormant. 12
13 A.1.2 Company auditors All non-dormant entities within the Group are audited by KPMG LLP, contact details as follows: KPMG LLP 15 Canada Square Canary Wharf London E14 5GL Tel: Fax: A.1.3 Supervisory authority The supervisory authority of both FLL and FHE is the Prudential Regulation Authority ( PRA ), contact details as follows: Prudential Regulation Authority 20 Moorgate London EC2R 6DA Tel: FLL is also regulated by the Financial Conduct Authority ( FCA ), contact details as follows: Financial Conduct Authority 25 The North Colonnade London E14 5HS Tel: A.1.4 Material lines of Business The material Solvency II lines of business of the Group are as follows: Index-linked and unit linked insurance Insurance with profit participation Health insurance Other life insurance All of the Group s business is conducted in the UK. A.1.5 Significant business or other events that have occurred during the period During the year the Group concentrated its efforts on completing a number of infrastructure enhancements including the migration of the administration of policies of the TWF to NAS, the Group s primary operating system. This initiative will benefit the business by simplifying product administrative processes and providing more accurate operational analysis. Additionally, we have implemented a new HR and payroll system that enables further operational efficiency in the HR and payroll areas. Such initiatives continue to support the Group s long term strategy of expansion through organic growth via multiple sales channels. The Group has continued to grow its core business in 2017 in a highly competitive market. Sales have increased by 26% from prior year. The main sales growth has 13
14 been in unit linked products, including Stocks & Shares Individual Savings Accounts (ISAs) sold via a direct sales force providing basic advice. Additionally, direct and internet sales of unit linked products have contributed more significantly to the new business in 2017 with over 23% (2016: 7.7%) sold through this channel. The significant increase was due to the inclusion of top ups for CTF business previously reported within FFML. Sales of unit linked business, including CTFs previously reported within FFML, measured by the accepted method of counting single premiums and contributions as 10% of amount received for the year were 53.8m, 28% higher than 2016 ( 41.9m). Overall contributions and premium income were 345.4m, 7.5% higher than 2016 ( 321.2m) as the contributions from the open unit linked business continue to grow while the premium income from the closed book of with-profits funds declined. Total assets under management rose by 9.6% to 4.2bn (2016: 3.8bn) with the unit linked business bringing in an additional 402.2m versus a small decrease of 45.9m from invested assets of insurance in closed with-profits business. The significant increase in assets under management arose from favourable markets, particularly the global equity market, which has further strengthened the strong net inflows on the open book of unit-linked business. Operating expenses were 32.1m, a reduction of 47.1% from 2016 ( 61.3m). Against the prior year, with the exception of the one-off 23.2m Capita termination fee, the cost saving is mainly driven from the in-house expenses for managing the CTF book of business being substantially lower than the outsourced service provider. Offsetting the decrease in expenses are higher project costs and increased cost of sales associated with higher sales. The Company continued to improve customer outcomes for TWF policyholders. The Company s regulatory solvency capital coverage position is 141% in line with 2016 numbers. This remains in excess of the risk appetite and the position is expected to improve as the cost savings of bringing CTF book in house are realised in the future. A.1.6 Related party transactions Related party transactions within the Group arise as follows: FHE incurs substantially all the operating costs for the Company s UK business and recharges the appropriate share to FLL for settlement in cash. FLL owns the building housing the UK Head Office and charges rent to FHE. FLL employs all of the salesforce employees and FHE employs Foresters UK Head Office employees and acts as principal employer for the pension scheme in the UK ( FGEPS ). FLL has an excess of loss reassurance treaty with its ultimate parent company in respect of large sums assured on individual life contracts. Settlement is made quarterly through FHE. FHE previously contracted with FLL to provide permanent health insurance for Foresters UK employees. Premiums are no longer paid but claims may be made in respect of coverage previously provided. 14
15 Operating costs recharged by FHE to other companies within the Group (including a charge in respect of salaries, pension contributions and other pension costs) were 33.5m (2016: 30.1m). Rent charged to FHE by FLL was 0.3m (2016: 0.3m). Intercompany creditor balances at Year End 2017 between FLL and FHE were 3.4m (2016: 4.8m). All related party transactions have taken place at terms that would exist in arm s length transactions. The intercompany creditor balances are unsecured and settled on a regular basis. There are no other loans or guarantees provided by the Company to related parties and no dividends have been paid to the ultimate parent company The Independent Order of Foresters. A.2 Underwriting performance Since FLL prepares its financial statements in accordance with IFRS, the underwriting performance information given in this section is on an IFRS basis. Qualitative and quantitative information on FHE and FLL s underwriting performance by line of business as shown in the financial statements with a comparison to the previous reporting period is detailed below: A.2.1 Written premiums The following table details written premiums during the year with a comparison to the prior year as per the IFRS financial statements of FLL: ( 000) Gross Net Gross Net Life contracts 28,552 27,849 35,386 34,654 Pension contracts 3,633 3,633 1,279 1,272 Total 32,185 31,482 36,665 35,926 Participating contracts 22,021 21,498 31,643 31,643 Non-participating contracts 5,710 5,530 4,418 3,686 Unit linked contracts 4,454 4, Total 32,185 31,482 36,665 35,926 Periodic premiums 30,820 30,117 35,160 34,421 Single premiums 1,365 1,365 1,505 1,505 Total 32,185 31,482 36,665 35,926 Net written premiums have decreased as the ring-fenced funds are in run-off and therefore premiums are declining year-on-year. All business is written within the UK. 15
16 A.2.2 Claims incurred The following table details claims incurred during the year with a comparison to the prior year as per the IFRS financial statements of FLL: ( 000) Gross policyholder benefits and payments 89,587 93,980 Change in Gross insurance contract liabilities (49,933) (3,631) Change in Ceded insurance contract liabilities (1,811) (270) Total 37,843 90,079 A.3 Investment performance Qualitative and quantitative information on FLL s investment performance by asset class with a comparison to the previous reporting period is detailed below: ( 000) Interest income Cash and cash equivalents 6 33 Bonds and other fixed term securities 18,366 19,284 Loans to policyholders Total interest income 18,650 19,609 Dividend income - 1,972 Realised gains 109,721 59,134 Unrealised gains/(losses) 205, ,463 Net return on financial assets 333, ,178 Net rental income Unrealised gains/(losses) Net return/(loss) on investment properties 456 1,216 Investment expenses (6,366) (2,628) Total investment income 327, ,766 Change in investment contract liabilities (296,233) (119,653) *Total investment income net of change in investment contract liabilities 31,456 74,113 * Total investment income net of change in investment contract liabilities relates to investment income generated by the ring-fenced funds, non-profit business and shareholder funds. The decrease from 2016 is as a result of lower investment yields in 2017 when compared to Investment income has increased significantly in comparison to the prior period as a result of the transfer of the FFML book of business into FLL. The FFML assets under management were formerly not reported on the balance sheet in line with asset management IFRS reporting rules, but following the transfer into FLL, 2bn of assets under management were recognised from which investment returns were generated and reported. 16
17 The increase in investment contract liabilities mirrors the increase in investment performance during the year. The inclusion of FFML assets and growth of net flows were the main contribution of this increase. Offsetting this increase is the change in insurance contract liabilities. A.4 Performance of other activities Qualitative and quantitative information on FLL s performance of other activities with a comparison to the previous reporting period is detailed below: ( 000) Fee income 46,699 36,854 Fee income relates to the annual management charges levied on the investment business. The fee income has increased significantly when comparing 2017 to The fee income is based on the value of assets under management ( AUM ) over the year, which have increased significantly compared to the prior year. 17
18 B System of governance Section B is unaudited B.1 General information on the system of governance The Group s organisational structure and relationship to its parent is clearly defined, with the roles of Chairman of the Board and the Chief Executive Officer ( CEO ) clearly differentiated and separate. The Chairman is responsible for leading the Board while the CEO is responsible for implementing strategy and managing the Group through an executive team. There have been no material changes in the system of governance over the reporting period. The structure of the Board and Board Committees of the active companies in the UK Group is set out below: FLL and FHE Board Audit & Compliance Committee Risk & Investment Committee With Profit Fund Advisory Panels FLL and FHE Board The Board of each company within the Group has the following general responsibilities: To develop and maintain the strategy of the Group and ultimately to be responsible for the management and oversight of the Group s business by reference to its agreed risk appetite. To ensure that the Group s business is conducted with integrity and in compliance with general statutory and regulatory provisions so as to protect the respective interests of policyholders, creditors and other stakeholders. To comply with the policies of ultimate parent company insofar as they apply to the Group. To comply, as appropriate, with the requirements of the primary regulators, being the Prudential Regulation Authority (PRA) and the Financial Conduct Authority (FCA) and those of ultimate parent s regulator where applicable. 18
19 The Board s specific responsibilities include the following and are exercised within the framework of the ultimate parent s overall strategy, and its enterprise wide policies, as applicable: Strategic planning; Risk management; Capital management; Investment policy; Significant transactions, contracts or expenditures; Financial reporting; Ring Fenced Funds; Approval of key documents and policies; Corporate governance structure; Board membership; Appointment and oversight of the UK Group CEO; Internal control and management information systems; Prevention of fraud; Standards of business conduct and ethical behaviour; Records; and Board performance and effectiveness. Audit & Compliance Committee The Audit & Compliance Committee acts as an advisory committee to all of the Boards of all of the active Forester UK companies (these being FHE and FLL). The Audit & Compliance Committee has been delegated responsibility by the Board for ensuring the integrity of each company s: financial reporting, including any regulatory financial reports; compliance function; systems of internal control; and internal and external audit functions. In doing so, it provides regular reports to the respective Boards on its activities together with accompanying recommendations for action as appropriate. The Committee is authorised by the Board to investigate any activity within its terms of reference. The Committee is authorised to obtain independent professional advice where necessary, at the Company s expense, and to require the provision of any information from any Director or employee of the Group. All employees are to cooperate as requested by the Committee. The Committee is drawn from the Independent Non-Executive Directors that sit on the FLL Board of Directors and at least one member has recent and relevant financial experience. Other Board directors will typically be invited to be in attendance at the Committee meetings. The Committee meets as and when it deems necessary, provided that it shall meet at least four times each year in order to provide input to the quarterly Group Board meetings. Other than in an emergency, at least two days notice of any additional meeting shall be given to all members of the Committee. 19
20 During 2017 the following individuals attended at all meetings unless requested otherwise: the Chief Executive Officer; the Chief Finance Officer; the Chief Risk Officer; the Chief Internal Auditor; the Chief Compliance Officer and Company Secretary; the Chief Actuarial Officer; and the Chief Actuary (Actuarial Function Holder). Financial Reporting and Internal Control In carrying out its mandate for financial reporting and internal control, the Committee is responsible for: with respect to financial statements: o reviewing and, when satisfied as to completeness, fairness and conformity with generally accepted accounting principles, recommending to the Board, approval of the annual audited financial statements and returns required by regulatory authorities. This includes, but is not limited to making inquiries of the external auditors whether their annual audit has been effectively carried out and completed, and whether accounting policies and disclosures used in the financial statements, and any changes thereto from the previous year are appropriate; o reviewing and monitoring accounting and regulatory developments and reviewing and approving management s recommendations on accounting policies and changes to accounting policies, and asking the auditors for their comments and views where appropriate; inquiring as to the independence/objectivity of the internal and external auditors, taking into consideration relevant UK (and where appropriate Canadian) professional and regulatory requirements. reviewing and approving the external auditors engagement letter and audit plan for Group and recommending to the Board the compensation of the external auditor, including any fees with respect to approved non-audit related work (e.g., tax advisory services) and approval of any special work within a policy that provides the parameters for such work; assessing the performance of the external auditors with respect to the Group and recommending to the Board, the appointment or discharge of the external auditors whilst also having regard for consulting fees; reviewing the external auditor, internal auditor, and regulatory reports, and management letters, and obtaining satisfaction that any issues raised are appropriately resolved by management; exercising an active oversight role with respect to the internal control and internal audit function with the principal activities being: o meeting regularly with the Chief Internal Auditor, and Senior Management of the Group to discuss the effectiveness of the internal control procedures including controls related to the identification, prevention and detection of fraud; o meet at least once a year with the external auditors to discuss the effectiveness of internal controls; o to approve internal audit plans for the Group with the Chief Internal Auditor and Senior Management, with the principal aim of ensuring that any such plans are responsive to the risk profile of the organisation; o assessing the performance of the internal audit function for the Group; 20
21 o o o making inquiries to satisfy itself that internal audit objectives and goals, staffing plans, financial budgets and audit timetables provide for adequate support of the Committee s own goals and objectives; reviewing summary reports prepared by the internal audit function of reviews carried out and to consider management responses to any findings and thereafter to monitor progress against agreed corrective actions; and review at least annually the audit charter that is approved by the Shareholder. requesting Internal Audit to perform special duties, investigations, or other services on matters of interest or concern to the Committee as and when necessary; receiving and reviewing any quality assurance reviews of the Foresters Internal Audit functions, (which should take place at least every five years) to provide the Committee with the assurance that the internal audit operations conforms to appropriate standards such as the Institute of Internal Auditors Standards for the Professional Practice of Internal Auditing; overseeing and monitoring compliance with the Group outsourcing policy and related regulatory guidelines; ensuring that the financial reporting and internal control framework remain responsive to emerging business and regulatory requirements such as the Solvency II initiative; and to review arrangements by which staff may, in confidence raise concerns about possible improprieties in matters of financial reporting or other matters, with the objective of ensuring that arrangements are in place for the proportionate and independent investigation of such matters and for appropriate follow-up action (whistleblowing). Compliance In carrying out its mandate for monitoring the Compliance function, the Committee is responsible for: the monitoring and review of the effectiveness of Compliance, both generally and against the stated roles and responsibilities of Compliance; approval of an effective annual compliance programme with the Chief Compliance Officer; reviewing any reports on the Group by the PRA or FCA, or any other regulator and to consider management responses to any findings and thereafter to monitor progress against agreed corrective actions; and reviewing the Compliance monitoring reports (which should include information regarding complaints and TCF) quarterly, or as they are issued, and to discuss and consider problems and reservations arising from compliance monitoring. Other In addition to the above, the Committee also: evaluates its own collective performance at least annually; and review annually these terms of reference and either recommend changes to the Board or confirm to the Board that no changes are required. 21
22 Risk & Investment Committee The Risk & Investment Committee is an advisory committee to all of the Boards of all of the active Forester UK companies. The Risk & Investment Committee is responsible for ensuring the integrity of the Group s: investment strategies and performance monitoring; risk management practices; and capital management. In doing so, it provides regular reports to the Board on its activities together with accompanying recommendations for action as appropriate. The Committee is authorised by the Board to investigate any activity within its terms of reference. The Committee is authorised to obtain independent professional advice where necessary, at the Company s expense, and to require the provision of any information from any Director or employee of the Company. All employees are required to cooperate as requested by the Committee. The Committee meets as and when it deems necessary, provided that it meets at least four times each year in order to provide input to the quarterly Group Companies Board meetings. During 2017 the following individuals attended at all meetings unless requested otherwise: the Chief Executive Officer; the Chief Finance Officer; the Chief Risk Officer; the Chief Internal Auditor; the Chief Compliance Officer and Company Secretary; the Chief Actuarial Officer; and the Chief Actuary (Actuarial Function Holder). Investment Strategy In carrying out its mandate for investment strategy, the Committee is responsible for: formulating and recommending to the Board appropriate investment policies, strategies and procedures for the Group, including determining performance benchmarks, consistent with the Companies business plans and appetites for investment risk, having regard to liabilities, relevant regulatory requirements and the reasonable expectations of customers and taking account of the recommendations of the Chief Actuary and the With Profits Actuary; reviewing and recommending to the Boards amendments to such policies, strategies and procedures from time to time; ensuring that such policies, strategies and procedures are being followed and that: a) the interests of both policyholders and the shareholder are adequately protected; b) applicable regulatory requirements are fully complied with; and c) (subject to (a) and (b)) investment decisions are consistent with the declared strategic objectives and financial interests of IOF, in its capacity as the ultimate parent of the Group; 22
23 acting as a forum for the reporting and discussion of the Group Companies investment performance, including the performance of the UK Investment Funds; considering and recommending to the Board decisions on matters that may arise from time to time in relation to the conduct of the Group investment business, which will most readily contribute to the performance, protection and security of all investment funds under the management of the Group, including, at least annually, the asset allocation criteria within which the Companies fund managers are required to operate; reviewing the terms of any proposed contract for the appointment of any external fund manager and to making recommendations on such appointment to the Board; and reviewing the appointments of all external fund managers on a rolling basis to consider the appropriateness of their ongoing appointment having regard to their performance compared with those of their peers and the terms of their respective contracts. To assist the Committee in its consideration of the above, the Committee receives at each meeting such formal written or oral reports as it may request, and will use those reports as the basis for its own reports to the Boards. These formal written reports will in any case include a report from the Chief Financial Officer showing the degree to which Group investment policies, strategies, and procedures have been duly complied with, and the extent to which those strategies, policies and procedures and the Companies investment performance: adequately protect the interests of customers and policyholders satisfy regulatory requirements, and are consistent with the approved business plans of the Group. Risk management In carrying out its mandate for risk management, the Committee is responsible for: reviewing the Group s risk management framework, including its risk appetite, tolerances and policies by reference to current and relevant information and making such recommendations to the Board thereon as considered necessary; considering whether appropriate arrangements are in place to effectively manage and mitigate risks affecting the Group, including whether the risk management function has appropriate resources and authority to ensure compliance with Group policies and procedures; reviewing at least quarterly the risk exposures facing the Group as well as the actions being taken to manage and/or mitigate these risks; considering the completeness of the risk profile presented and evaluating potential emerging or new risk issues facing the Group; considering whether risk exposures are being managed within approved risk appetite and tolerance levels and reviewing the adequacy of management actions and plans where levels of risk are in excess of tolerances; challenging whether additional actions may be necessary to mitigate material risk exposure or respond to emerging risk issues; and providing a report to the next scheduled Board meeting (or sooner if considered necessary) of its conclusions as a result of consideration of the foregoing, together with recommendations for action as considered appropriate; and to assist the Committee in its consideration of the above, the Committee will receive at each meeting such formal written or oral reports as it may request, which will include the following: o report of risk exposures measured against approved tolerances; 23
24 o o o details of the risk assessment process that has been carried out across the Group or, if not, the areas of deficiency; a statement from the Chief Risk Officer as to whether approved risk policies, appetites and standards have been complied with and, in the event of any breaches, what actions have been taken or are planned to address them; and a summary of any significant risk events and material near misses which might have resulted in risk tolerances being exceeded. Capital management In carrying out its mandate for capital management, the Committee is responsible for: overseeing the updating of the Group s Own Risk and Solvency Assessment ( ORSA ) and Forward Looking Assessment of Own Risk ( FLAOR ) in accordance with the Group s ORSA Policy; considering on an ongoing basis whether the Solvency II standard formula remains a proxy for the risk profile of the Group and to make recommendations to the Board of FHE as appropriate; making recommendations to the Board of FHE regarding the Internal Capital Target for the Group; reviewing the adequacy and appropriateness of stress and scenario tests (including reverse stress testing) linked to the capital setting exercise and where appropriate recommending any further stress or scenario tests necessary; and reviewing the effects on capital of specific events occurring and / or instances where assumptions material to the Group s business plans are compromised and making recommendations to the Board as considered appropriate. Other In addition to the foregoing the Committee shall: evaluate its own collective performance at least annually; and review annually these terms of reference and either recommend changes to the Board or confirm to the Board that no changes are in its view required. With Profit Fund Advisory Panels As the Company manages three closed with profit funds, it has established With Profit Advisory Panels. Each Panel acts in an advisory capacity to inform decision-making by the Board in relation to the management of that fund. Each Panel acts in accordance with its own terms of reference, regulations affecting the management of with-profits business and in particular the fund s Principles and Practices of Financial Management ( PPFM ). The responsibility of the Advisory Panels is to provide an independent view on the management and operations of the fund and, in particular, adherence to the terms and conditions outlined in the Transfer Instrument. Specifically, its responsibilities include the need to assess report on and give advice (and, where relevant, recommendations) to the Board on: whether it considers the Company has met its regulatory responsibilities to the policyholders and in particular, its obligations to pay close regard to their reasonable expectations; 24
25 the way in which the funds is managed and whether this is in accordance with the PPFMs; whether the Company has addressed appropriately and effectively the conflicting rights and interests of with-profits policyholders and other policyholders or stakeholders of the fund in a way that has paid due regard to their interests and has treated them fairly in the management of their policies, the fund and any proposed actions affecting them; the treatment of debits and credits to the fund and the consistency of their treatment in line with the Transfer Instrument; and any other issues with which the policyholders might reasonably expect the advisory panel to be involved; such that its assets are able to cover its liabilities and its capital and solvency requirements. However, under the terms of the Transfer Instrument, if either the fund or any of the Company funds is unable to meet its liabilities, the other funds may provide capital support on such terms as the Company s Board considers appropriate, fair and reasonable, taking into account the relevant regulatory requirements, the views of the Advisory Panel and the advice of the Chief Actuary (who is also the Actuarial Function Holder) of FLL and the FLL with profit actuary for the affected FLL Long term Business Funds. There have not been any material changes in the system of governance over the reporting period. B.1.1 Remuneration policy The Group s policy is to ensure that total remuneration of the executive director is competitive with that of comparable organisations in the financial sector. As far as practicable the policy aims to provide a strong link between pay and performance without encouraging inappropriate risk taking. The key objectives of the Group s remuneration policy are to consider the following principles in respect of the Group s remuneration arrangements to ensure they: promote effective risk management, avoid encouraging risk taking that exceeds risk tolerance limits, align with business and management strategy avoid conflict of interest, and allow for clear, transparent and effective governance. In addition to the above principles which apply to all employees, certain additional requirements apply to employees who either effectively run the Group or whose activities have a material impact on the Group s risk profile. The additional requirements are as follows: the balance between fixed and variable components is such that the fixed element represents a sufficiently high portion of the total remuneration; a substantial portion of variable remuneration requires a deferred component of a period not less than three years; performance-related variable remuneration is based on a combination of the performance of the individual, the business unit concerned and the overall result of the Group; consideration of performance is based on financial and non-financial criteria; a downwards adjustment for measurement of performance as a basis for variable remuneration for exposure to current and future risks; 25
26 any termination payments to relate to performance over the whole period of activity and do not reward failure; and any variable remuneration of employees engaged in the control functions of risk, compliance, internal audit and actuarial is independent from operational units submitted to their control. Independent non executive directors of the Group received remuneration totalling 0.1m during the year (2016: 0.1m). B.1.2 Key functions The Senior Insurance Managers Regime ( SIMR ) provides a regulatory framework for similar standards of fitness and propriety, conduct and accountability to be applied to individuals in positions of responsibility at insurers as applied for banks and large investment firms. The Group operates a governance map, which aims to be a clear and coherent document. Key objectives of the map are to: provide a list of key functions; the names of the persons who effectively run the Group; a summary of the significant responsibilities allocated to such persons; a summary of where responsibilities are allocated to more than one person, details of how those responsibilities are shared or divided between the persons concerned; reporting lines and lines of responsibility; how the Group s management and governance arrangements fit together with those of its group, the extent to which governance arrangements are provided by or shared with other members of the Group; and for such persons listed as effectively running the Group, details of the reporting lines and lines of responsibility to persons who are employees or officers of other group members or to committees or other bodies of the group or other group members. 26


27 The following chart details the key functions of the Group and the reporting lines to the CEO: B.2 Fit and proper requirements The Group operates a Fitness and Propriety policy. The key objectives of this policy are as follows: provide a consistent framework and language for the assessment and maintenance of the fitness and propriety of the senior management of the Group; establish minimum standards for fitness and propriety of the senior management of the Group and oversight of these standards to ensure their continued effectiveness; and provide guidance to the circumstances when individuals would not be considered fit and proper. The regular cycle of appraisals and performance reviews provides the baseline for the on-going assessment of fitness and propriety. The fit and proper requirement applies to the senior management roles within the firm. In this context, senior management roles mean persons effectively running the firm or performing or holding a key function as shown in Section B.1.3. The assessment of Fitness and Propriety falls under three main headings: Competency and Capability; Honesty, Integrity and Reputation; and Financial Soundness. 27
28 Competency and Capability Senior management are required to have the relevant skills, knowledge and expertise in order to effectively carry out their functions. Prior to appointment the Group must satisfy itself that it has verified the knowledge, competency and experience of the senior manager and they are relevant to the role. Senior managers are also expected to be competent in the following: Market Knowledge; Business Strategy and Models; Risk Management and Controls; Financial Analysis and Controls; Governance, Oversight and Controls, and Regulatory Framework and Requirements. Honesty, Integrity and Reputation Senior managers are in positions of influence and authority and therefore need to act with honesty, integrity and be of sufficient repute as not to have adverse impact on the firm. The key risk is the potential for financial crime, susceptibility to bribery and corruption and associated crimes such as money laundering. All senior managers are subject to Disclosure and Barring Service (previously Criminal Records Bureau) checks which provide details of any unspent and spent convictions and such information is compared with any disclosure from the senior manager. Financial Soundness An individual cannot act as a senior manager if they are an undischarged bankrupt or currently subject to an Individual Voluntary Arrangement ( IVA ). B.3 Risk management system including the ORSA The Group s approach to risk management and its interaction with the decision making process is managed through its Risk Management Framework which is explained in detail in the Risk Management Policy and the supporting Risk Appetite Framework document. The practical application of the Policy and the Risk Appetite Framework on a day to day basis is explained in the Risk Management Process document. The key aspects of the risk management framework are outlined below. This constitutes the context in which the ORSA is performed. Risk Management Culture Effective risk management is fundamental to the Group in order to ensure that assurance is obtained regarding the management of significant risks and therefore fully informed business decisions are made, capital is managed efficiently, returns are generated for policyholders, mandatory obligations are met and that the company has effective and efficient core processes. Senior management sets an appropriate tone at the top by promoting ethical behaviour and demonstrating a commitment to risk management. 28
29 Risk Appetite Risk appetite is defined as the amount of risk the Group is willing to take in the pursuit of achieving its strategic objectives. Risk appetite is set by the Board and is used to ensure that business decisions take account of the Group s ability to accept and manage risks and to guide management actions. Through the Risk Management Framework which includes the Risk Appetite Framework, the Group has formally established and communicated its risk appetite. Risk appetite is used to ensure that the Group does not take on more risk than the capital base allows. One of the key risk appetite statements relates to maintaining an appropriate buffer of capital resources over capital to meet the internal capital target. To avoid risk appetite being breached, inner and outer limits have been established, expressed as tolerances and limits. These are trigger points indicating when action should be taken to bring the Group back within risk appetite. All risk appetites and limits are well within risk capacity. Roles and Responsibilities within the Risk Framework The Group adopts a three lines of defence model as discussed in the Summary to the SFCR. The executive and senior management have oversight of the risks for the areas for which they are responsible. A bottom up and top down approach is taken, with business areas maintaining risk registers which are reviewed monthly by the risk department, and the Chief Executive Officer maintaining an Executive level risk register. The Risk & Investment Committee is responsible for advising the Board on the Group s overall risk appetite, and for the risk strategy. The Committee oversees the risk framework, risk activity and resources, the effectiveness of the risk management procedures, the Executive level risks and the steps being taken to mitigate them. Risk identification, assessment and management Risk identification The Executive Leadership Team evaluates risks for their respective areas of responsibility, including risks which are outside the control of the Group. In addition the risk department meets with risk owners to provide oversight and challenge of risks, which are recorded on business area risk registers. Each risk owner owns their risk register and they are responsible for the completeness and accuracy of the information contained in it. Risk assessment Each risk identified is evaluated and given a score based on the likelihood of the risk materialising and the impact if it was to occur, based on the UK s risk assessment matrix. Inherent risk, an assessment of the likelihood and impact before any controls are taken into consideration, and residual risk, which takes into account mitigating controls, are both recorded. Risk mitigation Risk owners provide details of any mitigating factors/controls in place against each risk. Residual scores are then applied to each risk, to show the score once controls/mitigation has been applied. 29
30 Risk response Actions are added to risks on registers where existing controls are not sufficient to mitigate the risk or are not effective. Actions are also recorded in minutes of the relevant meeting. Emerging Risks The Risk and Compliance functions are responsible for reviewing potential emerging risks. An assessment of these risks is presented to the Executive Leadership Team and the Risk & Investment Committee. Risk monitoring and reporting Executive level risks A risk report, designed to give sufficient oversight of the risk management framework and risk profile is presented monthly to the Executive and quarterly to the Risk & Investment Committee. Committee updates Effective risk management requires engagement and communication from the Board level down, as well as from the Executive to the Board. The risk department provides an update on risk matters to the Executive Committee and to the Risk & Investment Committee. The areas covered regularly include the risk profile, emerging risks, updates on significant projects, and a summary of events and potential losses. Ad hoc reports are provided as required. The Chief Risk Officer has free and unfettered access to members of the Risk & Investment Committee and the Board. ORSA Process The ORSA can be defined as the entirety of the processes and procedures employed to identify, assess, monitor, manage, and report the risks the Group faces or may face and to ensure that its appetite for these risks is conversant with its capital and commercial aspirations. This ensures that the internal and regulatory capital requirements can be met. If there are indications that capital requirements will not be met, management actions are identified to mitigate the position. The Board and the Risk & Investment Committee play an integral role in the oversight of the ORSA at all levels. The annual ORSA is undertaken in parallel with the annual business planning process so that the risks identified as part of the planning process can be taken into account within the ORSA to ensure that solvency needs and internal capital targets will be met and risk appetites observed. The Internal Audit function provides independent assurance regarding the integrity of the annual ORSA process. The ORSA process is outlined in the ORSA policy. The key aspects are outlined below. 30
31 Strategy / Business Plan developed ORSA undertaken to determine capital requirement Risk Universe formulated identifying current and future risks to the plan Potential impact of risks evaluated and compared against established appetite statements UK ELT risk register maintained to review risk profile of the Company Risk registers maintained at business unit level As part of the annual business planning process the risks are identified that could have an immediate impact on the plan or could do so on a forward looking basis over the currency of the plan. These risks are then evaluated and compared to the Group s stated risk appetite. One of the Board s key determinants of risk appetite is by reference to the capital requirement generated by these risks from both a regulatory and internal capital target perspective. The Board has concluded that the standard formula prescribed under the Solvency II legislation for calculating the Solvency Capital Requirement (SCR) accords, in the main, with the risk profile of the Group in calculating its solvency needs at the required 1:200 year level. The robustness of the capital output from the standard formula and the ORSA / FLAOR is scrutinised utilising scenario testing. A number of plausible scenarios, parameterised at the 1 in 200 level are developed based on events, the features of which respond to the key risks to which the business is exposed. The results from the scenarios will be compared with the ORSA and the Internal Capital Target (ICT) to ensure that the ICT can withstand the effect of the scenario occurring. In circumstances where it is found that the tolerance levels applicable to the ICT would be breached should the scenario occur then the reasons for this are evaluated and recommendations developed for consideration by the Risk & Investment Committee. The results of the ORSA, together with the ongoing confirmation that the capital assessment continues to be conversant with the Group s risk profile and stated appetite levels, are integral to strategic decision making by executive management and the Board. 31
32 B.4 Internal control system The Board has oversight responsibility for the management of risk within the Group. As such the Board provides oversight to ensure that the identified risks to which the business is exposed are being managed to a level commensurate with its stated risk appetite. The Board gains assurance that these responsibilities are met through the development and maintenance by the senior management of an internal control framework. The control framework, and the basis upon which it operates, is articulated in a range of policies and procedures. The Internal Control Policy establishes the basis of the internal control framework and seeks to provide a framework to oversee that: identified risks are managed to a level commensurate with the Board s risk appetite; relevant laws and regulations are complied with; data and information made available internally or externally is accurate, timely, complete, reliable and consistent; the Group s assets and resources, including its people, systems and data / information (including data that is held on behalf of its members and customers) are adequately protected, including instances where functions are outsourced to third parties; and control processes have been established that call for management and employees to carry out their duties and responsibilities with integrity and in an efficient and effective manner. Based on information provided by management and independently by the Risk, Compliance and Internal Audit functions, the Board is able to form a view whether the internal control framework remains appropriate and if not what actions need to be taken as a result. Control environment The Board and Senior Management lead by example in communicating the importance of internal control and expected standards of conduct. The Board is assisted in carrying out its duties by various Committees and senior management as set out above. Information and communication Satisfactory communication of information is necessary for the Board, management and employees to carry out their internal control responsibilities effectively. The key principles relating to information and communication are therefore: information must be relevant and of a quality to support effectively the development and maintenance of the internal control framework; and information must be communicated effectively and in a timely manner in order to ensure that all staff understand their duties and responsibilities (including instances where matters require escalation) in the context of internal controls and so that the internal control framework remains relevant to the Board s objectives and risk appetite. 32
33 Monitoring activities This includes the process for evaluating adequacy of the internal control framework and reporting any findings or deficiencies. The key principles are as follows: evaluations are carried out by control owners within business areas and oversight functions on an ongoing basis to ensure that the internal control framework is current and functioning as intended and remedial action taken if considered necessary as soon as possible; and independent reviews of the internal control framework must be undertaken by Internal Audit utilising a risk based approach. B.4.1 Compliance Function The Compliance function seeks to assess and consider whether the Group adheres to all applicable legal and regulatory requirements and internal rules and policies governing its operations as applicable to conduct risk and FCA requirements. The key responsibilities of the Compliance function are to: assess whether the compliance process is running effectively and to monitor that the statutory, regulatory and supervisory requirements are being met; monitor whether effective compliance controls and procedures are followed and whether corrective action is taken when compliance breaches are identified; identify, assess, advise on, monitor and report to the Board on compliance risks; provide compliance management education and tools to management and staff; monitor compliance with internal policies and standards; and promote an appropriate compliance culture. B.5 Internal audit function The Internal Audit function is provided by the IOF Internal Audit team. implemented through the process outlined below. It is An audit plan is created on an annual basis and ensures sufficient evidence will be obtained to evaluate the effectiveness of the control environment across the business. The audit plan considers those operations most affected by recent or expected changes, in processes or systems, including changes following acquisitions, restructures and new ventures. The proposed plan is flexible so that adjustments can be made during the year as a result of changes in management strategies, external conditions or major risk areas. Any proposed changes or update in the plan are reported to the Audit & Compliance Committee for their review and agreement before they are incorporated into ongoing work. The Audit & Compliance Committee review and approve the plan at least annually. Based on the annual plan, the internal audit activity evaluates the adequacy and effectiveness of controls encompassing the business governance, operations, and information systems. This includes: effectiveness of the controls over the operations; reliability of financial and management reporting; safeguarding of assets; and compliance with laws, regulations, and contracts. 33
34 The Board requires that the Chief Internal Auditor ( CIA ) performs sufficient audit work and gathers other available information during the year so as to form a judgement regarding the adequacy and effectiveness of the control environment. The CIA communicates overall judgement regarding the Company s control environment to the Audit & Compliance Committee. The internal audit function of Foresters is managed by the IOF Chief Internal Auditor ( CIA ), who is an employee of the business, has no responsibility for any other function across the business, and reports administratively to the IOF Executive Vice- President ( EVP ) and the Global Chief Financial Officer ( CFO ) and has free and unrestricted access to the President and Chief Executive Officer, the Chair of the UK and Canadian Audit & Compliance Committees, and reports directly to the Audit & Compliance Committee. This reporting structure ensures independence of the internal audit function. B.6 Actuarial function The Group operates an Actuarial Function Policy which outlines the manner and principles under which the Chief Actuary delivers his mandate with the Group. This policy covers the sections described below. B.6.1 Actuarial Function Responsibilities The Chief Actuary s broad responsibilities are ensuring the long term financial stability of the Group and ensuring adequate customer protection through solvency. The role of Actuarial spans the first and second line of defense. It provides inputs for the day-to-day management and control of risks in the first line, and oversees the business operations in the second line. In particular, the Chief Actuary (who is also the Actuarial Function Holder) is required to fulfil the following regulatory requirements: Solvency II Directive (Article 48); Delegated Acts (Articles 272 and 308); and EIOPA Guidelines on System of Governance. Calculation of technical provisions As the Actuarial Function Holder, the Chief Actuary provides: the calculation of the technical provisions, in accordance with the methodologies and regulations; and the validation of the technical provisions. 34
35 As the Actuarial Function Holder, the Chief Actuary reports on: the appropriateness of the methodologies relative to the SII requirements; the appropriateness of the models for the purposes of calculation; the assumptions in the calculation of technical provisions; and the sufficiency and quality of data used. The Chief Actuary provides a quarterly report on the reliability and adequacy of the technical provisions. Experience Analysis The Chief Actuary conducts an experience analysis for each of the risks which are material to the FLL fund in question: an annual experience analysis at a detailed product level, for the purposes of setting assumptions; and a quarterly experience analysis to monitor actual versus experienced persistency for key products, and to provide management information. Effective implementation of the risk-management system The Chief Actuary contributed to the effective implementation of the risk management system through: modelling risks underlying the calculation of the capital requirements on a quarterly basis; contributing to the ORSA process through risk identification, capital measurement and stress and scenario testing including reverse stress testing the ORSA, including the forward looking assessment, is performed at least annually and following a significant change in risk profile. This included but is not limited to an acquisition or divesture of a business, a significant change in market conditions or a significant change to the type of level of new business; monitoring solvency on a continuous basis; projecting solvency requirements under stresses and scenarios; developing mitigating actions to protect solvency; and providing data to enhance and report against risk appetite statements, limits and tolerances. Broader responsibilities of the Chief Actuary The Chief Actuary provides first line responsibilities: product and pricing support for the business; determining reinsurance arrangements; support to the With Profits Actuary on all actuarial aspects of his role, including bonus setting; contributing to investment and asset/liability matching strategy; contributing to business planning; determining reserves for UK IFRS; providing reserves and capital calculations on the Canadian regulatory regime; analysing earnings by source; 35
36 developing and productionising actuarial models; developing and productionising asset and liability data processes; and managing the relationship with Tunbridge Wells Retirement Benefit Scheme Trustees and Scheme Actuary. B.6.2 Actuarial Function Reporting Quarterly Actuarial Valuation Report The Chief Actuary provides a quarterly report covering: methodology and assumptions used for the quarterly valuation; any changes in methodology and assumptions, and the impact; technical provisions, capital requirements and solvency on a Solvency II basis; reserves on Canadian and UK IFRS bases; and analysis of change in reserves the change in surplus based on actual versus expected cashflows during the analysis period, and change in reserves by risk driver. Annual Actuarial Function Report The Chief Actuary and Actuarial Function Holder provide an annual Actuarial Function Report following the completion of the year-end results. The report covers actuarial opinion on the calculation of the technical provisions, assumptions, data, risk and uncertainty associated with the technical provisions, business and risk environment. B.7 Outsourcing The Group operates an Outsourcing Policy, which sets out the principles, rules and guidance for any material outsourcing activity entered into by any entities within the Group. The key objectives of the policy are: to establish minimum and consistent standards for entering into, managing and exiting the outsourcing of material Group functions; to define and allocate responsibilities to ensure that these standards are upheld at all times; and to ensure that the risks associated with entering into such outsourcing arrangements are effectively managed both at inception and on an ongoing basis. Entering into any new material outsourcing arrangements requires the consideration of a range of business, commercial and risk appetite criteria. The diagram below provides a high level representation of the process which must be adhered to for all material outsourcing arrangements. 36


37 Material Outsourcing Approval Scope & Appetite Review Proposed MrrMngement MnMlysed for Mlignment wito (i) St rmtegy TOM (ii) Outsourcing Policy & Risk Appetite AnMlysis Evidenced ViM: Business CMse Business CMse Approved In Principle Bu siness cmse detmils proposed commercimls; ri sk, governmnce & opermtionml considermtions; potentiml cmndidmtes outlined IHQ AutOorisMtion IHQ AutOorisMtion SougOt for MrrMngements >=CDN$2m ELT ApprovMl in Principle OSP AnMlysis & Selection DetMiled review of PotentiMl OSP cmndidmtes wito Business CMse UpdMted & FinMl RecommendMtion MMde ELT ApprovMl & RecommendMtion R&I Committee ApprovMl & RecommendMtion FLUK BoMrd Review & ApprovMl The Group must assure itself of the expertise and experience of the outsourced service provider. There should be an initial capability analysis of the proposed provider to ensure that they would be capable, and have demonstrated capability of, meeting their financial, regulatory and service obligations. Monitoring and reporting against material outsourcing arrangements provide the Group s senior management with assurances that (i) all current outsourcing arrangements remain within FLL s risk appetite, and (ii) that they are performing within expected tolerances. It is the responsibility of each outsourced service owning executive to ensure that: clear contact, reporting and escalation processes are in place to manage the day-to-day relationship within a business-as-usual environment; material outsourced service providers are providing key performance data & breach reporting per their contractual obligations; material issues raised are being reviewed by the relevant FLL governance body; if specific governance arrangements are in place with the OSP, that a relevant FLL person(s) are engaged and can input to that process; and the outsourced service provider maintains its credit worthiness and does not pose a material credit risk to the Group. 37
38 B.7.1 Material outsourced services The material outsourcing relationships are as follows: Investment management Schroders, Aberdeen Standard Investments, Invesco, Fidelity, Henderson, Royal London, Aviva and Scottish Widows; Underwriting - Morgan Ash; and With profit actuary - Milliman. These outsourced service providers are based in the UK. 38
39 C Risk Profile Section C is unaudited C.0 Overview of the company risk profile The Group s main source of income is derived from the investment management business from which annual management charges are levied on the policyholder for managing their funds. As such, the Group is exposed primarily to the variance in the margin between charges earned on funds under management and administration expenses within the investment business. Its secondary risks are underwriting risks linked with traditional life and health products and the costs of providing guarantees within the with-profit funds. The principal basis used to measure and assess the Group s exposure to risk is the Solvency II Solvency Capital Requirement (SCR) using standard formula methodology and the ORSA along with sensitivity and stress testing of key risks. As part of the ORSA, scenario testing, stress testing and reverse stress testing are conducted to assess the Group s surplus position under various conditions. This testing demonstrated that the Group maintains sufficient capital to withstand severe shocks with respect to the risks. The key risks are classified as underwriting, market, credit, liquidity, operational and strategic risks. C.1 Underwriting risk - Life insurance (including health similar to life) The Group s key underwriting risks are lapse risk and expense risk. It is exposed to variances in lapse (including mass lapse) and expense experience, relative to the expected experience on which pricing and reserving is based. It is also exposed to future systematic trends and volatility in underwriting risks, which are not allowed for in the pricing or reserving assumptions. Higher lapses for investment products decrease the charges earned; lower lapses for with profit products increase the potential costs of options and guarantees. The Group accepts these risks, monitors experience quarterly and reviews assumptions annually. By the nature of the business model, the Group is exposed to expense risk from expense inflation and the inability to achieve revenue growth to support its expense base, coupled with external factors such as an increase in regulatory costs. As such, expense risk is accepted as a strategic risk. The general approach taken is to manage expense risk to an acceptable level, through a combination of sound corporate and risk governance and strong systems and controls. The business planning process assesses the effect of different levels of inflation on the plan outcomes. Given the materiality of the exposure, stresses are applied at the 1-in- 200 level to simulate an expense increase of 12.5% aligned with an inflationary increase of 1% per annum under the ORSA. 39
40 The Group is exposed to variance in mortality, longevity and morbidity experience and future trends in its portfolio, though overall exposure is low. The morbidity risks arise in long-term health underwriting business in the CWF, TWF and OBF; the longevity arises in the annuity portfolios in the TWF and OBF and the two defined benefit pension schemes; and there is a small mortality risk across the majority of products. The Group monitors the experience of these products annually and manages the mortality and morbidity risks through external reinsurance and internal reinsurance with the Group s Canadian parent. C.2 Market risk The Group s key market risks are equity risk and currency risk; and its secondary risks are interest rate movements, credit spread-widening and property risk. Market risk is mainly derived through its investment products. Falls in the investment portfolios reduce the charges earned, which are linked to value of the portfolios. The Group is exposed to short term crashes and longer term declines in the value of portfolios, along with uncertainty associated with market volatility. As well as the potential reduction in charges earned from investment portfolios, the Group has some direct exposure to market risk in the asset portfolios backing protection and annuity policies, surplus assets and the cost of options and guarantees. The Group also has a direct exposure to potential falls in the value of assets underlying the closed defined benefit section of the staff pension scheme. If losses reach a level at which the solvency of the ring fenced funds is impaired, FLL would be required to inject capital to make good the position. The Group accepts the market risk associated with its investment products and manages these risks through compliance with investment policies and procedures, escalation of breaches, regular governance meetings with investment managers and an annual review of investment strategies. It manages the market risk associated with assets backing protection and annuity portfolios by maintaining strong credit quality and duration matching. The Group is exposed to changes in the yield curve, which impacts the present value of future charges, held as an asset on the balance sheet, and the value of the costs of options and guarantees in the with-profit funds. The Group accepts this risk, measures and monitors the exposure to interest rate risk on a quarterly basis, and more frequently as necessary. The Group holds a diversified portfolio to minimise concentration risk and manages this through investment management agreements and quarterly monitoring. 40
41 C.3 Credit risk The Group takes credit risk positions in its investment and insurance portfolios through its investments in government bonds and corporate debt. In the linked business and the ring fenced funds, credit risk is assumed by the customer. The Group has an indirect exposure through the potential loss of revenue derived from annual management charges on funds under management. There is a direct exposure to potential losses as a result of credit risk in the shareholder funds. Additionally, the Group has some exposure to credit risk through secured loans to policyholders, collateralised against their plan value. It manages its exposure by reviewing the portfolio regularly. Limits and tolerances are set for Gilts and Corporate Bonds for each fund. Assessment of the impact of interest rate changes and falls in equity markets is carried out as part the Group s stress testing programme linked to the ORSA and the SCR. The output of this assessment is reviewed by the Board. The Group manages its credit risk by investing in investment grade bonds only, with credit ratings of BBB- or higher. It monitors the external fund managers portfolios for compliance monthly and reviews the investment strategy annually. The FFML funds are primarily invested in equities with low exposure to fixed income and all pursue pre-defined investment strategies. C.4 Counterparty risk There is the risk of counterparty default from policyholders, reinsurers, bond issuers and banks, including custodians. The Group reinsures its health risks with Swiss Re, Hannover Re and the Independent Order of Foresters. While the Group is exposed to failure of reinsurers, the overall level of exposure is low. The Group monitors the reinsurance premiums and claims on a quarterly basis. The Group utilises banking arrangements with banks with ratings, equal to or higher than P-1 (Moody s) or A-1 (S&P). Derivatives are used in a number of the Group s funds, within Investment Policy guidelines based on the principles of risk reduction, efficient portfolio management, tactical asset allocation, obtaining or hedging market exposures and cash flow management. The Group does not hold derivatives for speculative purposes, and outright short selling is not allowed. The Group is exposed to risk arising from the failure of derivative counterparties. Most transactions are contracted and documented under ISDA (International Swaps and Derivatives Association, Inc.) agreements. Such agreements are designed to provide a legally enforceable set-off in the event of default, which reduces credit exposure. 41
42 Exposures to counterparties and exposures arising from aggregated holdings are measured and monitored daily by Schroders and monthly by the Group. C.5 Liquidity risk Liquidity risk is the risk that the Group, although solvent, is unable to make available sufficient resources to meet its financial obligations as they fall due. The Group has no appetite for liquidity risk. As a consequence, the Group maintains sufficient controls in order to mitigate liquidity risk. The Group manages this risk through monthly monitoring of short term liquidity, analysis of lapse and claims variance, liability duration analysis and stress and scenario testing. C.6 Operational risk Operational risk is defined as losses from inadequate or failed internal processes, systems or human performance, or from external events, such as natural disasters or accidents. The Group is exposed to Operational Risk (including Conduct Risk) simply by being open for business. Operational risk does not diversify with other risks under Solvency II. Cyber risk, regulatory change and the risks posed by increasingly demanding customer expectations in the context of ease of doing business, and the risk of technological disruptors entering the market, are the top operational risks on the Executive risk register, and therefore subject to ongoing management attention. Operational risk is managed through the risk management framework. The key aspects are a positive risk management culture, governance through the three lines of defence model, a strong control environment including executing risk response actions to address identified gaps or weaknesses and on-going monitoring of the effectiveness of risk management actions. C.7 Changes to the risk profile in the reporting period The Group s business mix has been relatively stable over the year. However the risk profile has been modified through a series of internal management actions. 1) The transfer of the CTF book of business from FFML to FLL in January 2017 has increased the concentration of equity and persistency risk to FLL. However, the increase in policy numbers has had a significant beneficial impact on expense coverage. 2) The migration of the Tunbridge Wells plans from the TWF administration system, Robin, to the main administration system, NAS, was completed in CTF life-styling functionality was also incorporated into the main administration system as part of the system changes in July
43 3) Progress has been made on the stabilisation of the TWF improving the overall solvency position of the fund. The TWF investment strategy has increased the equity backing ratio which may improve the investment returns over the long term. 4) 2017 also saw some changes in the investment strategy for a number of books of businesses. The equity holdings in the TW and CW funds were increased in order to increase potential investment returns. The TW fund saw the equity holdings increase from c.20% to c28% with indexed linked Gilts and holdings in collective investment schemes being sold. The CW fund increased its holdings in equity from c.40% to c.50% with fixed income bonds being sold. The Company also took the decision to de-risk its shareholder funds, selling its entire holding in equity. C.8 Future changes to risk profile The Group views the changing regulatory environment and the impacts of technology on distribution channels as two particular risks, which could impact the business model. In addition, the basic advice regime is not fully compatible with the Insurance Distribution Directive which comes into force from 1 st October 2018 which is likely to impact the current sales distribution model. 43
44 D Valuation for Solvency Purposes D.1 Assets Assets have been valued according to the requirements of the Solvency II Directive and related guidance. The basic principle of valuing assets under Solvency II is to determine the amount at which an asset could be exchanged between knowledgeable willing parties in an arm's length transaction. The general principles for measuring asset valuations under Solvency II are as follows: Wherever possible, the fair value of assets must be based on a mark to market approach, based on readily available prices in orderly transactions that are sourced independently. Where marking to market is not possible, mark to model procedures should be used (marking to model is any valuation which has to be benchmarked, extrapolated or otherwise calculated as far as possible from a market input). When marking to model, undertakings will continue to maximise the use of relevant observable inputs and minimise the use of unobservable inputs. We do not currently have any mark-to-model assets. There have been no changes made to the asset recognition and valuation bases used or to estimations during the reporting period. The following tables detail the IFRS and Solvency II valuation of the assets of FLL and FHE Group at Year End 2017 and 2016 (after taking into account classification differences across the two bases): FLL FLL 2017 IFRS valuation ( 000) Solvency II valuation ( 000) Deferred acquisition costs 13,910 - Intangible assets 1,280 - Deferred tax asset 14,744 - Property, plant and equipment held for own use 5,560 5,560 Holdings in related undertakings, including participations 19,062 19,062 Government Bonds 277, ,038 Corporate Bonds 153, ,829 Collective Investments Undertakings 310, ,164 Cash and cash equivalents 10,506 10,506 Assets held for Unit Linked business 3,454,154 3,454,154 Loans on policies 5,171 5,171 RI share of technical provisions 7,966 7,954 Insurance and intermediaries receivables 2,449 2,449 Receivables (trade, not insurance) 6,840 6,840 Total assets 4,282,672 4,252,728 44
45 2016 FLL IFRS valuation ( 000) FLL Solvency II valuation ( 000) Deferred acquisition costs 10,590 - Intangible assets 1,580 - Deferred tax asset 5,369 5,369 Property, plant and equipment held for own use 5,450 5,450 Holdings in related undertakings, including participations 51,800 19,062 Government Bonds 267, ,992 Corporate Bonds 245, ,346 Collective Investments Undertakings 246, ,482 Cash and cash equivalents 18,020 18,020 Assets held for Unit Linked business 1,111,014 1,111,014 Loans on policies 5,373 5,373 RI share of technical provisions 6,155 6,135 Insurance and intermediaries receivables 2,762 2,762 Receivables (trade, not insurance) 9,047 5,520 Total assets 1,986,980 1,938, FHE Group IFRS valuation ( 000) FHE Group Solvency II valuation ( 000) Deferred acquisition costs 13,910 - Intangible assets 28,429 - Deferred tax asset 15,013 - Property, plant and equipment held for own use 6,007 6,007 Holdings in related undertakings, including participations - 19,062 Government Bonds 277, ,038 Corporate Bonds 153, ,829 Collective Investments Undertakings 310, ,164 Cash and cash equivalents 10,807 10,807 Assets held for Unit Linked business 3,454,154 3,454,154 Loans on policies 5,171 5,171 RI share of technical provisions 7,966 7,954 Insurance and intermediaries receivables 1,448 1,448 Receivables (trade, not insurance) 13,267 13,267 Total assets 4,297,202 4,258,901 45
46 2016 FHE Group IFRS valuation ( 000) FHE Group Solvency II valuation ( 000) Deferred acquisition costs 10,589 - Intangible assets 31,824 - Deferred tax asset 19,064 5,369 Property, plant and equipment held for own use 6,258 6,258 Holdings in related undertakings, including participations - 5,614 Government Bonds 267, ,992 Corporate Bonds 245, ,345 Collective Investments Undertakings 246, ,482 Cash and cash equivalents 22,245 18,480 Assets held for Unit Linked business 1,111,014 1,111,014 Loans on policies 5,372 5,372 RI share of technical provisions 6,155 6,135 Insurance and intermediaries receivables 2,763 2,763 Receivables (trade, not insurance) 3,192 3,971 Total assets 1,984,211 1,924,802 Asset valuation differences D.1.1 Intangible assets Intangible assets under IFRS relate to management contracts and deferred acquisition costs. Intangible assets can only be recognised under Solvency II if the asset can be sold separately and it is possible to demonstrate that there is a value for the same or similar assets based on the valuation methodology required for Solvency II purposes. Our intangible assets do not meet this definition and therefore are eliminated in the Solvency II balance sheet. D.1.2 Deferred tax asset The IFRS deferred tax asset ( DTA ) relates to carried forward losses. There are sufficient future profits available to justify holding the DTA. The forecast future profits relating to the business of FLL are monitored regularly to ensure that we have sufficient future profits available to utilise the DTA and is therefore also recognised under Solvency II. An additional deferred tax liability is created as a result of Solvency II valuation, specifically the recognition of the Present Value of Future Profits on unit linked businesses within FLL. As the deferred tax asset on the balance sheet also relates to unit linked business, the deferred tax asset has been offset with the deferred tax liability. See D.3.2 for the offsetting deferred tax asset. 46
47 D.1.3 Property, plant and equipment held for own use This asset relates to the Company/ Group s freehold title to its property. The property was initially measured at the purchase price including transactions costs.. Properties are appraised annually by a qualified and independent third party based on the market value of similar properties. As the property is held at fair value under IFRS, there is no difference in the valuation under Solvency II. D.1.4 Holdings in related undertakings, including participations The Group has a direct holding in FFML whilst FLL has an indirect holding in FFML. Under Solvency II, the valuation of FFML is calculated based on a look-through approach to the fair values of the underlying assets and liabilities of its direct ( FIL ) and indirect ( FFML ) subsidiary. The value of the FFML participation within FLL is further restricted within Own Funds to 10% of the excess of assets over liabilities on a Solvency II basis. In 2017, FFML was not restricted as the net asset value of FFML was less than 10% of FLL s Own Funds. For the Group the investment in FFML is included as participation and valued under the sectoral rules for credit institutions. Under this measurement, intangible assets like deferred tax assets are not permitted. In 2017 FFML did not hold any intangible assets and therefore no restriction was required. D.1.5 Financial investments and cash Financial investments and cash are measured at fair value under both IFRS and Solvency II. The fair value of publically traded equities and bonds is determined using quoted market bid prices. For non-publically traded equities and bonds, fair value is determined using an indicative price supplied by a broker however the Company/Group does not hold any non publically traded equities or bonds. The carrying value of cash and cash equivalents approximates their fair value. All valuations of financial investments and cash are either Level 1 or Level 2 based valuations. Valuations under Level 1 are based on quoted market prices in active markets for identical assets or liabilities. An active market is a market for a security with a high trading volume. Valuations under Level 2 are based on observable inputs other than Level 1 prices, such as quoted market prices for similar, but not identical, assets or liabilities in active markets, quoted market prices for identical assets or liabilities in markets that are not active, and other inputs that are observable, such as interest rates and yield curves observable at commonly quoted intervals, volatilities, prepayment spreads, credit risks, and default rates. D.1.6 Loans on policies Loans on policies are carried at cost less any impairment. Given the nature of these assets (secured against policy holder liabilities and loans cannot be given in excess of the policy holder liability), this is a reasonable approximation of fair value. D.1.7 RI share of technical provisions Please see Section D.2 for a discussion of RI Share of technical provisions. 47
48 D.1.8 Receivables Receivables, both trade and insurance, are carried at cost less any impairment. Given the short term nature of these assets (due within one year), this is a reasonable approximation of fair value. D.1.9 Significant Estimates There are no significant assumptions and judgments applied when calculating the Solvency II valuation of assets other than the ones already described above. D.2 Technical provisions D.2.1 Technical provisions by material line of business The Group values the technical provisions as the best estimate reserves plus a risk margin as set out in the Solvency II rules. The overall technical provisions by line of business for 2017 and 2016 are shown below: 2017 ( '000) Best estimate liabilities Risk margin Gross technical provisions Reinsurance recoverables Net technical provisions Health Life (excl. indexlinked and unitlinked) Indexlinked and unit-linked FLL FHE 25, ,358 3,171,634 3,783,730 3,781, ,724 63,519 65,308 65,517 25, ,082 3,235,154 3,849,038 3,847,509 (7,954) - - (7,954) (7,954) 17, ,082 3,235,154 3,841,083 3,839, ( '000) Best estimate liabilities Risk margin Gross technical provisions Reinsurance recoverables Net technical provisions Health Life (excl. indexlinked and unitlinked) Indexlinked and unit-linked FLL FHE 23, ,495 1,020,819 1,689,795 1,687, ,788 31,152 34,035 34,169 23, ,283 1,051,971 1,723,830 1,722,162 (6,063) (73) - (6,135) (6,135) 17, ,210 1,051,971 1,717,695 1,716,027 Following the transfer of the FFML business into OBF, the most significant proportion of the business is the ex-ffml Child Trust Fund business written in OBF. The unit linked ISAs, child trust fund and Junior ISAs written in OBF make up a large proportion of the remaining technical provisions. The majority of the life line of 48
49 business is with-profits business, written in TWF, CWF, FLWPF and DPF. The FHE technical provisions are lower than the FLL technical provisions, due to a consolidation adjustment removing a service charge between FLL and FHE. D.2.2 Valuation Methodology The best estimate liabilities ( BEL ) are calculated by discounting future cash-flows on in-force business, using best estimate demographic assumptions and the prescribed risk-free interest rates for investment assumptions and discounting. The cash-flows cover future premiums for in-force contracts within the contract boundary, associated guaranteed benefits, with-profits discretionary benefits, expenses for administration, commission, investment returns and tax (where policyholder tax applies). The contract boundary is defined as the point where there is no discernible insurance benefit for additional premiums under the current contract. The with-profits value of guaranteed benefits includes the sum assured and declared annual bonuses to date, and the value of future expenses. It excludes the value of future annual bonuses and final bonus. It is net of the value of future premiums. Discretionary benefits apply only to with-profits business and are equal to total asset share, cost of guarantees, cost of smoothing and cost of financial options less the value of guaranteed liabilities. The best estimate liability is calculated gross of reinsurance, with the reinsurance valued as an asset. The risk margin is the cost of holding the Solvency II capital requirement for nonhedgeable risks on in-force business in all future years. The cost of capital is 6% per annum, which is set by EIOPA. The company is not making use of: the Matching adjustment, as described in Article 77c of the final version of the Directive 2009/138/EC; the Volatility adjustment, as described in Article 77d of the final version of the Directive 2009/138/EC; and the Transitional Measures on Risk-free Rate, Equity and Technical Provisions, as described in Articles 308b, 308c and 308d of the final version of the Directive 2009/138/EC. D.2.3 Assumptions The key insurance assumptions are lapse and expense assumptions. Lapses are monitored quarterly and the assumptions set annually using internal data, relevant to the particular product group. Administration expenses are reviewed monthly and assumptions set annually based on the Group s budget and future trends in expenses. Investment expenses are reviewed monthly and set annually, though largely reflect contractually agreed expenses. Other insurance assumptions such as mortality or morbidity are reviewed annually, using internal and external data as appropriate. The key investment assumptions are investment growth, the discount rate and inflation. Investment growth and the discount rate use the Solvency II risk-free rates, specified by EIOPA and are updated quarterly. The Group does not use a volatility adjustment or a matching adjustment for the discount rate on any lines of business. 49
50 Price inflation is set with reference to the long term differential between nominal and real yields. Expense inflation is set at price inflation plus 1%. D.2.4 Uncertainty of Cash-flows The best estimate liability is defined as the probability-weighted average of the present value of future cash flows on a market consistent basis. The Group adopts a deterministic approach to value liabilities, as the risks are largely symmetrical for most lines of business. The with-profits business contains options and guarantees. To value these options and guarantees a stochastic approach is used across a large range of risk neutral economic scenarios. Actuarial judgement is exercised in the assumptions setting and modelling processes. D.2.5 Solvency II and IFRS valuation differences The following tables detail the UK IFRS and the Solvency II valuation of FLL technical provisions valued as at 31 December 2017 and The material differences between the bases and assumptions used in the Solvency II and IFRS valuation of liabilities relate to the treatment of non-unit reserves for unit-linked investment products, the treatment of the surplus in the with-profit funds and the risk margin approach. Best estimate assumptions are aligned between IFRS and Solvency II ( '000) Health Life (excl. indexlinked and unitlinked) Index-linked and unitlinked Total FLL Gross IFRS liabilities 25, ,734 3,452,041 4,130,513 Unit-Linked adjustment (1) - - (280,407) (280,407) With-Profits adjustment (2) - (54,306) - (54,306) Insurance & Annuities adjustment (3) - (12,068) - (12,068) SII Best estimate liabilities 25, ,358 3,171,634 3,783,730 Risk Margin 65 1,724 63,519 65,308 Gross technical provisions 25, ,082 3,235,154 3,849,038 50
51 2016 ( '000) Gross IFRS liabilities Health Life (excl. indexlinked and unitlinked) Index-linked and unitlinked Total FLL 29, ,460 1,105,544 1,833,639 Unit-Linked adjustment (1) - - (84,725) (84,725) With-Profits adjustment (2) - (29,451) - (29,451) Insurance & Annuities adjustment (3) - (8,453) - (8,453) Classification differences (4) (6,155) (15,061) - (21,216) SII Best estimate liabilities 23, ,495 1,020,819 1,689,795 Risk Margin 95 2,788 31,152 34,035 Gross technical provisions 23, ,283 1,051,971 1,723,830 (1) The unit-linked adjustment is the recognition of the negative reserves under Solvency II. Under IFRS, recognition of future profits on this line of business is prohibited. Hence the IFRS non-unit reserves are zero while under Solvency II the best estimate of liabilities means that negative non-unit reserves are allowed and reserves can be less than surrender amounts. (2) The with-profit adjustment is the recognition of own funds in the ring-fenced funds. Under IFRS, the Fund for Future Appropriations (FFA) represents the amount of assets held over realistic liabilities, effectively the Estate. The Estate is included in the IFRS reserves, but excluded from the Solvency II technical provisions, and treated as own funds, albeit restricted. (3) The Insurance and Annuities adjustment is the removal of the risk margin in the IFRS calculation which is replaced by the Solvency II risk margin. The movements for FHE are materially the same as for FLL as shown above. D.2.6 Reinsurance recoverable The Company has four reinsurance arrangements in place: Protection business written in the OBF before 2000; Protection business written in the OBF since 2000 (the only treaty open to new business); Business in the OBF acquired in 2008; and Various treaties in the TWF (mainly sickness policies). As discussed in section C, mortality and morbidity risks are not significant for the Company. Moreover, a high proportion of reinsured business in the OBF is reinsured on a risk-premium basis, so any reinsurer default will have a minimal impact on the business. The value of the reinsurance asset is modelled as the best estimate of expected reinsurance recoveries less reinsurance premiums due. On the grounds of materiality, 51
52 this is modelled for TWF only. Both the recoveries and premiums due should be adjusted for expected counterparty default. However, the company assumes this to be constant over time and to equal zero because reinsurance arrangements have been placed only with large, multinational reinsurers with a good credit rating. The approach is deemed reasonable given the volume of business being reinsured. The Group has no special purpose vehicles as defined in the Directive 2009/138/EC. D.2.7 Changes since previous reporting period The Solvency II methodology and assumptions have been refined over The assumptions have been reviewed as part of the annual basis, and updated as necessary. The valuation as at 31 December 2017 reflects a structural change in the Company s business. This covers the transfer of the FFML book of business into the Ongoing Business Fund. All the policies in this book are unit linked policies. Therefore, this has resulted in a large increase in the reported unit linked liabilities for 2017 year-end. The methodology for setting expense assumptions has been reviewed. Under the new method, FLL s ongoing maintenance expenses are classified into different categories. Each category is projected into the future and hence total expenses are calculated for the year. The SII methodology for some sickness products has been reviewed. The new approach employs a multi-state model where policyholders move between the three states healthy, sick and dead with the probability of their moving to another state dependent upon their age, current state and, for those sick, how long they have been in that state. No further changes to Technical Provisions methodology have been applied. D.3 Other liabilities Liabilities have been valued according to the requirements of the Solvency II Directive and related guidance. The basic principle of valuing other liabilities under Solvency II is to determine the amount at which a liability could be transferred or settled between knowledgeable willing parties in an arm's length transaction. There have been no changes made to the other liability recognition and valuation bases used or to estimations during the reporting period. The following tables detail the IFRS and the Solvency II valuation of the other liabilities of FLL and FHE Groupat Year End 2017 and 2016 (after taking into account classification differences across the two bases): 52
53 2017 FLL IFRS valuation ( 000) FLL Solvency II valuation ( 000) Pension benefit obligations 7,333 7,333 Deferred tax liabilities 2,841 24,482 Insurance and intermediaries payables 15,928 15,928 Reinsurance payables Payables (trade, not insurance) 30,602 30,602 Total other liabilities 56,818 78, FLL IFRS valuation ( 000) FLL Solvency II valuation ( 000) Pension benefit obligations 7,818 7,818 Deferred tax liabilities 2,257 11,070 Debts owed to credit institutions 1,061 1,061 Insurance and intermediaries payables 14,056 14,056 Reinsurance payables Payables (trade, not insurance) 29,184 25,653 Total other liabilities 54,501 59, FHE Group IFRS valuation ( 000) FHE Group Solvency II valuation ( 000) Pension benefit obligations 9,243 9,243 Deferred tax liabilities 2,811 23,860 Insurance and intermediaries payables 14,926 14,926 Reinsurance payables Payables (trade, not insurance) 36,410 36,410 Total other liabilities 63,504 84,553 53
54 2016 FHE Group IFRS valuation ( 000) FHE Group Solvency II valuation ( 000) Pension benefit obligations 9,607 9,607 Deferred tax liabilities 1,956 5,063 Debts owed to credit institutions 1,611 1,611 Insurance and intermediaries payables 14,059 14,059 Reinsurance payables Payables (trade, not insurance) 28,057 24,531 Total other liabilities 55,417 54,997 Other liability valuation differences IFRS v SII D.3.1 Pension benefit obligations FLL acquired a closed defined benefit staff pension scheme as part of the TW acquisition. Up to 1 October 2016, all expenses of this scheme and the cost of eliminating the scheme deficit were charged to the TW Fund. On that date, management put a stop-loss arrangement in place whereby the TW RFF paid a reinsurance premium to the OBF and in return any expenses and costs in excess of the stop loss trigger are borne by the OBF. There is also a pension scheme, for which FHE is the principal employer. This is mainly defined contribution, but has a small defined benefit section. Please see pages in the FLL Financial Statements and pages in the FHE Financial Statements for further information on the valuation, valuation assumptions and scheme assets of the pension schemes detailed above. IFRS measurement principles for pension benefit obligations are consistent with Solvency II, and therefore there is no difference in the valuation measurement. The pension scheme liabilities are valued on an annual basis in accordance with IAS 19. D.3.2 Deferred tax liabilities Deferred tax liabilities are accounted for using the liability method, whereby tax expected to be payable or recoverable is calculated on temporary differences arising between the carrying amounts of assets and liabilities under IFRS and the tax assets and liabilities calculated under the regulations of HMRC. Solvency II valuation differences are also considered for their tax effect and a deferred tax asset/liability is created accordingly. As Solvency II guidance requires the recognition of the Present Value of Future Profits on unit linked businesses, a corresponding deferred tax liability has been set up to record the temporary timing difference between the carrying value of Solvency II asset and liabilities and the tax regime under which the Group operates. 54
55 The deferred tax liability generated for Solvency II purposes is as follows: FLL FHE Group Movement in technical provisions 230, ,706 Intangible Assets (15,190) (42,339) 215, ,367 Less non-taxables items 1,280 26,459 SII taxable adjustment 216, ,826 Percentage of Business that is Taxable (c.98%) 214, ,134 SII Deferred Tax liability adjustment 36,385 36,063 As noted in D.1.2, the deferred tax liability has been offset by the deferred tax asset held on the IFRS balance sheet as they both relate to the unit linked businesses. D.3.3 Payables Payables, both trade and insurance, are carried at cost less any impairment. Given the short term nature of these assets (due within one year), this is a reasonable approximation of fair value. 55
56 E Capital Management E.1 Own Funds Insurers regulated under Solvency II are required to hold a solvency margin or buffer to cover the risk of their assets not being sufficient to cover their liabilities. Own Funds represent the net assets available to cover the Solvency Capital Requirement ( SCR ). Own funds are divided into 3 'tiers' based on both 'permanence' and 'loss absorbency'. Tier 1 is the highest quality and Tier 3 the lowest. Tier 1 is further divided into 'restricted' and 'unrestricted'. The regulations impose limits on the amount of each tier that can be held to cover the SCR with the aim of ensuring that the items will be available to absorb any losses that might arise. The Group s objectives in managing its capital are: to match the profile of its assets and liabilities closely, taking account of the risks inherent in the business; to maintain financial strength sufficient to support new business growth in line with the Company s business plan; to satisfy the contractual entitlements of its policyholders and the requirements of its regulators; to ensure financial flexibility by maintaining strong liquidity and access to a range of capital markets; to allocate capital efficiently to support growth; and to manage exposure to changes in interest rates, inflation and exchange rates The Group currently has sufficient capital resources available to meet all its present capital requirements. The following table details the Eligible Own Funds by Tier for FLL for Year End 2017 and 2016: 2017 Tier 1 Tier 1 Total Tier 2 Tier 3 ( '000) unrestricted restricted Ordinary share capital 68,500 68, Surplus Funds 52,543 52, Reconciliation reserve 154, , Total Eligible Own Funds for meeting the SCR and MCR 275, ,
57 2016 ( '000) Total Tier 1 Tier 1 unrestricted restricted Tier 2 Tier 3 Ordinary share capital 68,500 68, Surplus Funds 47,649 47, Reconciliation reserve (10,002) (10,002) Deferred tax assets 5, ,369 Deductions for participations in financial and credit institutions Total Eligible Own Funds for meeting the SCR Tier 3 deduction Total Eligible Own Funds for meeting the MCR (8,447) (8,447) ,069 97, ,369 (5,369) (5,369) 97,700 97, The following table details the Eligible Own Funds by Tier for FHE Group for Year End 2017 and 2016: 2017 Tier 1 Tier 1 Total Tier 2 Tier 3 ( '000) unrestricted restricted Ordinary share capital 56,020 56, Surplus Funds 53,729 53, Reconciliation reserve 166, , Total Eligible Own Funds for meeting 276, , the SCR Tier 1 deduction (19,062) (19,062) Total Eligible Own Funds for meeting the MCR 257, ,
58 2016 ( '000) Total Tier 1 Tier 1 unrestricted restricted Tier 2 Tier 3 Ordinary share capital 56,020 56, Surplus Funds 47,649 46, Reconciliation reserve (4,791) (4,791) Deferred tax assets 5, ,369 Total Eligible Own Funds for meeting the SCR Tier 1 deduction Tier 3 deduction Total Eligible Own Funds for meeting the MCR 104,248 98, ,369 (5,615) (5,614) (5,369) (5,369) 93,264 93, Group Eligible Own Funds to meet the SCR increased from 104.2m to 276.2m during the reporting period. The increase in Own Funds is driven by the transfer of FFML into FLL. Furthermore, positive investment returns and reduction in the cost base following the transfer have also contributed to the increase. A reconciliation of Eligible Own Funds to meet the SCR between FLL and FHE Group for 2017 and 2016 is set out below: 2017 ( '000) FLL Q Own Funds 275,300 Additional Deferred Tax Asset 621 FHE Arms length charge 847 Pension benefit obligations (1,910) Other FHE assets 1,368 FHE Group Q Own Funds 276, ( 000) FLL Q Own Funds 103,069 Reduction in FFML valuation (5,001) Additional Deferred Tax 6,008 FHE Arms length charge 1,668 Pension benefit obligations (1,789) Other FHE assets 293 FHE Group Q Own Funds 104,248 E.1.1 Ordinary share capital This represents ordinary shares of 1 each. The ordinary shares carry full voting rights and qualify for dividends. There are no restrictions on the repayment of ordinary capital other than as imposed by the Companies Act
59 E.1.2 Members contributions This represents the capital contribution of FLL. The capital contribution represents the surplus contained within the long term business fund at the date of transfer of longterm business from the Independent Order of Foresters (30 September 1995), which is not attributable to with-profits business. It is not distributable; however, given that this amount relates entirely to FLL and FLL contributes almost 100% of the Group SCR, there is insignificant risk that we will need to transfer capital between FLL and other entities within the FHE Group. Therefore, there are no further restrictions for transferability/fungibility for this amount in Own Funds. E.1.3 Surplus funds Surplus funds represent the Own Funds related to the ring-fenced funds ( RFFs ), i.e. excess of assets over best estimate liabilities and risk margin. E.1.4 Reconciliation reserve The reconciliation reserve for FLL in 2017 and 2016 can be derived as follows: 2017 Total ( 000) Excess Assets over Liabilities 325,232 Amounts related to Ring Fenced Funds (49,931) Other Shareholder Funds (121,043) Total 154, Total ( 000) Excess Assets over Liabilities 154,912 Amounts related to Ring Fenced Funds (43,395) Other Shareholder Funds (121,519) Total (10,002) E Excess Assets over Liabilities (IFRS to Solvency II) This represents the excess assets over liabilities on the Solvency II balance sheet. E Amounts related to the Ring-Fenced Funds This represents the excess of assets over liabilities over and above the SCRs for the ring-fenced funds within FLL. As these are ring-fenced they are not available to cover losses from elsewhere within FLL. Therefore eligible own funds are restricted by this amount. E Other Shareholder Funds This represents amounts held within own funds related to called up share capital, capital contributions and surplus funds disclosed on the face of the S.23 Own Funds form. 59
60 E.1.5 Deductions for participations in financial and credit institutions This represents the restriction of the valuation of the investment in FIL in the eligible own funds of FLL. The maximum value allowed in Eligible Own Funds for participations in financial and credit institutions is 10% of the Tier 1 unrestricted own funds on a Solvency II basis. The calculation of this restriction is as follows: ('000) Excess of assets over liabilities (Solvency II) 325, ,912 Ring-fenced fund restriction (49,931) (43,394) Non tier 1 items - (5,369) Total 275, ,148 10% of total 27,530 10,615 SII valuation of FIL 19,062 19,062 Deduction required - (8,447) E.1.6 Movements in equity (IFRS v Solvency II) The following tables detail the key movements in equity between IFRS and Solvency II Eligible Own Funds for 2017 and 2016: 2017 ( 000) IFRS Equity 96,029 Change in TPs 230,859 Deferred tax liability (36,397) Intangibles (15,190) FLL SII Own Funds 275,300 Group deferred tax asset 621 Group other adjusts (305) FHE Group SII Own Funds 276, ( 000) IFRS Equity 98,840 Change in TPs 66,389 Subsidiary adjustment (41,177) Deferred tax adjustment (8,813) Intangibles (12,170) FLL SII Own Funds 103,069 Group subsidiary adjust (5,008) Group deferred tax adjust 6,008 Group other adjusts 179 FHE Group SII Own Funds 104,248 60
61 E Change in TPs This movement represents the change in net technical provisions from an IFRS valuation to a Solvency II valuation. Please see Section D.2 Technical Provisions for further detail. E Subsidiary The 2016 movement represents the change in the valuation of the FLL / FHE s investment in Forester Investments Limited ( FIL ) from IFRS to Solvency II. FIL is a 100% owned subsidiary of FLL. Please see Section D.1 Assets for further detail. E Deferred tax This movement represents the change in the valuation of the deferred tax liability of the FLL / FHE based upon the asset and liability valuation changes mentioned in this Section of the report. Please see Section D.3 Other Liabilities for further detail. E Intangibles This movement represents the elimination of intangible assets from the Solvency II balance sheet. Please see Section D.1 Assets for further detail. E.2 Solvency Capital Requirement and Minimum Capital Requirement The Group uses a standard formula approach to calculate the capital requirements for the business, in accordance with Solvency II regulations. The standard formula has been assessed as suitable for the business. The Solvency Capital Requirement ( SCR ) is the amount of Own Funds that the Group is required to hold under Solvency II regulations, such that the Group can meet its obligations to policy holders and beneficiaries over the following 12 months with a 99.5% probability. The Minimum Capital Requirement ( MCR ) is the minimum level of security below which the amount of financial resources should not fall. E.2.1 Solvency Capital Requirement The total FHE undiversified capital requirement at 31 December 2017 is 307.1m, and diversified is 198.1m, with 36% diversification of risk across the portfolio. The distribution of the undiversified net Group SCR by risk module is as follows: 61
62 Capital Requirements by risk module : Pre-Diversification 2% 2% 51% 5% 40% Market risk Counterparty default risk Life underwriting risk Health underwriting risk Operational risk Risk Module Market risk 101,435 32,405 Counterparty default risk 13,679 4,339 Life underwriting risk 130,578 51,094 Health underwriting risk 3,916 3,968 Operational risk 5,435 4,127 Undiversified SCR 255,042 95,933 The significant increase in Market risk and Life Underwriting risk is due to the transfer of the FFML business into FLL. The distribution of the undiversified net Group SCR by key risks is as follows: 62
63 Capital Requirements by risk: Pre-Diversification 2% 8% 5% 2% 5% 8% 31% 39% Persistency Risk Equity Risk Expense Risk Currency Risk Mortality Risk Counterparty Default Risk Operational Risk Other The key risk modules for the company are the Market and Life Underwriting Risk modules. The most significant exposures are Persistency Risk, Equity risk and Currency Risk, as set out in section C of this report. FLL benefits primarily from the correlation between market and life risk modules. The Group uses management actions within the ring fenced funds to reduce the impact of stressed events and hence reduce the need to hold capital. There is no material difference between FLL and FHE risk profile. Group Solvency Capital Requirement method The Group Solvency Capital Requirement is calculated using method 1 Accounting Consolidation based method as mentioned in Article 230 of Solvency II Directive. This method considers the Group as a single entity. The SCR for non-insurance entities is added separately to the SCR for the insurance entities to obtain the consolidated Group SCR. The SCR is split between types of entity as shown in the table below. FHE does not have any non-controlled participations or residual undertakings. FHE includes FFML which is treated as an investment company. SCR split by type of entity: 2017 ( '000) Insurance entities 195,783 Other financial sector entities 3,365 Non-controlled participations - Residual undertakings - Total FHE SCR 198,148 63
64 SCR split by type of entity: 2016 ( '000) Insurance entities 73,979 Other financial sector entities 1,800 Non-controlled participations - Residual undertakings - Total FHE SCR 75,779 FLL has one non-profit fund and four ring-fenced funds within FLL and one investment subsidiary, FFML. Under Solvency II, ring-fenced funds and non-insurance entities do not diversify with the rest of the Group. This means that no diversification benefits arise between the funds. The key valuation differences for the SCR between FHE Group and FLL are as follows: Pensions liability The defined benefit section of the staff pension scheme (FGEPS - as described in section 1.4) is held at the Group level and not reflected in the FLL Solo level. The pension scheme deficit for FGEPS is stressed with market stresses and included in the Group SCR. FHE expense margin The FLL Solo Entity capital requirements reflect an expense margin charged by FHE. This margin is removed in the calculation of the FHE SCR as it is an intra-group transaction. FFML In the FLL Solo Entity capital requirements, FFML is treated as a strategic investment, valued at net assets with some restrictions around recognition. In the Group capital requirements, the current FFML sectoral capital requirement is held. Separate capital on a Solvency II basis is not calculated. More details about FFML can be found in section D.1.4. E.2.2 Minimum Capital Requirement The MCR for FHE at Year End 2017 is 49.5m, and own funds can cover this by 5.58 times. The SCR for FHE is 198.1m and own funds can cover this by 1.39 times. The MCR for FLL at Year End 2017 is 48.8m, and own funds can cover this by 5.64 times. The SCR for FLL is 195.2m and own funds can cover this by 1.41 times. The MCR is calculated in accordance with the Article 129 of the final version of the Directive 2009/138/EC ( '000) Total FHE Total FLL Own funds 276, ,300 MCR 49,537 48,806 MCR coverage ratio SCR 198, ,225 SCR coverage ratio
65 2016 ( '000) Total FLL Total FHE Own funds to cover SCR 103, ,248 DTA (5,369) (5,369) Investment in credit institution 0 (5,614) Own funds to cover MCR 97,700 93,265 MCR 18,413 18,945 MCR coverage ratio SCR 73,653 75,779 SCR coverage ratio Inputs into the MCR calculation for 2017 and 2016: 2017 ( '000) Total FHE Total FLL AMCR* 3,287 3,287 Linear MCR 30,115 30,130 SCR 198, ,225 Combined MCR 49,537 48,806 MCR 49,537 48, ( '000) Total FLL Total FHE AMCR* 3,332 3,332 Linear MCR 17,097 17,074 SCR 73,653 75,779 Combined MCR 18,413 18,945 MCR 18,413 18,945 *AMCR: Absolute floor of the MCR 65
66 E.2.3 Material changes over the reporting period 1 The Group SCR increased from 75.8m to 198.1m during the reporting period. The main driver of the increase is capital requirement on ex-ffml book being recognised in FLL. The other drivers include market movements, new business and methodology changes. Therefore, the primary drivers of the increase in SCR are as follows: the transfer of the ex-ffml book of business into FLL; higher exposure to market risks from unit linked business due to buoyant capital markets throughout 2017, e.g. FTSE100 has risen by 7.6% during the year; new business written during the year; and higher equity risk due to increase in Symmetric Adjustment, a prescribed parameter from EIOPA that governs the magnitude of equity risk stress in SII Standard Formula. The following methodology changes have had a minor impact on the Year End 2017 SCR: improvements to the way investment expenses have been modelled; and treatment of lapse risk regarding certain matured policies in Tunbridge Wells Fund. E.2.4 Other information The Company is not making use of: any material simplified calculations within standard formula risk modules (there is only small amount of unmodelled reserves being calculated approximately in a separate spreadsheet); any undertaking-specific parameters within standard formula parameters; any capital add-ons; the duration-based equity risk sub-module in the SCR calculation; and any transitional measures, as described in Articles 308b, 308c and 308d of the final version of the Directive 2009/138/EC. 1 This subsection is unaudited. 66
67 F Templates The following Quantitative Reporting Templates ( QRTs ) are required for the SFCR: QRT QRT name Entity reference S Balance Sheet Group and Company S Premiums, claims and expenses Group and Company S Premiums, claims and expenses by country Group and Company S Own Funds Group and Company S Solvency Capital Requirement for undertakings on Group and Company Standard Formula S Minimum Capital Requirement - Only life or only Company non-life insurance or reinsurance activity S Undertakings in the scope of the group Group These templates are included at the end of this report. 67
68 G Validations Forester Holdings (Europe) Limited ('FHE') Approval of the Solvency and Financial Condition Report Financial period ended 31 December, 2017 We certify that: 1. the Solvency and Financial Condition Report ( SFCR ) has been properly prepared in all material respects in accordance with the PRA rules and Solvency II Regulations; and 2. we are satisfied that (a) (b) throughout the financial year in question, the Group has complied in all material respects with the requirements of the PRA rules and Solvency II Regulations as applicable to the Group; and it is reasonable to believe that, at the data of the submission of the SFCR, the Group has continued to comply, and will continue comply in future H Approval by the Administrative, Management or Supervisory Body AMSB of the SFCR and reporting templates Director Date: 10/05/
69 69

70 70
71 71

72 72
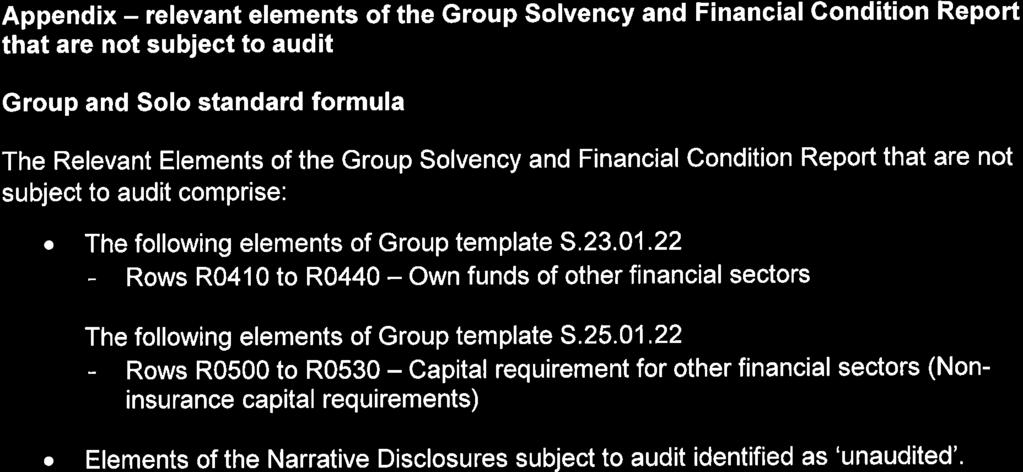
73 73
Solvency and Financial Condition Report 20I7
 Solvency and Financial Condition Report 20I7 Contents Contents... 2 Director s Statement... 4 Report of the External Independent Auditor... 5 Summary... 9 Company Information... 9 Purpose of the Solvency
Solvency and Financial Condition Report 20I6
 Solvency and Financial Condition Report 20I6 Contents Contents... 2 Director s Statement... 4 Report of the External Independent Auditor... 5 Summary... 9 Company Information... 9 Purpose of the Solvency
Legal and General Assurance (Pensions Management) Limited. Solvency and Financial Condition Report 31 DECEMBER 2017
 Limited. Solvency and Financial Condition Report 31 DECEMBER 2017") Legal and General Assurance (Pensions Management) Limited Solvency and Financial Condition Report 31 DECEMBER 2017 1 Contents Summary... 4 Directors certificate... 8 Auditors report and opinion... 9 A.
Legal and General Assurance (Pensions Management) Limited Solvency and Financial Condition Report 31 DECEMBER 2017 1 Contents Summary... 4 Directors certificate... 8 Auditors report and opinion... 9 A.
BAILLIE GIFFORD. Baillie Gifford Life Limited Solvency and Financial Condition Report (SFCR) As at 31 March 2018
 As at 31 March 2018") BAILLIE GIFFORD Baillie Gifford Life Limited Solvency and Financial Condition Report (SFCR) As at 31 March 2018 Contents Page Summary 3 A Business and Performance 5 B System of Governance 8 C Risk Profile
BAILLIE GIFFORD Baillie Gifford Life Limited Solvency and Financial Condition Report (SFCR) As at 31 March 2018 Contents Page Summary 3 A Business and Performance 5 B System of Governance 8 C Risk Profile
Solvency and financial condition report Standard Life Assurance Limited
 Solvency and financial condition report 2017 Standard Life Assurance Limited Contents Summary 2 A Business and performance 8 A.1 Business 8 A.2 Underwriting performance 10 A.3 Investment performance 12
SOLVENCY AND FINANCIAL CONDITION REPORT EUROLIFE LTD
 SOLVENCY AND FINANCIAL CONDITION REPORT EUROLIFE LTD FOR THE YEAR ENDING 31 DECEMBER 2016 1 Table of Contents 1.Executive Summary... 5 1.1 Overview... 5 1.2 Business and performance... 5 1.3 System of
Hodge Life Assurance Company Limited
 Solvency and Financial Condition Report 1 Our Values Doing the right thing is what we aim to do in all areas of our business it guides our decisions. Hodge Lifetime is a business that has been dedicated
Solvency and financial condition report 2017
 Solvency and financial condition report 2017 The Standard Life Assurance Company 2006 Contents Summary 2 A Business and performance 4 A.1 Business 4 A.2 Underwriting performance 5 A.3 Investment performance
Solvency & Financial Condition Report Centrewrite Limited
 Solvency & Financial Condition Report Centrewrite Limited For the year ended 31 December 2016 Prepared in accordance with Chapter XIII Section 1 Article 290-298 of Directive 2009/138/EC and Annex XX of
Legal and General Assurance (Pensions Management) Limited. Solvency and Financial Condition Report 31 DECEMBER 2018
 Limited. Solvency and Financial Condition Report 31 DECEMBER 2018") Legal and General Assurance (Pensions Management) Limited Solvency and Financial Condition Report 31 DECEMBER 2018 1 Contents Summary... 4 Directors certificate... 8 A. Business and Performance... 9 A.1
Legal and General Assurance (Pensions Management) Limited Solvency and Financial Condition Report 31 DECEMBER 2018 1 Contents Summary... 4 Directors certificate... 8 A. Business and Performance... 9 A.1
SOLVENCY AND FINANCIAL CONDITION REPORT EUROLIFE LTD
 SOLVENCY AND FINANCIAL CONDITION REPORT EUROLIFE LTD FOR THE YEAR ENDING 31 DECEMBER 2017 1 Table of Contents 1. Executive Summary... 5 1.1 Overview... 5 1.2 Business and performance... 5 1.3 System of
Aviva Life & Pensions UK Limited
 Aviva Life & Pensions UK 2016 Solvency and Financial Condition Report Contents Executive Summary A B C D E F Business and Performance System of Governance Risk Profile Valuation for Solvency Purposes Capital
Contents Summary Directors Report Independent Auditors A. Business and Performance B. System of Governance C. Risk Profile
 Scottish Friendly Solvency and Financial Condition Report December 2017 Contents Summary 3 Directors Report 4 Independent Auditors 5 A. Business and Performance 8 A.1. Business 8 A.2. Underwriting Performance
Forsikringsselskabet Privatsikring A/S. Solvency and Financial Condition Report
 Forsikringsselskabet Privatsikring A/S Solvency and Financial Condition Report 2017 Introduction... 3 Summary... 4 A. Business and Performance... 6 A.1 Business... 6 A.2 Underwriting Performance... 9 A.3
Covéa Life Limited Solvency and Financial Condition Report. 31 st December Prepared by: Covéa Life Limited Norman Place Reading RG1 8DA.
 Covéa Life Limited Solvency and Financial Condition Report 31 st December 2017 Prepared by: Covéa Life Limited Norman Place Reading RG1 8DA Life Contents Approval of the Solvency and Financial Condition
Solvency and Financial Condition Report 31 December 2016
 Prudential Pensions Limited Solvency and Financial Condition Report 31 December 2016 Contents Summary... 4 A. Business and performance... 7 A.1 Business... 7 A.2 Underwriting performance... 9 A.3 Investment
Friends Life Limited Solvency and Financial Condition Report
 Friends Life Limited 2016 Solvency and Financial Condition Report Contents Executive Summary A B C D E F Business and Performance Systems of Governance Risk Profile Valuation for Solvency Purposes Capital
Group Solvency and Financial Condition Report
 Group Solvency and Financial Condition Report The United Kingdom Mutual Steam Ship Assurance Association (Bermuda) Limited Year ended 20 February 2018 Contents A. Summary 5 Directors Statement 6 Auditors
Solvency & Financial Condition Report. Surestone Insurance dac March
 Solvency & Financial Condition Report Surestone Insurance dac March 31 2018 Contents SUMMARY... 1 A BUSINESS AND PERFORMANCE... 3 B SYSTEM OF GOVERNANCE... 7 C. RISK PROFILE... 23 D. VALUATION FOR SOLVENCY
Your Partner in Insurance. Solvency and Financial Condition Report. Ageas Insurance Limited Company Registration Number:
 Your Partner in Insurance Solvency and Financial Condition Report Ageas Insurance Limited Company Registration Number: 354568 For the year ended 31 st December 2017 CONTENTS SUMMARY 3 A BUSINESS AND PERFORMANCE
LEGAL AND GENERAL ASSURANCE SOCIETY LIMITED SOLVENCY AND FINANCIAL CONDITION REPORT
 LEGAL AND GENERAL ASSURANCE SOCIETY LIMITED SOLVENCY AND FINANCIAL CONDITION REPORT 31 DECEMBER 2017 CONTENTS SUMMARY... 4 DIRECTORS CERTIFICATE... 9 AUDITORS REPORT... 10 A. BUSINESS AND PERFORMANCE...
FIL Life Insurance Limited. Solvency and Financial Condition Report as at 30 th June 2017
 FIL Life Insurance Limited Solvency and Financial Condition Report as at 30 th June 2017 Table of Contents Introduction and Summary... 1 Section A : Business and Performance... 3 A.1 Business... 3 A.2
FIL Life Insurance Limited. Solvency and Financial Condition Report as at 30 June 2016
 FIL Life Insurance Limited Solvency and Financial Condition Report as at 30 June 2016 Table of Contents Introduction... 1 Section A : Business and Performance... 2 A.1 Business... 2 A.2 Underwriting Performance...
Aviva Insurance Limited. Solvency and Financial Condition Report Year ended 31 December 2016
 Aviva Insurance Limited Solvency and Financial Condition Report Year ended 31 December 2016 Contents Summary A B C D E F Business and Performance System of Governance Risk Profile Valuation for Solvency
Solvency and Financial Condition Report
 Solvency and Financial Condition Report The Rechabite Friendly Society Limited 31 December 2017 Contents Introduction Summary A Business and performance A.1 Business A.2 Underwriting performance A.3 Investment
The Baptist Insurance Company PLC. Solvency and Financial Condition Report
 The Baptist Insurance Company PLC Solvency and Financial Condition Report 31 December 2017 Contents Executive Summary... 4 Directors Statement of Responsibilities... 6 Audit Report... 7 A. Business and
Solvency and Financial Condition Report
 Swiss Re Specialty Insurance (UK) Limited Solvency and Financial Condition Report For the year ended 31 December 2016 1 Contents Directors' report... 3 Independent Auditors' Report... 4 Executive summary...
SOLVENCY AND FINANCIAL CONDITION REPORT
 SOLVENCY AND FINANCIAL CONDITION REPORT PA (GI) Limited For the year ended 31 December 2016 CONTENTS Summary 01 Directors responsibility statement 03 Auditor s report 04 Section A 07 Business and performance
Direct Line Insurance Group plc (the Company ) Terms of Reference of the Board Risk Committee (the Committee )
 Terms of Reference of the Board Risk Committee (the Committee )") Direct Line Insurance Group plc (the Company ) Terms of Reference of the Board Risk Committee (the Committee ) Chair An independent Non-Executive Director. In the absence of the Chair of the Committee,
Direct Line Insurance Group plc (the Company ) Terms of Reference of the Board Risk Committee (the Committee ) Chair An independent Non-Executive Director. In the absence of the Chair of the Committee,
FIL Life Insurance (Ireland) DAC. Solvency and Financial Condition Report as at 30 June 2016
 DAC. Solvency and Financial Condition Report as at 30 June 2016") FIL Life Insurance (Ireland) DAC Solvency and Financial Condition Report as at 30 June 2016 1 Contents INTRODUCTION... 5 EXECUTIVE SUMMARY... 6 A.1 Business... 8 A.2 Underwriting Performance... 9 A.3 Investment
FIL Life Insurance (Ireland) DAC Solvency and Financial Condition Report as at 30 June 2016 1 Contents INTRODUCTION... 5 EXECUTIVE SUMMARY... 6 A.1 Business... 8 A.2 Underwriting Performance... 9 A.3 Investment
Managed Pension Funds Limited
 . Managed Pension Funds Limited Solvency and Financial Condition Report as at 31 December 2017 Managed Pension Funds Limited General Contents Summary... 4 Section A: Business and Performance... 7 A.1 Business...
SOLVENCY & FINANCIAL CONDITION REPORT. SureStone Insurance dac
 SOLVENCY & FINANCIAL CONDITION REPORT SureStone Insurance dac March 31 2017 TABLE OF CONTENTS SUMMARY 1 A BUSINESS AND PERFORMANCE 2 B SYSTEM OF GOVERNANCE 5 C RISK PROFILE 19 D VALUATION FOR SOLVENCY
UIA (Insurance) Ltd. Solvency and Financial Condition Report
 Ltd. Solvency and Financial Condition Report") UIA (Insurance) Ltd Solvency and Financial Condition Report As at 31 December 2016 1 2 3 4 4.1 4.2 5 5.1 5.2 5.3 5.4 5.5 5.6 5.7 5.8 6 6.1 6.2 6.3 6.4 6.5 6.6 6.7 7 7.1 7.2 8 8.1 8.2 8.3 8.4 Contents Introduction
UIA (Insurance) Ltd Solvency and Financial Condition Report As at 31 December 2016 1 2 3 4 4.1 4.2 5 5.1 5.2 5.3 5.4 5.5 5.6 5.7 5.8 6 6.1 6.2 6.3 6.4 6.5 6.6 6.7 7 7.1 7.2 8 8.1 8.2 8.3 8.4 Contents Introduction
TRAVELERS INSURANCE COMPANY LIMITED
 TRAVELERS INSURANCE COMPANY LIMITED Solvency and Financial Condition Report 2017 TRAVELERS SOLVENCY AND FINANCIAL CONDITION REPORT 1 Contents EXECUTIVE SUMMARY 3 BUSINESS AND PERFORMANCE 3 SYSTEM OF GOVERNANCE
The Baptist Insurance Company PLC Solvency and Financial Condition Report. 31 December 2016
 The Baptist Insurance Company PLC Solvency and Financial Condition Report 31 December 2016 Contents Executive Summary... 4 Directors Statement of Responsibilities... 6 Audit Report... 7 A. Business and
Tokio Millennium Re (UK) Limited
 Limited") Tokio Millennium Re (UK) Limited Solvency and Financial Condition Report Year ended 31 December 2017 Contents Directors Report... 2 Summary... 6 A. Business and External Environment...8 B. System of Governance...
Tokio Millennium Re (UK) Limited Solvency and Financial Condition Report Year ended 31 December 2017 Contents Directors Report... 2 Summary... 6 A. Business and External Environment...8 B. System of Governance...
Solvency and Financial Condition Report. The United Kingdom Mutual Steam Ship Assurance Association (Europe) Limited
 Limited") Solvency and Financial Condition Report The United Kingdom Mutual Steam Ship Assurance Association (Europe) Limited Year ended 20 February 2017 Contents A. Summary... 3 Directors Statement... 3 Auditors
Solvency and Financial Condition Report The United Kingdom Mutual Steam Ship Assurance Association (Europe) Limited Year ended 20 February 2017 Contents A. Summary... 3 Directors Statement... 3 Auditors
SOLVENCY AND FINANCIAL CONDITION REPORT (SFCR) OLD MUTUAL WEALTH LIFE & PENSIONS LIMITED
 OLD MUTUAL WEALTH LIFE & PENSIONS LIMITED") SOLVENCY AND FINANCIAL CONDITION REPORT (SFCR) OLD MUTUAL WEALTH LIFE & PENSIONS LIMITED OLD MUTUAL WEALTH LIFE & PENSIONS LIMITED APPROVAL BY THE BOARD OF DIRECTORS OF THE SOLVENCY AND FINANCIAL CONDITION
SOLVENCY AND FINANCIAL CONDITION REPORT (SFCR) OLD MUTUAL WEALTH LIFE & PENSIONS LIMITED OLD MUTUAL WEALTH LIFE & PENSIONS LIMITED APPROVAL BY THE BOARD OF DIRECTORS OF THE SOLVENCY AND FINANCIAL CONDITION
First Title Insurance plc Solvency and Financial Condition Report
 First Title Insurance plc Solvency and Financial Condition Report (For financial year ended 31 December 2017) Leading Title Insurance Contents Summary... 3 Directors statement in respect of the SFCR for
BERMUDA INSURANCE (GROUP SUPERVISION) RULES 2011 BR 76 / 2011
 RULES 2011 BR 76 / 2011") QUO FA T A F U E R N T BERMUDA INSURANCE (GROUP SUPERVISION) RULES 2011 BR 76 / 2011 TABLE OF CONTENTS 1 2 3 4 5 6 7 8 9 10 11 12 13 14 15 16 17 18 19 20 Citation and commencement PART 1 GROUP RESPONSIBILITIES
QUO FA T A F U E R N T BERMUDA INSURANCE (GROUP SUPERVISION) RULES 2011 BR 76 / 2011 TABLE OF CONTENTS 1 2 3 4 5 6 7 8 9 10 11 12 13 14 15 16 17 18 19 20 Citation and commencement PART 1 GROUP RESPONSIBILITIES
Solvency and financial condition report Standard Life International
 Solvency and financial condition report 2017 Standard Life International Contents Summary 2 A Business and performance 5 A.1 Business 5 A.2 Underwriting performance 7 A.3 Investment performance 8 A.4 Performance
RSA Insurance Ireland DAC Solvency and Financial Condition Report (SFCR) 2017
 2017") RSA Insurance Ireland DAC Solvency and Financial Condition Report (SFCR) 2017 Contents INTRODUCTION... 1 SUMMARY... 2 A BUSINESS AND PERFORMANCE... 5 A.1 BUSINESS... 5 A.2 UNDERWRITING PERFORMANCE... 9
RSA Insurance Ireland DAC Solvency and Financial Condition Report (SFCR) 2017 Contents INTRODUCTION... 1 SUMMARY... 2 A BUSINESS AND PERFORMANCE... 5 A.1 BUSINESS... 5 A.2 UNDERWRITING PERFORMANCE... 9
BERMUDA MONETARY AUTHORITY THE INSURANCE CODE OF CONDUCT FEBRUARY 2010
 Table of Contents 0. Introduction..2 1. Preliminary...3 2. Proportionality principle...3 3. Corporate governance...4 4. Risk management..9 5. Governance mechanism..17 6. Outsourcing...21 7. Market discipline
OECD GUIDELINES ON INSURER GOVERNANCE
 OECD GUIDELINES ON INSURER GOVERNANCE Edition 2017 OECD Guidelines on Insurer Governance 2017 Edition FOREWORD Foreword As financial institutions whose business is the acceptance and management of risk,
ACE Europe Life Limited Solvency and Financial Condition Report 31 December 2016
 ACE Europe Life Limited Solvency and Financial Condition Report 31 December 2016 1 Table of Contents Summary and Introduction... 3 Approval by the Administrative, Management or Supervisory Body ( AMSB
FIL Life Insurance Limited Solvency and Financial Condition Report as at 30 June 2018
 FIL Life Insurance Limited Solvency and Financial Condition Report as at 30 June 2018 Table of Contents Introduction... 1 Summary... 2 Section A : Business and Performance... 4 A.1 Business... 4 A.2 Underwriting
Solvency and Financial Condition Report Trafalgar Insurance plc
 Solvency and Financial Condition Report 2017 Trafalgar Insurance plc 1 Introduction Summary This is the solvency and financial condition report ( SFCR ) for Trafalgar Insurance plc ( Trafalgar ). Publication
SOLVENCY & FINANCIAL CONDITION REPORT
 SOLVENCY & FINANCIAL CONDITION REPORT ESURE GROUP PLC & ESURE INSURANCE LIMITED FOR THE YEAR ENDED 31 DECEMBER 2017 FOCUSED CONTROLLED SCALABLE Table of Contents Summary... 4 A) Business and performance...
Schroder Pension Management Limited. Solvency and Financial Condition Report as at 31 December 2017
 Schroder Pension Management Limited Solvency and Financial Condition Report as at 31 December 2017 Contents Background and executive summary... 4 1.1 Business and performance... 4 1.2 System of governance...
ACE Europe Life Plc (Formerly ACE Europe Life Limited) Solvency and Financial Condition Report 31 December 2017
 Solvency and Financial Condition Report 31 December 2017") ACE Europe Life Plc (Formerly ACE Europe Life Limited) Solvency and Financial Condition Report 31 December 2017 1 Table of Contents Summary and Introduction... 3 Approval by the Administrative, Management
ACE Europe Life Plc (Formerly ACE Europe Life Limited) Solvency and Financial Condition Report 31 December 2017 1 Table of Contents Summary and Introduction... 3 Approval by the Administrative, Management
Solvency and Financial Condition Report Trafalgar Insurance plc
 Solvency and Financial Condition Report 2016 Trafalgar Insurance plc 1 Summary This is the solvency and financial condition report ( SFCR ) for Trafalgar Insurance plc ( Trafalgar ). Publication of an
AETNA INSURANCE COMPANY LIMITED
 AETNA INSURANCE COMPANY LIMITED SOLVENCY AND FINANCIAL CONDITION REPORT Reporting Period 2018 Date of publication: 18 April 2019 50 Cannon Street London EC4N 6JJ Proprietary CONTENTS 1. EXECUTIVE SUMMARY...
Solvency and Financial Condition Report 2017
 Your modern mutual Solvency and Financial Condition Report 2017 (SFCR) The Shepherds Friendly Society Limited registered office: haw bank house, high Street, cheadle, cheshire SK8 1al. Tel: 0161 428 1212
TESCO PERSONAL FINANCE GROUP LTD PILLAR 3 DISCLOSURES FOR THE YEAR ENDED 28 FEBRUARY 2017
 PILLAR 3 DISCLOSURES FOR THE YEAR ENDED 28 FEBRUARY 2017 1 CONTENTS: 1. Introduction and Basel Framework 4 2. Disclosure Policy 5 2.1 Frequency of Disclosure 5 2.2 Verification and Medium 5 2.3 Use of
FOR THE YEAR ENDING 31 DECEMBER Pacific Life Re Limited ( Solo ); and Pacific Life Re Holdings Limited ( Group ) 4 May 2018
; and Pacific Life Re Holdings Limited ( Group ) 4 May 2018") FOR THE YEAR ENDING 31 DECEMBER 2017 Pacific Life Re Limited ( Solo ); and Pacific Life Re Holdings Limited ( Group ) 4 May 2018 1 Executive Summary 1 This report is a combined solvency and financial condition
FOR THE YEAR ENDING 31 DECEMBER 2017 Pacific Life Re Limited ( Solo ); and Pacific Life Re Holdings Limited ( Group ) 4 May 2018 1 Executive Summary 1 This report is a combined solvency and financial condition
Codan Forsikring A/S. Solvency and Financial Condition Report
 Codan Forsikring A/S Solvency and Financial Condition Report 2017 Introduction... 3 Summary... 4 A. Business and Performance... 6 A.1 Business... 6 A.2 Underwriting Performance... 9 A.3 Investment Performance...
Prudential Standard GOI 3 Risk Management and Internal Controls for Insurers
 Prudential Standard GOI 3 Risk Management and Internal Controls for Insurers Objectives and Key Requirements of this Prudential Standard Effective risk management is fundamental to the prudent management
Focused Controlled Scalable. Solvency & Financial Condition Report (SFCR)
") Solvency & Financial Condition Report (SFCR) esure Group plc & esure Insurance Limited for the year ended 31 December 2016 Focused Controlled Scalable Table of Contents Summary... 4 A) Business and performance...
Solvency & Financial Condition Report (SFCR) esure Group plc & esure Insurance Limited for the year ended 31 December 2016 Focused Controlled Scalable Table of Contents Summary... 4 A) Business and performance...
Solvency and Financial Condition Report (SFCR)
") Solvency and Financial Condition Report (SFCR) As at 31 December 2017 Page 1 of 51 Contents Introduction and Summary... 9 1. Business and performance... 9 2. Systems of governance... 9 3. Risk profile...
Solvency and Financial Condition Report (SFCR) As at 31 December 2017 Page 1 of 51 Contents Introduction and Summary... 9 1. Business and performance... 9 2. Systems of governance... 9 3. Risk profile...
Managed Pension Funds Limited
 . Managed Pension Funds Limited Solvency and Financial Condition Report as at 31 December 2016 Managed Pension Funds Limited General Contents Page Summary... 1 Section A: Business and Performance... 2
Solvency Financial Condition Report
 Solvency Financial Condition Report StarStone Insurance SE SISE Solvency Financial Condition Report Table of Contents Summary... 5 Section A Business and Performance (Unaudited)... 9 A1 Business... 9 A2
CATTOLICA LIFE DAC SOLVENCY AND FINANCIAL CONDITION REPORT 31 ST DECEMBER 2017
 CATTOLICA LIFE DAC SOLVENCY AND FINANCIAL CONDITION REPORT 31 ST DECEMBER 2017 May 3, 2018 TABLE OF CONTENTS EXECUTIVE SUMMARY 3 A. BUSINESS AND PEFORMANCE 5 A.1 Business A.2 Underwriting Performance 5
FOR THE YEAR ENDING 31 DECEMBER Pacific Life Re Limited ( Solo ); and Pacific Life Re Holdings Limited ( Group ) 19 May 2017
; and Pacific Life Re Holdings Limited ( Group ) 19 May 2017") FOR THE YEAR ENDING 31 DECEMBER 2016 Pacific Life Re Limited ( Solo ); and Pacific Life Re Holdings Limited ( Group ) 19 May 2017 1 Executive Summary 1 This report is a combined solvency and financial
FOR THE YEAR ENDING 31 DECEMBER 2016 Pacific Life Re Limited ( Solo ); and Pacific Life Re Holdings Limited ( Group ) 19 May 2017 1 Executive Summary 1 This report is a combined solvency and financial
Group Solvency and Financial Condition Report
 Group Solvency and Financial Condition Report The United Kingdom Mutual Steam Ship Assurance Association (Bermuda) Limited Year ended 20 February 2017 Contents A. Summary 3 Directors Statement 3 Auditors
LEGAL & GENERAL GROUP PLC risk management supplement
 LEGAL & GENERAL GROUP PLC 2017 risk management supplement Supplement contents Within this supplement we set out descriptions of the risks we face, how our risk management framework operates, as well as
PREMIER UNDERWRITING HOLDINGS (GIBRALTAR) LIMITED PREMIER INSURANCE COMPANY LIMITED
 LIMITED PREMIER INSURANCE COMPANY LIMITED") PREMIER UNDERWRITING HOLDINGS (GIBRALTAR) LIMITED PREMIER INSURANCE COMPANY LIMITED GROUP AND SOLO SOLVENCY AND FINANCIAL CONDITION REPORT As at 31 December 2017 Contents Summary... 6 A Business and Performance...
PREMIER UNDERWRITING HOLDINGS (GIBRALTAR) LIMITED PREMIER INSURANCE COMPANY LIMITED GROUP AND SOLO SOLVENCY AND FINANCIAL CONDITION REPORT As at 31 December 2017 Contents Summary... 6 A Business and Performance...
Advent Insurance dac. Solvency and Financial Condition Report ( SFCR ) for the financial year ended 31 December P a g e 1
 for the financial year ended 31 December P a g e 1") Advent Insurance dac Solvency and Financial Condition Report ( SFCR ) for the financial year ended 31 December 2016 P a g e 1 Contents EXECUTIVE SUMMARY... 4 A BUSINESS AND PERFORMANCE... 6 A.1 BUSINESS...
Advent Insurance dac Solvency and Financial Condition Report ( SFCR ) for the financial year ended 31 December 2016 P a g e 1 Contents EXECUTIVE SUMMARY... 4 A BUSINESS AND PERFORMANCE... 6 A.1 BUSINESS...
LMA GUIDANCE: SENIOR INSURANCE MANAGERS REGIME (SIMR)
") LMA GUIDANCE: SENIOR INSURANCE MANAGERS REGIME (SIMR) JULY 2015 LMA GUIDANCE SENIOR INSURANCE MANAGERS REGIME (SIMR) 1. SUMMARY Starting November 2014, the PRA and FCA issued a joint series of three consultation
LMA GUIDANCE: SENIOR INSURANCE MANAGERS REGIME (SIMR) JULY 2015 LMA GUIDANCE SENIOR INSURANCE MANAGERS REGIME (SIMR) 1. SUMMARY Starting November 2014, the PRA and FCA issued a joint series of three consultation
EC Insurance Company Ltd.
 EC Insurance Company Ltd. Solvency and Financial Condition Report for the year ended December 31, 2017 ECIC is a trading name of Markel International Insurance Company Limited, whose ultimate holding company
 Senior Insurance I Managers Regime (SIMR) The Chief Executive is responsible for allocating each of the SIMR prescribed responsibilities to one or more approved persons in accordance with the PRA Rulebook
Solvency and Financial Condition Report (SFCR)
") The Standard Club Europe Ltd Public report Solvency and Financial Condition Report (SFCR) 2017 Registered company number 17864 CONTENTS SUMMARY... 2 A. BUSINESS AND PERFORMANCE... 3 A.1 BUSINESS...3 A.2
The Standard Club Europe Ltd Public report Solvency and Financial Condition Report (SFCR) 2017 Registered company number 17864 CONTENTS SUMMARY... 2 A. BUSINESS AND PERFORMANCE... 3 A.1 BUSINESS...3 A.2
THE LONDON STEAM-SHIP OWNERS MUTUAL INSURANCE ASSOCIATION LIMITED
 THE LONDON STEAM-SHIP OWNERS MUTUAL INSURANCE ASSOCIATION LIMITED Solvency & Financial Condition Report As at 20 February 2017 Registered in England: 10341 Registered Office: 50 Leman Street London E1
SUMMARY... 3 A BUSINESS AND PERFORMANCE... 8 B SYSTEM OF GOVERNANCE C RISK PROFILE D VALUATION FOR SOLVENCY PURPOSES...
 Solvency and Financial Condition Report (SFCR) Valuation date: 31st of December 2017 Table of Contents SUMMARY... 3 A BUSINESS AND PERFORMANCE... 8 BUSINESS... 8 UNDERWRITING PERFORMANCE... 10 INVESTMENT
SOLVENCY AND FINANCIAL CONDITION REPORT
 SOLVENCY AND FINANCIAL CONDITION REPORT Year ended 31 March 2017 Company No. 08670444 Authorised by the Prudential Regulation Authority and regulated by the Prudential Regulation Authority and the Financial
Solvency and Financial Condition Report Aegon Ireland
 Solvency and Financial Condition Report Aegon Ireland 2017 Page 1 of 58 Contents Scope of the report... 4 Summary... 5 Business and Performance... 5 System of Governance... 5 Risk Profile... 6 Valuation
SOLVENCY AND FINANCIAL CONDITION REPORT Irish Life Health dac
 SOLVENCY AND FINANCIAL CONDITION REPORT 2017 Irish Life Health dac 1 Contents Summary 4 A. Business and Performance 7 A.1 Business 8 A.1.1 Company Information: 8 A.2 Underwriting Performance 9 A.3 Investment
SOLVENCY AND FINANCIAL CONDITION REPORT AS AT 31ST DECEMBER 2017
 SOLVENCY AND FINANCIAL CONDITION REPORT AS AT 31ST DECEMBER 2017 May 2018 Executive Summary Business performance The principal activities of Hellenic Alico Life Insurance Company Limited are the underwriting
Pillar 3 Disclosures. 31 December 2013
 Pillar 3 Disclosures 31 December 2013 Contents 1. Overview... 3 1.1 Background... 3 1.2 Scope of application... 3 1.3 Basis and frequency of disclosures... 3 1.4 External audit... 3 2. Risk Management
THE NORTH OF ENGLAND PROTECTING AND INDEMNITY ASSOCIATION LIMITED. North Solo Solvency and Financial Condition Report 2017
 THE NORTH OF ENGLAND PROTECTING AND INDEMNITY ASSOCIATION LIMITED North Solo Solvency and Financial Condition Report 2017 Registered in the U.K. : Limited by Guarantee The Quayside, Newcastle upon Tyne,
LIVERPOOL VICTORIA LIFE COMPANY LIMITED REPORT AND FINANCIAL STATEMENTS FOR THE YEAR ENDED 31 DECEMBER 2015
 COMPANY REGISTRATION NUMBER: 00597740 LIVERPOOL VICTORIA LIFE COMPANY LIMITED REPORT AND FINANCIAL STATEMENTS REPORT AND ACCOUNTS 2015 CONTENTS Page Directors, officers and registered office 3 Strategic
Inceptum Insurance Company Limited Solvency and Financial Condition Report ( SFCR ) (for the financial year ended 31 Dec 2016)
 (for the financial year ended 31 Dec 2016)") Inceptum Insurance Company Limited Solvency and Financial Condition Report ( SFCR ) (for the financial year ended 31 Dec 2016) Page 1 of 47 Contents Summary Directors Responsibilities Statement Independent
Inceptum Insurance Company Limited Solvency and Financial Condition Report ( SFCR ) (for the financial year ended 31 Dec 2016) Page 1 of 47 Contents Summary Directors Responsibilities Statement Independent
THE NEW INDIA ASSURANCE CO LTD UK BRANCH. Solvency and Financial Condition Report SFCR
 THE NEW INDIA ASSURANCE CO LTD UK BRANCH Solvency and Financial Condition Report SFCR 2017-18 Table of Contents Executive Summary... 3 Head of Third Country Branch Function responsibility statement 6 Auditor
Aioi Nissay Dowa Insurance Company of Europe plc (formerly Aioi Nissay Dowa Insurance Company of Europe Limited)
") Aioi Nissay Dowa Insurance Company of Europe plc (formerly Aioi Nissay Dowa Insurance Company of Europe Limited) Solvency and Financial Condition Report Year ended 31 December 2017 Table of contents Summary...
Aioi Nissay Dowa Insurance Company of Europe plc (formerly Aioi Nissay Dowa Insurance Company of Europe Limited) Solvency and Financial Condition Report Year ended 31 December 2017 Table of contents Summary...
RELIANCE MUTUAL INSURANCE SOCIETY LIMITED
 RELIANCE MUTUAL INSURANCE SOCIETY LIMITED SOLVENCY AND FINANCIAL CONDITION REPORT 2016 Registered in England No: 491580 Reliance House, 6 Vale Avenue, Tunbridge Wells, Kent, TN1 1RG www.reliancemutual.co.uk
SOLVENCY AND FINANCIAL CONDITION REPORT
 SOLVENCY AND FINANCIAL CONDITION REPORT Phoenix Life Assurance Limited For the year ended 31 December 2016 CONTENTS Summary 01 Directors responsibility rtatement 06 Auditor s report 07 Section A 10 Business
SOLVENCY AND FINANCIAL CONDITION REPORT
 SOLVENCY AND FINANCIAL CONDITION REPORT Reporting year 2017 Table of Contents Page Table of Contents 2 Executive Summary 4 A Business and Performance 7 A.1 Business 7 A.2 Underwriting Performance 8 A.3
Pillar 3 Disclosures. Sterling ISA Managers Limited Year Ending 31 st December 2017
 Pillar 3 Disclosures Sterling ISA Managers Limited Year Ending 31 st December 2017 1. Background and Scope 1.1 Background Sterling ISA Managers Limited (the Company) is supervised by the Financial Conduct
TransRe London Limited. Solvency and Financial Condition Report
 TransRe London Limited Solvency and Financial Condition Report As at 31 December 2016 2 Table of contents Table of contents... 2 About this document... 3 Directors statement... 3 Auditor s report... 4
With-Profits Actuary
 SCOTTISH EQUITABLE PLC Report of the With-Profits Actuary on the proposed transfer of business from BlackRock Life Limited to Scottish Equitable plc pursuant to Part VII of the Financial Services and Markets
Swiss Re Portfolio Partners S.A. Solvency and Financial Condition Report
 Swiss Re Portfolio Partners S.A. (formerly iptiq Insurance S.A.) Solvency and Financial Condition Report For the period ended 31 December 2016 Swiss Re Portfolio Partners S.A. 2A, rue Albert Borschette
Assurant Group Limited Single Group Solvency and Financial Condition Report. Period ended 31 December 2016
 Single Group Solvency and Financial Condition Report Period ended 31 December 2016 Contents Contents... 2 Introduction... 4 Statement of Directors Responsibilities... 9 Independent Auditors Report... 10
TD BANK INTERNATIONAL S.A.
 TD BANK INTERNATIONAL S.A. Pillar 3 Disclosures Year Ended October 31, 2013 1 Contents 1. Overview... 3 1.1 Purpose...3 1.2 Frequency and Location...3 2. Governance and Risk Management Framework... 4 2.1
New regulatory framework for insurance:
 December 2014 New regulatory framework for insurance: Proposed Senior Insurance Managers Regime (SIMR) - PRA Proposals (CP14/26) FCA consultation on changes to the approved persons regime for Solvency
Solvency and Financial Condition Report December 31, 2017
 Solvency and Financial Condition Report December 31, 2017 List of Abbreviations and Acronyms... 4 SUMMARY... 5 A. BUSINESS AND PERFORMANCE... 10 A.1. Business... 10 A.2. Underwriting performance... 11
SOLVENCY AND FINANCIAL CONDITION REPORT. 31 December 2016
 P a g e 1 Introduction Summary SOLVENCY AND FINANCIAL CONDITION REPORT A Business and Performance A1 Business A2 Underwriting Performance A3 Investment Performance A4 Performance of Other Activities A5
Ecclesiastical Insurance Group plc Solvency and Financial Condition Report. Executive Summary Statement of Directors responsibilities...
 Contents Executive Summary... 4 Statement of Directors responsibilities... 6 Audit report... 7 A. Business and performance... 11 A.1 Business details and group structure... 11 A.2 Performance from underwriting
Capital Requirements Directive Pillar 3 Disclosures For the year ended 31 August 2017
 Capital Requirements Directive Pillar 3 Disclosures For the year ended 31 August 2017 Contents INTRODUCTION... 2 RISK MANAGEMENT POLICIES AND OBJECTIVES... 3 BOARD & SUB-COMMITTEES... 3 THREE LINES OF
FIDELIS UNDERWRITING LIMITED
 Solvency and Financial Condition Report For the year 1 January 2017 to 31 December 2017 CONTENTS I. EXECUTIVE SUMMARY... 3 II. INDEPENDENT AUDITORS REPORT... 6 III. DIRECTORS STATEMENT... 6 A. BUSINESS
PRIME INSURANCE COMPANY LTD
 PRIME INSURANCE COMPANY LTD SOLVENCY AND FINANCIAL CONDITION REPORT SFCR - Page 1 Executive Summary This Solvency and Financial Condition Report has been prepared for Prime Insurance Company Ltd (hereinafter
Scottish Equitable plc Solvency and Financial Condition Report 2017
 Scottish Equitable plc Solvency and Financial Condition Report 2017 Table of contents Scope of the Report... 4 Basis of Preparation... 4 Summary... 5 Introduction... 5 A. Business and Performance... 5