Monthly Economic and Financial Developments January 2018
|
|
|
- Alberta Sharyl Summers
- 6 years ago
- Views:
Transcription

1 Release Date: 26 th February 2018 Monthly Economic and Financial Developments January 2018 In an effort to provide the public with more frequent information on its economic surveillance activities, the Central Bank has decided to release monthly reports on economic and financial sector developments in The Bahamas. The Bank monitors these conditions as part of its monetary policy mandate, to assess whether money and credit trends are sustainable relative to levels of external reserves required to protect the value of the Bahamian dollar and, if not, the degree to which credit policies ought to be adjusted. The main data source for this surveillance is financial institutions daily reports on foreign exchange transactions and weekly balance sheet statements. Therefore, monthly approximations may not coincide with calendar estimates reported in the Central Bank s quarterly reports. The Central Bank will release its Monthly Economic and Financial Developments report on the Monday following its monthly Monetary Policy Committee Meeting. Future Release Dates: 2018: April 3, April 30, June 4, July 2, July 30, September 3, October 1, October 29, December 3, December 17. Page 1

2 Monthly Economic and Financial Developments (MEFD) January Domestic Economic Developments Overview Indications are that the domestic economy sustained its modest improvement in January, reflecting the strengthening in tourism sector output, combined with foreign investment-led construction activity. Given higher global oil prices, the consumer price index increased in 2017, a reversal from the slight decline in the prior year. Government s budgetary operations featured a reduction in the deficit over the first half of FY2017/18, amid higher tax receipts and a decline in capital spending. Monetary sector developments featured a build-up in both liquidity and external reserves, buoyed by the Government s external borrowing activities. Real Sector Tourism Preliminary indications are that tourism activity expanded during the first month of Data from the Nassau Airport Development Company Ltd. (NAD), showed gains in passenger traffic in January, with total departures net of the domestic segment firming by 8.0%, following a marginal, 0.1% increase in the previous year. In the underlying developments, the non-u.s. international component rose by 11.8%, a turnaround from a 6.0% reduction in the previous period, while U.S. departures firmed by 7.2%, outpacing the year earlier 1.5% uptick. Meanwhile, more comprehensive data from the Ministry of Tourism revealed that the sector was buffeted by some headwinds in 2017, including a significant reduction in hotel capacity in the country s second largest market. Total visitor arrivals fell by 2.1% during the year, vis-à-vis a gain of 2.5% in the prior period. By port of entry, both sea and air arrivals decreased by 1.5% and 4.0%, respectively, compared to gains of 3.2% and 0.1% in A breakdown by market, showed that visitors to Grand Bahama decreased by 26.6%, following a 13.2% falloff in the previous year, as the declines in air and sea arrivals were extended to 43.8% and 23.5%, from 21.3% and 11.6%, respectively. Further, the growth in visitors to the main New Providence market, slowed significantly to 1.2% from 9.8% in the prior year, as the air component declined by 3.6%, vis-à-vis a 0.8% expansion in Similarly, gains in sea arrivals narrowed to 3.2% from 13.7% a year earlier. In a slight offset, visitors to the Family Islands firmed by 2.6%, vis-à-vis a 2.0% falloff in the prior period, as the growth in the air segment quickened to 14.3% from 11.8%, while the main sea component expanded by 0.8%, a reversal from a 3.9% contraction in the prior period. Prices The All Bahamas Retail Price Index rose by 1.5% during 2017, a turnaround from a 0.4% decrease a year earlier. Following respective declines of 1.1%, 4.0% and 1.3%, in 2016, the average costs for housing related items, transport, and restaurant & hotels increased by 3.7%, 2.0%, and 2.3%, respectively. Further, accretions to average costs quickened for communication (by 1.6 percentage points to 3.4%), recreation & culture (by 0.9 percentage points to 1.3%) and alcohol beverages, tobacco & narcotics (by 0.8 percentage points to 1.6%), while the decrease for food & non-alcoholic beverages costs narrowed to 0.1% from 0.9% in the prior year. Further, average price declines were noted for education (0.2%), furnishing, household equipment & routine household maintenance (1.4%), clothing and footwear (1.2%) and miscellaneous goods & services (0.7%), compared to gains in the prior year; while the uptick in health-care costs moderated to 0.8%. Page 2
3 In line with the rise in international oil prices, domestic fuel costs firmed during December. Specifically, on a monthly basis the average prices for gasoline and diesel rose by 1.8% and 1.0% to $4.42 and $4.05 per gallon, respectively, with both also higher by 11.3% and 11.6% when compared to the prior year. Fiscal Sector Preliminary data on the Government s budgetary operations for the first half of FY2017/18, revealed that the deficit narrowed by $110.0 million (36.0%) to $195.6 million, relative to the same period of FY2016/17. Supporting this outcome, total expenditure fell by $83.3 million (7.2%) to $1,074.1 million, while aggregate revenue firmed by $26.7 million (3.1%) to $878.5 million. In terms of expenditure, capital outlays were halved to $75.8 million, reflecting mainly a $61.8 million (48.6% ) reduction in infrastructure spending, largely reflecting the ratcheting-down of post hurricane rebuilding activity. In addition, asset acquisitions narrowed by $14.9 million (58.5%), as reduced outlays for land and other asset purchases, overshadowed larger purchases of financial assets. Similarly, current expenditure fell by $6.5 million (0.7%) to $998.3 million, led by a $31.9 million (6.5%) contraction in transfer payments. In particular, subsidies and other transfers decreased by $41.1 million (11.5%), due mainly to a $37.6 million (21.4%) fall in subsidies mainly to educational and health-related institutions and a $9.7 million (13.2%) reduction in transfers to public corporations. In a partial offset, transfers to households firmed by $14.9 million, buoyed by insurance-related payouts, while interest payments rose by $9.2 million (7.1%). Further, consumption spending expanded by $25.3 million (4.9%), amid gains in both wages & salaries and purchases of goods & services by $21.0 million (6.0%), and by $4.3 million (2.6%), respectively. The rise in aggregate revenue was led by a $20.8 million (2.7%) increase in tax receipts to $782.7 million. Specifically, value-added tax (VAT) collections rose by $9.9 million (3.3%), while collections of business & professional fees increased by $5.3 million (34.3%), supported by a rise in the general business fee intake. Moreover, selective taxes on services advanced by $5.0 million (51.5%) the bulk of which was due to gains in gaming taxes while other taxes expanded by $3.0 million (1.7%). In a slight offset, taxes from international trade transactions decreased by $2.3 million (0.9%), as import duty receipts fell by $6.1 million (4.5%), eclipsing the $3.8 million improvement in excise taxes. Meanwhile, non-tax revenue grew by $5.9 million (6.6%), due to an increase in fines, forfeits & administration fees. 2. Domestic Monetary Trends January 2018 vs Liquidity Monetary trends for the month of January featured a rise in banking sector liquidity, buttressed by the receipt of net proceeds from the Government s external loan, and private sector inflows via commercial banks. In particular, excess reserves a narrow measure of liquidity grew by $69.4 million to $927.0 million, extending 2017 s $25.7 million expansion, while the broader excess liquid assets rose by $53.7 million to $1,852.0 million, in line with the prior year s gain. External Reserves External reserves firmed by $52.2 million to $1,460.5 million, outpacing the prior year s $26.6 million growth. In the underlying developments, supported by the Government s US$53.4 million equivalent external loan, the Central Bank s transactions with the public sector reversed from a $6.5 million net sale, to a $26.7 million net purchase during the review period. Meanwhile, the net intake from commercial banks stood at $21.2 million, $9.8 million lower Page 3
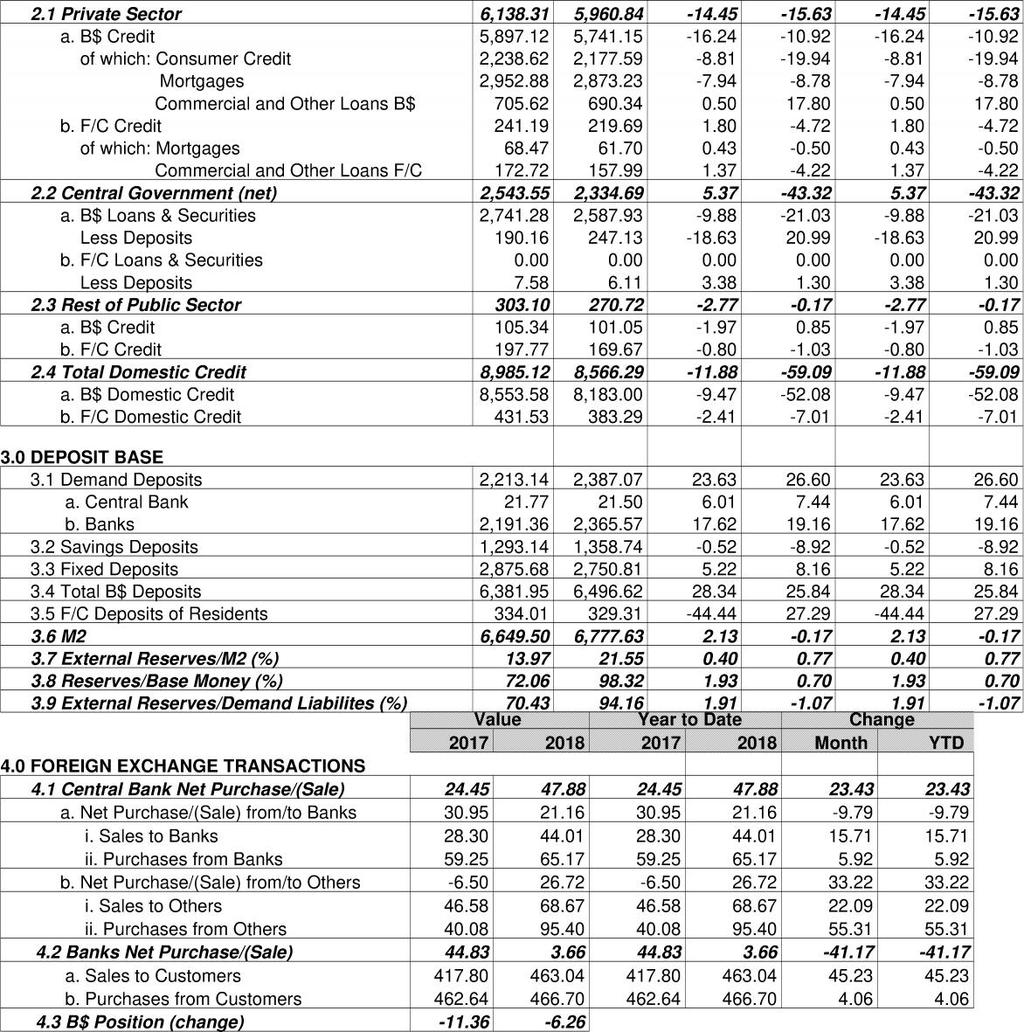
4 relative to 2017, amid a $41.2 million decline in the corresponding net purchase from the private sector to $3.7 million. Domestic Credit Bahamian Dollar Credit Total Bahamian dollar credit declined by $52.1 million, after a year-earlier reduction of $9.5 million. Underpinning this development, was a $42.0 million contraction in net claims on the Government, a reversal from an $8.8 million increase in the previous year, reflecting the use of part proceeds from the external loan to repay advances. In a slight offset, the decrease in private sector credit narrowed to $10.9 million, from $16.2 million last year. In terms of the components, commercial and other loans grew by $17.8 million from an almost stable position in 2017; however, consumer credit and mortgages fell further by $19.9 million and $8.8 million, following declines of $8.8 million and $7.9 million, respectively, in the previous year. Otherwise, claims on the public corporations edged-up by $0.9 million, following a $2.0 million net repayment in Foreign Currency Credit Total domestic foreign currency credit decreased by $7.0 million, extending the prior year s $2.4 million reduction. In particular, claims on the private sector fell by $4.7 million, a reversal from a $1.8 million gain a year ago, as net repayments were recorded for both mortgages and commercial and other loans. Further, foreign currency claims on rest of the public sector decreased by $1.0 million, after a $0.8 million softening in the previous year, while the falloff in net credit to the Government narrowed by $2.1 million to $1.3 million. Credit Quality Total private sector loan arrears decreased by $1.9 million (0.2%) to $882.9 million in January, and the ratio as a proportion of total loans, fell by 5 basis points at 15.4%. By length of delinquency, the reduction in arrears was attributed to a $2.3 million (0.4%) declin e in the non-performing segment arrears of more than 90 days and on which banks have ceased accruing interest to $565.1 million, reducing the corresponding ratio by 5 basis points to 9.8%. In contrast, the short-term, day segment, rose slightly by $0.4 million (0.1%) to $317.7 million, while the attendant ratio steadied at 5.5%. Disaggregated by loan type, the fall in arrears was led by an $8.2 million (8. 9%) contraction in commercial loan delinquencies to $84.2 million, owing to an $8.0 million ( 29.0%) decline in short-term exposures, while the nonperforming segment softened by $0.2 million (0.4%). Similarly, mortgage arrears contracted by $2.6 million (0.5%) to $531.5 million, owing to a $6.4 million (1.8%) reduction in non-accrual loans, which eclipsed the $3.8 million (2.0%) increase in day delinquencies. In contrast, consumer loan arrears rose by $8.9 million (3. 4%) to $267.2 million, with both the short and long-term segments firming. In comparison to the same period in 2017, the arrears rate sustained its downward trajectory, easing by 1.74 percentage points, due mainly to sales of commercial NPLs and a decline in their associated arrears the rate, by 16.9 percentage points. Conversely, the mortgage and consumer arrears rates increased modestly by 77 and 53 basis points, respectively. During January 2018, banks increased their total provisions for loan losses by $1.8 million (0.4%) to $425.4 million. As a result, the ratio of total provisions to arrears rose by 30 basis points to 48.2%, while the provisions to NPL ratio advanced by 62 basis points to 75.3%. During the month, banks also wrote-off $12.2 million and recovered $2.4 million. Page 4
5 Deposits Accretions to total Bahamian dollar deposits slowed by $2.5 million to $25.8 million during the review month. This outturn reflected an $8.9 million falloff in savings deposits, outpacing the marginal, $0.5 million reduction in 2017; however, accretions to demand and fixed balances accelerated to $26.6 million and $8.2 million, from $23.6 million and $5.2 million, respectively, a year ago. Interest Rates In interest rate developments, the weighted average deposit rate at banks softened by 4 basis points to 0.98%, with the highest rate of 4.50% offered on fixed balances of over 12 months. Similarly, the weighted average loan rate contracted, by 82 basis points to 10.57%, resulting in the interest rate spread narrowing by 78 basis points to 9.59 percentage points. 3. Domestic Outlook and Policy Implications Expectations are that the domestic economy will expand at a modest pace in 2018, reflecting improvements in the tourism sector and foreign investment-related construction activity. In particular, tourist arrival growth should be supported by ongoing improvements in key source markets and an increase in hotel capacity. Against this backdrop, and with some support from public sector initiatives, labor market conditions are likely to improve gradually. Inflationary pressures should remain subdued; although the recent rise in global oil prices may lead to further gains in domestic fuel costs. Meanwhile, the potential for medium-term improvement in the Government s operations, remains dependent on the success of measures to improve revenue administration and contain expenditure growth; although external shocks could adversely affect such efforts. In the monetary sector, banking sector liquidity is poised to stay at robust levels, reflecting the continued conservative stance of banks towards private sector lending and consumers deleveraging activities. Nonetheless, banks credit quality indicators are expected to continue to improve gradually, reflecting mainly loan restructuring activities, enhanced debt collections efforts and the gradually improving financial circumstances of existing borrowers. In this environment, banks are expected to remain highly capitalized, thereby mitigating any financial stability concerns. Conditions also remain favorable for further, moderate private sector net contribution to external reserve growth during the year. Page 5
6 International Developments APPENDIX During the review period, developments in the major economies remained relatively positive, as the United States and Europe sustained their modest growth rates, while developments in China continued to dominate Asian markets. In light of the rising output levels and declining jobless rates globally, most of major central banks shifted their focus to reducing the level of monetary accommodation over time. Developments in the United States were largely favorable, as real GDP expanded by 2.6% in the fourth quarter of 2017, owing to gains in personal consumption expenditure, residential and non-residential investment, exports and government spending. In the external sector, the trade deficit deteriorated by $2.7 billion to $53.1 billion in December, as the $6.2 billion rise in imports of mostly consumer goods outweighed the $3.5 billion increase in exports. In addition, non-farm payrolls firmed by 200,000 in January, amid gains in construction, food services, healthcare and manufacturing hires; although the unemployment rate steadied at 4.1%. In addition, consumer prices rose marginally, by 0.5% in January, extending the month earlier 0.1% uptick, owing to declines in energy prices. Against this backdrop, the Federal Reserve held its interest rates unchanged, following the prior month s modest tightening by 25 basis points. Economic conditions in the European region remained mildly positive over the review period, as output in both the United Kingdom (U.K.) and the euro area expanded by 0.5% and 0.6%, respectively, in the fourth quarter of 2017, compared to growth rates of 0.4% and 0.7%, in the previous three-month period. In contrast, industrial production fell by 1.3% in December, a turnaround from the 0.4% gain in the prior month, due to a reduction in mining and quarrying output. Further, the volume of retail trade in the euro area fell by 1.1% in December, vis-a-vis a 2.0% rise in the previous month, due to declines in sales of automotive fuel, non-food products, and food, drinks & tobacco. External indicators showed a widening in the U.K s trade deficit by 1.2 billion owing to an increase in fuel imports compared to the 0.5 billion rise in the previous month. In prices developments, the U.K s annual inflation eased by 50 basis points to 2.8% in January, month-on-month, due to a slowdown raw material price gains. Against this backdrop, the European Central Bank (ECB) left its key policy rates at historic lows, but continued to ratchet-down the size of its asset purchase programme by one half to 30 billion per month, while the Bank of England maintained its key policy rate at 0.5%, after raising it in November Conditions within the Asian markets were relatively tepid during the review period, as China s Purchasing Manager s Index (PMI), decreased by 30 basis points to 51.3 in January, owing to declines in the production, new orders, employed persons and supplier delivery indices. Similarly, the country s retail sales growth slowed to 9.4% from 10.2% a month earlier. Further, inflation increased marginally in Japan, as average prices rose by 0.2% in December, owing to an increase in food prices, while labour market conditions remained favourable; despite a slight rise in the jobless rate by 10 basis points to 2.8%. In the external sector, Japan s trade surplus more than tripled to billion in December, on account of the 5.5% uptick in exports, which outpaced the 1.9% increase in imports, amid high demand for electronics and cars. In monetary developments, both the People s Bank of China and the Bank of Japan kept a neutral policy stance. Against the backdrop of continued compliance by OPEC members and their allies to production cuts, crude oil prices increased by 3.7% to $69.05 per barrel during the month of January. Gains were also recorded in the precious metals markets, as the prices of gold and silver firmed by 3.2% and 2.4%, to $1, and $17.34 per troy ounce, respectively. Trends within the stock market were mixed in January. In the United States, the Dow Jones Industrial Average (DJIA) and the S&P500 indices rose by 5.8% and 5.6%, respectively, buoyed largely by the U.S. administration s recent tax policies. Further, France s CAC 40 and Germany s DAX gained by 3.2% and 2.1%, respectively; however, the United Kingdom s FTSE 100 fell by 2.0%. Meanwhile, Asian markets improved, as China s SE Composite increased by 5.3% and Japan s Nikkei225 rose by 1.5%. In January, the US dollar continued to depreciate versus other major currencies. In particular, the dollar recorded broad-based declines against the British Pound by 4.7% to , the Swiss Franc by 4.4% to CHF0.9313, the Chinese Yuan by 3.4% to CNY6.2887, the euro by 3.3% to , the Japanese Yen by 3.1% to , and the Canadian dollar by 2.1% to CAD$ Page 6
7 Page 7
8 Page 8
9 Selected International Statistics A: Selected Macroeconomic Projections (Annual % Change and % of labor force) Real GDP Inflation Rate Unemployment Bahamas N/A United States Euro-Area Germany Japan China United Kingdom Canada Source: IMF World Economic Outlook January 2018, Department of Statistics With effect from B: Official Interest Rates Selected Countries (%) CBOB ECB (EU) Federal Reserve (US) Bank Rate Refinancing Rate Primary Target Bank of England Credit Funds Repo Rate Rate Rate January February March April May June July August September October November December January February March April May June July August September October November December January Page 9
10 Selected International Statistics C. Selected Currencies (Per United States Dollars) Currency Jan-17 Dec-17 Jan-18 Mthly % YTD % 12-Mth% Change Change Change Euro Yen Pound Canadian $ Swiss Franc Renminbi Source: Bloomberg as of January 31, 2018 D. Selected Commodity Prices ($) January December January Mthly % YTD % Commodity Change Change Gold / Ounce Silver / Ounce Oil / Barrel Source: Bloomberg as of January 31, 2018 E. Equity Market Valuations January 31, 2018 (% change) BISX DJIA S&P Nikkei FTSE 100 CAC 40 DAX SE 1 month month YTD month Sources: Bloomberg and BISX F: Short Term Deposit Rates in Selected Currencies (%) USD GBP EUR o/n Month Month Month Month year Source: Bloomberg as of January 31, 2018 Page 10
11 SUMMARY ACCOUNTS OF THE CENTRAL BANK (B$ Millions) VALUE CHANGE Dec. 06 Dec. 13 Dec. 20 Dec. 27 Jan. 03 Jan. 10 Jan. 17 Jan. 24 Jan. 31 Dec. 06 Dec. 13 Dec. 20 Dec. 27 Jan. 03 Jan. 10 Jan. 17 Jan. 24 Jan. 31 I. External Resrves 1, , , , , , , , , II. Net Domestic Assets (A + B + C + D) A. Net Credit to Gov t( i + ii + iii - iv) i) Advances ii) Registered Stock iii) Treasury Bills iv) Deposits B. Rest of Public Sector (Net) (i + ii - iii) i) BDB Loans ii) BMC Bonds iii) Deposits C. Loans to/deposits with Banks D. Other Items (Net)* III. Monetary Base 1, , , , , , , , , A. Currency in Circulation B. Bank Balances with CBOB 1, , , , , , , , * Includes capital, provisions and surplus account, fixed and other assets, and other demand liabilities of Bank Page 11
12 2016/ / / / / / / / / / / / / / / / / / / / / / / / / /2018 Fiscal OperationsP (Over previous year) 1. Government Revenue & Grants % change; over previous month -7.9% -28.9% -16.0% -11.0% 12.47% -16.3% % 26.1% 35.29% -22.7% -3.98% 12.8% -4.95% 3.13% 2. Value Added Tax % change; over previous month 148.8% 74.9% % % % % 29.07% 72.54% % % -6.77% % -4.85% 3.27% 3. Import/Excise Duties % change; over previous month 73.9% -47.2% 4.7% 6.7% -7.9% -28.8% -32.2% 33.0% 61.9% -4.8% 8.80% -8.85% -0.89% -0.92% 4. Recurrent Expenditure , % change; over previous month -24.8% -67.2% -8.7% -3.8% 5.68% 4.8% 6.27% 6.1% 23.21% 9.0% % -20.3% 5.51% -0.65% 5. Capital Expenditure % change; over previous month -93.0% % 137.8% % % -2.3% % -44.9% % 70.7% % 1.3% 70.67% % 6. Deficit/Surplus* % change; over previous month -54.9% % 202.5% % % 150.2% % -58.3% 37.36% 265.3% % -67.0% % % 8. External Debt 1, , , , , , , , , , , , , , , , , , , , , , , , ,671.4 % change; over previous month -1.8% 0.3% 5.9% -0.4% 0.5% -0.2% 0.1% 0.1% -0.2% 1.0% 0.1% 0.3% 0.1% 0.4% 0.5% 6.1% -0.3% 12.7% -0.6% 9.1% -0.4% 13.1% 0.3% 0.1% 3.2% 9. Internal F/C Debt % change; over previous month 0.0% #DIV/0! 0.0% #DIV/0! 36.6% #DIV/0! 0.0% #DIV/0! % #DIV/0! #DIV/0! #DIV/0! #DIV/0! #DIV/0! #DIV/0! #DIV/0! #DIV/0! #DIV/0! #DIV/0! #DIV/0! #DIV/0! #DIV/0! #DIV/0! #DIV/0! 0.0% 10. Bahamian Dollar Debt 4, , , , , , , , , , , , , , , , , , , , , , , , ,224.2 % change; over previous month 0.1% 0.0% 0.3% 0.2% 0.0% 0.0% -0.2% 0.0% -0.5% 0.2% 0.0% 4.4% 0.7% 0.1% 1.2% -0.6% -0.2% 0.0% 4.3% -1.2% 1.6% -3.3% 0.7% 0.4% -0.3% 11. Total Amortization % change; over previous month -96.4% -85.6% 96.1% -28.3% 8.6% % -16.7% -94.2% 446.9% 108.2% -84.5% -67.0% 246.8% % 41.4% -55.0% -30.3% -10.6% 334.0% 699.1% -68.3% 148.7% -63.1% -94.6% % (0.0) (0.0) (0.0) (0.0) (0.0) (0.0) (0.0) (0.0) (0.0) (0.0) (0.0) (0.0) (0.0) (0.0) (0.0) (0.0) (0.0) (0.0) (0.0) (0.0) (0.0) (0.0) (0.0) (0.0) (0.0) Public Corp F/C Debt Total Public Sector F/C Debt 2, , , , , , , , , , , , , , , , , , , , , , , , ,605.6 % change; over previous month -1.2% 0.2% 3.9% -0.3% 0.5% -0.4% 3.6% 0.0% -2.1% 0.6% -3.4% -0.1% 3.3% 0.2% 0.3% 4.0% -2.2% 8.3% -0.4% 6.5% -0.2% 9.5% -1.9% -0.3% -3.4% 14. Tourist arrivals (000's) % change; over previous year -6.33% -4.68% 3.82% -6.41% 1.20% 3.55% 6.45% -2.23% 3.89% -3.81% 2.19% 0.95% 12.52% -5.6% 10.64% -4.8% 2.37% -34.9% % 30.2% % #DIV/0! #DIV/0! #DIV/0! 2.78% -3.00% 15. Air arrivals (000's) % change; over previous year -5.73% -1.63% 3.22% % 6.73% % -1.42% 3.51% 3.38% -5.86% 7.85% -5.85% 7.73% -8.8% 0.37% -5.0% 3.10% -39.1% % 21.2% % #DIV/0! #DIV/0! #DIV/0! 0.89% -6.94% 16. Occupied Room Nights % change; over previous year #DIV/0! #DIV/0! #DIV/0! #DIV/0! #DIV/0! #DIV/0! #DIV/0! #DIV/0! #DIV/0! #DIV/0! #DIV/0! #DIV/0! #DIV/0! #DIV/0! #DIV/0! #DIV/0! #DIV/0! #DIV/0! #DIV/0! #DIV/0! #DIV/0! #DIV/0! #DIV/0! #DIV/0! #DIV/0! #DIV/0! FISCAL/REAL SECTOR INDICATORS (B$ MILLIONS) (% change represents current month from previous month) JUL AUG SEP OCT NOV DEC JAN FEB MAR APR MAY JUN YEAR TO DATE JAN FEB MAR APR MAY JUN JUL AUG SEP OCT NOV DEC Debt P ** dec 7. Total Direct Debt 5, , , , , , , , , , , , , , , , , , , , , , , , ,932.2 % change; over previous month -0.5% 0.1% 1.9% 0.1% 0.4% 0.0% -0.1% 0.0% -1.2% 0.4% 0.1% 3.2% 0.5% 0.1% 1.0% 1.2% -0.2% 3.6% 2.9% 2.0% 1.1% 2.1% 0.6% 0.3% 0.7% JAN FEB MAR APR MAY JUN JUL AUG SEP OCT NOV DEC Real Sector Indicators (Over previous year) 13. Retail Price Index % change; over previous month -0.82% -0.04% -0.49% 1.74% -0.24% -0.54% 0.59% -0.55% 0.6% 0.28% 0.3% 0.16% 0.0% -0.4% 0.0% 0.7% 0.2% -0.3% 0.1% % 0.1% #DIV/0! -0.2% #DIV/0! -0.66% 1.52% 17. Res. Mortgage Commitments-Value of New Const. & Rehab. (B$Millions) % change; over previous qtr. 2.91% % -8.9% 25.5% 12.7% 10.3% 13.8% % -6.80% 4.30% * Includes Net Lending to Public Corporations ** Debt figures include Central Government only, unless otherwise indicated p - provisional Page 12
Monthly Economic and Financial Developments February 2017
 Release Date: 3 rd April Monthly Economic and Financial Developments February In an effort to provide the public with more frequent information on its economic surveillance activities, the Central Bank
Monthly Economic and Financial Developments January 2013
 Release Date: 8 March 2013 Monthly Economic and Financial Developments January 2013 In an effort to provide the public with more frequent information on its economic surveillance activities, the Central
Monthly Economic and Financial Developments March 2018
 Release Date: 30 th March Monthly Economic and Financial Developments March In an effort to provide the public with more frequent information on its economic surveillance activities, the Central Bank has
Monthly Economic and Financial Developments February 2007
 Release Date: 3 April Monthly Economic and Financial Developments February In an effort to provide the public with more frequent information on its economic surveillance activities, the Central Bank has
Monthly Economic and Financial Developments April 2006
 Release Date: 30 May Monthly Economic and Financial Developments April In an effort to provide the public with more frequent information on its economic surveillance activities, the Central Bank has decided
Monthly Economic and Financial Developments December 2008
 Release Date: 02 February 2009 Monthly Economic and Financial Developments December 2008 In an effort to provide the public with more frequent information on its economic surveillance activities, the Central
Monthly Economic and Financial Developments January 2019
 Release Date: 4 th March, Monthly Economic and Financial Developments January In an effort to provide the public with more frequent information on its economic surveillance activities, the Central Bank
Monthly Economic and Financial Developments July 2014
 Release Date: 29 August Monthly Economic and Financial Developments July In an effort to provide the public with more frequent information on its economic surveillance activities, the Central Bank has
Monthly Economic and Financial Developments July 2017
 Release Date: 4 th September Monthly Economic and Financial Developments July In an effort to provide the public with more frequent information on its economic surveillance activities, the Central Bank
Monthly Economic and Financial Developments October 2018
 Release Date: 3 rd December, Monthly Economic and Financial Developments October In an effort to provide the public with more frequent information on its economic surveillance activities, the Central Bank
Monthly Economic and Financial Developments June 2008
 Release Date: 13 August Monthly Economic and Financial Developments June In an effort to provide the public with more frequent information on its economic surveillance activities, the Central Bank has
Monthly Economic and Financial Developments May 2018
 Release Date: 2 nd July Monthly Economic and Financial Developments May In an effort to provide the public with more frequent information on its economic surveillance activities, the Central Bank has decided
Monthly Economic and Financial Developments September 2004
 Monthly Economic and Financial Developments September In an effort to provide the public with more frequent information on its economic surveillance activities, the Central Bank has decided to release
Quarterly Economic Review. Vol. 26, No. 4
 Quarterly Economic Review Vol. 26, No. 4 December, 2017 The Quarterly Economic Review (QER) is a publication of the Central Bank of The Bahamas, prepared by the Research Department, for issue in March,
Quarterly Economic Review. Vol. 26, No. 3
 Quarterly Economic Review Vol. 26, No. 3 September, 2017 The Quarterly Economic Review (QER) is a publication of the Central Bank of The Bahamas, prepared by the Research Department, for issue in March,
Quarterly Economic Review. Vol. 27, No. 1
 Quarterly Economic Review Vol. 27, No. 1 March, 2018 The Quarterly Economic Review (QER) is a publication of the Central Bank of The Bahamas, prepared by the Research Department, for issue in March, June,
Quarterly Economic Review. Vol. 25, No. 1
 Quarterly Economic Review Vol. 25, No. 1 March, 2016 The Quarterly Economic Review (QER) is a publication of the Central Bank of The Bahamas, prepared by the Research Department, for issue in March, June,
Quarterly Economic Review. Vol. 26, No. 2
 Quarterly Economic Review Vol. 26, No. 2 June, 2017 The Quarterly Economic Review (QER) is a publication of the Central Bank of The Bahamas, prepared by the Research Department, for issue in March, June,
Quarterly Economic Review. Vol. 27, No. 3
 Quarterly Economic Review Vol. 27, No. 3 September, 2018 The Quarterly Economic Review (QER) is a publication of the Central Bank of The Bahamas, prepared by the Research Department, for issue in March,
Monthly Economic and Financial Developments September 2008
 Release Date: 06 November Monthly Economic and Financial Developments September In an effort to provide the public with more frequent information on its economic surveillance activities, the Central Bank
Quarterly Economic and Financial Developments Report March 2018
 Quarterly Economic and Financial Developments Report March 2018 Prepared by the Research Department 1 Overview of Domestic Economic Developments REAL SECTOR Indications are that the domestic economy expanded
Monthly Economic and Financial Developments August 2004
 Monthly Economic and Financial Developments August In an effort to provide the public with more frequent information on its economic surveillance activities, the Central Bank has decided to release monthly
Quarterly Economic Review. Vol. 25, No. 4
 Quarterly Economic Review Vol. 25, No. 4 December, 2016 The Quarterly Economic Review (QER) is a publication of the Central Bank of The Bahamas, prepared by the Research Department, for issue in March,
Quarterly Economic Review. Vol. 27, No. 4
 Quarterly Economic Review Vol. 27, No. 4 December, 2018 The Quarterly Economic Review (QER) is a publication of the Central Bank of The Bahamas, prepared by the Research Department, for issue in March,
Quarterly Economic and Financial Developments Report March, 2017
 Quarterly Economic and Financial Developments Report March, 2017 Prepared by the Research Department 1 Global Economic Forecasts 12 % Real GDP Growth Since the economic recovery in 2010, countries have
Quarterly Economic Review. Vol. 23, No. 4
 Quarterly Economic Review Vol. 23, No. 4 December, 2014 The Quarterly Economic Review (QER) is a publication of the Central Bank of The Bahamas, prepared by the Research Department, for issue in March,
Quarterly Economic and Financial Developments Report September 2018
 Quarterly Economic and Financial Developments Report September 2018 Prepared by the Research Department Domestic Economic Developments Real Sector Tourism sector continued its upward momentum: over the
Quarterly Economic Review September, 2009
 Quarterly Economic Review September, 2009 Vol. 18, No.3 The Quarterly Economic Review is a publication of The Central Bank of The Bahamas, prepared by The Research Department for issue in March, June,
Quarterly Economic and Financial Developments Report December 2017
 Quarterly Economic and Financial Developments Report December 2017 Prepared by the Research Department Overview of Domestic Economic Developments REAL SECTOR OUTPUT: In 2017, domestic output was largely
Quarterly Economic and Financial Developments Report December 2016
 Quarterly Economic and Financial Developments Report December 2016 Prepared by the Research Department 1 Note to readers. In addition to its internal monthly discussions on domestic monetary and credit
Monetary Policy Report
 CENTRAL BANK OF THE GAMBIA Monetary Policy Report November 20 The Central Bank of The Gambia Monetary Policy Report provides summary of reports presented at the Monetary Policy Committee Meeting. It entails
Press Release December adjustment of monetary policy, allowed for a substantial reduction in new credit to Government by the Central Bank.
 Press Release December 2017 Overview During 2017, the Barbados economy continued to face significant macroeconomic challenges associated with declining international reserves, weak public finances and
Quarterly Economic and Financial Developments Report
 Quarterly Economic and Financial Developments Report September 2017 Prepared by the Research Department 1 Global Economic Forecasts In the latest update, the IMF forecasts 3.6% global growth in 2017, up
Quarterly Statistical Digest
 Quarterly Statistical Digest August Volume 27, No. 3 The Statistical Digest is a quarterly publication of the Central Bank of The Bahamas, prepared by the Research Department for issue in February, May,
Economic Update 9/2016
 Economic Update 9/ Date of issue: 10 October Central Bank of Malta, Address Pjazza Kastilja Valletta VLT 1060 Malta Telephone (+356) 2550 0000 Fax (+356) 2550 2500 Website https://www.centralbankmalta.org
Quarterly Statistical Digest
 Quarterly Statistical Digest February 2019 Volume 28, No. 1 The Statistical Digest is a quarterly publication of the Central Bank of The Bahamas, prepared by the Research Department for issue in February,
Economic UpdatE JUnE 2016
 Economic Update June Date of issue: 30 June Central Bank of Malta, Address Pjazza Kastilja Valletta VLT 1060 Malta Telephone (+356) 2550 0000 Fax (+356) 2550 2500 Website https://www.centralbankmalta.org
2. International developments
 2. International developments (6) During the period, global economic developments were generally positive. The economy grew faster in the second quarter, mainly driven by the favourable financing conditions
BAHAMAS. 1. General trends
 Economic Survey of Latin America and the Caribbean 2018 1 BAHAMAS 1. General trends Economic growth strengthened to 1.4% in 2017, compared with -1.7% in 2016. Activity was bolstered by growth in construction,
Financial Stability Report January - June 2014
 Financial Stability Report January - June 2014 Issue No. 3 TABLE OF CONTENTS EXEUCTIVE SUMMARY... 4 CHAPTER 1: MACROECONOMIC ENVIRONMENT... 5 1.1. The Global Environment...5 1.2. The Domestic Environment...7
Economic ProjEctions for
 Economic Projections for 2016-2018 ECONOMIC PROJECTIONS FOR 2016-2018 Outlook for the Maltese economy 1 Economic growth is expected to ease Following three years of strong expansion, the Bank s latest
The Economic Letter December 2010
 ASSOCIATION OF BANKS IN LEBANON Research & Statistics Department The Economic Letter December 2010 Summary: Despite the deceleration in the activities of a number of economic sectors in the fourth quarter,
1.0 BANK OF TANZANIA MONTHLY ECONOMIC REVIEW
 1.0 BANK OF TANZANIA MONTHLY ECONOMIC REVIEW April 2016 Contents 1.0 Inflation and Food Supply Situation... 1 1.1 Inflation Developments... 1 1.2 Food Supply Situation... 1 1.3 Prices of Food Crops...
MONTHLY ECONOMIC REVIEW
 October 218 a BANK OF TANZANIA MONTHLY ECONOMIC REVIEW October 218 b October 218 October 218 i Contents 1. Inflation and Food Stocks... 1 1.1 Inflation Developments... 1 1.2 Food Stocks... 1 1.3 Prices
Economic Projections for
 Economic Projections for 2015-2017 Article published in the Quarterly Review 2015:3, pp. 86-91 7. ECONOMIC PROJECTIONS FOR 2015-2017 Outlook for the Maltese economy 1 The Bank s latest macroeconomic projections
The real change in private inventories added 0.15 percentage points to the second quarter GDP growth, after subtracting 0.65% in the first quarter.
 QIRGRETA Monthly Macroeconomic Commentary United States The U.S. economy rebounded in the second quarter of 2007, growing at an annual rate of 3.4% Q/Q (+1.8% Y/Y), according to the GDP advance estimates
Quarterly Economic and Financial Developments Report June 2017
 Quarterly Economic and Financial Developments Report June 2017 Prepared by the Research Department 1 Global Economic Forecasts Since the economic recovery in 2010, most major economies have been expanding
DOMINICAN REPUBLIC. 1. General trends
 Economic Survey of Latin America and the Caribbean 2016 1 DOMINICAN REPUBLIC 1. General trends The economy of the Dominican Republic grew by 7.0% in 2015, compared with 7.3% in 2014. That growth is driven
NOTE ECONOMIC DEVELOPMENTS SINT MAARTEN
 NOTE ECONOMIC DEVELOPMENTS SINT MAARTEN MARCH 2018 CENTRALE BANK VAN CURAÇAO EN SINT MAARTEN 2 Centrale Bank van Curaçao en Sint Maarten Note Economic Developments Sint Maarten Centrale Bank van Curaçao
Sri Lanka: Recent Economic Trends. January 2018
 Sri Lanka: Recent Economic Trends January 2018 1 Agenda Summary Economic Growth Inflation and Monetary Policy External Account Fiscal Scenario of Government of Sri Lanka ICRA Lanka Limited 2 2 Agenda Summary
Financial Stability Report December, 2013
 Financial Stability Report December, 2013 Issue No. 2 The Financial Stability Report is a publication of The Central Bank of The Bahamas, prepared by The Research Department for issue in June and December.
[ ] WEEKLY CHANGES AGAINST THE USD
![[ ] WEEKLY CHANGES AGAINST THE USD](/thumbs/82/86622376.jpg "[ ] WEEKLY CHANGES AGAINST THE USD") January 22, 2018 [ ] MACRO & MARKETS COMMENTARY» The U.S economy and inflation expanded at a Modest to Moderate pace during December 2017, while wages continued to push higher according to the Federal
January 22, 2018 [ ] MACRO & MARKETS COMMENTARY» The U.S economy and inflation expanded at a Modest to Moderate pace during December 2017, while wages continued to push higher according to the Federal
NOTE ECONOMIC DEVELOPMENTS CURAÇAO
 NOTE ECONOMIC DEVELOPMENTS CURAÇAO MARCH 2018 CENTRALE BANK VAN CURAÇAO EN SINT MAARTEN 2 Centrale Bank van Curaçao en Sint Maarten Note Economic Developments Curaçao Centrale Bank van Curaçao en Sint
MONETARY POLICY COMMITTEE STATEMENT FOR FIRST QUARTER Governor s Presentation to the Media. 16 th May, 2018
 1 MONETARY POLICY COMMITTEE STATEMENT FOR FIRST QUARTER 2018 Governor s Presentation to the Media 16 th May, 2018 INTRODUCTION 2 The presentation is structured as follows: 1. Decision of the Monetary Policy
Financial Stability Report December, 2016
 Financial Stability Report December, 2016 Issue No. 6 The Financial Stability Report is a publication of The Central Bank of The Bahamas, prepared by The Research Department for issue in June and December.
Asia Bond Monitor June 2018
 September 8 asianbondsonline.adb.org Key Developments in Asian Local Currency Markets Japan s industrial production fell.% on a month-on-month (m-o-m) basis but rose.% on a year-on-year (y-o-y) basis in
Annual Report & Statement of Accounts for the Year Ending
 Annual Report & Statement of Accounts for the Year Ending 31 December 2004 THE CENTRAL BANK OF THE BAHAMAS Mission Statement: To foster an environment of monetary stability conducive to economic development,
Valentyn Povroznyuk, Radu Mihai Balan, Edilberto L. Segura
 September 214 GDP grew by 1.2% yoy in Q2 214. Industrial output growth was equal to 1.4% yoy in June 214. The consolidated budget deficit narrowed to.2% of GDP in January-July 214. Consumer inflation slightly
HONDURAS. 1. General trends
 Economic Survey of Latin America and the Caribbean 2016 1 HONDURAS 1. General trends Economic growth in Honduras picked up in 2015, reaching 3.6%, compared with 3.1% in 2014. This performance was mainly
[ ] WEEKLY CHANGES AGAINST THE USD
![[ ] WEEKLY CHANGES AGAINST THE USD](/thumbs/78/77362224.jpg "[ ] WEEKLY CHANGES AGAINST THE USD") January 15, 2018 [ ] MACRO & MARKETS COMMENTARY» The European central bank (ECB) has indicated it should revisit its communication stance in early 2018, according to the ECB s minutes of December meeting
January 15, 2018 [ ] MACRO & MARKETS COMMENTARY» The European central bank (ECB) has indicated it should revisit its communication stance in early 2018, according to the ECB s minutes of December meeting
Major Highlights. Recent Economic Developments. September/October,2016. Central Bank of Swaziland 1
 September/October,20 Major Highlights The country s headline inflation increased to 8.3 per cent in Septmber 20 from 8.0 per cent in August 20. Inflation rate (% y/y) 8.3 (Sep) Discount and prime rates
WEEKLY CHANGES AGAINST THE USD MACRO & MARKETS COMMENTARY
 July 03, 2017 [ W E E K LY E C O N O M I C C O M M E N TA R Y ] WEEKLY ANALYSIS FOR THE MOST CRITICAL ECONOMIC AND FINANCIAL DEVELOPMENTS MACRO & MARKETS COMMENTARY» Central banker s comments dominated
PERFORMANCE OF ECONOMY REPORT December 2017
 PERFORMANCE OF ECONOMY REPORT December 2017 MACROECONOMIC POLICY DEPARTMENT MINISTRY OF FINANCE PLANNING AND ECONOMIC DEVELOPMENT www.finance.go.ug TABLE OF CONTENTS LIST OF ACRONYMS... 3 HIGHLIGHTS...
QUARTERLY ECONOMIC REVIEW (QER)
") QUARTERLY ECONOMIC REVIEW (QER) Volume 2 No 4 January - March 2018 OBJECTIVES OF THE CENTRAL BANK OF KENYA The principal objectives of the Central Bank of Kenya (CBK) as established in the CBK Act are:
QUARTERLY ECONOMIC REVIEW (QER) Volume 2 No 4 January - March 2018 OBJECTIVES OF THE CENTRAL BANK OF KENYA The principal objectives of the Central Bank of Kenya (CBK) as established in the CBK Act are:
1 RED June/July 2018 JUNE/JULY 2018
 1 RED June/July 20 JUNE/JULY 20 2 RED June/July 20 MAJOR HIGHLIGHTS Headline consumer inflation grew by 4.9 per cent in June 20 compared to 4.8 per cent recorded in May 20 Inflation rate (% y/y) 4.9 (June)
Ontario Economic Accounts
 SECOND QUARTER OF 2017 April, May, June Ontario Economic Accounts ONTARIO MINISTRY OF FINANCE Table of Contents ECONOMIC ACCOUNTS Highlights 1 Ontario s Economy Continues to Grow Expenditure Details 2
[ ] WEEKLY CHANGES AGAINST THE USD. » The Bank of England raised its benchmark interest rate to its highest level in MACRO & MARKET COMMENTARY
![[ ] WEEKLY CHANGES AGAINST THE USD. » The Bank of England raised its benchmark interest rate to its highest level in MACRO & MARKET COMMENTARY](/thumbs/88/115177825.jpg "[ ] WEEKLY CHANGES AGAINST THE USD. » The Bank of England raised its benchmark interest rate to its highest level in MACRO & MARKET COMMENTARY") August 06, 2018 [ ] MACRO & MARKET COMMENTARY» The Bank of England raised its benchmark interest rate to its highest level in almost a decade. Raising the interest rate is suggesting that inflation continues
August 06, 2018 [ ] MACRO & MARKET COMMENTARY» The Bank of England raised its benchmark interest rate to its highest level in almost a decade. Raising the interest rate is suggesting that inflation continues
BNM Maintains OPR at 3.25%, Hawkish About Economic Outlook
 7 March 2018 ECONOMIC REVIEW March 2018 BNM MPC BNM Maintains OPR at 3.25%, Hawkish About Economic Outlook Overnight Policy Rate maintained at 3.25%. In line with our expectation, overnight policy rate,
THE CBK WEEKLY BULLETIN
 December 30, 20 THE CBK WEEKLY BULLETIN Highlights for the Week Overall 12-month inflation eased from 19.7 percent in November 20 to 18.9 percent in December 20, while annual average inflation rose from
BELIZE. 1. General trends
 Economic Survey of Latin America and the Caribbean 2017 1 BELIZE 1. General trends The Belizean economy experienced a reversal of fortunes in 2016, with growth dropping to -0.8% from 2.9% in 2015. A sharp
MACROECONOMIC POLICY DEPARTMENT MINISTRY OF FINANCE, PLANNING AND ECONOMIC DEVELOPMENT
 PERFORMANCE OF THE ECONOMY REPORT OCTOBER 2018 MACROECONOMIC POLICY DEPARTMENT MINISTRY OF FINANCE, PLANNING AND ECONOMIC DEVELOPMENT www.finance.go.ug TABLE OF CONTENTS LIST OF TABLES... ii LIST OF FIGURES...
Kazakhstan s economy expanded by 4.2% in 1H17, supported by growth in mining, manufacturing, construction and transportation sectors
 Economics Research Desk Market Highlights: Kazakhstan 18 July 2017 Kazakhstan s economy expanded by 4.2% in 1H17, supported by growth in mining, manufacturing, construction and transportation sectors Review
[ ] WEEKLY CHANGES AGAINST THE USD MACRO & MARKET COMMENTARY. » Emerging Market had another unstable week as plunging currencies promoted
![[ ] WEEKLY CHANGES AGAINST THE USD MACRO & MARKET COMMENTARY. » Emerging Market had another unstable week as plunging currencies promoted](/thumbs/94/120057369.jpg "[ ] WEEKLY CHANGES AGAINST THE USD MACRO & MARKET COMMENTARY. » Emerging Market had another unstable week as plunging currencies promoted") June 11, 2018 [ ] MACRO & MARKET COMMENTARY» Emerging Market had another unstable week as plunging currencies promoted central bank to act accordingly. The Central Bank of Turky and The Reserve Bank of
June 11, 2018 [ ] MACRO & MARKET COMMENTARY» Emerging Market had another unstable week as plunging currencies promoted central bank to act accordingly. The Central Bank of Turky and The Reserve Bank of
Inflation Remains Tepid in November at 0.2% as Transport Cost Trending Downward
 19 December 2018 ECONOMIC REVIEW November 2018 Consumer Price Index Inflation Remains Tepid in November at 0.2% as Transport Cost Trending Downward Headline inflation back to near 4-year low. Consumer
Economic Outlook: Global and India. Ajit Ranade IEEMA T & D Conclave December 12, 2014
 Economic Outlook: Global and India Ajit Ranade IEEMA T & D Conclave December 12, 2014 Global scenario US expected to drive global growth in 2015 Difference from % YoY Growth October Actual October Projections
DOMINICAN REPUBLIC. 1. General trends
 Economic Survey of Latin America and the Caribbean 2015 1 DOMINICAN REPUBLIC 1. General trends The economy of the Dominican Republic grew by 7.3% in 2014, compared with 4.8% in 2013, driven by expanding
Monthly Report PERFORMANCE OF THE ECONOMY SEPTEMBER 2017 MACROECONOMIC POLICY DEPARTMENT MINISTRY OF FINANCE, PLANNING AND ECONOMIC DEVELOPMENT
 Monthly Report PERFORMANCE OF THE ECONOMY SEPTEMBER 2017 MACROECONOMIC POLICY DEPARTMENT MINISTRY OF FINANCE, PLANNING AND ECONOMIC DEVELOPMENT www.finance.go.ug Table of Contents SUMMARY... 1 REAL SECTOR...
Macroeconomic and financial market developments. August 2017
 Macroeconomic and financial market developments August Background material to the abridged minutes of the Monetary Council meeting of August MAGYAR NEMZETI BANK Time of publication: p.m. on September The
Saudi Arabian Economy
 Saudi Arabian Economy Research Department ARC Research Team, Tel. +966 11 211 9370, devassyp@alrajhi-capital.com Saudi Arabian economy continued to expand in Q3 Saudi Arabian economy has continued to expand
WEEKLY CHANGES AGAINST THE USD MACRO & MARKETS COMMENTARY
 July 31, 2017 [ W E E K LY E C O N O M I C C O M M E N TA R Y ] WEEKLY ANALYSIS FOR THE MOST CRITICAL ECONOMIC AND FINANCIAL DEVELOPMENTS MACRO & MARKETS COMMENTARY» Federal Open Market Committee (FOMC)
Major Highlights. Recent Economic Developments April/May Central Bank of Swaziland 1
 Major Highlights Annual consumer inflation increased to 7.0 per cent in April 2017 from 6.0 per cent in March 2017. Inflation rate (% y/y) 7.0 (Apr) Discount and prime lending rates remained unchanged
Week in review. Week ending: April 27, 2018
 Week ending: April 27, 2018 MAJOR NEWS: Global equity markets were mixed for the week, amid concerns about higher borrowing rates for companies, with U.S. Treasury yields hitting the 3% mark for the first
2.1 Supply. Bank of Thailand, January Nominal Farm Income. Manufacturing Production Index (MPI)
") Bank of Thailand, uary 2.1 Supply Farm income continually increased but concentrated in certain crops and regions. Service sector continued to expand, especially for tourism-related activities on the back
Bank of Thailand, uary 2.1 Supply Farm income continually increased but concentrated in certain crops and regions. Service sector continued to expand, especially for tourism-related activities on the back
WEEKLY CHANGES AGAINST THE USD
 October 09, 2017 [ W E E K LY E C O N O M I C C O M M E N TA R Y ] WEEKLY ANALYSIS FOR THE MOST CRITICAL ECONOMIC AND FINANCIAL DEVELOPMENTS MACRO & MARKETS COMMENTARY» The storm impacted job report showed
Monthly Report PERFORMANCE OF THE ECONOMY JUNE 2018 MACROECONOMIC POLICY DEPARTMENT MINISTRY OF FINANCE, PLANNING AND ECONOMIC DEVELOPMENT
 Monthly Report PERFORMANCE OF THE ECONOMY JUNE 2018 MACROECONOMIC POLICY DEPARTMENT MINISTRY OF FINANCE, PLANNING AND ECONOMIC DEVELOPMENT www.finance.go.ug Table of Contents SUMMARY... 1 REAL SECTOR DEVELOPMENTS...
Mauritius Economy Update October 2013
 October 28, 2013 Economics Mauritius Economy Update October 2013 Mauritius, a tropical island situated towards the south east coast of Africa comprises 9 districts Flacq, Grand port, Moka, Pamplemousses,
The Economic Letter January 2018
 ASSOCIATION OF BANKS IN LEBANON Research & Statistics Department The Economic Letter January 2018 Summary: In the first month of 2018, most real sector indicators retreated in relation to the preceding
[ ] WEEKLY CHANGES AGAINST THE USD
![[ ] WEEKLY CHANGES AGAINST THE USD](/thumbs/83/87976656.jpg "[ ] WEEKLY CHANGES AGAINST THE USD") February 12, 2018 [ ] MACRO & MARKETS COMMENTARY» In the early hours of last Friday, U.S Congress approved a major budget deal that opens the door for more increase in defense and non-defense spending
February 12, 2018 [ ] MACRO & MARKETS COMMENTARY» In the early hours of last Friday, U.S Congress approved a major budget deal that opens the door for more increase in defense and non-defense spending
The Economic Letter March 2018
 ASSOCIATION OF BANKS IN LEBANON Research & Statistics Department The Economic Letter March 2018 Summary: In the first quarter 2018, most real sector indicators retreated with regard to the corresponding
WEEKLY CHANGES AGAINST THE USD
 December 04, 2017 [ W E E K LY E C O N O M I C C O M M E N TA R Y ] WEEKLY ANALYSIS FOR THE MOST CRITICAL ECONOMIC AND FINANCIAL DEVELOPMENTS MACRO & MARKETS COMMENTARY» The U.S senate passed the long-awaited
PERFORMANCE OF THE ECONOMY REPORT NOVEMBER 2017
 PERFORMANCE OF THE ECONOMY REPORT NOVEMBER 2017 MACROECONOMIC POLICY DEPARTMENT MINISTRY OF FINANCE, PLANNING AND ECONOMIC DEVELOPMENT www.finance.go.ug Table of Contents SUMMARY... 2 REAL SECTOR DEVELOPMENTS...
MACROECONOMIC AND FINANCIAL MARKET DEVELOPMENTS BACKGROUND MATERIAL TO THE ABRIDGED MINUTES OF THE MONETARY COUNCIL MEETING OF 19 DECEMBER 2017
 MACROECONOMIC AND FINANCIAL MARKET DEVELOPMENTS BACKGROUND MATERIAL TO THE ABRIDGED MINUTES OF THE MONETARY COUNCIL MEETING OF 19 DECEMBER 17 17 D E C E M B E R Time of publication: p.m. on 1 January 18
NOTE ECONOMIC DEVELOPMENTS CURAÇAO
 NOTE ECONOMIC DEVELOPMENTS CURAÇAO JULY 2018 CENTRALE BANK VAN CURAÇAO EN SINT MAARTEN 2 Centrale Bank van Curaçao en Sint Maarten Note Economic Developments Curaçao Centrale Bank van Curaçao en Sint Maarten
SACU INFLATION REPORT. February 2016
 SACU INFLATION REPORT February 2016 The content of this publication is intended for general information only. While precaution is taken to ensure the accuracy of information, the SACU Secretariat shall
KGkh BANK OF TANZANIA MONTHLY ECONOMIC REVIEW
 KGkh BANK OF TANZANIA MONTHLY ECONOMIC REVIEW June 218 Contents 1. Inflation and Food Stocks... 1 1.1 Inflation Developments... 1 1.2 Food Stocks... 1 1.3 Prices of Food Crops... 2 2. Monetary and Financial
Year in review Year in review Global Markets. Year ending: December 31, 2017 CAN: S&P/TSX 16,209 15, % MSCI All Country World Index
 Year in review Year in review Global Markets Year ending: December 31, EQUITY INDICES 29-DEC- 30-DEC- % CHG CAN: S&P/TSX 16,209 15,288 6.0% US: INDU 24,719 19,763 25.1% US: SPX 2,674 2,239 19.4% Nasdaq:
Pre-budget economic analysis Key facts and figures
 Pre-budget economic analysis Key facts and figures June 2008 Advisory Table of Contents Page 1 Macro-economic overview 1 2 External sector 10 3 Government finance 16 Appendix 1 - Glossary 21 Section 1
Economic activity gathers pace
 Produced by the Economic Research Unit October 2014 A quarterly analysis of trends in the Irish economy Economic activity gathers pace Positive data flow Recovery broadening out GDP growth revised up to
SACU INFLATION REPORT. February 2017
 SACU INFLATION REPORT February 2017 The content of this publication is intended for general information only. While precaution is taken to ensure the accuracy of information, the SACU Secretariat shall
2.1 Supply. Nominal Farm Income. Bank of Thailand, November Real Farm Income
 Bank of Thailand, November 2.1 Supply Farm income contracted from both decreased agricultural prices and production. Manufacturing and services sector activities expanded from the same period last year.