Registration document and annual financial report filed with the AMF (Autorité des Marchés Financiers) on March 7, 2014 under No. D
|
|
|
- Gavin Wood
- 6 years ago
- Views:
Transcription

1 FIRST UPDATE TO THE 2013 REGISTRATION DOCUMENT FILED WITH THE AMF ON APRIL 30, 2014 Registration document and annual financial report filed with the AMF (Autorité des Marchés Financiers) on March 7, 2014 under No. D The English language version of this report is a free translation from the original, which was prepared in French. All possible care has been taken to ensure that the translation is accurate presentation of the original. However, in all matters of interpretation, views or opinion expressed in the original language version of the document in French take precedence over the translation. Société anonyme (Public Limited Company) with capital of 2,490,325,618 euros Head office : 16 boulevard des Italiens, PARIS R.C.S.: PARIS

2 1 QUARTERLY FINANCIAL INFORMATION ADDITIONAL INFORMATION STATUTORY AUDITORS PERSON RESPONSIBLE FOR THE UPDATE TO THE REGISTRATION DOCUMENT TABLE OF CONCORDANCE Only the French version of the first update to the 2013 Registration document has been submitted to the AMF. It is therefore the only version that is binding in law. The original document was filed with the AMF (French Securities Regulator) on 30 April 2014, in accordance with article of the AMF s General Regulations. It may be used in support of a financial transaction only if supplemented by a Transaction Note that has received approval from the AMF. This document was prepared by the issuer and its signatories assume responsibility for it. 2
3 1 QUARTERLY FINANCIAL INFORMATION 1.1 Group presentation BNP Paribas, Europe s leading provider of banking and financial services, has four domestic retail banking markets in Europe, namely in Belgium, France, Italy and Luxembourg. It is present in 75 countries and has almost 185,000 employees, including over 141,000 in Europe. BNP Paribas holds key positions in its three activities: Retail Banking, which includes: a set of Domestic Markets comprising: - French Retail Banking (FRB), - BNL banca commerciale (BNL bc), Italian retail banking, - Belgian Retail Banking (BRB), - Other Domestic Markets activities, including Luxembourg Retail Banking (LRB); International Retail Banking comprising: - Europe-Mediterranean, - BancWest; Personal Finance; Investment Solutions; Corporate and Investment Banking (CIB). BNP Paribas SA is the parent company of the BNP Paribas Group. 3
4 1.2 First quarter 2014 results GROWTH IN RETAIL BANKING AND IN INVESTMENT SOLUTIONS REVENUES* CIB REVENUES HELD UP WELL, STRONG PERFORMANCE IN EQUITIES AND ADVISORY REVENUES OF THE OPERATING DIVISIONS: -0.2%* VS. 1Q13 GOOD COST CONTROL LAUNCH OF THE BUSINESS DEVELOPMENT PLAN OPERATING EXPENSES OF THE OPERATING DIVISIONS: +1.8%* VS. 1Q13 COST OF RISK UP THIS QUARTER COST OF RISK: +11.6%* VS. 1Q13 (EXCLUDING THE EXCEPTIONAL PROVISION FOR EASTERN EUROPE) HIGH SOLVENCY FULLY LOADED BASEL 3 CET1 RATIO: 10.6% VERY LARGE LIQUIDITY RESERVE 264BN AS AT SUSTAINED DEPOSIT GROWTH IN RETAIL BANKING +5.4%* VS. 1Q13 NET INCOME ATTRIBUTABLE TO EQUITY HOLDERS 1.7BN (+5.2% VS. 1Q13) IMPLEMENTATION OF THE BUSINESS DEVELOPMENT PLAN * AT CONSTANT SCOPE AND EXCHANGE RATES 4
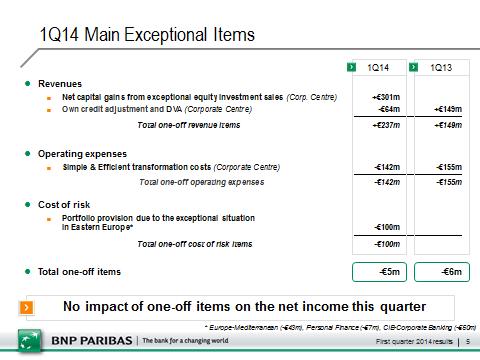
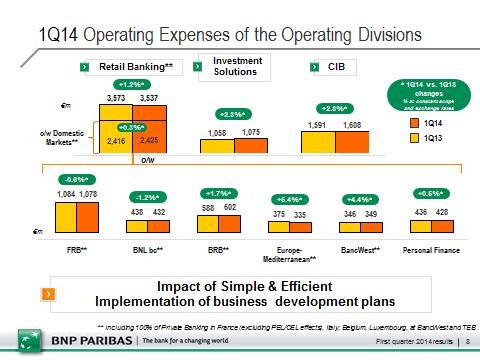
5 The Board of Directors of BNP Paribas met on 29 April The meeting was chaired by Baudouin Prot and the Board examined the Group s results for the first quarter Solid net income attributable to equity holders at 1.7bn and Implementation of the business development plan The Group posted this quarter solid earnings in an economic environment still lacklustre in Europe. Revenues were 9,913 million euros, down 0.6% compared to the first quarter It included this quarter the impact of two exceptional items for a net total of +237 million euros: a 301 million euro capital gain from exceptional sales of equity investments and a -64 million euro Own Credit Adjustment (OCA) and own credit risk included in derivatives (DVA). The one-off revenue items for the same period last year totalled +149 million euros. The revenues of the operating divisions were practically stable (-0.2% 1 compared to the first quarter 2013): they were up 0.8% 1 in Retail Banking 2, up 2.7% 1 in Investment Solutions and held up well in Corporate and Investment Banking (-3.7% 1 ). Operating expenses, which totalled 6,382 million euros, were down 1.4%. They included this quarter the one-off 142 million euro impact of Simple & Efficient transformation costs (155 million euros in the first quarter 2013). The operating expenses of the operating divisions were up 1.8% 1, reflecting both ongoing cost control and the implementation of the business development plan. They were thus up 1.2% 1 in Retail Banking 2, 2.3% 1 in Investment Solutions and 2.8% 1 in CIB. Gross operating income rose by 0.8% during the period to 3,531 million euros. It was down 3.6% 1 for the operating divisions. The Group s cost of risk was up 173 million euros this quarter, at 1,084 million euros (68 basis points of outstanding customer loans), in particular due to a 100 million euro portfolio provision due to the exceptional situation in Eastern Europe and an increase at BNL bc given the still challenging environment in Italy. Pre-tax income was thus 2,547 million euros, down 3.7% compared to the same quarter a year earlier. Given the 156 million euro decrease in the minority interests due in particular to the acquisition of the Belgian government s stake in BNP Paribas Fortis in the fourth quarter 2013, BNP Paribas posted 1,668 million euros in net income attributable to equity holders, up 5.2% compared to the first quarter One-off items had no impact on the quarter s net income, as in the first quarter Annualised return on equity was 7.2%. This quarter net earnings per share came to The Group s balance sheet is rock-solid. The Group s solvency was very high with a fully loaded Basel 3 common equity Tier 1 ratio 3 at 10.6% and a fully loaded Basel 3 leverage ratio 3 at 3.7% 4. The Group s immediately available liquidity reserve was 264 billion euros (247 billion euros at the end of 2013), equivalent to over one year of room to manoeuvre in terms of wholesale funding. 1 At constant scope and exchange rates 2 Including 100% of Private Banking of the domestic markets, BancWest and TEB (excluding PEL/CEL effects) 3 Ratio taking into account all the CRD4 rules with no transitory provisions 4 Including the forthcoming replacement of Tier 1 instruments that have become ineligible with equivalent eligible instruments 5
6 * * * RETAIL BANKING DOMESTIC MARKETS Domestic Markets deposits grew by 5.0% compared to the first quarter 2013, with good growth in France, in Belgium and at Cortal Consors in Germany. Outstanding loans were down 1.0%, due to weak demand for loans. Domestic Markets sales and marketing drive was reflected in strong asset inflows in Private Banking in France, in Italy and in Belgium (+8% in assets under management compared to the first quarter 2013). Revenues 1, at 3,929 million euros, were up 1.7% compared to the first quarter 2013 due to the good performances of off balance sheet savings, Private Banking and Arval. Operating expenses 1, which came in at 2,425 million euros, were up slightly by 0.4% compared to the same quarter a year earlier, helping Domestic Markets produce a positive 1.3 point jaws effect. The cost/income ratio 1 thus improved in France, in Italy and in Belgium, totalling 61.7% 1 for the whole Domestic Markets (-0.9 point compared to the first quarter 2013). Gross operating income 1 was 1,504 million euros, up 4.0% compared to the same quarter a year earlier. Given the rise in the cost of risk in Italy, and after allocating one-third of Private Banking s net income from Domestic Markets networks to the Investment Solutions division, pre-tax income 2 came to 875 million euros, down 11.4% compared to the first quarter French Retail Banking (FRB) The business activity of FRB reflected a good drive in deposits, up by 5.8% compared to the first quarter 2013, with in particular strong growth in current account deposits. For their part, outstanding loans decreased by 1.7% due to continuing weak demand for loans. The factoring business performed well with 10.8% growth in its outstandings and the BNP Paribas Entrepreneurs 2016 programme got off to a good start with 9,800 VSEs/SMEs receiving support for their short-term financing needs this quarter. Separately, the launch of the new Life Contingencies insurance contract was successful with 103,000 contracts signed since June Revenues 3 totalled 1,712 million euros, up 0.5% compared to the first quarter Net interest income was up by 0.5%, thanks to growth in current account deposits, and fees rose by 0.6% due to a good drive in Private Banking and cash management and despite a decrease in certain processing fees due to regulatory changes 4. Thanks to the continuing improvement of the operating efficiency, operating expenses 3 contracted by 0.6% compared to the first quarter 2013 and the cost/income ratio 3 was 63.0% (-0.7 point). Gross operating income 3 thus came to 634 million euros, up 2.4% compared to the same quarter a year earlier. 1 Including 100% of Private Banking in France (excluding PEL/CEL effects), Italy, Belgium and Luxembourg 2 Excluding PEL/CEL effects 3 Excluding PEL/CEL effects, with 100% of Private Banking 4 Certain processing fees (commissions d intervention) capped starting on 1st January (Banking Law) 6
7 The cost of risk 1 was still at a low level, at 30 basis points of outstanding customer loans, up however by 29 million euros compared to the first quarter 2013 due to the impact of one specific loan. After allocating one-third of French Private Banking s net income to the Investment Solutions division, FRB posted 487 million euros in pre-tax income 2 (-3.9% compared to the same quarter a year earlier). BNL banca commerciale (BNL bc) BNL bc s deposits were down by 2.7% compared to the first quarter 2013, the decrease on the corporate segment being partly offset by a rise in current accounts of individual clients. For their part, outstanding loans were down by 3.1% due to a slowdown on the corporate and small business segments. BNL bc also continued to develop the Private Banking business with assets under management up 20% compared to the first quarter Revenues 3 were up slightly by 0.1% compared to the first quarter 2013, at 819 million euros. Net interest income was up moderately, the decline in volumes being more than offset by a favourable structural effect on deposits. Fees were down moderately due to lower fees from loans and despite the good performance of off balance sheet savings. Thanks to the effect of cost reduction measures, in particular with respect to IT systems and real estate, operating expenses 3 were down by 1.4% compared to the first quarter 2013, at 432 million euros, and the cost/income ratio 3 was down by 0.8 point, at 52.7%. Gross operating income 3 was 387 million euros, up 1.8% compared to the same quarter a year earlier. The cost of risk 3, at 185 basis points of outstanding customer loans, rose by 23.0% compared to the first quarter 2013 (+11.3% compared to the fourth quarter 2013) due to a challenging environment in Italy. BNL bc thus continued to adapt its business model and, after allocating one-third of Italian Private Banking s net income to the Investment Solutions division, it posted 16 million euros in pre-tax income, down by 79.7% compared to the first quarter Belgian Retail Banking BRB maintained a good sales and marketing drive. Deposits rose 6.0% compared to the first quarter of 2013 thanks in particular to good growth in current accounts and savings accounts. Loans rose by 1.5% 4 during the period, due in particular to growth in loans to individuals and the fact that loans to SMEs held up well. BRB also continued to develop the Private Banking business with assets under management up 6% compared to the first quarter Excluding PEL/CEL effects, with 100% of Private Banking 2 Excluding PEL/CEL effects 3 With 100% of Italian Private Banking 4 At constant scope 7
8 Revenues 1 were up 3.1% 2 compared to the first quarter 2013, at 841 million euros. Net interest income rose driven in particular by growth in volumes, and fees were up as a result of the good performance of insurance and credit fees. Operating expenses 1 rose by 1.7% 2 compared to the first quarter 2013 due to an increase in systemic taxes. Excluding this effect, they were stable thanks to the adaptation of the branch network and the workforce. The cost/income ratio was down 1 point at 71.6% and BRB generated 239 million euros in gross operating income 1, up 6.6% 2. The cost of risk 1 was still at a low level, at 23 basis points of outstanding customer loans, up 13 basis points compared to the first quarter 2013 when it was particularly low. After allocating onethird of Belgian Private Banking s net income to the Investment Solutions division, BRB posted 171 million euros in pre-tax income, down 9.4% 2 compared to the same quarter a year earlier. Luxembourg Retail Banking: outstanding loans grew by 0.8% compared to the first quarter 2013, thanks to good growth in mortgages. Deposits were down by 1.7%, the decline in term deposits being partly offset by good asset inflow in the corporate client segment, in line with the development of cash management. Personal Investors: assets under management were up 8.9% compared to the first quarter 2013 and the brokerage business benefitted from the recovery of financial markets. Deposit growth was strong (+21.5%), thanks to a good level of new customers and the development of Hello bank! in Germany. Arval: Arval performed well with growth in the number of orders placed and the financed fleet (+0.2% 3 compared to the first quarter 2013). Consolidated outstandings were up by 1.1% 3 compared to the same quarter a year earlier. Revenues were up sharply compared to the first quarter 2013, still sustained by the rise in the price of used vehicles. Given good cost control, the cost/income ratio improved significantly compared to the first quarter Leasing Solutions: outstandings grew by 1.3% 3 compared to the same quarter a year earlier, despite continued reduction of the non-core portfolio. Revenues were up, in line with the rise in volumes, and good cost control helped improve the cost/income ratio. The cost of risk rose significantly this quarter due to the non-core portfolio in Italy. On the whole, the contribution by these four business units to Domestic Markets pre-tax income, after allocating one-third of Luxembourg Private Banking s net income to the Investment Solutions division, was down by 5.6% compared to the first quarter 2013, at 201 million euros. * * * Europe-Mediterranean Europe-Mediterranean enjoyed a good sales and marketing drive but was affected this quarter by specific items. Deposits grew by 11.8% 3 compared to the first quarter 2013 and were up in most countries. Loans grew by 11.4% 3. Sales and marketing performances were also reflected in the good 1 With 100% of Belgian Private Banking 2 At constant scope 3 At constant scope and exchange rates 8
9 development of cash management and Private Banking, with in particular a 25% 1 growth in assets under management in Turkey compared to the level as at 31 March 2013, at 3.1 billion euros. Revenues 2, at 451 million euros, were down 2.2% 1 compared to the first quarter They were up 5.0% 1 excluding the impact of new regulations on charging fees for overdrafts in Turkey and foreign exchange fees in Algeria since the beginning of the third quarter 2013 (loss of earnings of about 33 million euros per quarter). Operating expenses 2 were up by 5.4% 1 compared to the same quarter a year earlier, at 335 million euros, due to the bolstering of the commercial set up in Turkey in 2013 (20 branches opened since March 2013). The cost of risk 2, at 105 million euros, was 154 basis points of outstanding customer loans, up 18 million euros compared to the first quarter It was affected this quarter by a 43 million euros portfolio provision due to the exceptional situation in Eastern Europe. Thus, after allocating one-third of Turkish Private Banking s net income to the Investment Solutions division, Europe-Mediterranean generated 37 million euros in pre-tax income, down 59,9% 1 compared to the same quarter a year earlier (-12.3% 1 excluding the impact of the portfolio provision due to the exceptional situation in Eastern Europe). BancWest BancWest reported good business performance this quarter, despite a less favourable interest rate environment. Deposits grew by 4.9% 1 compared to the first quarter 2013, driven by good growth in deposits in current and savings accounts. Loans grew by 5.6% 1 due to a strong growth in corporate loans thanks to the strengthening of the business commercial set up. BancWest also continued to develop Private Banking with assets under management totalling 7.6 billion US dollars as at 31 March 2014 (+32% compared to the level as at 31 March 2013). Revenues 3, at 514 million euros, were however down by 4.5% 1 compared to the first quarter 2013 given less capital gains on loan sales and a less favourable interest rate environment. Excluding capital gains from loan sales, revenues were down only by 0.8% 1. Operating expenses 3, at 349 million euros, were up 4.4% 1 compared to the first quarter 2013 due to increased regulatory costs starting in the second half 2013 and the strengthening of the commercial set up (corporates, Private Banking and consumer finance) partially offset by savings generated by streamlining the network (35 branch closures in one year). The cost of risk 3 was still very low this quarter (11 basis points of outstanding customer loans) down 54.8% 1 compared to the first quarter Thus, after allocating one-third of U.S. Private Banking s net income to the Investment Solutions division, BancWest posted 156 million euros in pre-tax income, down 14.6% 1 compared to the first quarter At constant scope and exchange rates 2 With 100% of Turkish Private Banking 3 With 100% of U.S. Private Banking 9
10 Personal Finance Personal Finance s good development of sources of growth was reflected this quarter by the signing of several partnership agreements in the automobile sector (PSA in Turkey, Toyota in Belgium, etc.) and in retail (Metro in Hungary and Techno Market in Bulgaria). Personal Finance also continued its international business development and announced on 10 April 2014 the acquisition in South Africa of RCS 1, a point of sale consumer lender. This good overall drive was illustrated by a 2.9% 2 increase in outstanding loans compared to the first quarter 2013, at 45.3 billion euros. Revenues grew by 1,7% 2 compared to the first quarter 2013, to 921 million euros, thanks to a good drive in Germany, Belgium and Central Europe and the positive impact of partnerships initiated in 2013 in all regions. Revenues were up slightly in France. Thanks to good cost control, benefitting from operating efficiency measures, the growth of operating expenses was limited to 0.5% 2, producing a positive 1.2 point jaws effect. The cost of risk was stable compared to the first quarter 2013, at 244 basis points of outstanding customer loans. Personal Finance s pre-tax income was thus up +4.3% 2 compared to the first quarter 2013, totalling 231 million euros, illustrating the business good profit generating capacity. * * * 1 Subject to regulatory approval 2 At constant scope and exchange rates 10
11 INVESTMENT SOLUTIONS Investment Solutions assets under management 1 remained virtually stable (-0.2%) compared to their level as at 31 March 2013, totalling 874 billion euros as at 31 March They were up 20 billion euros (+2.4%) compared to 31 December 2013 due in particular to a +8.9 billion euro performance effect on the back of the favourable dynamics in equity markets and interest rates, as well as good asset inflows (+8.7 billion euros) with slightly positive net asset flows in Asset Management, in particular in bond funds, strong asset inflows in Wealth Management, in particular in the domestic markets and in Asia and, lastly, good asset inflows in Insurance, especially in Italy, France and Asia. As at 31 March 2014, Investment Solutions assets under management 1 broke down as follows: Asset Management: 376 billion euros; Wealth Management: 295 billion euros; Insurance: 185 billion euros; and Real Estate Services: 18 billion euros. Investment Solutions revenues, which totalled 1,579 million euros, were up 2.7% 2 compared to the first quarter Insurance s revenues were up 2.4% 2 thanks to good growth in France and Italy, and growth in protection insurance internationally. Wealth and Asset Management s revenues were down 1.3% 2 due to Asset Management s lower average outstandings and despite Wealth Management s good growth drive, especially in domestic markets and in Asia. Securities Services revenues were up sharply (+11.8% 2 ) in line with the sharp rise in the number of transactions and the growth in assets under custody. Investment Solutions operating expenses, at 1,075 million euros, were up 2.3% 2 compared to the first quarter 2013, with 1.2% 2 growth in Insurance as a result of the continued growth of the business, 2.2% 2 for Wealth and Asset Management due to the impact of targeted business development investments (Asia, Wealth Management, Asset Management) and 3.3% 2 for Securities Services due to the development of the business. The division s gross operating income, at 504 million euros, was up 3.7% 2 compared to the first quarter After receiving one-third of the net income of Private Banking in the domestic markets, in Turkey and the U.S., pre-tax income rose by 3.0% 2 compared to the first quarter 2013, to 545 million euros, reflecting Investment Solutions good business development. * * * 1 Including assets under advisory on behalf of external clients and distributed assets 2 At constant scope and exchange rates 11
12 CORPORATE AND INVESTMENT BANKING (CIB) CIB s revenues held up well, totalling 2,337 million euros, down 3.7% 1 compared to the first quarter Revenues from Advisory and Capital Markets, at 1,580 million euros, were down 4.9% 1 due to a still lacklustre market environment for Fixed Income and despite strong performance of the Equities and Advisory business. VaR, at a very low level for over two years, decreased again this quarter (33 million euros). Fixed Income s revenues, at 996 million euros, were down 21.7% 1 due to weak activity in the rates and forex businesses and in emerging markets, despite good performance in the credit markets. The business unit won market shares in bond issues where it confirmed its number 1 position for all bonds in euros and became number 7 for all international bonds. Revenues from the Equities and Advisory business unit, at 584 million euros, were up sharply (+49.5% 1 ) compared to the first quarter 2013 with a strong performance in equity derivatives across all segments, especially in Asia and Europe where there was sustained demand for structured products. The M&A business is gradually picking up. The business unit announced this quarter a deal with Royal Bank of Scotland to transfer derivative portfolios. The deal however has no impact on this quarter s revenues. Revenues from Corporate Banking dropped by 1.0% 1 compared to the first quarter 2013, to 757 million euros, due to weak business in the EMEA region 2 owing to the absence of major transactions this quarter and a slowdown in the Energy & Commodities sector virtually offset by strong growth in Asia Pacific and in the Americas, thanks to the initial effects of the business development plans. Outstanding loans, at 107 billion euros, were down slightly 1 compared to the first quarter 2013 with a decline in Europe and growth in Asia. Client deposits, at 73 billion euros, were up sharply (+17%). Fees were up 5.3% compared to the first quarter The business unit confirmed its position as the number 1 bookrunner for syndicated loans in Europe and strengthened its leading position in the region in corporate banking, cash management and trade finance, according to Greenwich Associates latest survey. CIB s operating expenses, at 1,608 million euros, were up by 2.8% 1 compared to the first quarter 2013 due to continued business developments (in particular in Asia, the Americas and Germany) and interim adaptation costs for the period (dual run costs associated with the start up of new back offices and IT systems, implementation of new regulations: 15 million euros this quarter). CIB s cost of risk, at 96 million euros, was up 16 million euros compared to the first quarter For Corporate Banking, it was 47 basis points of outstanding customer loans and included this quarter a 50 million euro portfolio provision due to the exceptional situation in Eastern Europe. CIB s pre-tax income thus totalled 623 million euros, down 20.6% 1 compared to the first quarter * * * 1 At constant scope and exchange rates 2 Europe, Middle East, Africa 12
13 CORPORATE CENTRE The Corporate Centre s revenues were 315 million euros compared to 145 million euros in the first quarter They factor in this quarter in particular, a -64 million euro Own Credit Adjustment (OCA) and own credit risk included in derivatives (DVA) (+149 million euros in the first quarter 2013), the +301 million euro net capital gain on exceptional sales of equity investments, and the impact of surplus deposits placed with Central Banks largely offset this quarter by the proceeds of the equity investment portfolio and the contribution of BNP Paribas Principal Investments. Operating expenses totalled 226 million euros compared to 309 million euros in the first quarter They include in particular 142 million euros in transformation costs associated with the Simple & Efficient programme (155 million euros in the first quarter 2013). The cost of risk was -20 million euros compared to -9 million euros in the same quarter a year earlier. The share of earnings of associates was 14 million euros compared to -77 million euros in the first quarter 2013, in which there was the one-off impact of an impairment charge in the accounts of an associated company. The Corporate Centre s pre-tax income was 81 million euros compared to -239 million euros during the same period a year earlier. * * * LITIGATION RELATED TO US DOLLAR PAYMENTS INVOLVING PARTIES SUBJECT TO U.S. SANCTIONS The discussions that took place during the first quarter of 2014 concerning U.S. dollar payments involving countries subject to U.S. sanctions demonstrate that a high degree of uncertainty exists as to the nature and amount of penalties that the U.S. authorities could impose on the Bank following completion of the ongoing process: there is the possibility that the amount of the fines could be far in excess of the amount of the provision. * * * 13
14 FINANCIAL STRUCTURE The Group s balance sheet is rock-solid. The fully loaded Basel 3 common equity Tier 1 ratio 1 was 10.6% as at 31 March 2014, up 30 basis points compared to what it was as at 31 December 2013 thanks primarily to the quarter s retained earnings (+16 basis points) after the conventional assumption of a dividend pay-out equal to that of 2013, the appreciation of available for sale securities (+7 basis points) and the decline of risk-weighted assets (+7 basis points). It illustrates the Group s very high level of solvency under the new regulations. The Basel 3 fully loaded leverage ratio 1, calculated on total Tier 1 capital 2, stood at 3.7% as at 31 March Lastly, the liquid and asset reserves immediately available totalled 264 billion euros (compared to 247 billion euros as at 31 December 2013), equivalent to over one year of room to manoeuvre in terms of wholesale funding. In order to ensure the comparability with 2014 results, pro-forma 2013 accounts have been prepared considering TEB group under full consolidation for the whole of This document includes these restated 2013 quarterly data. The difference between the use of the full integration method regarding TEB instead of the equity method is disclosed in the quarterly series below. 1 Taking into account all the CRD4 rules with no transitory provisions 2 Including the forthcoming replacement of Tier 1 instruments that have become ineligible with equivalent eligible instruments 14
15 CONSOLIDATED PROFIT AND LOSS ACCOUNT 1Q14 1Q13 1Q14 / 4Q13 1Q14 / m 1Q13 4Q13 Revenues 9,913 9, % 9, % Operating Expenses and Dep. -6,382-6, % -6, % Gross Operating Income 3,531 3, % 2, % Cost of Risk -1, % -1, % Prov ision related to US dollar pay ments inv olv ing parties subject to US sanctions 0 0 n.s n.s. Operating Income 2,447 2, % 791 n.s. Share of Earnings of Associates n.s % Other Non Operating Items n.s % Non Operating Items % -30 n.s. Pre-Tax Income 2,547 2, % 761 n.s. Corporate Income Tax % % Net Income Attributable to Minority Interests % % Net Income Attributable to Equity Holders 1,668 1, % 110 n.s. Cost/Income 64.4% 64.9% -0.5 pt 72.5% -8.1 pt IMPACT ON GROUP 1Q13 RESULTS OF THE USE OF THE FULL INTEGRATION METHOD REGARDING TEB INSTEAD OF THE EQUITY METHOD m 1Q13 restated (*) with TEB consolidated using the equity method Impact of the change from equity method to full integration for TEB 1Q13 restated (*) with TEB fully consolidated Revenues 9, ,972 Operating Expenses and Dep. -6, ,470 Gross Operating Income 3, ,502 Cost of Risk Operating Income 2, ,591 Share of Earnings of Associates Other Non Operating Items Non Operating Items Pre-Tax Income 2, ,645 Corporate Income Tax Net Income Attributable to Minority Interests Net Income Attributable to Equity Holders 1, ,585 (*) Following application of accounting standards IFRS 10, IFRS 11 and IAS 32 revised 15
16 1Q14 RESULTS BY CORE BUSINESSES m Retail Banking Investment Solutions CIB Operating Divisions Other Activities Group Revenues 5,682 1,579 2,337 9, ,913 %Change/1Q13-2.0% +1.3% -5.4% -2.3% n.s. -0.6% %Change/4Q % -3.4% +12.7% +2.4% n.s. +4.7% Operating Expenses and Dep. -3,473-1,075-1,608-6, ,382 %Change/1Q13-1.1% +1.6% +1.1% -0.1% -26.9% -1.4% %Change/4Q13-5.8% -9.0% +3.7% -4.1% -49.3% -7.0% Gross Operating Income 2, , ,531 %Change/1Q13-3.4% +0.8% -17.1% -6.1% n.s. +0.8% %Change/4Q % +11.0% +39.4% +16.4% n.s % Cost of Risk , ,084 %Change/1Q % -14.3% +20.0% +18.0% n.s % %Change/4Q % n.s % +4.2% n.s. +6.7% Prov ision related to US dollar pay ments involving parties subject to US sanctions %Change/1Q13 n.s. n.s. n.s. n.s. n.s. n.s. %Change/4Q13 n.s. n.s. n.s. n.s. n.s. n.s. Operating Income 1, , ,447 %Change/1Q % +1.0% -20.8% -14.0% n.s. -5.6% %Change/4Q % +5.5% +77.8% +22.8% n.s. n.s. Share of Earnings of Associates Other Non Operating Items Pre-Tax Income 1, , ,547 %Change/1Q % +1.5% -23.6% -14.5% n.s. -3.7% %Change/4Q % +11.2% +74.5% +24.9% n.s. n.s. Retail Banking Investment Solutions CIB Operating Divisions Other Activities Group m Revenues 5,682 1,579 2,337 9, ,913 1Q13 5,799 1,558 2,470 9, ,972 4Q13 5,667 1,635 2,074 9, ,469 Operating Expenses and Dep. -3,473-1,075-1,608-6, ,382 1Q13-3,512-1,058-1,591-6, ,470 4Q13-3,686-1,181-1,551-6, ,864 Gross Operating Income 2, , ,531 1Q13 2, , ,502 4Q13 1, , ,605 Cost of Risk , ,084 1Q Q , ,016 Prov ision related to US dollar pay ments involving parties subject to US sanctions Q Q Operating Income 1, , ,447 1Q13 1, , ,591 4Q13 1, ,937-1, Share of Earnings of Associates Q Q Other Non Operating Items Q Q Pre-Tax Income 1, , ,547 1Q13 1, , ,645 4Q13 1, ,974-1, Corporate Income Tax Net Income Attributable to Minority Interests Net Income Attributable to Equity Holders 1, , ,668 16
17 Disclaimer Figures included in this presentation are unaudited. On 14 March 2014, BNP Paribas issued a restatement of its quarterly results for 2013 reflecting, in particular, (i) the adoption of the accounting standards IFRS 10 Consolidated Financial Statements, IFRS 11 Joint Arrangements, which has, in particular, the effect of decreasing the Group s 2013 net income attributable to equity holders by 14m, as well as the amended IAS 28 Investments in Associates and Joint Ventures ; (ii) certain internal transfers of activities and results made as of 1 January 2014, in the context of the medium-term plan, (iii) the application of Basel 3 which modifies the capital allocation by division and business line and (iv) the evolution of allocation practices of the liquidity costs to the operating divisions in order to align them to the Liquidity Coverage Ratio approach. Moreover, in order to ensure the comparability with the future 2014 results, pro-forma 2013 accounts have been prepared considering TEB group under full consolidation for the whole year. In these restated results, data pertaining to 2013 has been represented as though the transactions had occurred on 1st January This presentation is based on the restated 2013 quarterly data. This presentation includes forward-looking statements based on current beliefs and expectations about future events. Forwardlooking statements include financial projections and estimates and their underlying assumptions, statements regarding plans, objectives and expectations with respect to future events, operations, products and services, and statements regarding future performance and synergies. Forward-looking statements are not guarantees of future performance and are subject to inherent risks, uncertainties and assumptions about BNP Paribas and its subsidiaries and investments, developments of BNP Paribas and its subsidiaries, banking industry trends, future capital expenditures and acquisitions, changes in economic conditions globally or in BNP Paribas principal local markets, the competitive market and regulatory factors. Those events are uncertain; their outcome may differ from current expectations which may in turn significantly affect expected results. Actual results may differ materially from those projected or implied in these forward looking statements. Any forward-looking statement contained in this presentation speaks as of the date of this presentation. BNP Paribas undertakes no obligation to publicly revise or update any forward-looking statements in light of new information or future events. The information contained in this presentation as it relates to parties other than BNP Paribas or derived from external sources has not been independently verified and no representation or warranty expressed or implied is made as to, and no reliance should be placed on the fairness, accuracy, completeness or correctness of, the information or opinions contained herein. None of BNP Paribas or its representatives shall have any liability whatsoever in negligence or otherwise for any loss however arising from any use of this presentation or its contents or otherwise arising in connection with this presentation or any other information or material discussed. First quarter 2014 results 2 17
18 1Q14 Key Messages Slight growth in Retail Banking revenues and rise in Investment Solutions CIB revenues held up well, strong performance in Equities and Advisory Good cost control Implementation of business development plan Cost of risk up this quarter A rock-solid balance sheet High solvency Very large liquidity reserve Sustained deposit growth in Retail Banking Revenues of the operating divisions: -0.2%* vs. 1Q13 Operating expenses of the operating divisions: +1.8%* vs. 1Q %* vs. 1Q13 (excl. the exceptional provision for Eastern Europe) Basel 3 CET1 ratio: 10.6%*** 264bn as at %* vs. 1Q13 Solid net income attributable to equity holders at 1.7bn Implementation of the business development plan * At constant scope and exchange rates; ** Net provisions/customer loans; *** As at 31 March 2014, CRD4 (fully loaded) First quarter 2014 results 3 18
19 19
20 20
21 Simple & Efficient Continued the momentum throughout the entire Group 1,268 programmes identified including 2,418 projects of which 94% are already under way Cost savings: 1,011m since the launch of the project 36% of the 2.8bn annual target starting from 2016 Of which 211m recorded in 1Q14 Breakdown of savings by division* Investment Solutions 14% Domestic Markets 49% Transformation costs: 142m in 1Q14 Reminder: 770m target for the year CIB 24% IRB & PF 13% Retail Banking 62% Recurring cost savings in line with the plan * On the basis of 1,011m First quarter 2014 results 9 Variation in the Cost of Risk by Business Unit (1/3) Net provisions/customer loans (in annualised bp) Group Q13 2Q13 3Q13 4Q13 1Q14 Cost of risk 1,084m + 68m vs. 4Q m vs. 1Q13 Rise in the cost of risk this quarter Impact of a 100m portfolio provision (7 bp) this quarter due to the exceptional situation in Eastern Europe Impact of Greek sovereign debt impairment CIB - Corporate Banking * 1Q13 2Q13 3Q13 4Q13 1Q14 Cost of risk: 122m - 49m vs. 4Q m vs. 1Q13 Cost of risk down this quarter Reminder: impact of two specific loans in 4Q13 * Restated First quarter 2014 results 10 21
22 Variation in the Cost of Risk by Business Unit (2/3) Net provisions/customer loans (in annualised bp) FRB Cost of risk: 108m Q13 2Q13 3Q13 4Q13 1Q Q13 2Q13 3Q13 4Q13 1Q m vs. 4Q m vs. 1Q13 Cost of risk still low Impact of one specific loan this quarter BNL bc Cost of risk: 364m + 37m vs. 4Q m vs. 1Q13 Rise in the cost of risk due to a challenging environment BRB Cost of risk: 52m Q13 2Q13 3Q13 4Q13 1Q14 + 4m vs. 4Q m vs. 1Q13 Cost of risk still low Reminder: 1Q13 particularly low First quarter 2014 results 11 Variation in the Cost of Risk by Business Unit (3/3) Net provisions/customer loans (in annualised bp) Europe-Mediterranean Q13 2Q13 3Q13 4Q13 1Q14 BancWest Q13 2Q13 3Q13 4Q13 1Q14 Cost of risk: 105m + 41m vs. 4Q m vs. 1Q13 Impact of a 43m (63 bp) portfolio provision due to the situation in Eastern Europe Cost of risk: 11m - 5m vs. 4Q13-15m vs. 1Q13 Cost of risk still at a very low level this quarter Personal Finance Cost of risk: 277m + 9m vs. 4Q13-6m vs. 1Q13 Stable cost of risk Q13 2Q13 3Q13 4Q13 1Q14 First quarter 2014 results 12 22
23 Financial Structure Fully loaded Basel 3 CET1 ratio*: 10.6% as at (+30 bp vs ) Of which 1Q14 results after the conventional assumption of a dividend pay-out equal to that of 2013 (40.8%): +16 bp Of which available for sale securities appreciation: +7 bp Of which a decrease in risk-weighted assets: +7 bp Basel 3 solvency ratio 10.3% 10.6% Fully loaded Basel 3 leverage ratio* 3.7% calculated on total Tier 1 capital** Immediately available liquidity reserve: 264bn*** ( 247bn as at ) Equivalent to over one year of room to manoeuvre in terms of wholesale funding A rock-solid balance sheet * CRD4; ** Including the forthcoming replacement of Tier 1 instruments that have become ineligible with equivalent eligible instruments; *** Deposits with central banks and unencumbered assets eligible to central banks, after haircuts First quarter 2014 results 13 Group Results Division Results 1Q14 Detailed Results Appendix First quarter 2014 results 14 23
24 Domestic Markets - 1Q14 Business activity Deposits: +5.0% vs. 1Q13, good growth in France, Belgium and at Cortal Consors in Germany Loans: -1.0% vs. 1Q13, weak demand for loans Strong growth of assets under management in Private Banking in France, Italy and Belgium: +8% vs. 1Q13 Revenues*: 3.9bn (+1.7% vs. 1Q13) Good performance of off balance sheet savings, Private Banking and Arval Operating expenses*: - 2.4bn (+0.4% vs. 1Q13) Improvement of the cost/income ratio in France, Italy and Belgium GOI*: 1.5bn (+4.0% vs. 1Q13) Pre-tax income**: 0.9bn (-11.4% vs. 1Q13) Revenue growth Positive jaws effect Deposits +5.0% PI LRB BRB BNL bc FRB bn 1Q13 1Q14 Cost/Income % BRB % FRB % DM Var. in p.p % BNL bc 1Q13 1Q14 * Including 100% of Private Banking, excluding PEL/CEL effects; ** Including 2/3 of Private Banking, excluding PEL/CEL effects First quarter 2014 results 15 French Retail Banking - 1Q14 Business activity Deposits: +5.8% vs. 1Q13, strong growth in current accounts Loans: -1.7% vs. 1Q13, demand for loans still low Growth of factoring and market share gains in cash management Good start-up of the BNP Paribas Entrepreneurs 2016 programme: 9,800 VSEs/SMEs received support for their short-term financing needs this quarter Successful launch of the Life Contingencies insurance contract: 103,000 contracts signed since June 2013 Revenues*: +0.5% vs. 1Q13 Net interest income: +0.5%, effect of the growth in current accounts Fees: +0.6%, good drive in Private Banking and cash management but decline in certain processing fees due to regulatory changes** Operating expenses*: -0.6% vs. 1Q13 Impact of operating efficiency measures Improvement of the cost/income ratio at 63% (-0.7 pt vs. 1Q13) Pre-tax income***: 487m (-3.9% vs. 1Q13) Impact of one specific loan this quarter on the cost of risk Factoring outstandings m GOI* Continued improvement in operating efficiency +2.4% * Including 100% of FPB, excluding PEL/CEL effects; ** Certain processing fees (commissions d intervention) capped starting on 1 st January (Banking Law); *** Including 2/3 of FPB, excluding PEL/CEL effects bn 3.6 1Q13 1Q % 4.0 1Q14 1Q14 First quarter 2014 results 16 24
25 BNL banca commerciale - 1Q14 Business activity Deposits: -2.7% vs. 1Q13, decline on the corporate segment partly offset by a rise in current accounts of individual clients Loans: -3.1% vs. 1Q13, slowdown on the corporate and small business segments Private Banking: continuing rise in assets under management (+20% vs. 1Q13) Revenues*: +0.1% vs. 1Q13 Net interest income: moderate increase, decline in volumes more than offset by a favourable structural effect on deposits Fees: moderate decline, lower fees from loans but good performance of off balance sheet savings Operating expenses*: -1.4% vs. 1Q13 Effect of cost reduction measures (IT, real estate) Improvement of the cost/income ratio: 52.7% (-0.8 pt vs. 1Q13) Pre-tax income**: 16m (-79.7% vs. 1Q13) Increase in the cost of risk due to a challenging environment (+23.0% vs. 1Q13) Still challenging environment Assets under management (Italian Private Banking) bn m GOI* Q Q % Q13 +20% 1Q14 * Including 100% of Italian Private Banking; ** Including 2/3 of Italian Private Banking First quarter 2014 results 17 Belgian Retail Banking - 1Q14 Business activity Deposits: +6.0% vs. 1Q13, good growth in current accounts and savings accounts Loans: +1.5%* vs. 1Q13, growth in loans to individual customers, loans to SMEs held up well Private Banking: growth in assets under management (+6% vs.1q13) Deposits +6.0% Revenues**: +3.1%* vs. 1Q13 Net interest income: up, in particular due to volume growth Fees: growth driven in particular by insurance and credit fees Operating expenses**: +1.7%* vs. 1Q13 Stable excluding an increase in systemic taxes Branch network and workforce adaptation Improvement of the cost/income ratio: 71.6% (-1.0 pt vs. 1Q13) Pre-tax income***: 171m (-9.4%* vs. 1Q13) Reminder: cost of risk particularly low in 1Q13 bn 1Q13 GOI** 222 m 1Q %* 1Q Q14 Maintained a good sales and marketing drive * At constant scope; ** Including 100% of Belgian Private Banking; *** Including 2/3 of Belgian Private Banking First quarter 2014 results 18 25
26 Europe-Mediterranean - 1Q14 Business activity Deposits: +11.8%* vs. 1Q13, up in most countries, strong increase in Turkey Loans: +11.4%* vs. 1Q13, rise in particular in Turkey Good development in cash management and Private Banking (in particular growth in assets under management in Turkey to 3.1bn, or +25%* vs ) Revenues**: -2.2%* vs. 1Q %* vs. 1Q13 excluding the impact of regulatory changes in Algeria and in Turkey since 3Q13*** Decline of revenues in Ukraine due to a challenging environment Operating expenses**: +5.4%* vs. 1Q13 Effects of bolstering the commercial set up in Turkey in 2013 (opened 20 branches vs. 1Q13) Pre-tax income****: 37m (-59.9%* vs. 1Q13) 80m (-12.3%* vs. 1Q13), excluding the impact of a portfolio provision due to the exceptional situation in Eastern Europe ( 43m) Deposits* +11.8% 21.1 bn 1Q13 Loans* +11.4% 23.9 bn 1Q Q Q14 Impact of specific items this quarter * At constant scope and exchange rates; ** Including 100% of Turkish Private Banking; *** New regulations on charging fees for overdrafts in Turkey and foreign exchange fees in Algeria (- 33m impact); **** Including 2/3 of Turkish Private Banking First quarter 2014 results 19 BancWest 1Q14 Good sales and marketing drive Deposits: +4.9%* vs. 1Q13, good growth in current and savings accounts Loans: +5.6%* vs. 1Q13, strong growth in corporate loans thanks to the reinforcing of the commercial set up Continued Private Banking development ($7.6bn of assets under management as at , i.e +32% vs ) Deposits +4.9% Revenues**: -4.5%* vs. 1Q13-0.8%* vs. 1Q13 excluding capital gains on loan sales Less favourable interest rate environment Operating expenses**: +4.4%* vs. 1Q13 Increase in regulatory costs since second half 2013*** Impacts of the strengthening of the commercial setup (corporates, Private Banking and consumer finance) partially offset by savings generated by streamlining the network (35 branches closures in 1 year) Pre-tax income****: 156m (-14.6%* vs. 1Q13) Business development in an adverse interest rate environment * At constant scope and exchange rates; ** Including 100% of Private Banking in the United States; *** Including CCAR; **** Including 2/3 of Private Banking $bn Loans $bn 1Q13 1Q Q % 1Q14 First quarter 2014 results 20 26
27 Personal Finance - 1Q14 Good development of sources of growth Signed several partnership agreements in the automobile sector (PSA in Turkey, Toyota in Belgium ) and in retail (Metro in Hungary and Techno Market in Bulgaria) Acquisition in South Africa of RCS**, a point of sale consumer lender Consolidated outstandings +2.9%* Revenues: +1.7%* vs. 1Q13 Good drive in Germany, Belgium and Central Europe, slight growth in France Positive impact of partnerships initiated in 2013 in all regions Operating expenses: +0.5%* vs. 1Q13 Operating expenses under control thanks to operating efficiency measures Positive 1.2 pt* jaws effect Pre-tax income: +4.3%* vs. 1Q13 bn 1Q13 1Q14 Operating income +4.1%* Rise in income Good development of sources of growth Investment Solutions Asset Flows and Assets under Management m 1Q13 1Q14 * At constant scope and exchange rates; ** Subject to regulatory approval First quarter 2014 results 21 Assets under management*: 874bn as at % vs ; -0.2% vs Performance effect on the back of the favourable dynamics in equity markets and interest rates Slightly positive foreign exchange effect Net asset flows: + 8.7bn in 1Q14 Asset Management: slightly positive asset inflows, in particular in bond funds Wealth Management: strong asset inflows in the domestic markets and in Asia Insurance: significant asset inflows in Italy, France, and Asia (Taiwan) bn Assets under management* Assets under management* at Insurance: 185 Real Estate Services: Foreign exchange effect Performance effect Net asset flows +1.5 Others TOTAL Wealth Management: 295 Asset Management: 376 Good asset inflows this quarter bn * Including assets under advisory on behalf of external clients and distributed assets First quarter 2014 results 22 27
28 Investment Solutions - 1Q14 Revenues: 1,579m (+2.7%* vs. 1Q13) Insurance: +2.4%* vs. 1Q13, good progress in France and Italy, growth in international protection insurance WAM**: -1.3%* vs. 1Q13, lower average outstandings in Asset Management, good growth in Wealth Management in particular in the domestic markets and in Asia Securities Services: +11.8%* vs. 1Q13, sharp rise in the number of transactions and assets under custody Operating expenses: 1,075m (+2.3%* vs. 1Q13) Insurance : +1.2%* vs. 1Q13, in line with the continuing increase in business activity WAM: +2.2%* vs. 1Q13, impact of business development investments (Asia, Wealth Management, Asset Management) Securities Services: +3.3%* vs. 1Q13, due to business growth Pre-tax income: 545m (+3.0%* vs. 1Q13) Good business development Income growth * At constant scope and exchange rates; ** Asset Management, Wealth Management, Real Estate Services m m Revenues by business unit +2.7%* 1,558 1, Q13 Pre-tax income +3.0%* Q13 1Q14 1Q14 Insurance Wealth and Asset Management Securities Services First quarter 2014 results 23 Corporate and Investment Banking - 1Q14 Revenues: 2,337m (-3.7%* vs. 1Q13) Advisory and Capital Markets: -4.9%* vs. 1Q13, strong growth in the Equities and Advisory business, market environment still lacklustre for Fixed Income Corporate Banking: -1.0%* vs. 1Q13, weak business in the EMEA region**, sustained growth in Asia and in the Americas Operating expenses: 1,608m (+2.8%* vs. 1Q13) Continued business developments (Asia, Americas, Germany) interim adaptation costs: 15m this quarter (dual run costs associated with the start up of new back offices and IT systems, implementation of new regulations) Pre-tax income: 623m (-20.6%* vs. 1Q13) m 2, , Q13 2Q13 3Q13 4Q13 1Q14 m Revenues by business unit 2,114 Pre-tax income 815 2, Equities and Advisory Fixed Income Corporate Banking 2, Q13 2Q13 3Q13 4Q13 1Q14 2,337 Revenues held up well * At constant scope and exchange rates; ** Europe, Middle-East & Africa First quarter 2014 results 24 28
29 Corporate and Investment Banking Advisory and Capital Markets - 1Q14 Revenues: 1,580m (-4.9%* vs. 1Q13) VaR down this quarter, still at a very low level ( 33m) Fixed Income: 996m (-21.7%* vs. 1Q13) Low activity in the rates and forex businesses and in emerging markets, good performance in the credit markets Bond issues: ranked #1 for all bonds in euros and #7 for all international bonds with market share gains**, growth in the financial institutions segment and in High Yield Equities and Advisory: 584m (+49.5%* vs. 1Q13) Strong growth across all segments, in particular in Asia and in Europe Sustained demand for structured products Deal with RBS to transfer derivatives portfolios (no impact in 1Q14) Gradual pickup in the M&A business Pre-tax income: 423m (-14.3%* vs. 1Q13) 1Q14 bond issuance rankings** By volume #5 All Corporate bonds #2 High Yield bonds non- USD Advisor to LIXIL for the acquisition, together with Development Bank of Japan, of a 87.5% equity stake in GROHE Group 3bn #1 All Covered bonds #1 All Financial bonds in Euros January 2014 January #1 All Bonds in Euros 5 Advisor to SCHNEIDER ELECTRIC for the acquisition of INVENSYS plc 3.35bn Strong performance in Equities and Advisory Corporate and Investment Banking Corporate Banking - 1Q14 * At constant scope and exchange rates; ** source: Thomson Reuters 1Q14 First quarter 2014 results 25 Business activity Ranked #1 for syndicated financing in Europe* Leading position strengthened in Europe for corporate banking, cash management and trade finance** Growth in client deposits: +17% vs. 1Q13*** Client loans: 107bn (slight decline at constant exchange rates vs. 1Q13***), decline in Europe, growth in Asia Revenues: 757m (-1.0%**** vs. 1Q13) Lower business in the EMEA region this quarter, no major transactions and slowdown in the Energy & Commodities sector Strong growth in Asia Pacific and the Americas Level of fees up compared to 1Q13 (+5.3%) 2014 rankings Greenwich Leaders European Top-Tier Large Corporate Banking: #1 Market penetration / #1 Quality European Top-Tier Large Corporate Cash Management: # 1 Market penetration / #1 Quality European Large Corporate Trade Finance (4Q13): Tier1 total relationship / #1 Overall Quality Client deposits +17% Pre-tax income: 200m (-30.9%**** vs. 1Q13) Impact of a 50m portfolio provision due to the exceptional situation in Eastern Europe 62 Average outstandings bn 1Q13*** 73 1Q14 Initial effects of the business development plans in Asia and the Americas * EMEA, source: Dealogic 1Q14; ** Greenwich Associates; *** Restated; **** At constant scope and exchange rates First quarter 2014 results 26 29
30 Conclusion Solid earnings in a still lacklustre economic environment in Europe Supporting clients across all businesses and regions Implementing the business development plan First quarter 2014 results 27 BNP Paribas Group - 1Q14 1Q14 1Q13 1Q14 / 4Q13 1Q14 / m 1Q13 4Q13 Corporate income tax Revenues 9,913 9, % 9, % Operating Expenses and Dep. -6,382-6, % -6, % Gross Operating Income 3,531 3, % 2, % Cost of Risk -1, % -1, % Prov ision related to US dollar pay ments inv olv ing parties subject to US sanctions 0 0 n.s n.s. Operating Income 2,447 2, % 791 n.s. Share of Earnings of Associates n.s % Other Non Operating Items n.s % Non Operating Items % -30 n.s. Pre-Tax Income 2,547 2, % 761 n.s. Corporate Income Tax % % Net Income Attributable to Minority Interests % % Net Income Attributable to Equity Holders 1,668 1, % 110 n.s. Cost/Income 64.4% 64.9% -0.5 pt 72.5% -8.1 pt With TEB fully consolidated in 1Q13. The difference between results with TEB consolidated using the equity method and results with TEB restated using full consolidation is shown in the next slide. Average tax rate: 32.9% in 1Q14, impact of non-recurring items this quarter First quarter 2014 results 28 30
31 Groupe BNP Paribas - 1Q14 Impact on Group 1Q13 results of the use of the full integration method regarding TEB instead of the equity method m 1Q13 restated (*) with TEB consolidated using the equity method Impact of the change from equity method to full integration for TEB 1Q13 restated (*) with TEB fully consolidated Revenues 9, ,972 Operating Expenses and Dep. -6, ,470 Gross Operating Income 3, ,502 Cost of Risk Operating Income 2, ,591 Share of Earnings of Associates Other Non Operating Items Non Operating Items Pre-Tax Income 2, ,645 Corporate Income Tax Net Income Attributable to Minority Interests Net Income Attributable to Equity Holders 1, ,585 * Following application of accounting standards IFRS 10, IFRS 11 and IAS 32 revised First quarter 2014 results 29 Retail Banking - 1Q14 1Q14 1Q13 1Q14 / 4Q13 1Q14 / m 1Q13 4Q13 Revenues 5,815 5, % 5, % Operating Expenses and Dep. -3,537-3, % -3, % Gross Operating Income 2,278 2, % 2, % Cost of Risk % % Operating Income 1,316 1, % 1, % Associated Companies % % Other Non Operating Items % -11 n.s. Pre-Tax Income 1,367 1, % 1, % Income Attributable to Investment Solutions % % Pre-Tax Income of Retail Banking 1,299 1, % 1, % Cost/Income 60.8% 60.4% +0.4 pt 64.9% -4.1 pt Allocated Equity ( bn) % Including 100% of Private Banking of the domestic markets in France (excluding PEL/CEL effects), Italy, Belgium, Luxembourg, BancWest and TEB for the Revenues to Pre-tax income line items First quarter 2014 results 30 31
32 Domestic Markets - 1Q14 1Q14 1Q13 1Q14 / 4Q13 1Q14 / m 1Q13 4Q13 Revenues 3,929 3, % 3, % Operating Expenses and Dep. -2,425-2, % -2, % Gross Operating Income 1,504 1, % 1, % Cost of Risk % % Operating Income 935 1, % % Associated Companies % -2 n.s. Other Non Operating Items 0 1 n.s. -2 n.s. Pre-Tax Income 942 1, % % Income Attributable to Investment Solutions % % Pre-Tax Income of Domestic Markets % % Cost/Income 61.7% 62.6% -0.9 pt 67.2% -5.5 pt Allocated Equity ( bn) % Including 100% of Private Banking of the domestic markets in France (excluding PEL/CEL effects), Italy, Belgium and Luxembourg for the Revenues to Pre-tax income line items First quarter 2014 results 31 French Retail Banking - 1Q14 Excluding PEL/CEL Effects 1Q14 1Q13 1Q14 / 4Q13 1Q14 / m 1Q13 4Q13 Revenues 1,712 1, % 1, % Incl. Net Interest Income 1,006 1, % 1, % Incl. Commissions % % Operating Expenses and Dep. -1,078-1, % -1, % Gross Operating Income % % Cost of Risk % % Operating Income % % Non Operating Items % 0 n.s. Pre-Tax Income % % Income Attributable to Investment Solutions % % Pre-Tax Income of French Retail Banking % % Cost/Income 63.0% 63.7% -0.7 pt 70.8% -7.8 pt Allocated Equity ( bn) % Including 100% of French Private Banking for the Revenues to Pre-tax income line items Operating expenses vs. 4Q13 Reminder: payment in 4Q13 of 2013 profit-sharing First quarter 2014 results 32 32
33 French Retail Banking Volumes Average outstandings ( bn) LOANS % -0.7% Individual Customers % -0.6% Incl. Mortgages % -0.5% Incl. Consumer Lending % -1.3% Corporates % -0.9% DEPOSITS AND SAVINGS % +1.9% Current Accounts % +1.0% Savings Accounts % +1.7% Market Rate Deposits % +5.9% bn Outstandings %Var/1Q13 1Q %Var/ %Var/4Q13 %Var/ OFF BALANCE SHEET SAVINGS Life Insurance % +1.5% Mutual Funds (1) % -4.8% (1) FRB network customers, excluding life insurance. Loans: -1.7% vs. 1Q13, demand for loans still low Deposits: +5.8% vs. 1Q13, strong growth in current accounts Off balance sheet savings: Decline in money market funds First quarter 2014 results 33 BNL banca commerciale - 1Q14 1Q14 1Q13 1Q14 / 4Q13 1Q14 / m 1Q13 4Q13 Revenues % % Operating Expenses and Dep % % Gross Operating Income % % Cost of Risk % % Operating Income % % Non Operating Items 0 0 n.s. 0 n.s. Pre-Tax Income % % Income Attributable to Investment Solutions % % Pre-Tax Income of BNL bc % % Cost/Income 52.7% 53.5% -0.8 pt 57.2% -4.5 pt Allocated Equity ( bn) % Including 100% of Italian Private Banking for the Revenues to Pre-tax income line items Revenues: +0.1% vs. 1Q13 Net interest income: +1.4% vs. 1Q13, decline in volumes more than offset by a favourable structural effect on deposits Fees: -2.3% vs. 1Q13, lower fees from loans but good performance of off balance sheet savings Operating expenses: -1.4% vs. 1Q13 Effect of the operating efficiency measures Positive 1.5 pt jaws effect First quarter 2014 results 34 33
34 BNL banca commerciale Volumes Average outstandings ( bn) LOANS % -0.2% Individual Customers % +0.5% Incl. Mortgages % +0.3% Incl. Consumer Lending % +2.2% Corporates % -0.9% DEPOSITS AND SAVINGS % -2.7% Individual Deposits % +1.1% Incl. Current Accounts % +1.3% Corporate Deposits % -8.6% bn Outstandings 1Q14 %Var/1Q13 %Var/4Q %Var/ %Var/ OFF BALANCE SHEET SAVINGS Life Insurance % +8.6% Mutual Funds % +3.5% Loans: -3.1% vs. 1Q13 Individuals: +0.9% vs. 1Q13, rise in mortgage loans but decline on the small business segment Corporates: -6.5% vs. 1Q13, slowdown in a still challenging environment Deposits: -2.7% vs. 1Q13 Individuals: rise in current accounts Corporates: decline in certain deposits with a favourable structural effect Life insurance: strong asset inflows this quarter First quarter 2014 results 35 Belgian Retail Banking - 1Q14 1Q14 1Q13 1Q14 / 4Q13 1Q14 / m 1Q13 4Q13 Revenues % % Operating Expenses and Dep % % Gross Operating Income % % Cost of Risk n.s % Operating Income % % Non Operating Items % -1 n.s. Pre-Tax Income % % Income Attributable to Investment Solutions % % Pre-Tax Income of Belgian Retail Banking % % Cost/Income 71.6% 72.6% -1.0 pt 75.0% -3.4 pt Allocated Equity ( bn) % Including 100% of Belgian Private Banking for the Revenues to Pre-tax income line items Revenues: +3.1%* vs. 1Q13 Net interest income: +2.8%* vs. 1Q13, in particular due to volume growth Fees: +3.9%* vs. 1Q13, good performance of insurance and credit fees Operating expenses: +1.7%* vs. 1Q13 Stable, excluding an increase in systemic taxes Positive 1.4 pt jaws effect * At constant scope (inclusion of FCF Germany and FCF UK in 2Q13) First quarter 2014 results 36 34
35 Belgian Retail Banking Volumes Average outstandings ( bn) Loans: +2.5% vs. 1Q13 (+1.5% at constant scope) Individuals: +2.2% vs. 1Q13, growth in mortgages Corporates: +3.1% vs. 1Q13 (+0.3% at constant scope), loans to SMEs held up well Deposits: +6.0% vs. 1Q13 LOANS % +1.6% Individual Customers % +0.0% Incl. Mortgages % +0.5% Incl. Consumer Lending % -24.8% Incl. Small Businesses % -0.9% Corporates and Local Governments* % +4.9% DEPOSITS AND SAVINGS % +2.1% Current Accounts % +3.7% Savings Accounts % +1.2% Term Deposits % +3.9% * Including 0.8bn in 1Q14 due to the integration of FCF Germany and United Kingdom (factoring). bn Individuals: good growth in current accounts and savings accounts Corporates: rise in current accounts Outstandings %Var/1Q13 1Q %Var/ %Var/4Q13 %Var/ OFF BALANCE SHEET SAVINGS Life Insurance % +0.3% Mutual Funds % +1.8% First quarter 2014 results 37 Luxembourg Retail Banking - 1Q14 Personal Investors - 1Q14 Luxembourg Retail Banking Average outstandings ( bn) Personal Investors Outstandings 1Q14 LOANS % +0.7% Individual Customers % +0.6% Corporates and Local Governments % +1.0% DEPOSITS AND SAVINGS % -0.7% Current Accounts % -0.4% Savings Accounts % +0.6% Term Deposits % -4.7% %Var/ %Var/ bn OFF BALANCE SHEET SAVINGS Life Insurance % -3.6% Mutual Funds % -9.2% Average outstandings ( bn) Outstandings 1Q14 %Var/1Q13 %Var/1Q13 %Var/4Q13 %Var/4Q13 LOANS % -3.6% DEPOSITS % +7.1% %Var/ %Var/ bn ASSETS UNDER MANAGEMENT % +3.5% European Customer Orders (millions) % +17.6% Loans vs. 1Q13: growth in mortgages partly offset by a decline in the corporate client segment Deposits vs. 1Q13: decline in term deposits but good asset inflow in the corporate client segment, in line with the development of cash management Deposits vs. 1Q13: strong increase thanks again to a good level of new customers and the development of Hello bank! in Germany Brokerage business up sharply Cortal Consors voted Best Online-Broker 2014 in Germany for the third consecutive year by the readers of Börse am Sonntag First quarter 2014 results 38 35
36 Arval - 1Q14 Leasing Solutions - 1Q14 Arval Average outstandings ( bn) Good business drive: increase in the financed fleet and orders placed Strong revenue growth, still driven by a rise in used vehicle prices Improvement of the cost/income ratio Outstandings 1Q14 %Var*/1Q13 %Var*/4Q13 Consolidated Outstandings % +1.0% Financed vehicles ('000 of vehicles) % +0.0% Leasing Solutions Outstandings %Var*/1Q13 %Var*/4Q13 Average outstandings ( bn) 1Q14 Consolidated Outstandings % +1.6% Rise in outstandings despite the continued reduction of the non-core portfolio Revenue growth in line with the rise in volumes Good cost control Higher cost of risk of the non-core portfolio in Italy * At constant scope and exchange rates First quarter 2014 results 39 Europe-Mediterranean - 1Q14 Significant foreign exchange effect due in particular to the depreciation of the Turkish lira TRY vs. EUR*: -22.3% vs. 1Q13, - 9.1% vs. 4Q13 At constant scope and exchange rates vs. 1Q13 Revenues: -2.2% 1Q14 1Q13 1Q14 / 4Q13 1Q14 / m 1Q13 4Q13 Revenues % % Operating Expenses and Dep % % Gross Operating Income % % Cost of Risk % % Operating Income % % Non Operating Items % % Pre-Tax Income % % Income Attributable to Investment Solutions 0-2 n.s. 1 n.s. Pre-Tax Income of EUROPE-MEDITERRANEAN % % Cost/Income 74.3% 66.7% +7.6 pt 76.5% -2.2 pt Allocated Equity ( bn) % Including 100% of Turkish Private Banking for the Revenue to Pre-tax income line items Operating expenses: +5.4% Non operating items (associated companies): strong contribution from Asia * Average rates First quarter 2014 results 40 36
37 Europe-Mediterranean Volumes and Risks Average outstandings ( bn) Outstandings 1Q14 %Var/1Q13 at constant scope and historical exchange rates %Var/4Q13 at constant scope and historical exchange rates LOANS % +11.4% -2.1% +3.2% DEPOSITS % +11.8% -1.4% +4.0% Geographic distribution of 1Q14 outstanding loans Cost of risk/outstandings Poland 14% Ukraine 6% Turkey 51% Annualised cost of risk/outstandings as at beginning of period 1Q13 2Q13 3Q13 4Q13 1Q14 Africa 4% Turkey 1.68% 0.77% 0.96% 1.07% 0.69% UkrSibbank 0.82% 0.62% 1.12% 0.26% 11.90% Poland 0.83% 0.47% 0.30% 0.22% 0.34% Others 0.87% 1.20% 0.78% 1.10% 1.52% Mediterranean 25% Europe-Mediterranean 1.24% 0.85% 0.83% 0.92% 1.54% First quarter 2014 results 41 BancWest 1Q14 1Q14 1Q13 1Q14 / 4Q13 1Q14 / m 1Q13 4Q13 Revenues % % Operating Expenses and Dep % % Gross Operating Income % % Cost of Risk % % Operating Income % % Non Operating Items % 1 n.s. Pre-Tax Income % % Income Attributable to Investment Solutions -1 0 n.s % Pre-Tax Income of BANCWEST % % Cost/Income 67.9% 61.9% +6.0 pt 64.8% +3.1 pt Allocated Equity ( bn) % Including 100% of U.S Private Banking for the Revenues to Pre-tax income line items Foreign exchange effect: US dollar depreciation USD vs. EUR*: -3.7% vs. 1Q13, -0.6% vs. 4Q13 At constant exchange rates vs. 1Q13 Revenues: -4.5% Operating expenses: +4.4% * Average rates First quarter 2014 results 42 37
38 BancWest Volumes Average outstandings ( bn) Outstandings 1Q14 %Var/1Q13 at constant scope and historical exchange rates %Var/4Q13 at constant scope and historical exchange rates LOANS % +5.6% +1.5% +2.2% Individual Customers % +2.4% +1.0% +1.6% Incl. Mortgages % -2.8% +0.6% +1.2% Incl. Consumer Lending % +7.4% +1.3% +2.0% Commercial Real Estate % +6.0% +0.9% +1.5% Corporate Loans % +10.8% +2.9% +3.6% DEPOSITS AND SAVINGS % +4.9% +1.2% +1.9% Deposits Excl. Jumbo CDs % +7.4% +1.8% +2.4% Loans: +5.6%* vs. 1Q13 Strong increase in corporate loans Continued contraction in mortgages due to the sale of conforming loans to Fannie Mae Deposits: +4.9%* vs. 1Q13, good growth in current and savings accounts * At constant scope and exchange rates First quarter 2014 results 43 Personal Finance - 1Q14 1Q14 1Q13 1Q14 / 4Q13 1Q14 / m 1Q13 4Q13 Revenues % % Operating Expenses and Dep % % Gross Operating Income % % Cost of Risk % % Operating Income % % Associated Companies % % Other Non Operating Items 0 1 n.s. -11 n.s. Pre-Tax Income % % Cost/Income 46.5% 46.9% -0.4 pt 49.0% -2.5 pt Allocated Equity ( bn) % Foreign exchange effect due to the Brazilian real depreciation BRL vs. EUR*: -18.6% vs. 1Q13, -4.2% vs. 4Q13 At constant scope and exchange rates vs. 1Q13 Revenues: +1.7% Operating expenses: +0.5% * Average rates First quarter 2014 results 44 38
39 Personal Finance Volumes and Risks Average outstandings ( bn) Outstandings 1Q14 %Var/1Q13 at constant scope and historical exchange rates %Var/4Q13 at constant scope and historical exchange rates TOTAL CONSOLIDATED OUTSTANDINGS % +2.9% +0.2% +0.6% TOTAL OUTSTANDINGS UNDER MANAGEMENT (1) % +1.2% -1.5% -1.0% (1) Including 100% of outstandings of subsidiaries not fully owned as well as of all partnerships Cost of risk/outstandings Annualised cost of risk/outstandings as at beginning of period 1Q13 2Q13 3Q13 4Q13 1Q14 France 2.28% 3.06% 2.14% 1.54% 2.44% Italy 3.50% 2.91% 2.45% 4.49% 2.89% Spain 3.15% 2.04% 2.76% 1.23% 1.77% Other Western Europe 1.61% 1.62% 1.63% 1.47% 1.62% Eastern Europe 1.04% 3.03% 2.87% 2.09% 3.83% Brazil 5.16% 4.69% 4.91% 5.25% 5.54% Others 0.69% 1.58% 1.58% 1.52% 1.20% Personal Finance 2.48% 2.59% 2.27% 2.39% 2.44% First quarter 2014 results 45 Investment Solutions - 1Q14 1Q14 1Q13 1Q14 / 4Q13 1Q14 / m 1Q13 4Q13 Revenues 1,579 1, % 1, % Operating Expenses and Dep. -1,075-1, % -1, % Gross Operating Income % % Cost of Risk % 18 n.s. Operating Income % % Associated Companies % % Other Non Operating Items -2 4 n.s % Pre-Tax Income % % Cost/Income 68.1% 67.9% +0.2 pt 72.2% -4.1 pt Allocated Equity ( bn) % First quarter 2014 results 46 39
* 8.7 1.7 n.s. -0.")
40 Investment Solutions Business %Var/ %Var/ Assets under management ( bn)* % % Asset Management % % Wealth Management % % Real Estate Services % % Insurance % % 1Q14 1Q13 %Var/ 1Q13 4Q13 %Var/ 4Q13 Net asset flows ( bn)* n.s n.s. Asset Management n.s. 0.2 n.s. Wealth Management % -1.2 n.s. Real Estate Services % % Insurance % 0.1 n.s %Var/ %Var/ Securities Services Assets under custody ( bn) 6,559 5, % 6, % Assets under administration ( bn) 1,111 1, % 1, % 1Q14 1Q13 1Q14/1Q13 4Q13 1Q14/4Q13 Number of transactions (in millions) % % * Including assets under advisory on behalf of external clients and distributed assets Investment Solutions Breakdown of Assets by Customer Segment First quarter 2014 results 47 Breakdown of assets by customer segment 876bn Corporates & Institutions 874bn Individuals External distribution First quarter 2014 results 48 40

41 Asset Management Breakdown of Managed Assets Bonds 33% Alternative, structured and index-based 9% Diversified 18% Money Market 19% Equities 21% 48% 376bn First quarter 2014 results 49 Investment Solutions Wealth and Asset Management - 1Q14 1Q14 1Q13 1Q14 / 4Q13 1Q14 / m 1Q13 4Q13 Revenues % % Operating Expenses and Dep % % Gross Operating Income % % Cost of Risk % 3 n.s. Operating Income % % Associated Companies % % Other Non Operating Items 0 0 n.s. -5 n.s. Pre-Tax Income % % Cost/Income 76.3% 73.7% +2.6 pt 77.9% -1.6 pt Allocated Equity ( bn) % At constant scope and exchange rates Revenues: -1.3% vs. 1Q13 Operating expenses: +2.2% vs. 1Q13 First quarter 2014 results 50 41
42 Investment Solutions Insurance - 1Q14 1Q14 1Q13 1Q14 / 4Q13 1Q14 / m 1Q13 4Q13 Revenues % % Operating Expenses and Dep % % Gross Operating Income % % Cost of Risk % 5 n.s. Operating Income % % Associated Companies % 11 n.s. Other Non Operating Items -2 4 n.s % Pre-Tax Income % % Cost/Income 47.5% 47.8% -0.3 pt 53.8% -6.3 pt Allocated Equity ( bn) % Gross written premiums: 7.4bn (-0.4% vs. 1Q13) France: high comparison base in 1Q13 International: good growth in savings and protection insurance Technical reserves: +3.8% vs. 1Q13 At constant scope and exchange rates Revenues: +2.4% vs. 1Q13 Operating expenses: +1.2% vs. 1Q13 First quarter 2014 results 51 Investment Solutions Securities Services - 1Q14 1Q14 1Q13 1Q14 / 4Q13 1Q14 / m 1Q13 4Q13 Revenues % % Operating Expenses and Dep % % Gross Operating Income % 30 n.s. Cost of Risk 0 0 n.s. 10 n.s. Operating Income % % Non Operating Items 0-1 n.s. 0 n.s. Pre-Tax Income % % Cost/Income 82.8% 88.9% -6.1 pt 91.2% -8.4 pt Allocated Equity ( bn) % Assets under custody: +8.2% vs ; +18.5% vs Number of transactions: +30.2% vs. 1Q13 At constant scope and exchange rates Revenues: +11.8% vs. 1Q13 Operating expenses: +3.3% vs. 1Q13 First quarter 2014 results 52 42
43 Corporate and Investment Banking - 1Q14 1Q14 1Q13 1Q14 / 4Q13 1Q14 / m 1Q13 4Q13 Revenues 2,337 2, % 2, % Operating Expenses and Dep. -1,608-1, % -1, % Gross Operating Income % % Cost of Risk % % Operating Income % % Associated Companies n.s % Other Non Operating Items -6 0 n.s. 4 n.s. Pre-Tax Income % % Cost/Income 68.8% 64.4% +4.4 pt 74.8% -6.0 pt Allocated Equity ( bn) % At constant scope and exchange rates: Revenues: -3.7% vs. 1Q13 Operating expenses: +2.8% vs. 1Q13 Pre-tax income: -20.6% vs. 1Q13 First quarter 2014 results 53 Corporate and Investment Banking Advisory and Capital Markets - 1Q14 1Q14 1Q13 1Q14 / 4Q13 1Q14 / m 1Q13 4Q13 Revenues 1,580 1, % 1, % Incl. Equity and Advisory % % Incl. Fixed Income 996 1, % % Operating Expenses and Dep. -1,185-1, % -1, % Gross Operating Income % 118 n.s. Cost of Risk n.s. 4 n.s. Operating Income % 122 n.s. Associated Companies % -5 n.s. Other Non Operating Items -6 0 n.s. 4 n.s. Pre-Tax Income % 121 n.s. Cost/Income 75.0% 69.8% +5.2 pt 90.1% pt Allocated Equity ( bn) % At constant scope and exchange rates: Revenues: -4.9% vs. 1Q13, of which Equities and Advisory (+49.5%) and Fixed Income (-21.7%) Operating expenses: +2.0% vs. 1Q13, impact of business development plans and interim adaptation costs Pre-tax income: -14.3% vs. 1Q13 First quarter 2014 results 54 43

44 Corporate and Investment Banking Market Risks - 1Q14 m Average 99% 1-day interval VaR Q12 2Q12 3Q12 4Q12 1Q13 2Q13 3Q13 1Q14 Group s VaR still at a very low level Down in 1Q14 No losses greater than VaR this quarter First quarter 2014 results 55 Corporate and Investment Banking Advisory and Capital Markets - 1Q14 South Africa: Steinhoff Convertible Bond EUR465m Joint Bookrunner January 2014 France: Orange EUR2.8bn - equivalent Inaugural Hybrid Issue 3 tranches: EUR1bn Non Call 6 / EUR1bn Non Call 10 / GBP650m Non Call 8 Global Coordinator and Stucture Advisor January 2014 Costa Rica: Reventazón Finance Tr. Hydropower project: first Inter-American Development Bank B-bond in over 10 years USD135m senior secured due Nov 2033 Sole Placement Agent January 2014 Malaysia: Export-Import Bank of Malaysia Berhad USD300m 2.874% Sukuk due Feb 2019 Joint Bookrunner February 2014 United Kingdom: BP Capital Markets CNH1bn 5-yr / CHF500m dual-tranche (6.5yr/10yr) / USD2.5bn three-tranche (5.25yr/5.25yr FRN/10y) Senior Unsecured Bonds Joint Bookrunner on all three transactions February 2014 Supranational: Asian Development Bank Inaugural EUR issue EUR1.5bn 0.375% due Apr 2017 Joint Bookrunner March 2014 Canada: National Bank of Canada EUR1bn 1.5% Canadian Covered Bond due March 2021 March 2014 USA: Hewlett-Packard USD2bn 5-year FXD and 5-year FRN Offering due January 2019 Active Bookrunner January 2014 Supranational: European Investment Bank EIB s largest ever 7-year USD issue USD3bn 2.5% due Apr 2021 Joint Bookrunner March 2014 France: Labeyrie Fine Foods Inaugural issue EUR275m 5.625% senior secured notes due 2021 Left-Lead Bookrunner March 2014 First quarter 2014 results 56 44
45 Corporate and Investment Banking Corporate Banking - 1Q14 1Q14 1Q13 1Q14 / 4Q13 1Q14 / m 1Q13 4Q13 Revenues % % Operating Expenses and Dep % % Gross Operating Income % % Cost of Risk % % Operating Income % % Non Operating Items n.s. 2 n.s. Pre-Tax Income % % Cost/Income 55.9% 52.8% +3.1 pt 53.9% +2.0 pt Allocated Equity ( bn) % At constant scope and exchange rates: Revenues: -1.0% vs. 1Q13, weak business in Europe, sustained growth in Asia and in the Americas Operating expenses: +5.3% vs. 1Q13, growth in Asia as well as in the Americas and stability in Europe; impact of business development plans and interim adaptation costs Pre-tax income: -30.9% vs. 1Q13 First quarter 2014 results 57 Corporate and Investment Banking Corporate Banking - 1Q14 Japan/Europe: Unicarriers Pan European Cash Management mandate: Payments/Collections, E-banking, Cash Pooling 1 st Quarter 2014 Denmark/Europe: Danfoss Power Solution Pan European Cash Mgt Mandate in 6 countries Payments & Collections, E-banking, Cash Pool 1st Quarter 2014 Australia: Roy Hill Iron & Ore Project USD7.76bn debt financing package for construction of the integrated Roy Hill Iron ore mine, rail and port operation in Western Australia. Mandated Lead Arranger for Uncovered, Japanese and Korean ECA facilities Joint Financial Advisor to Roy Hill Holdings US EXIM Facility Agent March 2014 China/Sweden: Volvo Cars (Geely Group) Global Foreign Currency Bank zero balance cash pooling in 14 currencies February 2014 Canada: BOMBARDIER USD1.35bn Revolving Credit Facility Joint Bookrunner March 2014 Brazil: InterCement USD900m Senior Unsecured Term Loans Facility Joint Lead Arranger and Joint Bookrunner February 2014 USA: UPS USD 2.5bn Revolving Credit Facility Joint Lead Arranger and Joint Bookrunner March 2014 Brazil: BRF 1-year Export Receivables Purchase Facility Structuring Bank March 2014 France: Korian Medica EUR1.1bn facility to support Korian and Medica s merger Joint MLA and Bookrunner March 2014 USA: The Walt Disney Company USD3.75bn Revolving Credit Facility Joint Lead Arranger and Joint Bookrunner March 2014 First quarter 2014 results 58 45
46 Corporate and Investment Banking Rankings and Awards - 1Q14 Advisory and Capital Markets: recognised global franchises #1 All bonds in EUR, #7 All International Bonds All Currencies (IFR Thomson Reuters 1Q14) #1 All FIG bonds in EUR and #1 Covered bonds All Currencies (IFR Thomson Reuters 1Q14) #5 Corporate bonds All Currencies and #2 High Yield Bonds non-usd (IFR Thomson Reuters 1Q14) Best European Prime Broker (HedgeweekAwards 2014) Best Asia Pacific ETF Market maker (ETF Express Global Awards 2014) #8 M&A in Europe (announced deals, Thomson Reuters 1Q14) #3 Bookrunner EMEA Equity-Linked (Thomson Reuters 1Q14) Corporate Banking: confirmed leadership in all the business units #1 Bookrunner in EMEA Syndicated Loans by volume and number of deals (Dealogic 1Q14) #1 Bookrunner in Oil & Gas, #2 Media & Telecom, #2 Metal & Mining in EMEA Syndicated Loans by volume (Dealogic 1Q14) #1 Mandated Lead Arranger of European Project Finance & #2 Financial Advisor of APAC Project Finance (Dealogic 1Q14) #1 European Top-Tier Large Corporate Banking Market Penetration and Quality, #1 European Top-Tier Large Corporate Cash Management Market Penetration and Quality (Greenwich Associates 2014) #1 European Large Corporate Trade Finance overall Quality (Greenwich Associates 4Q13) First quarter 2014 results 59 Corporate Centre - 1Q14 m 1Q14 1Q13 4Q13 Revenues Operating Expenses and Dep incl. transformation costs Gross Operating income Cost of Risk Provision related to US dollar payments involving parties subject to US sanctions Operating Income ,146 Share of earnings of associates Other non operating items Pre-Tax Income ,213 Revenues Own Credit Adjustment (OCA)* and own credit risk included in derivatives (DVA)*: - 64m (+ 149m in 1Q13) Net capital gains from the exceptional sales of equity investments: + 301m Impact of the surplus deposits placed with Central Banks largely offset this quarter by the proceeds of the equity investment portfolio and the contribution of BNP Paribas Principal Investments Operating expenses Simple & Efficient transformation costs: - 142m (- 155m in1q13) Associated companies 1Q13 reminder: one-off impact of an impairment charge in the accounts of an associated company * Fair value takes into account any change in value attributable to issuer risk relating to the BNP Paribas Group. It is the replacement value of instruments, calculated by discounting the expected liabilities profile, stemming from derivatives or securities issued by the Bank, using a discount rate corresponding to that of a similar instrument that could be issued by the BNP Paribas Group at the closing date. First quarter 2014 results 60 46
47 Group Results Division Results 1Q14 Detailed Results Appendix First quarter 2014 results 61 Number of Shares, Earnings and Book Value per Share Number of Shares and Book Value per Share in millions 31-Mar Dec-13* Number of Shares (end of period) 1,246 1,245 Number of Shares excluding Treasury Shares (end of period) 1,244 1,242 Average number of Shares outstanding excluding Treasury Shares 1,243 1,241 Book value per share (a) of which net assets non revaluated per share (a) (a) Excluding undated super subordinated notes Earnings per Share in euros 1Q14 1Q13* Net Earnings Per Share (EPS) Equity bn 31-Mar Dec-13* Shareholders' equity Group share, not revaluated (a) Valuation Reserve Return on Equity 7.2% (b) 6.1% Total Capital Ratio 13.0% (c) 14.3% (d) Common equity Tier 1 ratio 11.0% (c) 11.7% (d) (a) Excluding undated super subordinated notes and after estimated distribution (b) Annualised ROE, where the exceptional result from the sales of securities and the OCA/DVA is not annualised (c) On Basel 3 (CRD4) risk-w eighted assets of 617bn, taking into consideration CRR transitory prov isions (w ith full deduction of goodwill) (d) On Basel 2.5 (CRD3) risk-weighted assets of 560bn * Pro forma figures restated following application of IFRS 10 and 11 First quarter 2014 results 62 47
 Doubtful loans to customers and credit institutions excluding repos, netted of guarantees (b) Gross outstanding loans to customers and credit institutions excluding repos Coverage ratio bn")
48 A Solid Financial Structure Doubtful loans/gross outstandings 31-Mar Dec-13* Doubtful loans (a) / Loans (b) 4.3% 4.5% (a) Doubtful loans to customers and credit institutions excluding repos, netted of guarantees (b) Gross outstanding loans to customers and credit institutions excluding repos Coverage ratio bn 31-Mar Dec-13* Doubtful loans (a) Allowance for loan losses (b) Coverage ratio 81% 81% (a) Gross doubtful loans, balance sheet and off-balance sheet, netted of guarantees and collaterals (b) Specific and on a portfolio basis * Pro forma figures restated following application of IFRS 10 and 11 First quarter 2014 results 63 Medium/Long-Term Funding 2014 MLT wholesale funding programme: 23bn Wholesale MLT funding structure breakdown as at : 147bn Senior debt: 16.9bn realised** at mid-april 2014 Maturity: 4.4 years on average Mid-swap +44 bp on average Primarily senior unsecured Of which 63% public issues and 37% private placements Tier 2 issuance of 1.5bn with a 12 year maturity, with a repayment option after 7 years (12NC7), realised on 20 February 2014 (mid-swap +165bp) bn Tier One*: 8 Other subordinated debt: 12 Senior secured: 40 Senior unsecured: MLT funding programme placed in the networks: 7bn 6.1bn realised** at mid-april /5 of 2014 MLT funding programme already completed * Debt qualified prudentially as Tier 1 recorded as subordinated debt or as equity; ** Including issues at the end of 2013 ( 8.3bn) in addition to the 37bn issued under the 2013 programme First quarter 2014 results 64 48
FOURTH UPDATE TO THE 2013 REGISTRATION DOCUMENT
 FOURTH UPDATE TO THE 2013 REGISTRATION DOCUMENT FILED WITH THE AMF ON NOVEMBER 4, 2014 Registration document and annual financial report filed with the AMF (Autorité des Marchés Financiers) on March 7,
Registration document and annual financial report filed with the AMF (Autorité des Marchés Financiers) on March 6, 2015 under No. D
 on March 6, 2015 under No. D") FIRST UPDATE TO THE 2014 REGISTRATION DOCUMENT FILED WITH THE AMF ON APRIL 30, 2015 Registration document and annual financial report filed with the AMF (Autorité des Marchés Financiers) on March 6, 2015
FIRST UPDATE TO THE 2014 REGISTRATION DOCUMENT FILED WITH THE AMF ON APRIL 30, 2015 Registration document and annual financial report filed with the AMF (Autorité des Marchés Financiers) on March 6, 2015
SECOND QUARTER 2014 RESULTS
 SECOND QUARTER 2014 RESULTS PRESS RELEASE Paris, 31 July 2014 ONE-OFF COSTS RELATED TO THE COMPREHENSIVE SETTLEMENT WITH U.S. AUTHORITIES 5,950M IN 2Q14 OF WHICH: - PENALTIES*: 5,750M - REMEDIATION PLAN:
SECOND UPDATE TO THE 2014 REGISTRATION DOCUMENT AND HALF YEAR FINANCIAL REPORT FILED WITH THE AMF ON AUGUST 3, 2015
 SECOND UPDATE TO THE 2014 REGISTRATION DOCUMENT AND HALF YEAR FINANCIAL REPORT FILED WITH THE AMF ON AUGUST 3, 2015 Registration document and annual financial report filed with the AMF (Autorité des Marchés
THIRD UPDATE TO THE 2014 REGISTRATION DOCUMENT FILED WITH THE AMF ON OCTOBER 30, 2015
 THIRD UPDATE TO THE 2014 REGISTRATION DOCUMENT FILED WITH THE AMF ON OCTOBER 30, 2015 Registration document and annual financial report filed with the AMF (Autorité des Marchés Financiers) on March 6,
SECOND QUARTER 2015 RESULTS
 SECOND QUARTER 2015 RESULTS PRESS RELEASE Paris, 31 July 2015 STRONG INCOME GROWTH SOLID ORGANIC CAPITAL GENERATION RISE IN REVENUES IN ALL THE OPERATING DIVISIONS - SIGNIFICANT GROWTH AT INTERNATIONAL
FIRST QUARTER 2012 RESULTS
 FIRST QUARTER 2012 RESULTS PRESS RELEASE Paris, 4 May 2012 DOMESTIC MARKETS: GROWING BUSINESS ACTIVITY DEPOSITS: +3.6% VS. 1Q11; LOANS: +2.9% VS. 1Q11 GOOD RESILIENCE OF CAPITAL MARKETS REVENUES: -4.0%
THIRD UPDATE OF THE 2016 REGISTRATION DOCUMENT
 THIRD UPDATE OF THE 2016 REGISTRATION DOCUMENT FILED WITH THE AMF ON OCTOBER, 31 ST 2017 Registration document and annual financial report filed with the AMF (Autorité des Marchés Financiers) on March
SUPPLEMENT. dated. 14 November to the BASE PROSPECTUS. dated 21 August 2013 and related to the HUF 75,000,000,000 Note Programme of
 SUPPLEMENT dated 14 November 2013 to the BASE PROSPECTUS dated 21 August 2013 and related to the HUF 75,000,000,000 Note Programme of BNP PARIBAS S.A., ACTING THROUGH ITS HUNGARIAN BRANCH This Supplement
SECOND UPDATE TO THE 2015 REGISTRATION DOCUMENT AND HALF YEAR FINANCIAL REPORT FILED WITH THE AMF ON AUGUST, 1 ST 2016
 SECOND UPDATE TO THE 2015 REGISTRATION DOCUMENT AND HALF YEAR FINANCIAL REPORT FILED WITH THE AMF ON AUGUST, 1 ST 2016 Registration document and annual financial report filed with the AMF (Autorité des
Third Quarter 2015 Results
 Third Quarter 2015 Results 30 October 2015 Disclaimer Figures included in this presentation are unaudited. On 24 March 2015, BNP Paribas issued a restatement of its quarterly results for 2014 reflecting,
RESULTS AS AT 31 MARCH 2010
 RESULTS AS AT 31 MARCH 2010 Paris, 6 May 2010 NET EARNINGS GROUP SHARE: 2.3 BILLION EUROS GREATER PROFIT GENERATING CAPACITY THANKS TO THE GROUP S NEW DIMENSION 1Q10 1Q10 / 1Q09 1Q10 / 1Q09 At constant
FIRST UPDATE TO THE 2017 REGISTRATION DOCUMENT FILED WITH THE AMF ON MAY 4, 2018
 FIRST UPDATE TO THE 2017 REGISTRATION DOCUMENT FILED WITH THE AMF ON MAY 4, 2018 Registration document and annual financial report filed with the AMF (Autorité des Marchés Financiers) on March 8, 2017
THIRD QUARTER 2017 RESULTS
 THIRD QUARTER 2017 RESULTS PRESS RELEASE Paris, 31 October 2017 SLIGHT REVENUE DECREASE (UNFAVOURABLE FOREIGN EXCHANGE EFFECT THIS QUARTER) REVENUES: -1.8% vs. 3Q16 (STABLE AT CONSTANT SCOPE AND EXCHANGE
FIRST QUARTER 2018 RESULTS
 FIRST QUARTER 2018 RESULTS PRESS RELEASE Paris, 4 May 2018 BUSINESS GROWTH DRIVEN BY DOMESTIC MARKETS AND INTERNATIONAL FINANCIAL SERVICES IN THE CONTEXT OF ECONOMIC RECOVERY IN EUROPE OUTSTANDING LOANS:
THIRD UPDATE OF THE 2017 REGISTRATION DOCUMENT
 THIRD UPDATE OF THE 2017 REGISTRATION DOCUMENT FILED WITH THE AMF ON OCTOBER, 30 2018 Registration document and annual financial report filed with the AMF (Autorité des Marchés Financiers) on March 6,
THIRD UPDATE TO THE 2015 REGISTRATION DOCUMENT
 THIRD UPDATE TO THE 2015 REGISTRATION DOCUMENT FILED WITH THE AMF ON OCTOBER, 28 TH 2016 Registration document and annual financial report filed with the AMF (Autorité des Marchés Financiers) on March
THIRD QUARTER 2018 RESULTS
 THIRD QUARTER 2018 RESULTS PRESS RELEASE Paris, 30 October 2018 BUSINESS INCREASE IN A CONTRASTED CONTEXT OF ECONOMIC GROWTH IN EUROPE OUTSTANDING LOANS: +4.2% vs. 3Q17 GROWTH IN THE REVENUES OF THE OPERATING
SECOND UPDATE TO THE 2016 REGISTRATION DOCUMENT AND HALF YEAR FINANCIAL REPORT FILED WITH THE AMF ON JULY, 31 TH 2017
 SECOND UPDATE TO THE 2016 REGISTRATION DOCUMENT AND HALF YEAR FINANCIAL REPORT FILED WITH THE AMF ON JULY, 31 TH 2017 Registration document and annual financial report filed with the AMF (Autorité des
THIRD UPDATE TO THE 2009 REGISTRATION DOCUMENT FILED WITH THE AMF ON NOVEMBER 8, 2010
 THIRD UPDATE TO THE 2009 REGISTRATION DOCUMENT FILED WITH THE AMF ON NOVEMBER 8, 2010 Registration document and annual financial report filed with the AMF (Autorité des Marchés Financiers) on March 11,
First Quarter 2012 Results
 First Quarter 2012 Results 4 May 2012 1 Disclaimer Figures included in this presentation are unaudited. On 18 April 2012, BNP Paribas issued a restatement of its quarterly results for 2011 reflecting,
FIRST UPDATE TO THE 2009 REGISTRATION DOCUMENT FILED WITH THE AMF ON MAY 11, 2010
 FIRST UPDATE TO THE 2009 REGISTRATION DOCUMENT FILED WITH THE AMF ON MAY 11, 2010 Registration document and annual financial report filed with the AMF (Autorité des Marchés Financiers) on March 11, 2010
RESULTS AS AT 30 JUNE 2009
 RESULTS AS AT 30 JUNE 2009 Paris, 4 August 2009 STRONG PROFIT GENERATION CAPACITY CONFIRMED 2Q09 2Q09/2Q08 2Q09/1Q09 NET INCOME GROUP SHARE 1,604 mn +6.6% +3.0% RETURN ON EQUITY 11.8% (15.8% IN THE 1 ST
RESULTS AS AT 31 MARCH 2008
 RESULTS AS AT 31 MARCH 2008 Paris, 14 May 2008 RESULTS AS AT 31 MARCH 2008 QUARTERLY NET PROFIT CLOSE TO 2 BILLION EUROS 1Q08/1Q07 1Q08/4Q07 REVENUES 7,395MN -10.0% +6.9% NET INCOME (GROUP SHARE) 1,981MN
BNP Paribas Swiftly adapting to the changing environment. Fixed Income Presentation May 2012
 BNP Paribas Swiftly adapting to the changing environment Fixed Income Presentation May 2012 1 Disclaimer Figures included in this presentation are unaudited. On 21 April 2011, BNP Paribas issued a restatement
RESULTS AS AT 31 MARCH 2009
 RESULTS AS AT 31 MARCH 2009 Paris, 6 May 2009 A NET PROFIT OF 1.56 BILLION EUROS (GROUP SHARE) IN AN ENVIRONMENT STILL CHALLENGING 1Q09/1Q08 REVENUES 9,477mn +28.2% OPERATING EXPENSES - 5,348mn +16.1%
BNP Paribas. A Leading European Player. Lars Machenil Chief Financial Officer. Goldman Sachs Conference, Madrid 12 June 2014
 BNP Paribas A Leading European Player Lars Machenil Chief Financial Officer Goldman Sachs Conference, Madrid 12 June 2014 Disclaimer Figures included in this presentation are unaudited. On 14 March 2014,
First Quarter 2013 Results
 First Quarter 2013 Results 3 May 2013 1 Disclaimer Figures included in this presentation are unaudited. On 18 April 2013, BNP Paribas issued a restatement of its quarterly results for 2012 reflecting,
Second quarter 2012 results
 Second quarter 2012 results 2 August 2012 1 Disclaimer Figures included in this presentation are unaudited. On 18 April 2012, BNP Paribas issued a restatement of its quarterly results for 2011 reflecting,
2018 FULL YEAR RESULTS
 2018 FULL YEAR RESULTS PRESS RELEASE Paris, 6 February 2019 BUSINESS INCREASE IN AN ENVIRONMENT OF ECONOMIC GROWTH IN EUROPE OUTSTANDING LOANS: +3.9% vs. 2017 REVENUES OF THE DIVISIONS HELD UP WELL DESPITE
2017 FULL YEAR RESULTS
 2017 FULL YEAR RESULTS PRESS RELEASE Paris, 6 February 2018 RISE IN REVENUES OF THE OPERATING DIVISIONS: - GOOD BUSINESS DEVELOPMENT IN ALL THE BUSINESSES - INTEREST RATE AND MARKET ENVIRONMENT STILL LACKLUSTRE
Fourth Supplement dated 15 March to the Warrant and Certificate Programme Base Prospectus dated 4 July 2017
 Fourth Supplement dated 15 March 2018 to the Warrant and Certificate Programme Base Prospectus dated 4 July 2017 BNP Paribas Issuance B.V. (incorporated in The Netherlands) (as Issuer) BNP Paribas (incorporated
BNP Paribas Issuance B.V. BNP Paribas. BNP Paribas Fortis Funding. BNP Paribas Fortis SA/NV
 Fifth Supplement dated 15 February 2018 to the Base Prospectus for the issue of unsubordinated Notes dated 7 June 2017 BNP Paribas Issuance B.V. (formerly BNP Paribas Arbitrage Issuance B.V.) (incorporated
BNP PARIBAS FIRST QUARTER 2018 RESULTS
 BNP PARIBAS FIRST QUARTER 2018 RESULTS 4 MAY 2018 Disclaimer The figures included in this presentation are unaudited. For 2018 they are based on the new accounting standard IFRS 9 Financial Instruments
BNP Paribas. European Leader With Strong Capital Generation Capacity. September 2015
 BNP Paribas European Leader With Strong Capital Generation Capacity September 2015 Disclaimer Figures included in this presentation are unaudited. On 24 March 2015, BNP Paribas issued a restatement of
BNP Paribas Results as at 30 September 2006
 BNP Paribas Results as at 30 September 2006 Paris 16 November 2006 1 Overview Group Results Core Businesses Results Conclusion 2 In millions of euros 3Q06 3Q06 / 3Q05 3Q06 / 3Q05 Revenues 6,829 +25.1%
2011 RESTATED QUARTERLY RESULT SERIES
 2011 RESTATED QUARTERLY RESULT SERIES Paris, 18 April 2012 So as to be comparable with 2012, the 2011 quarterly result series have been restated of the following three main effects as if these had occurred
BNP PARIBAS FORTIS 2016 FIRST HALF RESULTS
 O 1 Brussels, 29 August 2016 PRESS RELEASE BNP PARIBAS FORTIS 2016 FIRST HALF RESULTS GOOD RESULTS IN A CHALLENGING ENVIRONMENT SOLID FINANCIAL STRUCTURE CUSTOMER LOANS 1 AT EUR 165 BILLION, +3.2%* vs.
BNP PARIBAS FORTIS 2015 FULL YEAR RESULTS
 o Brussels, 4 March 2016 PRESS RELEASE BNP PARIBAS FORTIS 2015 FULL YEAR RESULTS STRONG OPERATING PERFORMANCE DESPITE PERSISTENTLY LOW INTEREST RATE ENVIRONMENT CUSTOMER LOANS 1 AT EUR 170 BILLION, +6.5%*
FIRST UPDATE TO THE 2016 REGISTRATION DOCUMENT
 A French corporation with share capital of EUR 1,009,380,011.25 Registered office: 29 boulevard Haussmann - 75009 PARIS 552 120 222 R.C.S. PARIS FIRST UPDATE TO THE 2016 REGISTRATION DOCUMENT Registration
BNP PARIBAS SECOND QUARTER 2018 RESULTS
 BNP PARIBAS SECOND QUARTER 2018 RESULTS 1 ST AUGUST 2018 Disclaimer The figures included in this presentation are unaudited. For 2018 they are based on the new accounting standard IFRS 9 Financial Instruments
BNP PARIBAS EUROPEAN LEADER WITH STRONG CAPITAL GENERATION CAPACITY. Fixed Income Roadshow. March 2016
 BNP PARIBAS EUROPEAN LEADER WITH STRONG CAPITAL GENERATION CAPACITY Fixed Income Roadshow March 2016 Disclaimer Figures included in this presentation are unaudited. On 24 March 2015, BNP Paribas issued
Results as at 30 June 2005
 Paris, 3 August 2005 Results as at 30 June 2005 FIRST HALF 2005 SUBSTANTIAL RISE IN PROFITABILITY NET INCOME GROUP SHARE 3,176MN (+ 27.5%) ANNUALISED ROE AFTER-TAX 21.8% (+ 2.8 PTS) SECOND QUARTER 2005
Second Quarter 2007 Results
 Paris, 1 st August 2007 Second Quarter 2007 Results ROBUST ORGANIC GROWTH REVENUES French Retail Banking (excluding PEL/CEL) BNL bc International Retail Financial Services Asset Management and Services
RESULTS AS AT 31 DECEMBER 2008
 RESULTS AS AT 31 DECEMBER 2008 Paris, 19 February 2009 2008: 3 BILLION EUROS NET INCOME GROUP SHARE DESPITE THE CRISIS 2008 2007 REVENUES 27,376mn 31,037mn GROSS OPERATING INCOME 8,976mn 12,273mn COST
FOURTH UPDATE TO THE 2014 REGISTRATION DOCUMENT FILED WITH THE AMF ON DECEMBER 28, 2015
 FOURTH UPDATE TO THE 2014 REGISTRATION DOCUMENT FILED WITH THE AMF ON DECEMBER 28, Registration document and annual financial report filed with the AMF (Autorité des Marchés Financiers) on March 6, under
BNP Paribas. Rock-Solid Balance Sheet & Leaner Operations: a Sound Basis for New Development Plan. US Fixed Income Presentation October 2013
 BNP Paribas Rock-Solid Balance Sheet & Leaner Operations: a Sound Basis for New Development Plan US Fixed Income Presentation October 2013 1 Disclaimer Figures included in this presentation are unaudited.
BNP Paribas Swiftly adapting to the changing environment. 12 April 2012
 BNP Paribas Swiftly adapting to the changing environment Fixed Income Presentation ti 12 April 2012 1 Disclaimer Figures included in this presentation are unaudited. On 21 April 2011, BNP Paribas issued
BNP Paribas. European Leader With Strong Capital Generation Capacity. Jean-Laurent Bonnafé Chief Executive Officer
 BNP Paribas European Leader With Strong Capital Generation Capacity Jean-Laurent Bonnafé Chief Executive Officer Bank of America Merrill Lynch Conference, London 29 September 2015 Disclaimer Figures included
H Results. Results and business activity up sharply, and ahead of the roadmap
 H1 2018 Results Results and business activity up sharply, and ahead of the roadmap H1 2018 Highlights A high level of profitability due to: Continued growth momentum Improved operational efficiency Successful
Paris, 24. of the. being: and Commodities activities. operating
 RESTATED QUARTERLY RESULT SERIES BASED ON FORMAT Paris, March So as to be comparable with, the quarterly result series have been restated of the following main effects as if these had occurred on st January..
BNP PARIBAS 2017 FULL YEAR RESULTS
 BNP PARIBAS 2017 FULL YEAR RESULTS 6 FEBRUARY 2018 Disclaimer The figures included in this presentation are unaudited. This presentation includes forward-looking statements based on current beliefs and
Third Quarter 2010 Results. 4 November 2010
 Third Quarter 2010 Results 4 November 2010 1 Disclaimer Figures included in this presentation are unaudited. On 19 April 2010, BNP Paribas issued a restatement of its divisional results for 2009 reflecting
UPDATE A03 THE 2016 REGISTRATION DOCUMENT
 UPDATE A03 OF THE 2016 REGISTRATION DOCUMENT FINANCIAL REVIEW AT 30 JUNE 2017 Disclaimer The financial information for the second quarter and first half-year period 2017 for Crédit Agricole S.A. and the
UPDATE A04 THE 2016 REGISTRATION DOCUMENT
 UPDATE A04 OF THE 2016 REGISTRATION DOCUMENT FINANCIAL REVIEW AT 30 SEPTEMBER 2017 Disclaimer The financial information for the third quarter and first nine-month period ended 30 September 2017 for Crédit
Third quarter and first nine months 2013 results. 7 November 2013
 Third quarter and first nine months 2013 results 7 November 2013 DISCLAIMER This presentation may include prospective information on the Group, supplied as information on trends. This data does not represent
Results for the first nine months of 2017
 Results for the first nine months of 2017 Results up sharply thanks to the integration of Pioneer and business momentum Net inflows 1 of + 58bn over the first nine months o/w + 31bn in Q3 2017 Activity
BNP Paribas Growing Profitably
 BNP Paribas Growing Profitably Baudouin PROT Chief Executive Officer London, 4 October 2005 1 Disclaimer All growth rates and comparisons indicated in this presentation are on a comparable accounting standard
Sharp increase in operating income: +32.4%* vs. H1 03 ROE after tax: 19.1% (vs. 15.6% in H1 03) EPS: EUR 3.79 (+31.8% vs. H1 03) Change vs.
 EPS: EUR 3.79 (+31.8% vs. H1 03) Change vs.") Paris, July 30th 2004 PRESS RELEASE CONTACTS GOOD RESULTS SECOND QUARTER 2004: Robust growth in franchises and sound revenues Tight cost control Low risk provisioning Record level of operating income:
Paris, July 30th 2004 PRESS RELEASE CONTACTS GOOD RESULTS SECOND QUARTER 2004: Robust growth in franchises and sound revenues Tight cost control Low risk provisioning Record level of operating income:
BNP Paribas Results as at 30 June 2007
 BNP Paribas Results as at 30 June 2007 London 1 st August 2007 1 Overview of the Presentation Summary results Detailed disclosure 2 Key Figures 2Q07 and 1H07 2Q07 2Q07/2Q06 1H07/1H06 Revenues At constant
BNP PARIBAS GOOD START OF THE 2020 PLAN
 BNP PARIBAS GOOD START OF THE 2020 PLAN September 2017 Disclaimer The figures included in this presentation are unaudited. This presentation includes forward-looking statements based on current beliefs
Third quarter and first nine months 2016 results
 Montrouge, 8 November 206 Third quarter and first nine months 206 results Strong growth of net profit and strengthened financial solidity Contribution to growth from all business lines Crédit Agricole
BNP PARIBAS GOOD START OF THE 2020 PLAN
 BNP PARIBAS GOOD START OF THE 2020 PLAN Bank of America Merrill Lynch Conference London, 28 September 2017 Disclaimer The figures included in this presentation are unaudited. This presentation includes
SECOND UPDATE TO THE 2017 REGISTRATION DOCUMENT 2017 INTERIM FINANCIAL REPORT
 A French corporation with a share capital of EUR 1,009,641,917.50 Registered office: 29, boulevard Haussmann - 75009 PARIS 552 120 222 R.C.S. PARIS SECOND UPDATE TO THE 2017 REGISTRATION DOCUMENT 2017
Results as at 30 June 2005
 Results as at 30 June 2005 1 BNP Paribas: Disclaimer All growth rates and comparisons indicated in this presentation are on a comparable accounting standard basis, except where expressly provided otherwise.
SOCIETE GENERALE AUTUMN CONFERENCE Bernardo Sanchez Incera, Deputy CEO PARIS, 15/09/2016
 SOCIETE GENERALE Bernardo Sanchez Incera, Deputy CEO PARIS, 15/09/2016 DISCLAIMER This presentation contains forward-looking statements relating to the targets and strategies of the Societe Generale Group.
BNP PARIBAS PROMISING START TO THE 2020 PLAN
 BNP PARIBAS PROMISING START TO THE 2020 PLAN Morgan Stanley Conference, London 21 March 2018 Disclaimer The figures included in this presentation are unaudited. This presentation includes forward-looking
Update of the Registration Document A03
 Contents Financial review of Crédit Agricole S.A. at 30 June 2015...3 Presentation of first half and second quarter 2015 results...3 First half 2015 financial report... 86 Other recent information... 254
Selected Exposures based on recommendations of the Financial Stability Board
 Selected Exposures based on recommendations of the Financial Stability Board As at 30 June 2010 1 Disclaimer Figures included in this presentation are unaudited. On 19 April 2010, BNP Paribas issued a
AND UNCONDITIONALLY AND IRREVOCABLY GUARANTEED BY BNP PARIBAS FORTIS SA/NV. Euro Medium Term Note Programme
 3 April 2014 FOURTH SUPPLEMENT TO THE BASE PROSPECTUS BNP PARIBAS FORTIS SA/NV (INCORPORATED AS A PUBLIC COMPANY WITH LIMITED LIABILITY (NAAMLOZE VENNOOTSCHAP/SOCIÉTÉ ANONYME) UNDER THE LAWS OF BELGIUM,
BNP Paribas. Results as at 31 March Paris. 14 May 2008
 BNP Paribas Results as at 31 March 2008 Paris 14 May 2008 1 Disclaimer This presentation includes forward-looking statements based on current beliefs and expectations about future events. Forward-looking
BNP Paribas. Sustainable Growth and Value Creation. Baudouin Prot. Chief Executive Officer. 14 June 2007
 BNP Paribas Sustainable Growth and Value Creation Baudouin Prot Chief Executive Officer 14 June 2007 1 Disclaimer This presentation includes forward-looking statements based on current beliefs and expectations
Presentation to Investors & Analysts l 27 October Results for 9 months and Q3 2017
 Presentation to Investors & Analysts l 27 October 2017 Results for 9 months and Q3 2017 This presentation may contain projections concerning the financial situation and results of the activities and business
THIRD UPDATE TO THE 2018 REGISTRATION DOCUMENT
 A French corporation with a share capital of EUR 1,009,897,173.75 Registered office: 29, boulevard Haussmann - 75009 PARIS 552 120 222 R.C.S. PARIS THIRD UPDATE TO THE 2018 REGISTRATION DOCUMENT Registration
FIRST UPDATE TO THE 2017 REGISTRATION DOCUMENT
 A French corporation with share capital of EUR 1,009,641,917.50 Registered office: 29 boulevard Haussmann - 75009 PARIS 552 120 222 R.C.S. PARIS FIRST UPDATE TO THE 2017 REGISTRATION DOCUMENT Registration
Q2-17: another quarter of strong growth in net income
 Montrouge, 3 August 2017 Results for second quarter and first half 2017 : another quarter of strong growth in net income Crédit Agricole Group* Stated net income Group share Q2: 2,106m +8% Q2/Q2 H1: 3,706m
BNP PARIBAS BUSINESS DEVELOPMENT PLAN. Jean-Laurent Bonnafé Chief Executive Officer. Morgan Stanley Conference, London 22 March 2017
 BNP PARIBAS 2017-2020 BUSINESS DEVELOPMENT PLAN Jean-Laurent Bonnafé Chief Executive Officer Morgan Stanley Conference, London 22 March 2017 Disclaimer The figures included in this presentation are unaudited.
Selected exposures based on recommendations of the Financial Stability Board. 04 May 2011
 Selected exposures based on recommendations of the Financial Stability Board 04 May 2011 1 Disclaimer The exposures based on the recommendation of the Financial Stability Board as at 31March 2011 are not
keep reaching The founders of change are people like you. Let us accompany you with financial solutions for all your banking and investment needs.
 2011 AT A GLANCE The founders of change keep reaching are people like you. Let us accompany you with financial solutions for all your banking and investment needs. The poster opposite and the one on the
QUARTERLY FINANCIAL INFORMATION Q2 2013: GOOD BUSINESS PERFORMANCE, BASEL 3 CORE TIER 1 RATIO OF 9.4%
 PRESS RELEASE QUARTERLY FINANCIAL INFORMATION Paris, August 1st, 2013 Q2 2013: GOOD BUSINESS PERFORMANCE, BASEL 3 CORE TIER 1 RATIO OF 9.4% NBI (1) : EUR 6.2bn, +2.3% vs. Q2 12, business revenues up +5.8%
Revenues and income resilient in core businesses
 Paris, 7 May 2013 First quarter 2013 Revenues and income resilient in core businesses Crédit Agricole Group* in the first quarter of 2013 Net income Group share excluding revaluation of own debt issues
May 9, Results for the 1st quarter of 2012
 May 9, 2012 Results for the 1st quarter of 2012 Disclaimer This presentation may contain forward-looking statements and comments relating to the objectives and strategy of Groupe BPCE. By their very nature,
QUARTERLY FINANCIAL INFORMATION
 QUARTERLY FINANCIAL INFORMATION Paris, November 3 rd, 2017 Q3 17: SOLID RESULTS IN RETAIL, DECLINE IN MARKETS ACTIVITIES Net banking income for the core businesses of EUR 5.9bn (-5.9% vs. Q3 16): substantial
Improvement Non-Life operating performance confirmed Group combined ratio at 101.2%, vs %
 PRESS RELEASE Brussels/Utrecht, 9 November 2011-7.30 CET Regulated Information First nine months results 2011 Insurance net result affected by financial market turmoil Intrinsic Insurance performance remains
First quarter 2014 results. 7 May 2014
 First quarter 2014 results 7 May 2014 DISCLAIMER This presentation may include prospective information on the Group, supplied as information on trends. This data does not represent forecasts within the
Natixis Deutsche Bank Global Financial Services Conference
 Natixis Deutsche Bank Global Financial Services Conference May 29, 2018 - New York DISCLAIMER This media release may contain objectives and comments relating to the objectives and strategy of Natixis.
SOCIETE GENERALE SOCIETE GENERALE PREMIUM REVIEW. Frédéric Oudéa, Chairman & CEO 5 DECEMBER 2013
 SOCIETE GENERALE SOCIETE GENERALE PREMIUM REVIEW Frédéric Oudéa, Chairman & CEO 5 DECEMBER 2013 DISCLAIMER This document may contain a number of forecasts and comments relating to the targets and strategies
Carrefour: 2012 Full-Year Results Growth in sales and net income, Group share Strengthened financial structure
 Carrefour: 2012 Full-Year Results Growth in sales and net income, Group share Strengthened financial structure 2012 key figures Growth in sales: +0.9% to 76.8bn, driven by emerging markets Resilient Recurring
Selected Exposures based on recommendations of the Financial Stability Board
 Selected Exposures based on recommendations of the Financial Stability Board As at 31 December 2009 1 Disclaimer Figures included in this presentation are unaudited. This presentation includes forward-looking
16 / 02 / 2011 FULL-YEAR AND FOURTH QUARTER 2010 RESULTS
 We stand by you Disclaimer This document may contain a number of forecasts and comments relating to the targets and strategies of the Societe Generale Group. These forecasts are based on a series of assumptions,
Third update to the 2012 Registration Document filed with the Autorité des Marchés Financiers (AMF) on November 8, 2013
 on November 8, 2013") Third update to the 2012 Registration Document filed with the Autorité des Marchés Financiers (AMF) on November 8, 2013 The 2012 Registration Document was registered with the AMF on March 22, 2013 under
Third update to the 2012 Registration Document filed with the Autorité des Marchés Financiers (AMF) on November 8, 2013 The 2012 Registration Document was registered with the AMF on March 22, 2013 under
Q2: 5,171m +9.8% Q2/Q2 H1: 10,081m +7.1% H1/H1. Q2: 8,428m +6.3% Q2/Q2 H1: 16,686m +3.1% H1/H1
 Montrouge, 3 August 2018 Results for the second quarter and first half of 2018 Q2-18: highest net profit 1 since IPO Crédit Agricole S.A. Stated net income Group share Q2: 1,436m +6.4% Q2/Q2 H1: 2,292m
Natixis. Bank of America Merrill Lynch 23 rd Annual Financials CEO Conference. September 26, London
 Natixis Bank of America Merrill Lynch 23 rd Annual Financials CEO Conference September 26, 2018 - London Natixis ambitions New Dimension 2018-2020 Strategic Plan DISCLAIMER This media release may contain
Q3 & 9M-17: excellent performances
 Montrouge, 8 November 2017 Results for the third quarter and first nine months 2017 Q3 & 9M-17: excellent performances Credit Agricole Group* Stated net income Group share Q3: 1,907m +36.8% Q3/Q3 9M: 5,614m
Press release Activities and results in 2007
 Press release Activities and results in 2007 February 21st 2008 A profitable year in 2007 despite the financial crisis and exceptional fraud Lower revenues due to the US financial crisis: -2.8%* vs. 2006
Q3 18: CONFIRMATION OF A GOOD LEVEL OF PROFITABILITY: ROTE (1) OF 11.0% IN Q3 18 AND 11.0% IN 9M 18
 OF 11.0% IN Q3 18 AND 11.0% IN 9M 18") Paris, November 8 th, 2018 QUARTERLY FINANCIAL INFORMATION Q3 18: CONFIRMATION OF A GOOD LEVEL OF PROFITABILITY: ROTE (1) OF 11.0% IN Q3 18 AND 11.0% IN 9M 18 HIGHLIGHTS 9.0% (1) increase in Group revenues
Paris, November 8 th, 2018 QUARTERLY FINANCIAL INFORMATION Q3 18: CONFIRMATION OF A GOOD LEVEL OF PROFITABILITY: ROTE (1) OF 11.0% IN Q3 18 AND 11.0% IN 9M 18 HIGHLIGHTS 9.0% (1) increase in Group revenues
METRO QUARTERLY STATEMENT 9M/Q3 2017/18
 CONTENT 2 Overview 4 Sales, earnings and financial position 5 Earnings position of the sales lines 5 8 Real 9 Others 10 Outlook 11 Store network 12 Income statement 13 Balance sheet 15 Cash flow statement
03 / 11 / 2010 THIRD QUARTER AND FIRST 9 MONTHS 2010 RESULTS
 03 / 11 / 2010 THIRD QUARTER AND FIRST 9 MONTHS 2010 RESULTS We stand by you Disclaimer This document may contain a number of forecasts and comments relating to the targets and strategies of the Societe
New Dimension well embarked with: Reported revenues up +3% at 2.4bn and reported Net income up +15% at 323m
 Paris, May 17, 2018 results New Dimension well embarked with: Reported revenues up +3% at 2.4bn and reported Net income up +15% at 323m marked by market volatility and an average -15% depreciation of the
Strong results based on sound fundamentals
 Montrouge, 7 November 2013 Results for the third quarter and first nine months of 2013 Strong results based on sound fundamentals - growth of results in French retail banking - improvement in cost of risk