2 nd Topic X: Budgets
|
|
|
- Loren Lucas
- 5 years ago
- Views:
Transcription
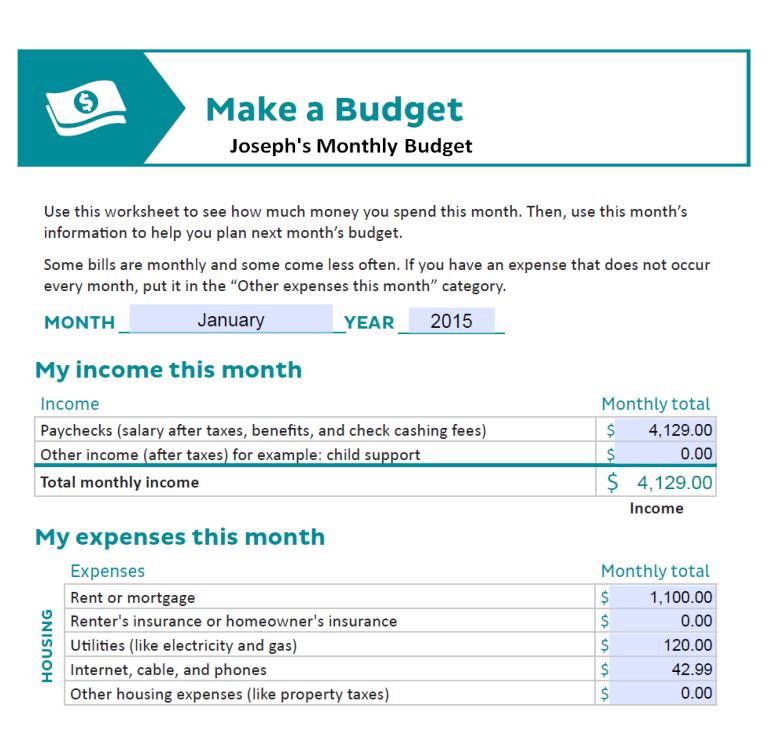
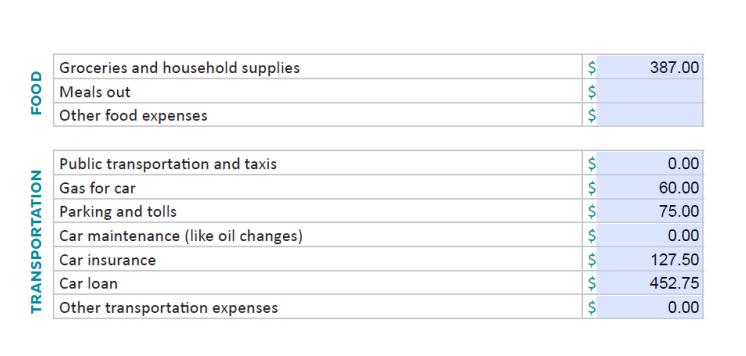
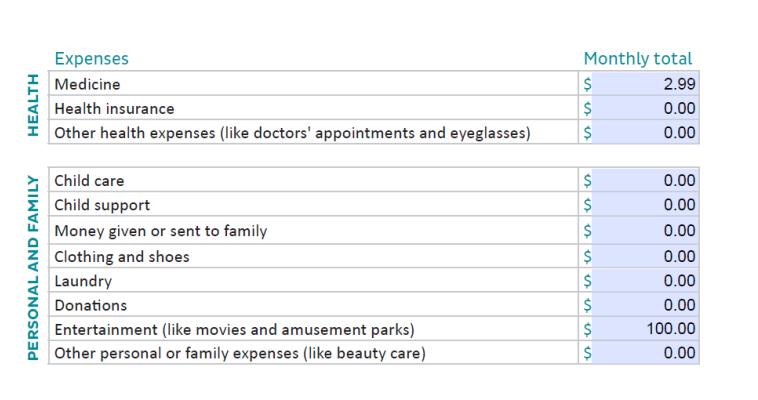
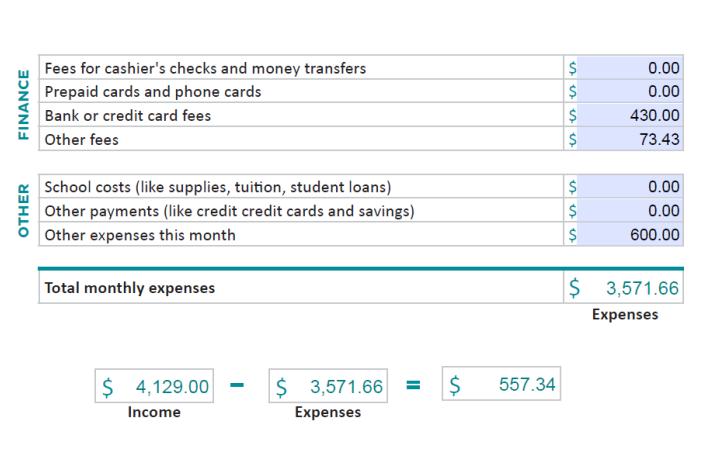
1 Date:02/09-12/ nd Class Objective: Apply the concept to model exponential growth and decay. Apply the concept to visualize and interpret a budget using a pie chart, a bar graph, and a line graph Agenda: Bell ringer (ex: 35,36 page 427) Vocabulary: A budget Examples (page ) Class work (page 339) Closing Activity Homework
 a) Find the cost of 10-minute call on this phone. b) Find the cost of 13.44-minute call on this phone. a) 0.68 0.21( m 4) 0.68 1.")
2 . 1 st Topic X: Budgets Bell ringer ex: 2 page 494 A pay phone at a shopping mall changes $0.68 for the first four minutes and $0.21 for each extra minutes ( or part of a minute) a) Find the cost of 10-minute call on this phone. b) Find the cost of minute call on this phone. a) ( m 4) b) ( m 4) min
3 . 1 st Topic X: Budgets Bell ringer 0.27 * $ is spent on shopping
4
5
6
7
8 Construct a pie chart to show the expense percentages Category % Housing 35.4 Food 10.8 Transportation 20 Health 0.2 Personal & Family 2.7 Finance 14.1 Other 16.8
9 Construct a pie chart to show the expense percentages Joseph's Monthly Budget Personal & Family, 2.7 % Health, 0.2% Other, 16.8 % Finance 14.1% Transportation 20 % Housing, 35.4 % Food, 10.8 % Housing Food Transportation Health Personal & Family Finance Other

10 Construct a bar graph to show the expense percentages Joseph's Monthly Budget %
11 Construct a line Graph to show the expense percentages Joseph's Monthly Budget %
12 Example 1: Create a year-long budget check off matrix that keeps track of the following household expenses and they are due. Mortgage: monthly Utilities: monthly Sanitation: quarterly Insurance: semiannually Internet: semiannually Land line Telephone: monthly Cellular Telephone: monthly Lawn and Garden: monthly, April-September only Snow Removal: November, January, March only Food: monthly Childcare: every other month beginning with February Vet expenses: semiannually
13 Example 1: Create a year-long budget check off matrix that keeps track of the following household expenses and they are due. Mortgage: Utilities: Sanitation: Insurance: Internet: Land line Telephone: Cellular Telephone: Lawn and Garden: Snow Removal: Food: Childcare: Vet expenses: Jan Feb Mar Apr May Jun Jul Aug Sep Oct Nov Dec
14 Example 1: Create a year-long budget check off matrix that keeps track of the following household expenses and they are due.
15 Example 2 page 499 Jeff budgets his monthly expenses as follows. Household: 40% Education: 25% Transportation: 15% Health: 5% Savings: 10% Miscellaneous: 5% He used a software program to construct this pie chart to show his expense percentages. How did his category percentages affect the construction of the chart?
16 Example 2 page 499 Jeff budgets his monthly expenses as follows. Household: 40% Education: 25% Transportation: 15% Health: 5% Savings: 10% Miscellaneous: 5% Category % Measures of the central angles Household 40% 0.40 x 360 =144 0 Education 25% 0.25 x 360 =90 0 Transportation 15% 0.15 x 360 =54 0 Health 5% 0.05 x 360 =18 0 Savings 10% 0.10 x 360 =36 0 Miscellaneous 5% 0.05 x 360 = %

17 Example 2 page 499 Jeff budgets his monthly expenses as follows. Household: 40% Education: 25% Transportation: 15% Health: 5% Savings: 10% Miscellaneous: 5% Category % Measures of the central angles Household 40% 0.40 x 360 =144 0 Education 25% 0.25 x 360 =90 0 Transportation 15% 0.15 x 360 =54 0 Health 5% 0.05 x 360 =18 0 Savings 10% 0.10 x 360 =36 0 Miscellaneous 5% 0.05 x 360 = %


18 Example 4 page Construct a bar graph using the information about heathrelated costs from Sample B on page 496. Total
19 Ex 5 Pg 504 : Use the pie chart of a person s monthly income a) Suppose the total monthly income is $ 5,800 Determine the Monthly Income Interest amount for each income category. 5% b) Suppose the income from the secondary job was $ 1,225. What would be the total monthly income? c) Suppose the income from interest was $ 315. What would be the income from the primary job? Dividends 10% Secondary Job 25% Primary job 60% Primary job Secondary Job Dividends Interest
20 Ex 5 Pg 504 : Use the pie chart of a person s monthly income a) Suppose the total monthly income is $ 5,800 Determine the Monthly Income amount for each income category. Category $ Primary job Secondary Job Dividends Interest 5, , ,480 1, , , 450 Dividends 10% Secondary Job 25% Interest 5% Primary job 60% , Primary job Secondary Job Dividends Interest
21 Ex 5 Pg 504 : Use the pie chart of a person s monthly income b) Suppose the income from the secondary job was $ 1,225. What would be the Monthly Income total monthly income? Interest $ 1,225 x 100% 1, % 4,900 Dividends 10% Secondary Job 25% 5% Primary job 60% Primary job Secondary J Dividends Interest The total monthly income would be $4,900
22 Ex 5 Pg 504 : Use the pie chart of a person s monthly income c) Suppose the income Monthly Income from interest was $ 315. Interest Dividends What would be the 5% 10% income from the primary Primary job? job 60% $ 315 5% x 100% The income 6,300 Secondar y Job 25% $ 6, % x 60% ,780 Primary job Secondary Job Dividends Interest from the primary job would be $3,780
23 Example 4 page Construct a bar graph using the information about heathrelated costs from Sample B on page 496. Health Related Expenses , $
24 Exit ticket page 504 Name: date: Ex 3 Pg 504 : Create a year-long budget matrix to chart these expenses : Savings: $600 bimonthly (starting in January) Retirement account: $2,000 quarterly Checking account: $1,000 semi-monthly Credit card: $500 monthly Life insurance: $400 semi-annually. Real state taxes: $1,300 every four months, beginning in April.

25 Ex 3 Pg 504: Create a year-long budget matrix to chart these expenses : Savings: Retirement : checking: Credit card: Life insurance: Real states taxes: Jan Feb Mar Apr May Jun Jul Aug Sep Oct Nov Dec
26 Ex 3 Pg 504 : Create a year-long budget matrix to chart these expenses : Jan Feb Mar Apr May Jun Jul Aug Sep Oct Nov Dec Savings: Retirement : 2,000 2,000 2,000 2,000 checking: 2,000 2,000 2,000 2,000 2,000 2,000 2,000 2,000 2,000 2,000 2,000 2,000 Credit card: Life insurance: Real states taxes: 1,300 1,300 1,300
27 Ex 4 Pg 504 : Use the pie chart of a monthly entertainment budget a) Suppose $ 600 was budgeted. Determine the exact amount for each category: b) Suppose $ 72 was budgeted for day trips. What would be the total amount budgeted for entertainment? c) Suppose $ 310 was budgeted for the summer vacation. What would be the total amount budgeted for entertainment? Entertainment Budget Weekend Trip, 20, 20% Day Trip, 10, 10% Movie rental 10% Concerts, 20, 20% Summer Vacation, 40, 40% Summer Vacation Concerts Movie rental Day Trip Weekend Trip
28 Ex 4 Pg 504 : Use the pie chart of a monthly entertainment budget a) Suppose $ 600 was Entertainment Budget budgeted. Determine the Summer exact amount for each Vacation Weekend Concerts category: Trip, 20, 20% Summer Vacation 40 % = $ Concerts 20 % = $ Movie rental 10 % = $ Day Trip 10 % = $ Weekend Trip 20 % = $ Day Trip, 10, 10% Movie rental 10% Concerts, 20, 20% Summer Vacation, 40, 40% Movie rental Day Trip Weekend Trip
29 Ex 4 Pg 504 : Use the pie chart of a monthly entertainment budget b) Suppose $ 72 was budgeted Entertainment Budget for day trips. What would be Summer Vacation the total amount budgeted for Weekend Concerts entertainment? Trip, 20, 20% $ 72 x 10% 100% Day Trip, 10, 10% Movie rental 10% Concerts, 20, 20% Summer Vacation, 40, 40% Movie rental Day Trip Weekend Trip The total amount budgeted for entertaiment $720
30 Ex 4 Pg 504 : Use the pie chart of a monthly entertainment budget c) Suppose $ 310 was budgeted Entertainment Budget for the summer vacation. What Summer Vacation would be the total amount Weekend Concerts budgeted for entertainment? Trip, 20, 20% $ % x 100% Day Trip, 10, 10% Movie rental 10% Concerts, 20, 20% Summer Vacation, 40, 40% Movie rental Day Trip Weekend Trip The total amount budgeted for entertaiment $775
31 Class work Workbook ex: (1-7) Page
32 Homework Workbook ex: (8-11) Page
3 rd Topic X: Budgets
 Date:02/13-18/2015 3rd Class Objective: Apply the concept to develop and interpret a cash flow chart Apply the concept to develop and interpret a frequency budget plan Apply the concept to develop and
Spheria Australian Smaller Companies Fund
 29-Jun-18 $ 2.7686 $ 2.7603 $ 2.7520 28-Jun-18 $ 2.7764 $ 2.7681 $ 2.7598 27-Jun-18 $ 2.7804 $ 2.7721 $ 2.7638 26-Jun-18 $ 2.7857 $ 2.7774 $ 2.7690 25-Jun-18 $ 2.7931 $ 2.7848 $ 2.7764 22-Jun-18 $ 2.7771
XML Publisher Balance Sheet Vision Operations (USA) Feb-02
 Feb-02") Page:1 Apr-01 May-01 Jun-01 Jul-01 ASSETS Current Assets Cash and Short Term Investments 15,862,304 51,998,607 9,198,226 Accounts Receivable - Net of Allowance 2,560,786
Page:1 Apr-01 May-01 Jun-01 Jul-01 ASSETS Current Assets Cash and Short Term Investments 15,862,304 51,998,607 9,198,226 Accounts Receivable - Net of Allowance 2,560,786
Factor Leave Accruals. Accruing Vacation and Sick Leave
 Factor Leave Accruals Accruing Vacation and Sick Leave Factor Leave Accruals As part of the transition of non-exempt employees to biweekly pay, the UC Office of the President also requires standardization
Cost Estimation of a Manufacturing Company
 Cost Estimation of a Manufacturing Company Name: Business: Date: Economics of One Unit: Manufacturing Company (Only complete if you are making a product, such as a bracelet or beauty product) Economics
SUZEORMAN.COM. Exercise: My Monthly Expenses. Instructions:
 Exercise: My Monthly Expenses Instructions: 1. Go through your records and receipts for the last complete calendar year. This includes all checks, all credit-card charges, and all ATM withdrawals and cash
Business & Financial Services December 2017
 Business & Financial Services December 217 Completed Procurement Transactions by Month 2 4 175 15 125 1 75 5 2 1 Business Days to Complete 25 Jan Feb Mar Apr May Jun Jul Aug Sep Oct Nov Dec 217 Procurement
WESTWOOD LUTHERAN CHURCH Summary Financial Statement YEAR TO DATE - February 28, Over(Under) Budget WECC Fund Actual Budget
 Budget WECC Fund Actual Budget") WESTWOOD LUTHERAN CHURCH Summary Financial Statement YEAR TO DATE - February 28, 2018 General Fund Actual A B C D E F WECC Fund Actual Revenue Revenue - Faith Giving 1 $ 213 $ 234 $ (22) - Tuition $ 226
WESTWOOD LUTHERAN CHURCH Summary Financial Statement YEAR TO DATE - February 28, 2018 General Fund Actual A B C D E F WECC Fund Actual Revenue Revenue - Faith Giving 1 $ 213 $ 234 $ (22) - Tuition $ 226
PRESS RELEASE. Securities issued by Hungarian residents and breakdown by holding sectors. January 2019
 7 March 2019 PRESS RELEASE Securities issued by Hungarian residents and breakdown by holding sectors January 2019 According to securities statistics, the amount outstanding of equity securities and debt
Egg Entrepreneurship Records
 Egg Entrepreneurship Records Name 4-H Program Year PROJECT GOAL Setting goals and then checking progress on the attainment of those goals is an important part of 4-H. Complete the boxes 1-3 at the beginning
Exotic Tea Prices. Year
 Price, cents per pound UNDERSTANDING HOW TO READ GRAPHS Information is often presented in the form of a graph, a diagram that shows numerical data in a visual form. Graphs enable us to see relationships
Isle Of Wight half year business confidence report
 half year business confidence report half year report contents new company registrations closed companies (dissolved) net company growth uk company share director age director gender naming trends sic
Review of Registered Charites Compliance Rates with Annual Reporting Requirements 2016
 Review of Registered Charites Compliance Rates with Annual Reporting Requirements 2016 October 2017 The Charities Regulator, in accordance with the provisions of section 14 of the Charities Act 2009, carried
Development of Economy and Financial Markets of Kazakhstan
 Development of Economy and Financial Markets of Kazakhstan National Bank of Kazakhstan Macroeconomic development GDP, real growth, % 116 112 18 14 1 113,5 11,7 216,7223,8226,5 19,8 19,8 19,3 19,619,7 199,
Choosing a Cell Phone Plan-Verizon Investigating Linear Equations
 Choosing a Cell Phone Plan-Verizon Investigating Linear Equations I n 2008, Verizon offered the following cell phone plans to consumers. (Source: www.verizon.com) Verizon: Nationwide Basic Monthly Anytime
OTHER DEPOSITS FINANCIAL INSTITUTIONS DEPOSIT BARKAT SAVING ACCOUNT
 WEIGHTAGES JAN FEB MAR APR MAY JUN JUL AUG SEPT OCT NOV DEC ANNOUNCEMENT DATE 19.Dez.14 27.Jän.15 24.Feb.15 26.Mär.15 27.Apr.15 26.Mai.15 25.Jun.15 28.Jul.15 26.Aug.15 23.Sep.15 27.Okt.15 25.Nov.15 MUDARIB
Algo Trading System RTM
 Year Return 2016 15,17% 2015 29,57% 2014 18,57% 2013 15,64% 2012 13,97% 2011 55,41% 2010 50,98% 2009 48,29% Algo Trading System RTM 89000 79000 69000 59000 49000 39000 29000 19000 9000 2-Jan-09 2-Jan-10
Constructing a Cash Flow Forecast
 Constructing a Cash Flow Forecast Method and Worked Example A cash flow forecast shows the estimates of the timing and amounts of cash inflows and outflows over a period of time. The sections of a cash
PRESS RELEASE. Securities issued by Hungarian residents and breakdown by holding sectors. October 2018
 PRESS RELEASE 10 December 2018 Securities issued by Hungarian residents and breakdown by holding sectors October 2018 According to securities statistics, the amount outstanding of equity securities and
U.S. Natural Gas Storage Charts
 U.S. Natural Gas Storage Charts BMO Capital Markets Commodity Products Group November 26, 214 Total U.S. Natural Gas in Storage 5, Total Stocks This Week 3432 4, 3, 2, 1, Reported On: November 26, 214
Financial & Business Highlights For the Year Ended June 30, 2017
 Financial & Business Highlights For the Year Ended June, 17 17 16 15 14 13 12 Profit and Loss Account Operating Revenue 858 590 648 415 172 174 Investment gains net 5 162 909 825 322 516 Other 262 146
Looking at a Variety of Municipal Valuation Metrics
 Looking at a Variety of Municipal Valuation Metrics Muni vs. Treasuries, Corporates YEAR MUNI - TREASURY RATIO YEAR MUNI - CORPORATE RATIO 200% 80% 175% 150% 75% 70% 65% 125% Average Ratio 0% 75% 50% 60%
PRESS RELEASE. Securities issued by Hungarian residents and breakdown by holding sectors. October 2017
 11 December 2017 PRESS RELEASE Securities issued by Hungarian residents and breakdown by holding sectors October 2017 According to securities statistics, the amount outstanding of equity securities and
Big Walnut Local School District
 Big Walnut Local School District Monthly Financial Report for the month ended September 30, 2013 Prepared By: Felicia Drummey Treasurer BIG WALNUT LOCAL SCHOOL DISTRICT SUMMARY OF YEAR TO DATE FINANCIAL
Aon Hewitt. Facts & Figures. July 2017 Update. Risk. Reinsurance. Human Resources. Empower Results
 Aon Hewitt Facts & Figures Risk. Reinsurance. Human Resources. Empower Results Facts & Figures Contents In this document... This button normally prints the whole document. If you want to print just the
SmallBizU WORKSHEET 1: REQUIRED START-UP FUNDS. Online elearning Classroom. Item Required Amount ($) Fixed Assets. 1 -Buildings $ 2 -Land $
 Fixed Assets. 1 -Buildings $ 2 -Land $") WORKSHEET 1: REQUIRED START-UP FUNDS Item Required Amount () Fixed Assets 1 -Buildings 2 -Land 3 -Initial Inventory 4 -Equipment 5 -Furniture and Fixtures 6 -Vehicles 7 Total Fixed Assets Working Capital
WORKSHEET 1: REQUIRED START-UP FUNDS Item Required Amount () Fixed Assets 1 -Buildings 2 -Land 3 -Initial Inventory 4 -Equipment 5 -Furniture and Fixtures 6 -Vehicles 7 Total Fixed Assets Working Capital
Sales and Use Tax Collection Report December 2018 Issued January 10, 2019
 Financial Services Sales Tax Division 215 N. Mason Street 2 nd Floor PO Box 580Fort Collins, CO 80522-0580 970.221.6780 970.221.6782 - fax fcgov.com Sales and Use Tax Collection Report December 2018 Issued
TERMS OF REFERENCE FOR THE INVESTMENT COMMITTEE
 I. PURPOSE The purpose of the Investment Committee (the Committee ) is to recommend to the Board the investment policy, including the asset mix policy and the appropriate benchmark for both ICBC and any
Regional overview Gisborne
 Regional overview Purchasing intentions - additional income-related rent subsidy (IRRS) places Area District 1 2 3 4+ TOTAL 3 35 5 7 total 3 35 5 7 7 8 9 1 11 Purchasing intentions - change within the
Cash & Liquidity The chart below highlights CTA s cash position at December 2017 compared to December 2016.
 To: Chicago Transit Authority Board From: Jeremy Fine, Chief Financial Officer Re: Financial Results for December 2017 Date: February 14, 2018 I. Summary CTA s financial results are $4.7 million favorable
Cash & Liquidity The chart below highlights CTA s cash position at September 2017 compared to September 2016.
 To: Chicago Transit Authority Board From: Jeremy Fine, Chief Financial Officer Re: Financial Results for September 2017 Date: November 15, 2017 I. Summary CTA s financial results are $7.7 million favorable
Regional overview Hawke's Bay
 Regional overview Purchasing intentions - additional income-related rent subsidy (IRRS) places Area Hastings Central 1 2 3 4+ TOTAL 5 5 25 125 3 3 1 7 total 8 8 35 195 7 8 9 1 11 Purchasing intentions
PRESS RELEASE. Securities issued by Hungarian residents and breakdown by holding sectors. April 2016
 10 June 2016 PRESS RELEASE Securities issued by Hungarian residents and breakdown by holding sectors April 2016 According to securities statistics data, the amount outstanding of equity securities and
Foundations of Investing
 www.edwardjones.com Member SIPC Foundations of Investing 1 5 HOW CAN I STAY ON TRACK? 4 HOW DO I GET THERE? 1 WHERE AM I TODAY? MY FINANCIAL NEEDS 3 CAN I GET THERE? 2 WHERE WOULD I LIKE TO BE? 2 Develop
1.2 The purpose of the Finance Committee is to assist the Board in fulfilling its oversight responsibilities related to:
 Category: BOARD PROCESS Title: Terms of Reference for the Finance Committee Reference Number: AB-331 Last Approved: February 22, 2018 Last Reviewed: February 22, 2018 1. PURPOSE 1.1 Primary responsibility
Linear Functions I. Sample file. Activity Collection. Featuring the following real-world contexts: by Frank C.
 Linear Functions I by Frank C. Wilson Activity Collection Featuring the following real-world contexts: Choosing a Cell Phone Plan - T-Mobile Choosing a Cell Phone Plan - Verizon College Graduates Michigan
PHOENIX ENERGY MARKETING CONSULTANTS INC. HISTORICAL NATURAL GAS & CRUDE OIL PRICES UPDATED TO July, 2018
 Jan-01 $12.9112 $10.4754 $9.7870 $1.5032 $29.2595 $275.39 $43.78 $159.32 $25.33 Feb-01 $10.4670 $7.8378 $6.9397 $1.5218 $29.6447 $279.78 $44.48 $165.68 $26.34 Mar-01 $7.6303 $7.3271 $5.0903 $1.5585 $27.2714
Key IRS Interest Rates After PPA
 Key IRS Rates - After PPA - thru 2011 Page 1 of 10 Key IRS Interest Rates After PPA (updated upon release of figures in IRS Notice usually by the end of the first full business week of the month) Below
Common stock prices 1. New York Stock Exchange indexes (Dec. 31,1965=50)2. Transportation. Utility 3. Finance
2. Transportation. Utility 3. Finance") Digitized for FRASER http://fraser.stlouisfed.org/ Federal Reserve Bank of St. Louis 000 97 98 99 I90 9 9 9 9 9 9 97 98 99 970 97 97 ""..".'..'.."... 97 97 97 97 977 978 979 980 98 98 98 98 98 98 987 988
Digitized for FRASER http://fraser.stlouisfed.org/ Federal Reserve Bank of St. Louis 000 97 98 99 I90 9 9 9 9 9 9 97 98 99 970 97 97 ""..".'..'.."... 97 97 97 97 977 978 979 980 98 98 98 98 98 98 987 988
Executive Summary. July 17, 2015
 Executive Summary July 17, 2015 The Revenue Estimating Conference adopted interest rates for use in the state budgeting process. The adopted interest rates take into consideration current benchmark rates
Review of Membership Developments
 RIPE Network Coordination Centre Review of Membership Developments 7 October 2009/ GM / Lisbon http://www.ripe.net 1 Applications development RIPE Network Coordination Centre 140 120 100 80 60 2007 2008
HUD NSP-1 Reporting Apr 2010 Grantee Report - New Mexico State Program
 HUD NSP-1 Reporting Apr 2010 Grantee Report - State Program State Program NSP-1 Grant Amount is $19,600,000 $9,355,381 (47.7%) has been committed $4,010,874 (20.5%) has been expended Grant Number HUD Region
Aon Hewitt. Facts & Figures. December 2014 Update. Risk. Reinsurance. Human Resources. Empower Results
 Aon Hewitt Facts & Figures Risk. Reinsurance. Human Resources. Empower Results In this document... Facts & Figures Contents Financial Markets 3 6 > jump to Earnings and Inflation 7 > jump to Miscellaneous
STAFF REPORT Corporate Services
 1 Corporate Services STAFF REPORT Corporate Services Title: Core Consumer Price Index Update Report Number: CORP2018-071 Author: Kim Reger & Brad Witzel Meeting Type: Finance & Strategic Planning Committee
Voya Indexed Universal Life-Protector
 calculation examples Values as of 07/28/2018 Voya ed Universal Life-Protector Issued by Security Life of Denver Insurance Company Required training! VFA Registered Representatives must review the Required
Performance Report October 2018
 Structured Investments Indicative Report October 2018 This report illustrates the indicative performance of all Structured Investment Strategies from inception to 31 October 2018 Matured Investment Strategies
Simple Interest. S.Y.Tan. 1.1 Simple Interest
 Simple Interest Interest (I) a benefit in the form of a fee that lender received for letting borrower use of his money Origin date (O.D.) the date on which the borrowed money is received by the borrower
HIPIOWA - IOWA COMPREHENSIVE HEALTH ASSOCIATION Unaudited Balance Sheet As of July 31
 Unaudited Balance Sheet As of July 31 Total Enrollment: 407 Assets: Cash $ 9,541,661 $ 1,237,950 Invested Cash 781,689 8,630,624 Premiums Receivable 16,445 299,134 Prepaid 32,930 34,403 Assessments Receivable
HIPIOWA - IOWA COMPREHENSIVE HEALTH ASSOCIATION Unaudited Balance Sheet As of January 31
 Unaudited Balance Sheet As of January 31 Total Enrollment: 371 Assets: Cash $ 1,408,868 $ 1,375,117 Invested Cash 4,664,286 4,136,167 Premiums Receivable 94,152 91,261 Prepaid 32,270 33,421 Assessments
Interest Rates. Countrywide Building Society. Saving Data Sheet. Gross (% per annum)
") Interest Rates Gross (% per annum) Countrywide Building Society This is the rate of simple interest earned in a year (before deducting tax). Dividing by 12 gives a good estimate of the monthly rate of
Interest Rates Gross (% per annum) Countrywide Building Society This is the rate of simple interest earned in a year (before deducting tax). Dividing by 12 gives a good estimate of the monthly rate of
QUESTION 2. QUESTION 3 Which one of the following is most indicative of a flexible short-term financial policy?
 QUESTION 1 Compute the cash cycle based on the following information: Average Collection Period = 47 Accounts Payable Period = 40 Average Age of Inventory = 55 QUESTION 2 Jan 41,700 July 39,182 Feb 18,921
2018 Financial Management Classes
 2018 Financial Management Classes MONEY MANAGEMENT CLASS/BANKING OPERATONS (1ST & 3RD FRIDAY) INVESTING BASICS (2ND FRIDAY) CREDIT MANAGEMENT BLENDED RETIREMENT SYSTEM/THRIFT SAVINGS PLAN (4TH FRIDAY)
Regional overview Auckland
 Regional overview Purchasing intentions - additional income-related rent subsidy (IRRS) places Area North West Central South 1 2 3 4+ TOTAL 8 4 5 125 16 2 9 7 52 25 185 8 3 545 2 28 13 1 71 total 69 75
Futures and Options Live Cattle Feeder Cattle. Tim Petry Livestock Marketing Economist NDSU Extension Service
 Futures and Options Live Cattle Feeder Cattle Tim Petry Livestock Marketing Economist NDSU Extension Service FutOpt-Jan2018 Price Risk Management Tools Cash forward contract Video and internet auctions
SECTION 2: Participant Medical and Emergency Information
 The Gap Year Experience www.gapyearcourse.co.za Course Registration Form SECTION 1: Participant Information Full Name: ID Number: Cell Number: Home Number: Email Address: Residential Address: CODE: Postal
Management Reports. June for PREPARED BY POWERED BY
 Management Reports for June 217 PREPARED BY POWERED BY Contents 1. Management Reports Cashflow Forecast Actual vs Budget P&L Forecast Where Did Our Money Go? Net Worth 2. Understanding your Reports 3.
1 Long Term Debt $ 9,298,554 $ (250,000) $ 9,048, Preferred Stock 30,450 30, % 5 Common Equity 250, %
 $ 9,048, Preferred Stock 30,450 30, % 5 Common Equity 250, %") SUMMARY SCHEDULE ($000'S) Schedule 1 Page 1 of 1 Line Capitalization HISTORICAL YEAR ENDED 12/31/16 Hybrid Percent Equity Adjusted of Total Cost of Cost of Amount Adjustment Amount Capitalization Capital
SUMMARY SCHEDULE ($000'S) Schedule 1 Page 1 of 1 Line Capitalization HISTORICAL YEAR ENDED 12/31/16 Hybrid Percent Equity Adjusted of Total Cost of Cost of Amount Adjustment Amount Capitalization Capital
Section 6621 of the Internal Revenue Code establishes the interest rates on
 Part 1 Section 6621.--Determination of Rate of Interest 26 CFR 301.6621-1: Interest rate. Rev. Rul. -32 Section 6621 of the Internal Revenue Code establishes the interest rates on overpayments and underpayments
Analyze the Market for a Seasonal Bias. It is recommended never to buck the seasonal nature of a market. What is a Seasonal Trend?
 The seasonal trend in a market is our way of taking the fundamental price action of a market...and then chart it year-by-year. Analyze the Market for a Seasonal Bias STEP 5 Using Track n Trade Pro charting
DBS Asia Treasures Membership
 DBS Asia Treasures Membership Frequently Asked Questions 1. How do I join as a DBS Asia Treasures member? The DBS Asia Treasures membership is by invitation only. The membership may be extended to clients
Big Walnut Local School District
 Big Walnut Local School District Monthly Financial Report for the month ended September 30, 2012 Prepared By: Felicia Drummey Treasurer BIG WALNUT LOCAL SCHOOL DISTRICT SUMMARY OF YEAR-TO-DATE FINANCIAL
April 2018 Data Release
 April 2018 Data Release The Home Purchase Sentiment Index (HPSI) is a composite index designed to track consumers housing-related attitudes, intentions, and perceptions, using six questions from the National
Cash & Liquidity The chart below highlights CTA s cash position at July 2016 compared to July 2015.
 To: Chicago Transit Authority Board From: Jeremy Fine, Chief Financial Officer Re: Financial Results for July 2016 Date: September 14, 2016 I. Summary CTA s financial results are $0.4 million favorable
(Internet version) Financial & Statistical Report November 2018
 Financial & Statistical Report November 2018") (Internet version) Financial & Statistical Report November 2018 12/17/2018 Statement of Operations For the Period Ended November 30, 2018 (in millions) Current Month Year-to-Date Operating Revenue $ 31.4
(Internet version) Financial & Statistical Report November 2018 12/17/2018 Statement of Operations For the Period Ended November 30, 2018 (in millions) Current Month Year-to-Date Operating Revenue $ 31.4
Key IRS Interest Rates After PPA
 Key IRS Interest After PPA (updated upon release of figures in IRS Notice usually by the end of the first full business week of the month) Below are Tables I, II, and III showing official interest rates
CPA Australia Plan Your Own Enterprise Competition
 Financial Plan Your financial plan should include: 1. A list of Start-Up Costs and how these will be paid for (eg from savings, bank loan or family loan) 2. A Breakeven Analysis, which includes: a list
Section 6621(c) provides that for purposes of interest payable under 6601 on any large corporate underpayment, the underpayment
 provides that for purposes of interest payable under 6601 on any large corporate underpayment, the underpayment") Section 6621. Determination of Interest Rate 26 CFR 301.6621 1: Interest rate. Interest rates; underpayments and overpayments. The rate of interest determined under section 6621 of the Code for the calendar
Section 6621. Determination of Interest Rate 26 CFR 301.6621 1: Interest rate. Interest rates; underpayments and overpayments. The rate of interest determined under section 6621 of the Code for the calendar
Effective January 1st, 2013, the following promotional payments will be available to appropriate independent distributors:
 Topics Effective January 1st, 2013, the following promotional payments will be available to appropriate independent distributors: At the level of and above 1) Title Incentive 2) Group Awards 3) Rising
REVIEW for Financial Algebra Final Exam - Spring Units 1, 5, 7, 9, 10
 Class: Date: Multiple Choice Identify the choice that best completes the statement or answers the question. 1 (1 point) On July 3, the ABC corporation closed at $43.67. This was a $0.47 increase from the
PASSENGER REJECTION REDUCTION INITIATIVE KIRK PEREIRA. 24 th April 2018
 PASSENGER REJECTION REDUCTION INITIATIVE KIRK PEREIRA 24 th April 2018 WHAT IS THIS PROJECT ABOUT? Well we are not going into that again this year! Nearly everyone in this room knows about the project
11 May Report.xls Office of Budget & Fiscal Planning
 Education and General Fund Actual Revenues and s by Month MTD YTD Change Revenue Jul Aug Sep Oct Nov Dec Jan Feb Mar Apr May Jun Per 14 Total over FY06 Enrollment Fees $ 8,211 $ 219 $ 41,952 ($ 818) $
Cash & Liquidity The chart below highlights CTA s cash position at March 2017 compared to March 2016.
 To: Chicago Transit Authority Board From: Jeremy Fine, Chief Financial Officer Re: Financial Results for March 2017 Date: May 10, 2017 I. Summary CTA s financial results are $0.6 million favorable to budget
BANK OF GUYANA. BANKING SYSTEM STATISTICAL ABSTRACT Website:
 BANK OF GUYANA BANKING SYSTEM STATISTICAL ABSTRACT Website: www.bankofguyana.org.gy RESEARCH DEPARTMENT March 2010 STATISTICAL ABSTRACT TABLES CONTENTS 1. MONETARY AUTHORITY 1.1 Bank of Guyana: Assets
January 2018 Data Release
 January 2018 Data Release The Home Purchase Sentiment Index (HPSI) is a composite index designed to track consumers housing-related attitudes, intentions, and perceptions, using six questions from the
(Internet version) Financial & Statistical Report September 2017
 Financial & Statistical Report September 2017") (Internet version) Financial & Statistical Report September 2017 10/23/2017 Statement of Operations For the Period Ended September 30, 2017 (in millions) Current Month Year-to-Date Operating Revenue &
(Internet version) Financial & Statistical Report September 2017 10/23/2017 Statement of Operations For the Period Ended September 30, 2017 (in millions) Current Month Year-to-Date Operating Revenue &
(Internet version) Financial & Statistical Report December 2017
 Financial & Statistical Report December 2017") (Internet version) Financial & Statistical Report December 2017 01/22/2018 Statement of Operations For the Period Ended December 31, 2017 (in millions) Current Month Year-to-Date Operating Revenue & Patronage
(Internet version) Financial & Statistical Report December 2017 01/22/2018 Statement of Operations For the Period Ended December 31, 2017 (in millions) Current Month Year-to-Date Operating Revenue & Patronage
(Internet version) Financial & Statistical Report December 2016
 Financial & Statistical Report December 2016") (Internet version) Financial & Statistical Report December 2016 1/23/2017 Statement of Operations For the Period Ended December 31, 2016 (in millions) Current Month Year-to-Date Operating Revenue & Patronage
(Internet version) Financial & Statistical Report December 2016 1/23/2017 Statement of Operations For the Period Ended December 31, 2016 (in millions) Current Month Year-to-Date Operating Revenue & Patronage
Consumer Price Index (Base year 2014) Consumer Price Index
 Consumer Price Index") Consumer Price Index December 2016 (Base year 2014) Consumer Price Index 1 Release Date: January 2017 Detailed by: Expenditure groups Household welfare levels Household type Regions Briefing This publication
Consumer Price Index December 2016 (Base year 2014) Consumer Price Index 1 Release Date: January 2017 Detailed by: Expenditure groups Household welfare levels Household type Regions Briefing This publication
Quarterly Statistical Digest
 Quarterly Statistical Digest August Volume 27, No. 3 The Statistical Digest is a quarterly publication of the Central Bank of The Bahamas, prepared by the Research Department for issue in February, May,
Consumer Price Index (Base year 2014) Consumer Price Index
 Consumer Price Index") Consumer Price Index December 2017 (Base year 2014) Consumer Price Index 1 Release Date: January 2018 Detailed by: Expenditure groups Household welfare levels Household type Regions Briefing This publication
Consumer Price Index December 2017 (Base year 2014) Consumer Price Index 1 Release Date: January 2018 Detailed by: Expenditure groups Household welfare levels Household type Regions Briefing This publication
Release date: 12 July 2018
 Release date: 12 July 218 UK Finance: Mortgage Trends Update May 218 Mortgage market sees pre-summer boost as remortgaging continues strong upward trend Key data highlights: There were 32,2 new first-time
October 2018 Data Release
 Mar-11 Apr-11 May-11 Jun-11 Jul-11 Aug-11 Sep-11 Oct-11 Nov-11 Dec-11 Jan-12 Feb-12 Mar-12 Apr-12 May-12 Jun-12 Jul-12 Aug-12 Sep-12 Oct-12 Nov-12 Dec-12 Jan-13 Feb-13 Mar-13 Apr-13 May-13 Jun-13 Jul-13
January 2019 Data Release
 Mar-11 Apr-11 May-11 Jun-11 Jul-11 Aug-11 Sep-11 Oct-11 Nov-11 Dec-11 Jan-12 Feb-12 Mar-12 Apr-12 May-12 Jun-12 Jul-12 Aug-12 Sep-12 Oct-12 Nov-12 Dec-12 Jan-13 Feb-13 Mar-13 Apr-13 May-13 Jun-13 Jul-13
Employment Data (establishment)
") Table 1: Major Indicators of Labor Market Activity for New Jersey Seasonally Adjusted (thousands) Benchmark Labor Force Data (resident) Current Month Previous Month One Year Ago Net Change Net Change May
Table 1: Major Indicators of Labor Market Activity for New Jersey Seasonally Adjusted (thousands) Benchmark Labor Force Data (resident) Current Month Previous Month One Year Ago Net Change Net Change May
June 2018 Data Release
 Mar-11 Apr-11 May-11 Jun-11 Jul-11 Aug-11 Sep-11 Oct-11 Nov-11 Dec-11 Jan-12 Feb-12 Mar-12 Apr-12 May-12 Jun-12 Jul-12 Aug-12 Sep-12 Oct-12 Nov-12 Dec-12 Jan-13 Feb-13 Mar-13 Apr-13 May-13 Jun-13 Jul-13
QUARTERLY REPORT AND CERTIFICATION OF THE COUNTY TREASURER For Quarter Ending June 30, 2009 COMPLIANCE CERTIFICATION
 QUARTERLY REPORT AND CERTIFICATION OF THE COUNTY TREASURER For Quarter Ending June 30, 2009 The Government Code requires the County Treasurer to render a Quarterly Report to the County Administrator, the
Firm Frequency Response Market Information for Apr-16
 Firm Frequency Response Market Information for Apr-16 FFR Market Information 211 Monthly Report Published Feb-16 Key points This Market Information Report is relevant for tenders submitted in Mar- 16 for
Savings Index maintains momentum in January
 Media Release Tuesday 10 th February 2015 Savings Index maintains momentum in January The Nationwide UK (Ireland) / ESRI Savings Index, which measures overall sentiment towards saving in Ireland, increased
Dashboards Tools May 14 & 15, 2013 NonProfit Learning Center Discussion Leader: Kay Sohl
 Dashboards Tools May 14 & 15, 2013 NonProfit Learning Center Discussion Leader: Kay Sohl Dashboards Concise graphic presentations of key indicators Provide useful comparisons to visualize progress over
Board of Directors October 2018 and YTD Financial Report
 Board of Directors October 2018 and YTD Financial Report Consolidated Financial Results Operating Margin October ($30,262) $129,301 ($159,563) Year-to-date $292,283 $931,358 ($639,076) Excess of Revenue
Exhibit Nutrition
 Exhibit 1 Summary of Valuation Conclusion Controlling and Marketable Basis of (1,000's): Method Value Weight Total Earnings Capitalization Method $72,800 50.0% $36,400 Private Company Transaction Method
TERMS OF REFERENCE FOR THE FINANCE AND AUDIT COMMITTEE
 I. PURPOSE A. The primary function of the Finance and Audit Committee (the Committee ) is to assist the Board in fulfilling its oversight responsibilities by reviewing: i) the accuracy of financial information
City of Justin NOVEMBER
 City of Justin MONTHLY FINANCIAL REPORT NOVEMBER - 2018 1 Revenues: Sales tax revenue is up 14.5% from this time prior year and November s sales tax collections increased 2.4% from November 2017. The City
FOR RELEASE: MONDAY, MARCH 21 AT 4 PM
 Interviews with 1,012 adult Americans conducted by telephone by Opinion Research Corporation on March 18-20, 2011. The margin of sampling error for results based on the total sample is plus or minus 3
Consumer Price Index (Base year 2014) Consumer Price Index
 Consumer Price Index") Consumer Price Index July 207 (Base year 204) Consumer Price Index Release Date: Augest 207 Detailed by: Expenditure groups Household welfare levels Household type Regions Briefing This publication provides
Consumer Price Index July 207 (Base year 204) Consumer Price Index Release Date: Augest 207 Detailed by: Expenditure groups Household welfare levels Household type Regions Briefing This publication provides
Operating Budget Stability
 Operating Budget Stability March Financial Update Report to Agenda Executive Summary March Performance Against FY16 Budget March Performance Against Same Period Last Year Appendix Financial Detail: March
Budget Manager Meeting. February 20, 2018
 Budget Manager Meeting February 20, 2018 Meeting Agenda DISCUSSION DRAFT NOT FOR DISTRIBUTION Budget Office Current Year Forecast Process Endowment Payout Control Charts FY19 Target Meetings Delphi Project
Department of Public Welfare (DPW)
") Department of Public Welfare (DPW) Office of Income Maintenance Electronic Benefits Transfer Card Risk Management Report Out-of-State Residency Review FISCAL YEAR 2014-2015 September 2014 (June, July and
Department of Public Welfare (DPW) Office of Income Maintenance Electronic Benefits Transfer Card Risk Management Report Out-of-State Residency Review FISCAL YEAR 2014-2015 September 2014 (June, July and
Daily Outcomes: I can evaluate, analyze, and graph exponential functions. Why might plotting the data on a graph be helpful in analyzing the data?
 3 1 Exponential Functions Daily Outcomes: I can evaluate, analyze, and graph exponential functions Would the increase in water usage mirror the increase in population? Explain. Why might plotting the data
Table 1: Major Indicators of Labor Market Activity for New Jersey Seasonally Adjusted 2016 Benchmark Labor Force Data (resident)
") Table 1: Major Indicators of Labor Market Activity for New Jersey Seasonally Adjusted Benchmark Labor Force Data (resident) Current Month Previous Month One Year Ago Net Change Net Change Dec. 17 (P) Nov.
Table 1: Major Indicators of Labor Market Activity for New Jersey Seasonally Adjusted Benchmark Labor Force Data (resident) Current Month Previous Month One Year Ago Net Change Net Change Dec. 17 (P) Nov.