Great Western Bancorp, Inc. Announces Fiscal Year 2015 Second Quarter Financial Results
|
|
|
- Albert Carter
- 5 years ago
- Views:
Transcription
1 Great Western Bancorp, Inc. Announces Fiscal Year 2015 Second Quarter Financial Results Financial Highlights Second quarter net income was $19.7 million, or $0.34 per share, bringing fiscal year-to-date net income to $46.4 million, or $0.80 per share Continuing noninterest expense management contributed to an efficiency ratio 1 of 51.7% for the quarter Total loans grew $85.7 million during the quarter and are up $285.0 million, or 4.2%, compared to September 30, Deposit growth of $248.5 million during the quarter fully funded expansion of the loan portfolio and allowed for seasonal paydown of FHLB borrowings Sioux Falls, SD - April 28, Great Western Bancorp, Inc. (NYSE: GWB) today reported net income of $19.7 million, or $0.34 per share, for the quarter ended 2015, compared to net income of $26.0 million, or $0.45 per share, for the same quarter of fiscal year. As previously disclosed, higher total credit-related charges of approximately $14 million incurred during the quarter drove lower net income. Provision for loan losses was $9.7 million in the current quarter compared to $(2.7) million (i.e., release of provision for loan losses) in the second quarter of fiscal year, a pre-tax increase of $12.4 million. Increased net interest income and lower noninterest expense partially offset the increase in credit-related charges. Fiscal year-to-date net income was $46.4 million, or $0.80 per share, compared to $54.6 million, or $0.94 per share, for the same period of fiscal year. "Great Western Bank delivered a number of positive outcomes during the quarter. We are pleased with the balance sheet growth we attained during the quarter and continue to be very proud of our strong efficiency ratio and commitment to expense management," said Ken Karels, President and Chief Executive Officer. "We were proactive in addressing the higher creditrelated charges incurred during the quarter and, while we are disappointed in the magnitude of the impact, we remain focused on risk management and believe these charges are isolated in nature and not indicative of a more systemic issue." Net Interest Income and Net Interest Margin 2 Net interest income increased $4.1 million, or 5%, from $78.1 million for the second quarter of fiscal year to $82.2 million for the second quarter of fiscal year Higher interest income on loans, driven by strong year-over-year growth, and lower deposit interest expense drove the increase, which was partially offset by lower interest income from the investment portfolio caused primarily by lower asset yields and a smaller portfolio size. Net interest margin was 3.89%, 3.91% and 3.96%, respectively, for the quarters ended 2015, December 31,, and and 3.90% and 3.99%, respectively, for the six months ended 2015 and. Adjusted net interest margin 1, which adjusts for the realized gain (loss) on interest rate swaps, was 3.64%, 3.67% and 3.73%, respectively, and 3.66% and 3.77%, respectively, for the same periods. Net interest margin and adjusted net interest margin 1 declined compared to the second quarter of fiscal year primarily due to reduced asset yields and a higher average cash balance. Pricing on new loans continued to be impacted by competitive pressures in the market and the continued near-zero benchmark interest rate environment, while investment portfolio yields have also declined. These reductions in asset yields were partially offset by a 4 basis point reduction in the cost of deposits over the same period, driven in part by a continued favorable change in deposit mix. Loan growth for the quarter ended 2015 was $85.7 million, bringing fiscal year-to-date growth to $285.0 million, an increase of 4.2% compared to September 30,. Year-to-date growth remains balanced across the business and agriculture lending components of the portfolio including commercial non-real estate, commercial real estate and agriculture. Consistent with management's expectations at the end of the first fiscal quarter, the agriculture portfolio did contract slightly during the quarter as a result of clients' calendar year-end tax planning. 1 This is a non-gaap measure management believes is helpful to understanding trends in the business that may not be fully apparent based only on the most comparable GAAP measure. Further information on this measure and a reconciliation to the most comparable GAAP measure is provided at the end of this document. 2 All references to net interest income and net interest margin are presented on a fully-tax equivalent basis unless otherwise noted.
2 Deposits grew by $248.5 million during the quarter and by $435.5 million, or 6.2%, compared to September 30,. Deposit growth is typically most robust in the first and second fiscal quarters and some seasonal contraction is expected in the third fiscal quarter. The average cost of deposits for the quarter was 0.33%, down 4 basis points compared to the same quarter in fiscal year, driven in part by continuing change in deposit mix. Provision for Loan Losses and Asset Quality Provision for loan losses was $9.7 million for the quarter ended 2015, compared to $(2.7) million (i.e., release of provision for loan losses) in the same quarter of fiscal year. As previously disclosed on March 9, 2015, the provision recorded during the quarter was mainly driven by a small number of Commercial & Industrial lending exposures that deteriorated during the quarter. The credits are not concentrated by industry or geography. Management believes the higher charges are driven by customer-specific developments and are not indicative of credit concerns across the portfolio. Net chargeoffs for the quarter were $9.1 million, or 0.52% of total loans on an annualized basis, bringing fiscal year-to-date net chargeoffs to $8.1 million, or 0.23% of total loans on an annualized basis. For the comparable periods in fiscal year, net chargeoffs were $6.2 million, or 0.39% of total loans on an annualized basis, and $5.1 million, or 0.16% of loans on an annualized basis, respectively. The ratio of allowance for loan losses to total loans increased from 0.70% at September 30, to 0.74% at At 2015, nonperforming loans were $74.3 million, with $27.8 million of the balance covered by FDIC loss-sharing arrangements. Total nonperforming loans represent a 6% decrease compared to September 30, and a 9% increase compared to December 31,. OREO balances have declined by $6.0 million since September 30,, with $8.6 million of the $43.6 million of total OREO as of 2015 covered by FDIC loss-sharing arrangements. Loans on "Watch" status were $384.4 million as of 2015, an increase of 34% compared to September 30,. Some of the increase reflected ongoing proactive management of credit exposures and some of the increase resulted from a broad-based review of the loan portfolio performed in conjunction with the announcement of elevated credit-related charges on March 9. Management does not anticipate a significant negative trend in future charge-offs as a result of the increase in "Watch" loans. A summary of total credit-related charges incurred during the current, prior and comparable quarters is presented below: GREAT WESTERN BANCORP, INC. Summary of Credit-Related Charges (Unaudited) (Dollars in thousands) For the three months ended: Item Included within F/S Line Item(s): 2015 December 31, Provision for loan losses Provision for loan losses $ 9,679 $ 3,319 $ (2,690) Net OREO charges 1) Net (gain) loss from sale of repossessed property and other assets 2) Other noninterest expense 2,634 1,846 1,219 Reversal of interest income on nonaccrual loans Interest income on loans 517 (162) 6 Loan fair value adjustment related to credit Net increase (decrease) in fair value of loans at fair value 1,184 2,223 (683) Total $ 14,014 $ 7,226 $ (2,148) Noninterest Income Noninterest income was $6.9 million for the quarter ended 2015, a decrease of $3.2 million, or 32%, compared to the second quarter of fiscal year. Included within noninterest income are the changes in fair value of certain loans for which the Company has elected the fair value option and the net gain (loss), realized and unrealized, of the related derivatives used to manage the interest rate risk on these loans. On a net basis, these two components of noninterest income accounted for $2.8 million, or 87%, of the period-over-period decrease, driven primarily by fair value adjustments related to credit outlined above. Aside from the increased net charges related to loans at fair value and the related derivatives, noninterest income declined 3% compared to the second quarter of fiscal year. Service charges and other fees and other noninterest income each decreased by $0.5 million, while net gain on sale of mortgage loans increased by $0.6 million based on higher volumes in that line of business.
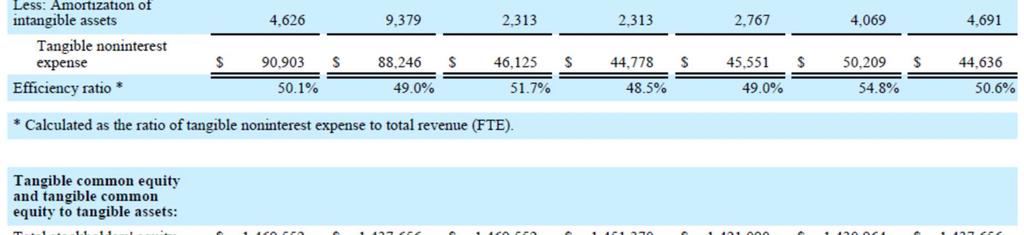
3 Noninterest Expense Total noninterest expense was $48.4 million for the quarter ended 2015, a decrease of 2% or $0.9 million compared to the same quarter in fiscal year. The decrease in noninterest expense was driven in large part by a $2.4 million decrease in amortization of intangible assets and a reduction in net occupancy expenses as a result of branch closures completed in prior fiscal periods. These decreases were partially offset by higher salaries and employee benefits, driven largely by favorable nonrecurring events in the comparable period, higher professional fees, primarily attributable to the higher cost of operating as a public company, and a $1.4 million increase in net OREO expenses. The efficiency ratio 1 was 51.7% for the quarter, compared to 50.6% for the same quarter of fiscal year, and was a very positive 50.1% through the first six months of fiscal year Capital Tier 1 and total capital ratios were 11.5% and 12.6%, respectively, as of 2015, compared to 11.8% and 12.9%, respectively, as of September 30,. The common equity tier 1 capital ratio was 10.7% as of The decreases were driven by the adoption of Basel III capital conventions on January 1, 2015, applicable to all banks, which increased risk weighted assets by approximately $270 million mainly as a result of new requirements related to unused lines of credit and, to a lesser extent, high-volatility commercial real estate. The risk weighted asset increases related to Basel III adoption were partially offset by increased retained earnings driven by two quarters' of net income net of the first quarter fiscal year 2015 dividend paid in February This morning, the Company s board of directors declared a dividend of $0.12 per common share payable on May 29, 2015 to owners of record as of close of business on May 15, The aggregate dividend payment will be $6.9 million. Business Outlook "We continue to be optimistic about our loan and deposit pipelines, though we do expect some seasonal deposit outflow in the coming quarter," added Karels. "We will begin to realize cost savings related to the branches we closed at the end of March and are very excited about a number of key hires of very talented individuals that we have made recently, which we believe will help GWB continue to deliver strong growth and profitability on the front line and allow us to meet our more stringent reporting and compliance requirements as a public company." Conference Call Great Western Bancorp, Inc. will host a conference call to discuss its financial results for the second quarter of fiscal year 2015 on Tuesday, April 28, 2015 at 7:30 AM (CT). The call can be accessed by dialing (855) approximately 10 minutes prior to the start time. Please ask to be joined into the Great Western Bancorp, Inc. (GWB) call. International callers should dial (412) The call will also be broadcast live over the Internet and can be accessed in the Investor Relations section of Great Western s website at A replay will be available beginning one hour following the conference call and ending on May 13, To access the replay, dial (877) (U.S.) and use conference ID # International callers should dial (412) and enter the same conference ID number. About Great Western Bancorp, Inc. Great Western Bancorp, Inc. is the holding company for Great Western Bank, a full-service regional bank focused on relationship-based business and agribusiness banking. Great Western Bank offers small and mid-sized businesses a focused suite of financial products and a range of deposit and loan products to retail customers through several channels, including the branch network, online banking system, mobile banking applications and customer care centers. The bank services its customers through 158 branches in seven states: South Dakota, Iowa, Nebraska, Colorado, Arizona, Kansas and Missouri. To learn more about Great Western Bank visit Forward-Looking Statements This press release contains forward-looking statements within the meaning of the Private Securities Litigation Reform Act of Statements about Great Western Bancorp, Inc. s expectations, beliefs, plans, predictions, forecasts, objectives, assumptions or future events or performance are not historical facts and may be forward-looking. These statements are often, but not always, made through the use of words or phrases such as anticipates, believes, can, could, may, predicts, potential, should, will, estimate, plans, projects, continuing, ongoing, expects, intends and similar words or phrases. In particular, the statements included in this press release concerning Great Western Bancorp, Inc. s expected performance and strategy, and the interest rate environment, in fiscal year 2015 are not historical facts and are forward-looking. Accordingly, the forward-looking statements in this press release are only predictions and involve estimates, known and
4 unknown risks, assumptions and uncertainties that could cause actual results to differ materially from those expressed. All forward-looking statements are necessarily only estimates of future results, and there can be no assurance that actual results will not differ materially from expectations, and, therefore, you are cautioned not to place undue reliance on such statements. Any forward-looking statements are qualified in their entirety by reference to the factors discussed in the sections titled Item 1A. Risk Factors and "Cautionary Note Regarding Forward-Looking Statements" in Great Western Bancorp, Inc. s Annual Report on Form 10-K for the fiscal year ended September 30, and Quarterly Report on Form 10-Q for the period ended December 31,. Further, any forward-looking statement speaks only as of the date on which it is made, and Great Western undertakes no obligation to update any forward-looking statement to reflect events or circumstances after the date on which the statement is made or to reflect the occurrence of unanticipated events.
5 GREAT WESTERN BANCORP, INC. Consolidated Financial Data (Unaudited) (Dollars in thousands except per share amounts) Operating Data: At or for the six months ended December 31, At or for the three months ended September 30, June 30, Interest and dividend income (FTE) $ 181,876 $ 175,796 $ 89,794 $ 92,082 $ 92,265 $ 89,078 $ 85,993 Interest expense 15,248 16,559 7,579 7,669 7,715 7,778 7,929 Noninterest income 14,836 20,966 6,936 7,900 8,501 10,314 10,140 Noninterest expense 95,529 97,626 48,438 47,091 48,318 54,278 49,327 Provision for loan losses 12,998 (3,565) 9,679 3,319 2,749 1,500 (2,690) Net income 46,421 54,575 19,724 26,697 27,875 22,502 25,971 Earnings per common share 2 $ 0.80 $ 0.94 $ 0.34 $ 0.46 $ 0.48 $ 0.39 $ 0.45 Performance Ratios: Net interest margin (FTE) % 3.99% 3.89% 3.91 % 4.10% 4.03% 3.96% Adjusted net interest margin (FTE) % 3.77% 3.64% 3.67 % 3.86% 3.80% 3.73% Return on average total assets % 1.19% 0.83% 1.10 % 1.19% 0.98% 1.15% Return on average common equity % 7.70% 5.49% 7.39 % 7.69% 6.25% 7.41% Return on average tangible common equity % 17.9% 11.8% 15.8 % 16.3% 14.2% 17.3% Efficiency ratio % 49.0% 51.7% 48.5 % 49.0% 54.8% 50.6% Capital: Tier 1 capital ratio 11.5% 12.4% 11.5% 11.8 % 11.8% 12.1% 12.4% Total capital ratio 12.6% 13.6% 12.6% 12.9 % 12.9% 13.1% 13.6% Tier 1 leverage ratio 9.3% 9.4% 9.3% 9.1 % 9.1% 9.3% 9.4% Common equity tier 1 ratio 10.7% * 10.7% * * * * Tangible common equity / tangible assets 1 8.4% 8.4% 8.4% 8.3 % 8.2% 8.3% 8.4% Asset Quality: Nonperforming loans $ 74,332 $ 91,567 $ 74,332 $ 68,454 $ 78,905 $ 80,838 $ 91,567 OREO $ 43,565 $ 77,223 $ 43,565 $ 43,442 $ 49,580 $ 54,190 $ 77,223 Nonperforming loans / total loans 1.05% 1.40% 1.05% 0.98 % 1.16% 1.21% 1.40% Net charge-offs (recoveries) $ 8,090 $ 5,146 $ 9,073 $ (983) $ 2,269 $ 1,615 $ 6,226 Net charge-offs (recoveries) / average total loans % 0.16% 0.52% (0.06)% 0.13% 0.10% 0.39% Allowance for loan losses / total loans 0.74% 0.72% 0.74% 0.74 % 0.70% 0.70% 0.72% Watch-rated loans $ 384,448 $ 209,134 $ 384,448 $ 275,473 $ 287,723 $ 266,416 $ 209,134 1 This is a non-gaap financial measure management believes is helpful to interpreting our financial results. See the tables at the end of this document for the calculation of the measure and reconciliation to the most comparable GAAP measure. 2 Share dilution calculated for the quarter and fiscal year-to-date periods was minimal and, as such, diluted EPS equals EPS for all periods presented. 3 Annualized for all partial-year periods. * Not applicable for period presented.
6 GREAT WESTERN BANCORP, INC. Consolidated Income Statement (Unaudited) (Dollars in thousands) Interest and dividend income For the six months ended December 31, For the three months ended September 30, June 30, Loans $ 166,738 $ 159,336 $ 82,394 $ 84,344 $ 84,477 $ 80,797 $ 77,933 Taxable securities 11,066 13,592 5,379 5,687 6,173 6,598 6,623 Nontaxable securities Dividends on securities Federal funds sold and other Total interest and dividend income 178, ,657 88,204 90,578 90,941 87,878 84,886 Interest expense Deposits 11,999 13,310 5,984 6,015 6,135 6,319 6,431 Securities sold under agreements to repurchase FHLB advances and other borrowings 1,839 1, Related party notes payable Subordinated debentures and other Total interest expense 15,248 16,559 7,579 7,669 7,715 7,778 7,929 Net interest income 163, ,098 80,625 82,909 83,226 80,100 76,957 Provision for loan losses 12,998 (3,565) 9,679 3,319 2,749 1,500 (2,690) Net interest income after provision for loan losses 150, ,663 70,946 79,590 80,477 78,600 79,647 Noninterest income Service charges and other fees 19,269 20,033 8,871 10,398 10,476 9,695 9,371 Net gain on sale of loans 3,124 2,563 1,580 1,544 1,654 1, Casualty insurance commissions Investment center income 1,227 1, Net gain on sale of securities Trust department income 2,006 1, , ,000 Net increase (decrease) in fair value of loans at fair value 32,308 (380) 15,208 17,100 (1,602) 13,886 8,730 Net realized and unrealized gain (loss) on derivatives (46,303) (7,599) (21,698) (24,605) (4,781) (17,797) (12,436) Other 2,605 2,702 1,150 1, ,368 1,635 Total noninterest income 14,836 20,966 6,936 7,900 8,501 10,314 10,140 Noninterest expense Salaries and employee benefits 48,761 47,050 24,673 24,088 23,929 24,126 23,029 Occupancy expenses, net 8,008 8,719 3,984 4,024 3,913 4,894 4,486 Data processing 9,536 9,751 4,708 4,828 5,443 4,354 4,723 Equipment expenses 1,881 2, ,251 1, Advertising 1,674 2, ,361 1,213 1,088 Communication expenses 2,398 2,356 1,225 1,173 1,108 1,046 1,242 Professional fees 7,175 6,003 3,603 3,572 2,610 3,620 3,105 Net (gain) loss from sale of repossessed property and other assets (384) (849) (16) (368) (38) (1,564) (278) Amortization of core deposits and other intangibles 4,626 9,379 2,313 2,313 2,767 4,069 4,691 Other 11,854 11,023 6,077 5,777 5,974 11,443 6,246 Total noninterest expense 95,529 97,626 48,438 47,091 48,318 54,278 49,327 Income before income taxes 69,843 84,003 29,444 40,399 40,660 34,636 40,460 Provision for income taxes 23,422 29,428 9,720 13,702 12,785 12,134 14,489 Net income $ 46,421 $ 54,575 $ 19,724 $ 26,697 $ 27,875 $ 22,502 $ 25,971
7 GREAT WESTERN BANCORP, INC. Summarized Consolidated Balance Sheet (Unaudited) (Dollars in thousands) Assets 2015 December 31, As of September 30, June 30, Cash and due from banks $ 358,440 $ 428,186 $ 256,639 $ 235,077 $ 423,148 Securities 1,402,508 1,263,983 1,341,242 1,395,768 1,316,338 Total loans 7,072,465 6,986,765 6,787,467 6,678,501 6,531,763 Allowance for loan losses (52,426) (51,820) (47,518) (47,038) (47,153) Loans, net 7,020,039 6,934,945 6,739,949 6,631,463 6,484,610 Goodwill and other intangible assets 707, , , , ,872 Other assets 293, , , , ,912 Total assets $ 9,781,645 $ 9,641,261 $ 9,371,429 $ 9,292,283 $ 9,274,880 Liabilities and stockholders' equity Noninterest-bearing deposits $ 1,374,589 $ 1,381,887 $ 1,303,015 $ 1,294,131 $ 1,268,925 Interest-bearing deposits 6,113,109 5,857,319 5,749,165 5,772,981 5,983,759 Total deposits 7,487,698 7,239,206 7,052,180 7,067,112 7,252,684 Securities sold under agreements to repurchase 163, , , , ,793 FHLB advances and other borrowings 475, , , , ,100 Other liabilities 186, , , , ,647 Total liabilities 8,312,093 8,189,891 7,950,339 7,861,319 7,837,224 Stockholders' equity 1,469,552 1,451,370 1,421,090 1,430,964 1,437,656 Total liabilities and stockholders' equity $ 9,781,645 $ 9,641,261 $ 9,371,429 $ 9,292,283 $ 9,274,880 GREAT WESTERN BANCORP, INC. Loan Portfolio Summary (Unaudited) (Dollars in thousands) 2015 September 30, Commercial non-real estate $ 1,657,856 $ 1,571,640 $ 86, % Agriculture 1,748,366 1,681,209 67, % Construction and development 310, ,000 (3,989) (1.3)% Owner-occupied CRE 1,110,074 1,151,868 (41,794) (3.6)% Non-owner-occupied CRE 1,011, ,395 88, % Multifamily residential real estate 241, ,931 88, % Commercial real estate 2,673,255 2,541, , % Residential real estate 905, ,605 3, % Consumer 80,036 90,086 (10,050) (11.2)% Other 1 35,433 34,243 1, % Total unpaid principal balance 7,100,060 6,819, , % Less: Unamortized discount on acquired loans and unearned net deferred fees and costs and loans in process (27,595 ) (32,510) 4,915 (15.1)% Total loans $ 7,072,465 $ 6,787,467 $ 284, % 1 Other loans primarily include consumer and commercial credit cards and customer deposit account overdrafts. As of Change ($) Change (%)
8 GREAT WESTERN BANCORP, INC. Net Interest Margin (FTE) (Unaudited) (Dollars in thousands) Assets Average Balance For the three months ended 2015 December 31, Interest (FTE) Yield / 1 Cost 2 Average Balance Interest (FTE) Yield / 1 Cost 2 Average Balance Interest (FTE) Yield / 1 Cost 2 Cash and due from banks $ 265,929 $ % $ 442,902 $ % $ 191,031 $ % Investment securities 1,334,460 5, % 1,336,235 5, % 1,381,475 6, % Loans, other than loans acquired with deteriorated credit quality, net 6,828,510 81, % 6,626,507 82, % 6,224,179 78, % Loans acquired with deteriorated credit quality, net 131,578 2, % 151,044 2, % 204, % Loans, net 6,960,088 83, % 6,777,551 85, % 6,428,607 79, % Total interest-earning assets 8,560,477 89, % 8,556,688 92, % 8,001,113 85, % Noninterest-earning assets 1,090,176 1,109,386 1,155,039 Total assets $ 9,650,653 $ 89, % $ 9,666,074 $ 92, % $ 9,156,152 $ 85, % Liabilities and Stockholders' Equity Noninterest-bearing deposits $ 1,282,530 $ 1,492,262 $ 1,216,315 NOW, MMDA and savings deposits 4,447,606 $ 3, % 4,149,871 $ 2, % 3,978,103 $ 2, % CDs 1,567,763 2, % 1,683,865 3, % 1,940,266 4, % Total deposits 7,297,899 5, % 7,325,998 6, % 7,134,684 6, % Securities sold under agreements to repurchase 182, % 167, % 192, % FHLB advances and other borrowings 528, % 566, % 259, % Related party notes payable 41, % 41, % 41, % Subordinated debentures and other 56, % 56, % 56, % Total borrowings 808,335 1, % 831,699 1, % 548,767 1, % Total interest-bearing liabilities 8,106,234 $ 7, % 8,157,697 $ 7, % 7,683,451 $ 7, % Noninterest-bearing liabilities 86,288 74,540 51,768 Stockholders' equity 1,458,131 1,433,837 1,420,933 Total liabilities and stockholders' equity $ 9,650,653 $ 9,666,074 $ 9,156,152 Net interest spread 3.39% 3.41 % 3.39% Net interest income and net interest margin (FTE) 1 $ 82, % $ 84, % $ 78, % Less: Tax equivalent adjustment 1,590 1,504 1,107 Net interest income and net interest margin - ties to Statements of Comprehensive Income $ 80, % $ 82, % $ 76, % 1 These are non-gaap financial measures management believes are helpful to interpreting our financial results. See the tables at the end of this document for the calculation of the measures and reconciliation to the most comparable GAAP measure. 2 Annualized for all partial-year periods.
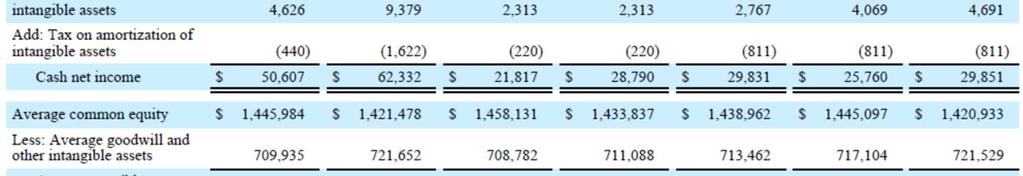
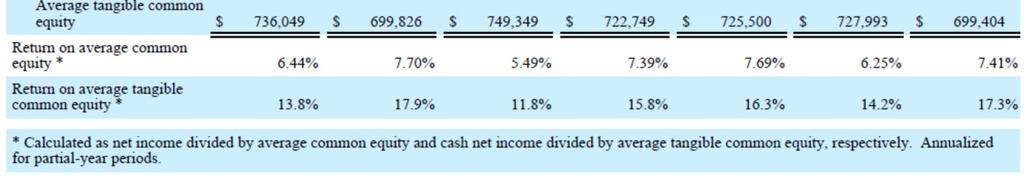
9 GREAT WESTERN BANCORP, INC. Net Interest Margin (FTE) (Unaudited) (Dollars in thousands) Assets Average Balance For the six months ended 2015 Interest (FTE) Yield / 1 Cost 2 Average Balance Interest (FTE) Yield / 1 Cost 2 Cash and due from banks $ 354,415 $ % $ 195,307 $ % Investment securities 1,335,348 11, % 1,428,379 14, % Loans, other than loans acquired with deteriorated credit quality, net 6,727, , % 6,186, , % Loans acquired with deteriorated credit quality, net 141,311 5, % 202,235 2, % Loans, net 6,868, , % 6,388, , % Total interest-earning assets 8,558, , % 8,012, , % Noninterest-earning assets 1,097,254 1,189,536 Total assets $ 9,655,836 $ 181, % $ 9,202,078 $ 175, % Liabilities and Stockholders' Equity Noninterest-bearing deposits $ 1,387,396 $ 1,226,039 NOW, MMDA and savings deposits 4,298,739 $ 5, % 3,934,543 $ 4, % CDs 1,625,814 6, % 1,956,472 8, % Total deposits 7,311,949 11, % 7,117,054 13, % Securities sold under agreements to repurchase 175, % 198, % FHLB advances and other borrowings 547,528 1, % 311,273 1, % Related party notes payable 41, % 41, % Subordinated debentures and other 56, % 56, % Total borrowings 820,017 3, % 606,858 3, % Total interest-bearing liabilities 8,131,966 $ 15, % 7,723,912 $ 16, % Noninterest-bearing liabilities 77,886 56,688 Stockholders' equity 1,445,984 1,421,478 Total liabilities and stockholders' equity $ 9,655,836 $ 9,202,078 Net interest spread 3.40 % 3.40% Net interest income and net interest margin (FTE) 1 $ 166, % $ 159, % Less: Tax equivalent adjustment 3,094 2,139 Net interest income and net interest margin - ties to Statements of Comprehensive Income $ 163, % $ 157, % 1 These are non-gaap financial measures management believes are helpful to interpreting our financial results. See the tables at the end of this document for the calculation of the measures and reconciliation to the most comparable GAAP measure. 2 Annualized for all partial-year periods. Non-GAAP Measures and Reconciliation We rely on certain non-gaap measures in making financial and operational decisions about our business. We believe that each of the non-gaap measures presented is helpful in highlighting trends in our business, financial condition and results of operations which might not otherwise be apparent when relying solely on our financial results calculated in accordance with U.S. generally accepted accounting principles, or GAAP. In particular, we evaluate our profitability and performance based on our cash net income and return on average tangible common equity, each of which excludes the effects of amortization expense relating to intangible assets and related tax effects from the acquisition of us by National Australia Bank Limited and our acquisitions of other institutions. We believe these measures help highlight trends associated with our financial condition and results of operations by providing net income and return information based on our cash payments and receipts during the applicable period.
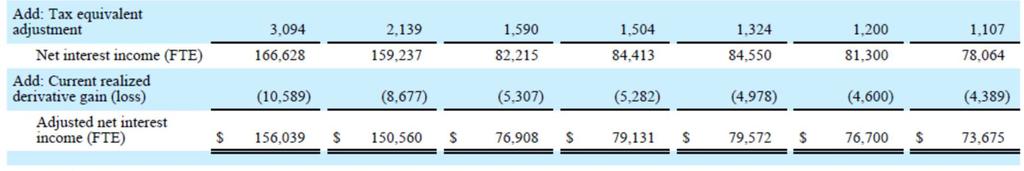
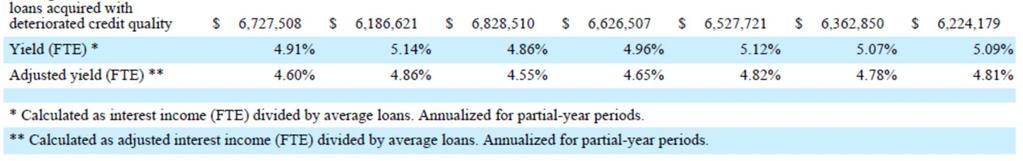
10 We also evaluate our profitability and performance based on our adjusted net interest income, adjusted net interest margin, adjusted interest income on loans other than loans acquired with deteriorated credit quality and adjusted yield on loans other than loans acquired with deteriorated credit quality. We adjust each of these four measures to include the current realized gain (loss) of derivatives we use to manage interest rate risk on certain of our loans, which we believe economically offsets the interest income earned on the loans. Similarly, we evaluate our operational efficiency based on our efficiency ratio, which excludes the effect of amortization of core deposit and other intangibles (a non-cash expense item) and includes the tax benefit associated with our tax-advantaged loans. We evaluate our financial condition based on the ratio of our tangible common equity to our tangible assets. Our calculation of this ratio excludes the effect of our goodwill and other intangible assets. We believe this measure is helpful in highlighting the common equity component of our capital and because of its focus by federal bank regulators when reviewing the health and strength of financial institutions in recent years and when considering regulatory approvals for certain actions, including capital actions. Reconciliations for each of these non-gaap financial measures to the closest GAAP financial measures are included in the tables below. Each of the non-gaap measures presented should be considered in context with our GAAP financial results included in this release. GREAT WESTERN BANCORP, INC. Reconciliation of Non-GAAP Measures (Unaudited) (Dollars in thousands) Cash net income and return on average tangible common equity: At or for the six months ended December 31, At or for the three months ended September 30, June 30, Net income $ 46,421 $ 54,575 $ 19,724 $ 26,697 $ 27,875 $ 22,502 $ 25,971 Add: Amortization of intangible assets 4,626 9,379 2,313 2,313 2,767 4,069 4,691 Add: Tax on amortization of intangible assets (440) (1,622) (220) (220) (811) (811) (811) Cash net income $ 50,607 $ 62,332 $ 21,817 $ 28,790 $ 29,831 $ 25,760 $ 29,851 Average common equity $ 1,445,984 $ 1,421,478 $ 1,458,131 $ 1,433,837 $ 1,438,962 $ 1,445,097 $ 1,420,933 Less: Average goodwill and other intangible assets 709, , , , , , ,529 Average tangible common equity $ 736,049 $ 699,826 $ 749,349 $ 722,749 $ 725,500 $ 727,993 $ 699,404 Return on average common equity * 6.44% 7.70% 5.49 % 7.39% 7.69% 6.25 % 7.41% Return on average tangible common equity * 13.8% 17.9% 11.8 % 15.8% 16.3% 14.2 % 17.3% * Calculated as net income divided by average common equity and cash net income divided by average tangible common equity, respectively. Annualized for partial-year periods. Adjusted net interest income and adjusted net interest margin (fully-tax equivalent basis): Net interest income $ 163,534 $ 157,098 $ 80,625 $ 82,909 $ 83,226 $ 80,100 $ 76,957 Add: Tax equivalent adjustment 3,094 2,139 1,590 1,504 1,324 1,200 1,107 Net interest income (FTE) 166, ,237 82,215 84,413 84,550 81,300 78,064 Add: Current realized derivative gain (loss) (10,589) (8,677) (5,307) (5,282) (4,978) (4,600) (4,389) Adjusted net interest income (FTE) $ 156,039 $ 150,560 $ 76,908 $ 79,131 $ 79,572 $ 76,700 $ 73,675 Average interest earning assets $ 8,558,582 $ 8,012,542 $ 8,560,477 $ 8,556,688 $ 8,181,194 $ 8,098,052 $ 8,001,113
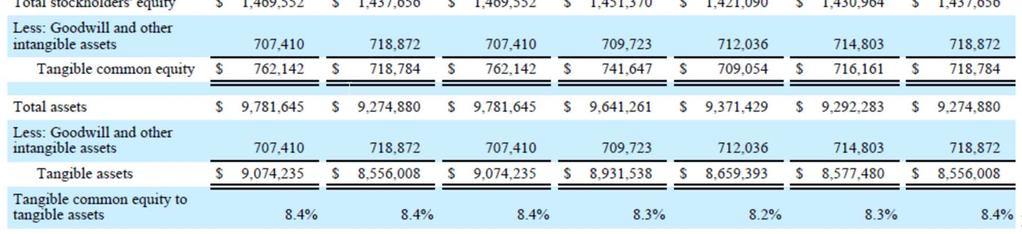
11 GREAT WESTERN BANCORP, INC. Reconciliation of Non-GAAP Measures (Unaudited) (Dollars in thousands) At or for the six months ended December 31, At or for the three months ended September 30, June 30, Net interest margin (FTE) * 3.90% 3.99% 3.89 % 3.91% 4.10% 4.03 % 3.96% Adjusted net interest margin (FTE) ** 3.66% 3.77% 3.64 % 3.67% 3.86% 3.80 % 3.73% * Calculated as net interest income (FTE) divided by average interest earning assets. Annualized for partial-year periods. ** Calculated as adjusted net interest income (FTE) divided by average interest earning assets. Annualized for partial-year periods. Adjusted interest income and adjusted yield (fully-tax equivalent basis), on loans other than loans acquired with deteriorated credit quality: Interest income $ 161,689 $ 156,562 $ 80,317 $ 81,372 $ 82,968 $ 79,245 $ 77,048 Add: Tax equivalent adjustment 3,094 2,139 1,590 1,504 1,324 1,200 1,107 Interest income (FTE) 164, ,701 81,907 82,876 84,292 80,445 78,155 Add: Current realized derivative gain (loss) (10,589) (8,677) (5,307) (5,282) (4,978) (4,600) (4,389) Adjusted interest income (FTE) $ 154,194 $ 150,024 $ 76,600 $ 77,594 $ 79,314 $ 75,845 $ 73,766 Average loans other than loans acquired with deteriorated credit quality $ 6,727,508 $ 6,186,621 $ 6,828,510 $ 6,626,507 $ 6,527,721 $ 6,362,850 $ 6,224,179 Yield (FTE) * 4.91% 5.14% 4.86 % 4.96% 5.12% 5.07 % 5.09% Adjusted yield (FTE) ** 4.60% 4.86% 4.55 % 4.65% 4.82% 4.78 % 4.81% * Calculated as interest income (FTE) divided by average loans. Annualized for partial-year periods. ** Calculated as adjusted interest income (FTE) divided by average loans. Annualized for partial-year periods. Efficiency ratio: Total revenue $ 178,370 $ 178,064 $ 87,561 $ 90,809 $ 91,727 $ 90,414 $ 87,097 Add: Tax equivalent adjustment 3,094 2,139 1,590 1,504 1,324 1,200 1,107 Total revenue (FTE) $ 181,464 $ 180,203 $ 89,151 $ 92,313 $ 93,051 $ 91,614 $ 88,204 Noninterest expense $ 95,529 $ 97,625 $ 48,438 $ 47,091 $ 48,318 $ 54,278 $ 49,327 Less: Amortization of intangible assets 4,626 9,379 2,313 2,313 2,767 4,069 4,691 Tangible noninterest expense $ 90,903 $ 88,246 $ 46,125 $ 44,778 $ 45,551 $ 50,209 $ 44,636 Efficiency ratio * 50.1% 49.0% 51.7 % 48.5% 49.0% 54.8 % 50.6% * Calculated as the ratio of tangible noninterest expense to total revenue (FTE). Tangible common equity and tangible common equity to tangible assets: Total stockholders' equity $ 1,469,552 $ 1,437,656 $ 1,469,552 $ 1,451,370 $ 1,421,090 $ 1,430,964 $ 1,437,656 Less: Goodwill and other intangible assets 707, , , , , , ,872 Tangible common equity $ 762,142 $ 718,784 $ 762,142 $ 741,647 $ 709,054 $ 716,161 $ 718,784 Total assets $ 9,781,645 $ 9,274,880 $ 9,781,645 $ 9,641,261 $ 9,371,429 $ 9,292,283 $ 9,274,880 Less: Goodwill and other intangible assets 707, , , , , , ,872
12 GREAT WESTERN BANCORP, INC. Reconciliation of Non-GAAP Measures (Unaudited) (Dollars in thousands) At or for the six months ended December 31, At or for the three months ended September 30, June 30, Tangible assets $ 9,074,235 $ 8,556,008 $ 9,074,235 $ 8,931,538 $ 8,659,393 $ 8,577,480 $ 8,556,008 Tangible common equity to tangible assets 8.4% 8.4% 8.4 % 8.3% 8.2% 8.3 % 8.4% GREAT WESTERN BANCORP, INC. Media Contact: Ann Nachtigal, ann.nachtigal@greatwesternbank.com Investor Relations Contact: David Hinderaker, david.hinderaker@greatwesternbank.com
13 Great Western Bancorp, Inc. Declares Quarterly Cash Dividend Sioux Falls, SD April 28, 2015 Great Western Bancorp, Inc. (NYSE: GWB) today announced that its Board of Directors has declared a quarterly cash dividend to its stockholders. A quarterly cash dividend of $0.12 per common share will be paid on May 29, 2015, to all stockholders of record as of the close of business on May 15, Future dividends will be subject to Board approval. About Great Western Bancorp, Inc. Great Western Bancorp, Inc. is the holding company for Great Western Bank, a full-service regional bank focused on relationship-based business and agribusiness banking. Great Western Bank offers small and mid-sized businesses a focused suite of financial products and a range of deposit and loan products to retail customers through several channels, including the branch network, online banking system, mobile banking applications and customer care centers. The bank services its customers through 158 branches in seven states: South Dakota, Iowa, Nebraska, Colorado, Arizona, Kansas and Missouri. To learn more about Great Western Bank visit Forward-Looking Statements The materials posted may contain forward-looking statements, including guidance, involving significant risks and uncertainties, which will be identified by words such as "believe," "expect," "anticipate," "intend," "estimate," "should," "is likely," "will," "going forward" and other expressions that indicate future events and trends and may be followed by or reference cautionary statements. A number of factors could cause actual results to differ materially from those in the forward-looking information. These factors are outlined in our most recent earnings press release and in more detail in our most current 10-Q and 10-K filings. Great Western Bancorp, Inc. disclaims any obligation to update any of the forward-looking statements that are made from time to time to reflect future events or developments or changes in expectations. Great Western Bancorp, Inc. Media Contact: Ann Nachtigal, Ann.nachtigal@greatwesternbank.com Investor Relations Contact: David Hinderaker, David.hinderaker@greatwesternbank.com
14 Earnings Release April 28, 2015
15 Disclosures Forward-Looking Statements: This presentation contains forward-looking statements within the meaning of the Private Securities Litigation Reform Act of Statements about our expectations, beliefs, plans, predictions, forecasts, objectives, assumptions or future events or performance are not historical facts and may be forwardlooking. These statements are often, but not always, made through the use of words or phrases such as anticipates, believes, can, could, may, predicts, potential, should, will, estimate, plans, projects, continuing, ongoing, expects, intends and similar words or phrases. Accordingly, these statements are only predictions and involve estimates, known and unknown risks, assumptions and uncertainties that could cause actual results to differ materially from those expressed. All forward-looking statements are necessarily only estimates of future results, and there can be no assurance that actual results will not differ materially from expectations, and, therefore, you are cautioned not to place undue reliance on such statements. Any forward-looking statements are qualified in their entirety by reference to the factors discussed in the sections titled Item 1A. Risk Factors and Cautionary Note Regarding Forward-Looking Statements in our Annual Report on Form 10-K for the fiscal year ended September 30,. Further, any forward-looking statement speaks only as of the date on which it is made, and we undertake no obligation to update any forward-looking statement to reflect events or circumstances after the date on which the statement is made or to reflect the occurrence of unanticipated events. Non-GAAP Financial Measures: This presentation contains non-gaap measures which our management relies on in making financial and operational decisions about our business and which exclude certain items that we do not consider reflective of our business performance. We believe that the presentation of these measures provides investors with greater transparency and supplemental data relating to our financial condition and results of operations. These non-gaap measures should be considered in context with our GAAP results. A reconciliation of these non- GAAP measures appears in our earnings release dated April 28, 2015 and in the appendix to this presentation. Our earnings release and this presentation are available in the Investor Relations section of our website at Our earnings release and this presentation are also available as part of our Current Report on Form 8-K filed with the SEC on April 28, Explanatory Note: In this presentation, all financial information presented refers to the financial results of Great Western Bancorp, Inc. combined with those of its predecessor, Great Western Bancorporation, Inc.


16 About GWB Company Snapshot Top 20 Midwest bank holding company (1) Business bank with unique agribusiness expertise 7 th largest farm lender bank in the U.S. as of December 31, (2) 158 banking branches across 7 states Owned by National Australia Bank since 2008 Current ownership of 68.2% after October IPO Strong Earnings Results Stock Performance January 1 March 31: Price Range: $ Avg. Close: $21.95 Price Increase IPO Quarter End: 22.3% Stock Performance Market Presence Credit preannouncement March 9 (3) (1)Source: SNL Financial. Based on bank holding companies with headquarters in the Midwest ranked by total assets as of September 30,. Excludes specialty lenders, insurance companies, trust banks and brokerage and investment banking firms. (2) Source: American Bankers Association. (3) Efficiency ratio is a non-gaap measure. See appendix for reconciliation. 3
17 Executing on Strategy Focused Business Banking Franchise with Agribusiness Expertise Business and agribusiness lending remains strong comprising 86% of the total loan portfolio at 2015; up 4.9% FYTD Increased lending volumes across the footprint led by growth in Iowa, Arizona and Colorado New Omaha, Nebraska business banking and wealth hub opened in late March Strong Profitability and Growth Driven by a Highly Efficient Operating Model Returns continue to be attractive FYTD: 0.96% ROAA and 13.8% ROTCE (1) Efficiency remains a key driver of profitability with an efficiency (1) ratio of 50.1% FYTD Consolidation of five branches in Omaha, NE and Sioux Falls, SD proceeded successfully as of 2015 with limited expected impact to revenue streams Strong Capital Generation and Attractive Dividend Tier 1 Capital Ratio of 11.5% and Total Capital Ratio of 12.6% remain strong after adopting Basel III capital conventions on January 1, 2015, which increased RWAs by approximately $270 million Quarterly dividend of $0.12 per share announced April 28, 2015 Risk Management Driving Strong Credit Quality Asset quality metrics remain strong despite elevated credit-related charges during the quarter: Nonaccrual loans 1.05% of total loans Net charge-offs / total loans 0.23% annualized FYTD OREO balance declined to $43.6 million ($8.6 million covered by FDIC loss-sharing) (1) This is a non-gaap measure. See appendix for reconciliation.
 (2) down compared to 2QFY14 due to lower asset yields, partially offset by continued cost of")
 NIM Analysis Noninterest Income (1) (1) Chart excludes changes related to loans and derivatives at fair value which netted $(6.5) million for the quarter.")
18 Revenue Revenue Highlights Net Interest Income ($MM) and NIM Net interest income (FTE) increased by $4.1 million compared to 2QFY14 driven by balance sheet growth Reported and adjusted NIM (FTE) (2) down compared to 2QFY14 due to lower asset yields, partially offset by continued cost of deposit improvement Loan and investment portfolio yields remain under pressure; higher average cash balance Core noninterest revenue flat due to increased mortgage revenue offset by lower deposit service charges (2) NIM Analysis Noninterest Income (1) (1) Chart excludes changes related to loans and derivatives at fair value which netted $(6.5) million for the quarter. Dollars in thousands. (2) Adjusted NIM (FTE) is a non-gaap measure. See appendix for reconciliations. 5
")
 51.")

19 Expenses, Provision & Earnings Highlights Provision for loan losses $12.4 million higher than 2QFY14 Driven by a small number of primarily C&I lending relationships Provision for Loan Losses ($MM) Abnormally Low in Comparable Periods Not concentrated by industry or geography; not systemic or indicative of broader credit deterioration in the loan portfolio Commitment to expense control remains vital to profitability; efficiency ratio (1) 51.7% for the quarter and 50.1% FYTD Lower intangible amortization and occupancy costs partially offset by higher OREO, professional fees and salaries Noninterest Expense ($MM) Net Income ($MM) Stable Expense Base and Efficiency Aided by Lower Intangible Amortization (1) (1) Efficiency ratio is a non-gaap measure. See appendix for reconciliation. 6

20 Balance Sheet Overview Balance Sheet Highlights Loans grew 1.2% in the quarter and are up 4.2% FYTD with growth balanced across CRE, agribusiness and C&I Agribusiness balances retracted slightly during the quarter as expected driven by customers tax planning Deposits grew 3.4% in the quarter and are up 6.2% FYTD led by growth in both business and consumer interest-bearing accounts Deposit growth typically focused in fiscal Q1 and Q2; some seasonal runoff expected in Q3 $6,197 Total Loans (UPB) ($MM) +4.2% FYTD $6,820 $6,414 $7,100 Capital levels remain strong and stable and reflect higher BIII RWAs as of January 1, 2015 Deposits ($MM) '12 '13 '14 2Q'15 Capital +6.2% FYTD $7, % $6,885 $6, % $7, % 0.33% '12 '13 '14 At or for the 6 Months Ended 3/31/15 Deposits Cost of Deposits (1) TCE / TA is a non-gaap measure. See appendix for reconciliation. (1) 7


21 Asset Quality Highlights Net Charge-offs Management remains comfortable with overall asset quality despite elevated provision for loan losses and net charge-offs recognized during the quarter Both provision and net charge-offs predominantly related to a small number of C&I credits; limited current agribusiness deterioration and minimal direct energy exposure Loans on watch status increased to $384.4 million, a 34% increase compared to September 30, Due in large part to proactive management of credit exposures and a comprehensive portfolio review Reserves / NALs Strong Credit Quality 8
22 Proven Business Strategy Focused Business Banking Franchise with Agribusiness Expertise Attract and Retain High-Quality Relationship Bankers Prioritize Organic Growth While Optimizing Footprint Deepen Customer Relationships Strong Profitability and Growth Driven by a Highly Efficient Operating Model Strong Capital Generation and Attractive Dividend Risk Management Driving Strong Credit Quality 9


23 Appendix

24 Non-GAAP Measures 11


25 Non-GAAP Measures 12


26 Non-GAAP Measures 13

27 Non-GAAP Measures 14
Earnings Release January 25, 2018
 Earnings Release January 25, 2018 About GWB Company Snapshot Full-service regional bank focused on relationship-based business and agribusiness banking 173 banking branches across 9 states: Arizona, Colorado,
PRESS RELEASE FOR IMMEDIATE RELEASE
 PRESS RELEASE FOR IMMEDIATE RELEASE FIRST REPUBLIC REPORTS STRONG RESULTS Annual Revenues Increased 18% Wealth Management Assets Increased 28% Year-Over-Year San Francisco, California, January 16, 2018
Independent Bank Group Reports Third Quarter Financial Results
 Press Release For Immediate Release Independent Bank Group Reports Third Quarter Financial Results McKINNEY, Texas, October 23, 2017 /GlobeNewswire/ -- Independent Bank Group, Inc. (NASDAQ: IBTX), the
First Quarter 2018 Earnings Presentation. April 24, 2018
 First Quarter 2018 Earnings Presentation April 24, 2018 Forward looking statements Certain statements contained in this presentation are forward-looking statements within the meaning of Section 27A of
Northeast Bancorp Reports Fourth Quarter Results, Declares Dividend
 FOR IMMEDIATE RELEASE For More Information: Brian Shaughnessy, CFO Northeast Bank, 500 Canal Street, Lewiston, ME 04240 207.786.3245 ext. 3220 www.northeastbank.com Northeast Bancorp Reports Fourth Quarter
Independent Bank Group Reports Second Quarter Financial Results
 Press Release For Immediate Release Independent Bank Group Reports Second Quarter Financial Results McKINNEY, Texas, July 27, 2015 /GlobeNewswire/ -- Independent Bank Group, Inc. (NASDAQ: IBTX), the holding
HUNTINGTON BANCSHARES INCORPORATED REPORTS 2017 FIRST QUARTER EARNINGS
 FOR IMMEDIATE RELEASE April 19, 2017 Analysts: Mark Muth (mark.muth@huntington.com), 614.480.4720 Media: Matt Samson (matt.b.samson@huntington.com), 312.263.0203 Brent Wilder (brent.wilder@huntington.com),
HUNTINGTON BANCSHARES INCORPORATED REPORTS 2018 THIRD QUARTER EARNINGS OF $0.33 PER COMMON SHARE
 FOR IMMEDIATE RELEASE October 23, 2018 Analysts: Mark Muth (mark.muth@huntington.com), 614.480.4720 Media: Matt Samson (matt.b.samson@huntington.com), 312.263.0203 HUNTINGTON BANCSHARES INCORPORATED REPORTS
Northeast Bancorp Reports Record Quarterly Results and Declares Dividend
 FOR IMMEDIATE RELEASE For More Information: Brian Shaughnessy, CFO Northeast Bank, 500 Canal Street, Lewiston, ME 04240 207.786.3245 ext. 3220 www.northeastbank.com Northeast Bancorp Reports Record Quarterly
Citizens Financial Group, Inc. Reports First Quarter Net Income of $388 Million and Diluted EPS of $0.78
 Reports First Quarter Net Income of $388 Million and Diluted EPS of $0.78 ROTCE of 11.7%, up 203 bps with Underlying ROTCE up 273 bps year over year* First quarter 2018 net income up 21% and diluted EPS
HUNTINGTON BANCSHARES INCORPORATED REPORTS 2018 FIRST QUARTER EARNINGS
 FOR IMMEDIATE RELEASE April 24, 2018 Analysts: Mark Muth (mark.muth@huntington.com), 614.480.4720 Media: Matt Samson (matt.b.samson@huntington.com), 312.263.0203 HUNTINGTON BANCSHARES INCORPORATED REPORTS
F.N.B. Corporation Reports Net Income of $23.5 Million in Fourth Quarter 2010 Full Year 2010 Net Income More Than Double Full Year 2009
 Press Release F.N.B. Corporation Reports Net Income of $23.5 Million in Fourth Quarter 2010 Full Year 2010 Net Income More Than Double Full Year 2009 Hermitage, PA January 24, 2011 F.N.B. Corporation (NYSE:
Independent Bank Group Reports First Quarter Financial Results
 Press Release For Immediate Release Independent Bank Group Reports First Quarter Financial Results McKINNEY, Texas, April 23, 2018 /GlobeNewswire/ -- Independent Bank Group, Inc. (NASDAQ: IBTX), the holding
Lakeland Financial Reports Record Performance Second Quarter Net Income Increases 31%
 NEWS FROM LAKELAND FINANCIAL CORPORATION FOR IMMEDIATE RELEASE Contact Lisa M. O Neill Executive Vice President and Chief Financial Officer (574) 267 9125 lisa.oneill@lakecitybank.com Lakeland Financial
FIRST REPUBLIC BANK (Exact name of registrant as specified in its charter)
") FEDERAL DEPOSIT INSURANCE CORPORATION Washington, D.C. 20429 FORM 8-K CURRENT REPORT PURSUANT TO SECTION 13 OR 15(d) OF THE SECURITIES EXCHANGE ACT OF 1934 Date of Report (Date of earliest event reported):
FEDERAL DEPOSIT INSURANCE CORPORATION Washington, D.C. 20429 FORM 8-K CURRENT REPORT PURSUANT TO SECTION 13 OR 15(d) OF THE SECURITIES EXCHANGE ACT OF 1934 Date of Report (Date of earliest event reported):
Citizens Financial Group, Inc., Reports Fourth Quarter Net Income of $221 Million, or $0.42 Diluted EPS
 , Reports Fourth Quarter Net Income of $221 Million, or $0.42 Diluted EPS 2015 Net Income of $840 Million, or $1.55 Diluted EPS 2015 Adjusted net income available to common stockholders*, excluding net
Columbia Banking System Announces Second Quarter 2018 Results and Quarterly Cash Dividend
 FOR IMMEDIATE RELEASE July 26, 2018 Columbia Banking System Announces Second Quarter 2018 Results and Quarterly Cash Dividend Highlights Record quarterly net income of $41.7 million; diluted earnings per
Third Quarter 2017 Earnings Presentation. October 24, 2017
 Third Quarter 207 Earnings Presentation October 24, 207 Forward looking statements This presentation contains forward-looking statements made pursuant to the safe harbor provisions of the Private Securities
FINANCIAL COMMUNITY PRESENTATION
 FINANCIAL COMMUNITY PRESENTATION FEBRUARY 2017 DISCLAIMER Forward-Looking Statements This presentation contains forward-looking statements within the meaning of the Private Securities Litigation Reform
Hancock reports fourth quarter 2016 EPS of $.64 Beat Core Pre-Tax Pre-Provision Income Goal for 2016 by $11 Million; Up 25% vs.
 For Immediate Release January 17, 2017 For More Information Trisha Voltz Carlson SVP, Investor Relations Manager 504.299.5208 trisha.carlson@hancockwhitney.com Hancock reports fourth quarter 2016 EPS of
F.N.B. Corporation Reports Third Quarter 2016 Earnings
 Press Release F.N.B. Corporation Reports Third Quarter 2016 Earnings PITTSBURGH, PA - October 19, 2016 F.N.B. Corporation (NYSE: FNB) reported earnings for the third quarter of 2016 with net income available
FIRST REPUBLIC BANK (Exact name of registrant as specified in its charter)
") FEDERAL DEPOSIT INSURANCE CORPORATION Washington, D.C. 20429 FORM 8-K CURRENT REPORT PURSUANT TO SECTION 13 OR 15(d) OF THE SECURITIES EXCHANGE ACT OF 1934 Date of Report (Date of earliest event reported):
FEDERAL DEPOSIT INSURANCE CORPORATION Washington, D.C. 20429 FORM 8-K CURRENT REPORT PURSUANT TO SECTION 13 OR 15(d) OF THE SECURITIES EXCHANGE ACT OF 1934 Date of Report (Date of earliest event reported):
First Hawaiian, Inc. Reports Third Quarter 2016 Financial Results and Declares Dividend
 Exhibit 99.1 For Immediate Release First Hawaiian, Inc. Reports Third Quarter 2016 Financial Results and Declares Dividend HONOLULU, Hawaii Oct 27, 2016 (Globe Newswire) First Hawaiian, Inc. (NASDAQ:FHB),
Lakeland Financial Reports Record First Quarter Performance Net Income Increases 26% and Dividend Increases 18%
 NEWS FROM LAKELAND FINANCIAL CORPORATION FOR IMMEDIATE RELEASE Contact Lisa M. O Neill Executive Vice President and Chief Financial Officer (574) 267 9125 lisa.oneill@lakecitybank.com Lakeland Financial
4Q14 and FY 2014 Financial Results. January 26, 2015
 4Q14 and FY 2014 Financial Results January 26, 2015 Forward-looking statements This document contains forward-looking statements within the Private Securities Litigation Reform Act of 1995. Statements
The current reserve of $12.1MM plus the $5.2MM fair value mark on acquired loans would equate to a 1.21% reserve/loans.
 EARNINGS RELEASE Exhibit 99.1 CONTACT Rob Anderson Chief Financial Officer and Chief Administrative Officer (615) 732-6470 CapStar Reports Fully Diluted EPS of ($0.04) and Fully Diluted Operating EPS of
Independent Bank Group Reports Third Quarter Financial Results
 Press Release For Immediate Release Independent Bank Group Reports Third Quarter Financial Results McKINNEY, Texas, October 28, 2014 /GlobeNewswire/ -- Independent Bank Group, Inc. (NASDAQ: IBTX), the
F.N.B. Corporation Reports Fourth Quarter and Full Year 2016 Earnings
 Press Release F.N.B. Corporation Reports Fourth Quarter and Full Year 2016 Earnings PITTSBURGH, PA - January 18, 2017 F.N.B. Corporation (NYSE: FNB) reported earnings for the fourth quarter of 2016 with
FIRST CITIZENS COMMUNITY BANK S. MAIN STREET (FAX) MANSFIELD, PA CONTACT: KATHLEEN CAMPBELL, MARKETING DIRECTOR
 MANSFIELD, PA CONTACT: KATHLEEN CAMPBELL, MARKETING DIRECTOR") CONTACT: KATHLEEN CAMPBELL, MARKETING DIRECTOR FIRST CITIZENS COMMUNITY BANK 570-662-0422 15 S. MAIN STREET 570-662-8512 (FAX) MANSFIELD, PA 16933 CITIZENS FINANCIAL SERVICES, INC. REPORTS UNAUDITED FULL
CONTACT: KATHLEEN CAMPBELL, MARKETING DIRECTOR FIRST CITIZENS COMMUNITY BANK 570-662-0422 15 S. MAIN STREET 570-662-8512 (FAX) MANSFIELD, PA 16933 CITIZENS FINANCIAL SERVICES, INC. REPORTS UNAUDITED FULL
UNITED STATES SECURITIES AND EXCHANGE COMMISSION WASHINGTON, D.C FORM 8-K
 UNITED STATES SECURITIES AND EXCHANGE COMMISSION WASHINGTON, D.C. 20549 FORM 8-K CURRENT REPORT PURSUANT TO SECTION 13 OR 15(d) OF THE SECURITIES EXCHANGE ACT OF 1934 Date of report (Date of earliest event
FOR IMMEDIATE RELEASE
 FOR IMMEDIATE RELEASE January 23, 2018 Analysts: Mark Muth (mark.muth@huntington.com), 614.480.4720 Media: Matt Samson (matt.b.samson@huntington.com), 312.263.0203 Michael Sherman (michael.sherman@huntington.com),
Exhibit Fourth Quarter 2016 Earnings Call January 30, 2017
 Exhibit 99.2 Fourth Quarter 2016 Earnings Call January 30, 2017 Disclaimer Terminology The terms we, our, us, the Company, CSTR and CapStar that appear in this presentation refer to CapStar Financial Holdings,
First Hawaiian, Inc. Reports Fourth Quarter and Full Year 2018 Financial Results and Increases Dividend by 8.3%
 For Immediate Release First Hawaiian, Inc. Reports Fourth Quarter and Full Year 2018 Financial Results and Increases Dividend by 8.3% HONOLULU, Hawaii January 24, 2019--(Globe Newswire)--First Hawaiian,
Rurban Financial Corp. Announces Second Quarter 2011 Results
 Rurban Financial Corp. Announces Second Quarter 2011 Results DEFIANCE, Ohio, July 27, 2011 (GlobeNewswire) -- Rurban Financial Corp. (NASDAQ: RBNF) ( Rurban or the Company ), a diversified financial services
United Community Banks, Inc. Announces Third Quarter Results Continued Strong Profitability, EPS up 42% year over year
 For Immediate Release For more information: Jefferson Harralson Chief Financial Officer (864) 2406208 Jefferson_Harralson@ucbi.com United Community Banks, Inc. Announces Third Quarter Results Continued
Executing On Our Unique Higher Performing Banking Model
 Executing On Our Unique Higher Performing Banking Model Q4 2018 Investor Presentation January, 2019 NYSE: CUBI Member FDIC Investment Proposition Highly Focused, Innovative, Relationship Banking Based
FOR IMMEDIATE RELEASE
 FOR IMMEDIATE RELEASE MEDIA CONTACT: Joe Bass, 615-743-8219 FINANCIAL CONTACT: Harold Carpenter, 615-744-3742 WEBSITE: www.pnfp.com PNFP REPORTS DILUTED EPS OF $1.23, ROAA OF 1.54 PERCENT AND ROTCE OF
MEDIA CONTACT: Joe Bass, FINANCIAL CONTACT: Harold Carpenter, WEBSITE:
 FOR IMMEDIATE RELEASE MEDIA CONTACT: Joe Bass, 615-743-8219 FINANCIAL CONTACT: Harold Carpenter, 615-744-3742 WEBSITE: www.pnfp.com PNFP REPORTS DILUTED EPS OF $1.08, ROAA of 1.53 percent and ROTCE of
United Community Banks, Inc. Announces Second Quarter Earnings
 July 27, 2016 United Community Banks, Inc. Announces Second Quarter Earnings Diluted earnings per share of 35 cents, up 25 percent from second quarter 2015 Excluding merger-related charges, diluted operating
INVESTOR PRESENTATION
 INVESTOR PRESENTATION JUNE 2017 DISCLAIMER Forward-Looking Statements This presentation contains forward-looking statements within the meaning of the Private Securities Litigation Reform Act of 1995. These
MEDIA CONTACT: Nikki Klemmer, FINANCIAL CONTACT: Harold Carpenter, WEBSITE:
 FOR IMMEDIATE RELEASE MEDIA CONTACT: Nikki Klemmer, 615-743-6132 FINANCIAL CONTACT: Harold Carpenter, 615-744-3742 WEBSITE: www.pnfp.com PINNACLE FINANCIAL INCREASES QUARTERLY NET INCOME PER FULLY DILUTED
F.N.B. Corporation Reports Second Quarter 2014 Results Record High Net Income; Linked-Quarter Revenue Growth of 8.5%
 Press Release F.N.B. Corporation Reports Second Quarter 2014 Results Record High Net Income; Linked-Quarter Revenue Growth of 8.5% Pittsburgh, PA, July 22, 2014 F.N.B. Corporation (NYSE: FNB) today reported
Riverview Bancorp Earnings Increase to $2.7 Million in First Fiscal Quarter 2018; Highlighted by Strong Loan Growth and Net Interest Margin Expansion
 Contacts: Pat Sheaffer or Kevin Lycklama Riverview Bancorp, Inc. 360-693-6650 Riverview Bancorp Earnings Increase to $2.7 Million in First Fiscal Quarter 2018; Highlighted by Strong Loan Growth and Net
1Q19 Financial Results. April 18, 2019
 1Q19 Financial Results April 18, 2019 Forward-looking statements and use of key performance metrics and non-gaap financial measures This document contains forward-looking statements within the meaning
F.N.B. Corporation Reports Third Quarter 2010 Results
 Press Release F.N.B. Corporation Reports Third Quarter 2010 Results Hermitage, PA October 25, 2010 F.N.B. Corporation (NYSE: FNB) today reported financial results for the third quarter of 2010. Net income
FOR MORE INFORMATION CONTACT: Mike Harrington, CFO
 FOR RELEASE: IMMEDIATELY Frank Leto, President, CEO FOR MORE INFORMATION CONTACT: 610-581-4730 Mike Harrington, CFO 610-526-2466 Bryn Mawr Bank Corporation Reports Record Quarterly Earnings of $15.3 Million
FIFTH THIRD ANNOUNCES FIRST QUARTER 2018 NET INCOME TO COMMON SHAREHOLDERS OF $689 MILLION, OR $0.97 PER DILUTED SHARE
 CONTACTS: Sameer Gokhale (Investors) News Release (513) 534-2219 Larry Magnesen (Media) FOR IMMEDIATE RELEASE (513) 534-8055 April 24, 2018 FIFTH THIRD ANNOUNCES FIRST QUARTER 2018 NET INCOME TO COMMON
Citizens Financial Group, Inc. Reports Fourth Quarter Net Income of $465 Million and Diluted EPS of $0.96
 Reports Fourth Quarter Net Income of $465 Million and Diluted EPS of $0.96 Underlying net income of $474 million up 36% and diluted EPS of $0.98 up 38% year over year* ROTCE of 13.8%; Underlying ROTCE
CONTACTS: Sameer Gokhale (Investors) FOR IMMEDIATE RELEASE (513) January 24, 2017 Larry Magnesen (Media) (513)
 FOR IMMEDIATE RELEASE (513) January 24, 2017 Larry Magnesen (Media) (513)") News Release CONTACTS: Sameer Gokhale (Investors) FOR IMMEDIATE RELEASE (513) 534-2219 January 24, 2017 Larry Magnesen (Media) (513) 534-8055 FIFTH THIRD ANNOUNCES FOURTH QUARTER EARNINGS PER DILUTED SHARE
News Release CONTACTS: Sameer Gokhale (Investors) FOR IMMEDIATE RELEASE (513) 534-2219 January 24, 2017 Larry Magnesen (Media) (513) 534-8055 FIFTH THIRD ANNOUNCES FOURTH QUARTER EARNINGS PER DILUTED SHARE
FIFTH THIRD ANNOUNCES SECOND QUARTER 2017 NET INCOME TO COMMON SHAREHOLDERS OF $344 MILLION, OR $0.45 PER DILUTED SHARE
 CONTACTS: Sameer Gokhale (Investors) News Release (513) 534-2219 Larry Magnesen (Media) FOR IMMEDIATE RELEASE (513) 534-8055 July 21, 2017 FIFTH THIRD ANNOUNCES SECOND QUARTER 2017 NET INCOME TO COMMON
FOR IMMEDIATE RELEASE Bryan R. McKeag April 30, 2018 Executive Vice President Chief Financial Officer (563)
") CONTACT: FOR IMMEDIATE RELEASE Bryan R. McKeag April 30, 2018 Executive Vice President Chief Financial Officer (563) 589-1994 HEARTLAND FINANCIAL USA, INC. REPORTS FIRST QUARTER 2018 RESULTS Highlights
CONTACT: FOR IMMEDIATE RELEASE Bryan R. McKeag April 30, 2018 Executive Vice President Chief Financial Officer (563) 589-1994 HEARTLAND FINANCIAL USA, INC. REPORTS FIRST QUARTER 2018 RESULTS Highlights
CAPSTAR FINANCIAL HOLDINGS, INC. ANNOUNCES SECOND QUARTER 2018 RESULTS
 EARNINGS RELEASE Exhibit 99.1 CONTACT Rob Anderson Chief Financial Officer and Chief Administrative Officer (615) 732-6470 CAPSTAR FINANCIAL HOLDINGS, INC. ANNOUNCES SECOND QUARTER 2018 RESULTS NASHVILLE,
F.N.B. Corporation Reports Fourth Quarter and Full Year 2017 Earnings
 Press Release F.N.B. Corporation Reports Fourth Quarter and Full Year 2017 Earnings PITTSBURGH, PA - January 23, 2018 -- F.N.B. Corporation (NYSE: FNB) reported earnings for the fourth quarter of 2017
Bryn Mawr Bank Corporation Reports First Quarter Net Income of $9.0 Million, Improved Net Interest Margin
 FOR RELEASE: IMMEDIATELY Frank Leto, President, CEO FOR MORE INFORMATION CONTACT: 610-581-4730 Mike Harrington, CFO 610-526-2466 Bryn Mawr Bank Corporation Reports First Quarter Net Income of $9.0 Million,
SunTrust Banks, Inc.
 UNITED STATES SECURITIES AND EXCHANGE COMMISSION Washington, D.C. 20549 FORM 8-K CURRENT REPORT Pursuant to Section 13 or 15(d) of the Securities Exchange Act of 1934 Date of Report (Date of earliest event
INVESTOR PRESENTATION NOVEMBER 2018
 INVESTOR PRESENTATION NOVEMBER 2018 0 DISCLAIMER Forward-Looking Statements This presentation contains forward-looking statements within the meaning of the Private Securities Litigation Reform Act of 1995.
Third Quarter 2018 Earnings Release Presentation
 Third Quarter 2018 Earnings Release Presentation October 23, 2018 RAISING STANDARDS TOGETHER Safe Harbor Statement From time to time, our comments and releases may contain forward-looking statements within
People s United Financial Reports First Quarter Net Income of $114.6 Million, or $0.30 per Common Share
 People s United Financial Reports First Quarter Net Income of $114.6 Million, or $0.30 per Common Share Operating Earnings of $0.33 per Common Share Announces Increase in the Common Dividend to an Annual
FIFTH THIRD ANNOUNCES SECOND QUARTER 2018 NET INCOME TO COMMON SHAREHOLDERS OF $563 MILLION, OR $0.80 PER DILUTED SHARE
 CONTACTS: Sameer Gokhale (Investors) News Release (513) 534-2219 Larry Magnesen (Media) FOR IMMEDIATE RELEASE (513) 534-8055 July 19, 2018 FIFTH THIRD ANNOUNCES SECOND QUARTER 2018 NET INCOME TO COMMON
COMMERCE BANCSHARES, INC. ANNOUNCES SECOND QUARTER EARNINGS PER SHARE OF $.48
 FOR IMMEDIATE RELEASE: Thursday, July 16, 2009 COMMERCE BANCSHARES, INC. ANNOUNCES SECOND QUARTER EARNINGS PER SHARE OF $.48 Commerce Bancshares, Inc. announced earnings of $.48 per share for the quarter
People s United Financial Reports Fourth Quarter Net Income of $132.9 Million, or $0.35 per Common Share
 People s United Financial Reports Fourth Quarter Net Income of $132.9 Million, or $0.35 per Common Share Operating Earnings of $0.36 per Common Share Announced the acquisition of BSB Bancorp and acquired
For Immediate Release: October 22, 2017 SIMMONS REPORTS THIRD QUARTER 2017 EARNINGS
 For Immediate Release: October 22, 2017 SIMMONS REPORTS THIRD QUARTER 2017 EARNINGS Pine Bluff, AR Simmons First National Corp. (NASDAQ-GS: ) today announced net income available to common shareholders
4Q 18 EARNINGS PRESENTATION
 4Q 18 EARNINGS PRESENTATION January 18, 2019 2019 SunTrust Banks, Inc. SunTrust is a federally registered trademark of SunTrust Banks, Inc. IMPORTANT CAUTIONARY STATEMENT This presentation should be read
Executing On Our Unique Higher Performing Banking Model
 Executing On Our Unique Higher Performing Banking Model Q3 Earnings Call Investor Presentation October, 2018 NYSE: CUBI Member FDIC Strategic Priorities 1) Create shareholder value through improved profitability
3Q 18 EARNINGS PRESENTATION
 3Q 18 EARNINGS PRESENTATION October 19, 2018 2018 SunTrust Banks, Inc. SunTrust is a federally registered trademark of SunTrust Banks, Inc. IMPORTANT CAUTIONARY STATEMENT This presentation should be read
Columbia Banking System Announces Fourth Quarter and Full Year 2017 Results and Quarterly Cash Dividend
 Exhibit 99.1 FOR IMMEDIATE RELEASE January 25, 2018 Columbia Banking System Announces Fourth Quarter and Full Year 2017 Results and Quarterly Cash Dividend Highlights Fourth quarter net income of $15.7
615 Merrick Avenue, Westbury, NY Phone: (516) Fax: (516)
 Fax: (516)") NEWS RELEASE 615 Merrick Avenue, Westbury, NY 11590 Phone: (516) 683-4420 Fax: (516) 683-4424 www.mynycb.com FOR IMMEDIATE RELEASE Investor Contact: Media Contact: Salvatore J. DiMartino (516) 683-4286
NEWS RELEASE 615 Merrick Avenue, Westbury, NY 11590 Phone: (516) 683-4420 Fax: (516) 683-4424 www.mynycb.com FOR IMMEDIATE RELEASE Investor Contact: Media Contact: Salvatore J. DiMartino (516) 683-4286
Second Quarter 2018 Earnings Conference Call July 19, 2018
 Second Quarter 2018 Earnings Conference Call July 19, 2018 WBS 2Q18 Earnings Highlights ($ in millions, except EPS data) Significant progress on our key strategic initiatives: 35 consecutive quarters of
CUSTOMERS BANCORP REPORTS FOURTH QUARTER 2017 NET INCOME OF $18.0 MILLION; DILUTED EPS OF $0.55
 Customers Bancorp 1015 Penn Avenue Wyomissing, PA 19610 Contacts: Jay Sidhu, Chairman & CEO 610-935-8693 Robert Wahlman, CFO 610-743-8074 Bob Ramsey, Director of Investor Relations and Strategic Planning
PRESS RELEASE Contact: Richard P. Smith For Immediate Release President & CEO (530) TRICO BANCSHARES ANNOUNCES QUARTERLY AND ANNUAL RESULTS
 TRICO BANCSHARES ANNOUNCES QUARTERLY AND ANNUAL RESULTS") PRESS RELEASE Contact: Richard P. Smith For Immediate Release President & CEO (530) 898-0300 TRICO BANCSHARES ANNOUNCES QUARTERLY AND ANNUAL RESULTS CHICO, Calif. (January 30, 2018) TriCo Bancshares (NASDAQ:
PRESS RELEASE Contact: Richard P. Smith For Immediate Release President & CEO (530) 898-0300 TRICO BANCSHARES ANNOUNCES QUARTERLY AND ANNUAL RESULTS CHICO, Calif. (January 30, 2018) TriCo Bancshares (NASDAQ:
2017 Annual Meeting of Shareholders May 22, 2017
 2017 Annual Meeting of Shareholders May 22, 2017 Safe harbor statement When used in filings by LegacyTexas Financial Group, Inc. (the "Company ) with the Securities and Exchange Commission (the SEC ),
News Release. Contact: Greg Ketron Barry Koling (404) (404) For Immediate Release January 19, 2007
 (404) For Immediate Release January 19, 2007") News Release Contact: Investors Media Greg Ketron Barry Koling (404) 827-6714 (404) 230-5268 For Immediate Release January 19, 2007 SunTrust Reports Record Earnings For 2006, Up 7% From 2005 ------ Company
News Release Contact: Investors Media Greg Ketron Barry Koling (404) 827-6714 (404) 230-5268 For Immediate Release January 19, 2007 SunTrust Reports Record Earnings For 2006, Up 7% From 2005 ------ Company
Fifth Third Bancorp 1Q18 Earnings Presentation
 Fifth Third Bancorp Q8 Earnings Presentation April 24, 208 Refer to earnings release dated April 24, 208 for further information. Fifth Third Bancorp All Rights Reserved Cautionary statement This presentation
Second Quarter 2017 Earnings Conference Call. July 21, 2017
 Second Quarter 2017 Earnings Conference Call July 21, 2017 WBS 2Q17 Earnings Highlights ($ in millions, except EPS data) $50.6 $48.4 $0.53 ROACE: 8.31% 9.43% 9.63% ROATCE: Net Income $59.5 $57.3 $0.62
Fifth Third Bancorp 3Q18 Earnings Presentation
 Fifth Third Bancorp 3Q8 Earnings Presentation October 23, 208 Refer to earnings release dated October 23, 208 for further information. FORWARD-LOOKING STATEMENTS This communication contains forward-looking
Second Quarter 2018 Earnings Conference Call
 Second Quarter 2018 Earnings Conference Call July 19, 2018 Kelly S. King Chairman and Chief Executive Officer Daryl N. Bible Chief Financial Officer Forward-Looking Information This presentation contains
First Niagara Reports Fourth Quarter and Full Year 2014 Results
 First Niagara Reports Fourth Quarter and Full Year 2014 Results Fourth Quarter and 2014 Highlights: Fourth quarter operating earnings of $61.7 million or $0.17 per diluted share o Full Year 2014 operating
Riverview Bancorp Earns $740,000 in First Fiscal Quarter of 2015; Highlighted by Improved Credit Quality Metrics and Growth in the Loan Portfolio
 Contacts: Pat Sheaffer or Ron Wysaske, Riverview Bancorp, Inc. 360 693 6650 Riverview Bancorp Earns $740,000 in First Fiscal Quarter of 2015; Highlighted by Improved Credit Quality Metrics and Growth in
Riverview Bancorp Earns $1.7 Million in Second Quarter; Highlighted by Announced Deal with MBank
 Contacts: Pat Sheaffer, Ron Wysaske or Kevin Lycklama, Riverview Bancorp, Inc. 360-693- 6650 Riverview Bancorp Earns $1.7 Million in Second Quarter; Highlighted by Announced Deal with MBank Vancouver,
The ICBK Story Q Holding Company for:
 The ICBK Story Q3 2017 Holding Company for: Q3 2017 Forward Looking Statements EXCEPT AS OTHERWISE INDICATED, THIS PRESENTATION SPEAKS AS OF THE DATE HEREOF.THE DELIVERY OF THIS PRESENTATION SHALL NOT,
***FOR IMMEDIATE RELEASE***
 ***FOR IMMEDIATE RELEASE*** For: ZIONS BANCORPORATION Contact: James Abbott One South Main, 15th Floor Tel: (801) 844-7637 Salt Lake City, Utah Harris H. Simmons Chairman/Chief Executive Officer ZIONS
4Q17 and FY2017 Financial Results. January 19, 2018
 4Q17 and FY2017 Financial Results January 19, 2018 Forward-looking statements and use of key performance metrics and non-gaap Financial Measures This document contains forward-looking statements within
Fifth Third Announces Fourth Quarter 2018 Results
 Fifth Third Announces Fourth Quarter 2018 Results Diluted earnings per share of $0.64, including a negative $0.05 impact from certain items on page 2 Key Financial Data $ millions for all balance sheet
BancorpSouth Announces Fourth Quarter and Annual 2016 Financial Results; Declares Quarterly Dividend
 News Release Contact: William L. Prater Will Fisackerly Senior Executive Vice President and Senior Vice President and Chief Financial Officer Director of Corporate Finance 662/680-2536 662/680-2475 BancorpSouth
First Quarter 2018 Earnings Conference Call April 19, 2018
 First Quarter 2018 Earnings Conference Call April 19, 2018 WBS 1Q18 Earnings Highlights ($ in millions, except EPS data) Significant progress on our key strategic initiatives: 34 consecutive quarters of
For release at 1:00 P.M. (Pacific Time) SVB FINANCIAL GROUP ANNOUNCES 2008 FIRST QUARTER FINANCIAL RESULTS
 SVB FINANCIAL GROUP ANNOUNCES 2008 FIRST QUARTER FINANCIAL RESULTS") 3003 Tasman Drive, Santa Clara, CA 95054 www.svb.com For release at 1:00 P.M. (Pacific Time) April 24, 2008 Contact: Meghan O Leary Investor Relations (408) 654-6364 NASDAQ: SIVB SVB FINANCIAL GROUP ANNOUNCES
3003 Tasman Drive, Santa Clara, CA 95054 www.svb.com For release at 1:00 P.M. (Pacific Time) April 24, 2008 Contact: Meghan O Leary Investor Relations (408) 654-6364 NASDAQ: SIVB SVB FINANCIAL GROUP ANNOUNCES
META FINANCIAL GROUP, INC. (Exact name of registrant as specified in its charter)
") UNITED STATES SECURITIES AND EXCHANGE COMMISSION Washington, D.C. 20549 FORM 8-K CURRENT REPORT Pursuant to Section 13 OR 15(d) of the Securities Exchange Act of 1934 Date of Report (Date of earliest event
UNITED STATES SECURITIES AND EXCHANGE COMMISSION Washington, D.C. 20549 FORM 8-K CURRENT REPORT Pursuant to Section 13 OR 15(d) of the Securities Exchange Act of 1934 Date of Report (Date of earliest event
Park Sterling Corporation. 2012Q4 Earnings Conference Call February 8, 2013
 Park Sterling Corporation 2012Q4 Earnings Conference Call February 8, 2013 Forward Looking Statements and Non-GAAP Measures Forward Looking Statements This presentation contains,, and Park Sterling and
Piper Jaffray Companies Reports Third Quarter 2018 Results
 Piper Jaffray Companies Reports Third Quarter 2018 Results MINNEAPOLIS October 26, 2018 Piper Jaffray Companies (NYSE: PJC) today announced its results for the third quarter ended September 30, 2018. "We
Greg Smith, senior vice president, chief financial officer David Urban, vice president, director of investor relations
 News Release Marshall & Ilsley Corporation 770 North Water Street Milwaukee, WI 53202 414 765-7700 Main 414 298-2921 Fax mibank.com For Release: Contact: Immediately Greg Smith, senior vice president,
People s United Financial Reports Fourth Quarter Net Income of $106.2 Million, or $0.30 Per Common Share; Operating Earnings of $0.31 Per Common Share
 NEWS RELEASE FOR IMMEDIATE RELEASE January 18, 2018 INVESTOR CONTACT: MEDIA CONTACT: Andrew S. Hersom Investor Relations 203.338.4581 Andrew.Hersom@peoples.com Steven Bodakowski Corporate Communications
3Q17 Financial Results. October 20, 2017
 3Q17 Financial Results October 20, 2017 Forward-looking statements and use of key performance metrics and Non-GAAP financial measures This document contains forward-looking statements within the Private
1Q 18 EARNINGS PRESENTATION
 1Q 18 EARNINGS PRESENTATION April 20, 2018 2018 SunTrust Banks, Inc. SunTrust is a federally registered trademark of SunTrust Banks, Inc. IMPORTANT CAUTIONARY STATEMENT This presentation should be read
NEWS RELEASE BNCCORP, INC. REPORTS THIRD QUARTER NET INCOME OF $1.1 MILLION, OR $0.30 PER DILUTED SHARE
 NEWS RELEASE FOR FURTHER INFORMATION: WEBSITE: www.bnccorp.com TIMOTHY J. FRANZ, CEO TELEPHONE: (612) 305-2213 DANIEL COLLINS, CFO TELEPHONE: (612) 305-2210 BNCCORP, INC. REPORTS THIRD QUARTER NET INCOME
4Q15 Quarterly Supplement
 4Q15 Quarterly Supplement January 15, 2016 These results do not reflect the impact of the agreement in principle Wells Fargo & Company reached with the United States government on February 1, 2016 to pay
1st Source Corporation Reports Earnings, History of Increased Dividends Continues
 For: Immediate Release Contact: Andrea Short January 21, 2016 574-235-2000 1st Source Corporation Reports Earnings, History of Increased Dividends Continues South Bend, IN - 1st Source Corporation (NASDAQ:SRCE),
NORTHERN TRUST CORPORATION REPORTS RECORD SECOND QUARTER NET INCOME OF $390.4 MILLION, EARNINGS PER COMMON SHARE OF $1.68
 Exhibit 99.1 News Release Investor Contact: Media Contact: Mark Bette Doug Holt (312) 444-2301 (312) 557-1571 Mark_Bette@ntrs.com Doug_Holt@ntrs.com https://www.northerntrust.com FOR IMMEDIATE RELEASE
Financial Results 2Q 2017
 Financial Results 2Q 2017 Forward-Looking Statements This presentation may contain forward-looking statements concerning the Corporation s future economic, operational and financial performance. The words
CEO Commentary. In the Spotlight. U.S. Bancorp Reports Third Quarter 2018 Results
 U.S. Bancorp Reports Third Quarter 2018 Results Record net revenue of $5,699 million, record net income of $1,815 million and record diluted earnings per share of $1.06 Industry leading return on average
Greg Smith, senior vice president, chief financial officer David Urban, vice president, director of investor relations
 News Release Marshall & Ilsley Corporation 770 North Water Street Milwaukee, WI 53202 414 765-7700 Main 414 298-2921 Fax mibank.com For Release: Contact: Immediately Greg Smith, senior vice president,