Ranking Country Page. Category 1: Countries with positive CEP Default Index and positive NTE. 1 Estonia 1. 2 Luxembourg 2.
|
|
|
- Lily Cunningham
- 5 years ago
- Views:
Transcription
1 Overview: Single Results of Euro Countries Ranking Country Page Category 1: Countries with positive CEP Default Index and positive NTE 1 Estonia 1 2 Luxembourg 2 3 Germany 3 4 Netherlands 4 5 Austria 5 6 Belgium 6 7 Finland 7 Category 2: Countries with positive CEP Default Index and negative NTE 8 Slovenia 8 9 Slovakia 9 10 Ireland 10 Category 3: Countries with negative CEP Default Index last year 11 France Spain Italy 13 Category 4: Countries with negative CEP Default Index in the last three years 14 Malta Cyprus Portugal Greece 17
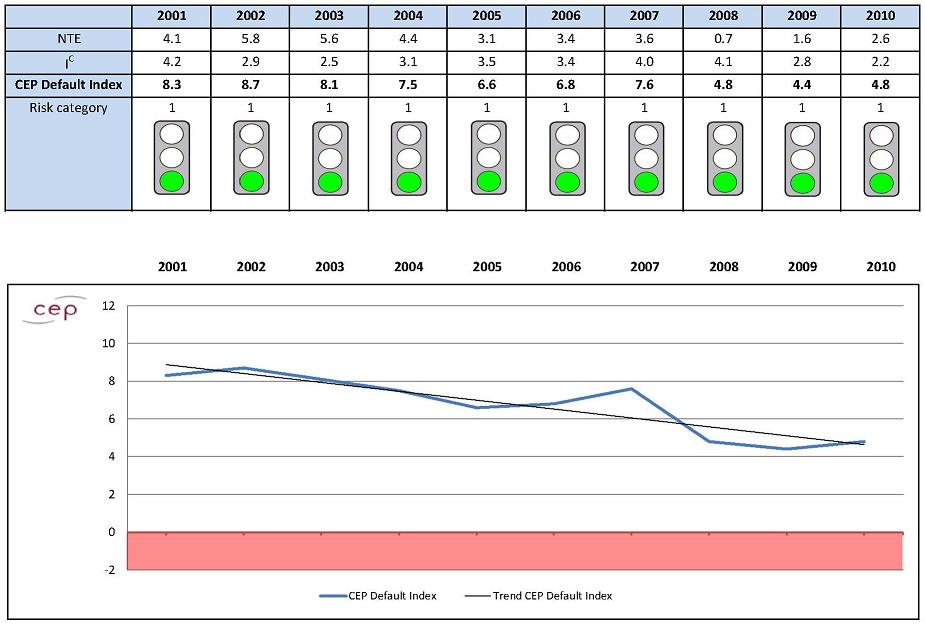
2 Risk category 1 Estonia Overview table 1
3 Risk category 1 Luxembourg Overview table 2

4 Risk category 1 Germany Net lending or net borrowing of the total economy (NTE): Germany has had capital export surpluses since Since 2005, it has provided capital to the amount of 5% of GDP to other economies and thus funded their current account deficits. Capacity enhancing capital formation (I c ): Until 2009, its investment ratio was below the euro countries average; in 2010, this changed. CEP Default Index: The CEP Default Index had risen by 2007 to a two-digit value, then it fell slightly but rose again in Risk category 1: Germany s solvency increased continually throughout that period. Outlook: Germany s solvency will continue to grow as long as the country generates current account surpluses and therewith capital export surpluses. A negative current account is not foreseeable for Germany. An indirect threat to solvency, at least of the German state, might result from their granting increasingly large credits and credit guarantees to euro zone countries threatened by insolvency. Overview table 3
5 Risk category 1 Netherlands Overview table 4

6 Risk category 1 Austria Overview table 5


7 Risk category 1 6
8 Risk category 1 Finland Overview table 7

9 Risk category 2 Slovenia Net lending or net borrowing of the total economy (NTE): Since 2003, Slovenia has had capital import surpluses, with the country indebting itself abroad in order to fund its current account deficits. In 2009 and 2010, however, it reduced its net borrowing significantly. Capacity enhancing capital formation (I c ): Slovenia s investment ratio has been well above the euro zone average since CEP Default Index: The Index has only positive values. Slovenia s capital expenditure is above the net borrowing, though lately its Index values have dropped significantly. Risk category 2: Apart from 2002, when Slovenia s foreign indebtedness decreased, the solvency trend of the country has been uncertain. Due to its high investment ratio in the past, however, it cannot yet be concluded that Slovenia s creditworthiness is under threat, but the further trend of the CEP Default Index needs to be observed. Outlook: The trend line is slightly negative. If the country is not to be pulled into insolvency by other states, it should start enacting reforms to ensure that the relationship between capital formation and net borrowings are improved. Overview table 8

10 Risk category 2 Slovakia Net lending or net borrowing of the total economy (NTE): Since 2001, Slovakia has been a net borrower. The country has taken foreign credits every year to cover its demand for goods and services. In 2009 and 2010, however, the net borrowing dropped significantly. Capacity enhancing capital formation (I c ): Capital formation in Slovakia were above the euro zone average for many years, but in 2009 and 2010 they dropped significantly. Slovakia has been hit strongest by the financial crisis with its investment ratio declining by 77%. CEP Default Index: The CEP Index was continuously negative until 2006 as mathematically, a part of the foreign credits were consumed. After positive values in 2007 and 2008 and a slightly negative value in 2009, the Index just managed to reach the positive range in Risk category 2: Slovakia s solvency deteriorated continually between 2001 and 2006; this changed in Apart from the recession year of 2009, the solvency trend is uncertain. Outlook: The rising trend line shows that the net borrowing is falling. If this trend continues, Slovakia can start to reduce their foreign debts in the coming years. Overview table 9
: For many years, Ireland had a very high investment ratio.")
11 Risk category 2 Ireland Net lending or net borrowing of the total economy (NTE): Since 2001, Ireland has had continual capital import surpluses, with very high values in 2007 and In 2009 and 2010, however, the financial deficits decreased significantly. Capacity enhancing capital formation (I c ): For many years, Ireland had a very high investment ratio. From 2005 to 2007, Irish capital formation was almost twice as high as the euro zone average. In 2009, and even more so in 2010, the formation ratio dropped significantly. CEP Default Index: Since 2006, the CEP Default Index has fallen continually, although it remained slightly positive in During the last years, the decline in investment ratio was even stronger than the dismantling of capital import surpluses. Risk category 2: Although Ireland still belongs to risk category 2 with regard to 2010, in general a reliable statement as to its creditworthiness trend is not possible. The fact that Ireland has meanwhile had to resort to financial aid from the rescue package of the euro states, the EU and IMF does show, however, that the country s creditworthiness is highly questionable. The clearly falling CEP Default Index and diminishing capital formation substantiate this finding. Outlook: The trend is clearly negative. Without sweeping and quickly acting reforms, Ireland will slide down to risk category 3. It remains to be seen whether the structural reforms that have meanwhile been introduced will manage to avert this threat. Overview table 10

12 Risk category 3 France Net lending or net borrowing of the total economy (NTE): While from 2001 to 2003 France was still a net lender and even formed foreign assets, in 2004 it became a net borrower and since then has become one of the largest debtors. In 2010, the netted capital requirements were already at 3.8% of GDP. This represents a new indebtedness of 74 billion euro. Capacity enhancing capital formation (I c ): Until 2005, France s capital formation was on average 4% of GDP, increasing to 5% by Since then, it has dropped significantly, but it is still above the euro zone average. CEP Default Index: Apart from a period of stagnation in 2006 and 2007, the entire trend line shows a fall. In 2010, it dropped below zero for the first time. Hence, consumption expenditure exceeded the domestic income. The creditworthiness gap was 0.6% of GDP at 12 billion euro. Risk category 3: France has slid into increasingly higher risk categories. After solvency kept increasing until 2003, it was then uncertain for a longer period of time and clearly sank in The Index s negative trend suggests that France s creditworthiness actually fell even earlier. Outlook: Without a fundamental reform of the real economy, France is at risk of losing its creditworthiness. Overview table 11

13 Risk category 3 Spain Net lending or net borrowing of the total economy (NTE): Since 2001, Spain has been a net borrower. In order to fund its current account deficits, it has indebted itself more and more from year to year. In 2009, the net borrowing was reduced temporarily. In 2010, however, it was back at the same level as in Capacity enhancing capital formation (I c ): The Spanish capital formation ratio is very high. Since 2001 is has been well above the euro zone average. In 2009 and 2010, however, it was below former values. CEP Default Index: With one exception, the Index has been falling continuously since 2004: there has been more and more consumption, but an increasingly small share of the domestic income and the net borrowing has been used for capital formation. In 2008 and 2010, consumption expenditure even exceeded the domestic income. Thus, in mathematical terms, Spain has had to use its net borrowing for consumption. In 2010, the creditworthiness gap was 1.6% of GDP at 17 billion euro. Risk category 3: Spain s solvency trend was uncertain for a long period of time, as the lending demand was offset against by capital formation which, at least mathematically, had to be used for foreign credits. At least in 2008 and 2010, Spain was living from its substance; it is in those years that its creditworthiness decreased. According to the negative Index trend, Spain s creditworthiness started to erode much earlier. Outlook: Structural reforms are necessary to avert the falling trend of the CEP Default Index. If only half-hearted measures are taken, then Spain s solvency will be threatened substantially. Whether or not the adopted reforms will suffice remains to be seen. Overview table 12

14 Risk category 3 Italy Net lending or net borrowing of the total economy (NTE): In 2001, Italy was still a net lender, so that the economy formed foreign assets. Since 2002, however, the current account deficits have had to be funded through foreign credits. The capital requirements have increased constantly each year, apart from in 2004, 2007 and 2009 when it stagnated. Capacity enhancing capital formation (I c ): Until 2007, capital formation stood at 4% of GDP, or more. In 2008, it decreased significantly and more or less collapsed in 2009 with a drop of more than half. CEP Default Index: Since 2001, the Index has continued to fall continuously, apart from in 2004 and For the first time in 2009 and again in 2010 a part of the net borrowings were not encountered by capital formation. Italy s creditworthiness gap of at least 1.5% of GDP at 22 billion euro in 2009 grew to at least 2.5% at 38 billion euro in Risk category 3: While in 2001 solvency increased, as from 2002 the trend seemed uncertain. The systematically falling Index values in those years suggest diminishing creditworthiness. This is further substantiated by the clear figures since 2009: in 2009 and in 2010 even more so, the insolvency risk rose significantly. Outlook: Without fundamental and rapid real economy reforms, the tendency towards diminishing solvency will consolidate further. In view of the postponement of such reforms, as agreed upon at the end of June 2011, to the period starting in 2013, Italy is at risk of sliding into risk category 4 where an increasing insolvency risk is consolidated. Overview table 13
: From 2001 to 2004, capital formation was below the euro zone average.")
15 Risk category 4 Malta Net lending or net borrowing of the total economy (NTE): Since 2003, Malta has been a net borrower due to current account deficits. In 2009, the lowest level was reached. In 2010, however, the financial deficit was reduced by more than a half. Capacity enhancing capital formation (I c ): From 2001 to 2004, capital formation was below the euro zone average. In 2005, when Malta joined the European exchange rate mechanism II, it increased in leaps and bounds. In 2008, when Malta accepted the euro, it dropped again and never really recovered. CEP Default Index: In 2003, the Index values were positive as at least mathematically Malta s capital import was offset against capital formation. In 2004 for the first time and since 2008 constantly, Malta has been using a part of its capital imports for consumptionin 2009, almost the total capital import was consumed. In 2010, it was however possible to reduce the assumed minimum creditworthiness gap, which in 2009 was 5.9% of GDP at 346 million euro, to 0.6% of GDP at 36 million euro. Risk category 4: For three years Malta has had a negative CEP Default Index. The diminishing solvency of the Maltese economy has therefore been consolidated. Outlook: Despite a reduction in the creditworthiness gap in 2010, the statistical trend line continues to be negative. It remains to be seen whether the trend in the last year will prove to have been a turning point in the economic recovery of Malta. Overview table 14

16 Risk category 4 Cyprus Net lending or net borrowing of the total economy (NTE): Since 2001, Cyprus has consistently imported more capital than it exported. In 2008, when it joined the EU, the country had a financial deficit of 17% of GDP, a value that had and has never been reached before by any other euro country. Following a clear reduction in the financial deficit in 2009, it increased again in Since Cyprus became a member of the monetary union, its debt increased on average by 11.3% of GDP per year. This corresponds exactly to Greece s value since it joined the monetary union. Capacity enhancing capital formation (I c ): Since 2002, Cyprus capital formation ratio has been above the euro zone average. Even during the financial crisis it proved to be quite robust. The fall of 20% in 2009 was the lowest of all euro states. CEP Default Index: Since 2005, when Cyprus joined the European exchange rate mechanism II, the Index values have been negative. Since then, consumption expenditure is above the domestic income. In 2008, foreign credits to the amount of 9.4% of GDP were used for consumption. On reducing the creditworthiness gap in 2009, in 2010 it rose to at least 4.4% of GDP at 776 million euro. Since adopting the euro, it has been on average 5.1% of GDP. Within the euro area, this value is exceeded only by Greece. Risk category 4: Since 2005, Cyprus solvency has decreased steadily. The country is in danger of sliding into insolvency unless substantial real economy reforms are carried out without delay. Overview table 15

17 Risk category 4 Portugal Net lending or net borrowing of the total economy (NTE): Due to its current account deficits, since 2001 Portugal has had a substantial net borrowing demand. The net borrowing was, however, slightly reduced in 2009 and Capacity enhancing capital formation (I c ): Since 2001, Portugal s capital formation ratio has fallen continuously, apart from a period of stagnation in 2007 and The decline was particularly strong in 2009 and CEP Default Index: Apart from in 2003, Portugal demonstrates negative Index values. The slight reduction of the net borrowing in 2009 and 2010 was overcompensated through the decline in capital formation, so that even then the Index showed its lowest values. The creditworthiness gap was at least 7.5% of GDP in 2010 at 13 billion euro. Risk category 4: The creditworthiness of Portugal has been continually declining since In 2011, this trend culminated when the country required financial aid from the rescue package of the euro states, the EU and the IMF in order not to become insolvent. In fact, the country is no longer creditworthy. Outlook: Chances are low that Portugal will soon be creditworthy again in view of the latest developments. A precondition would be that the introduced reforms would cut consumption dramatically and thus make investments increase radically. The development of the capital formation ratio since 2009 is not very promising as regards the near future. Overview table 16

18 Risk category 4 Greece Net lending or net borrowing of the total economy (NTE): Since 2001, Greece has continuously needed net borrowing usually to the amount of 10% of GDP and more in order to fund its current account deficits through foreign credits. However, the capital requirements, which in 2008 were 15% of GDP, were reduced to 10.1% in 2010, which is the value of Capacity enhancing capital formation (I c ): From 2001 to 2008, capital formation was above the euro zone average. This changed in 2009 and in 2010, it was even negative for the first time; thus capital stock shrank. To date, this is unique within the euro zone. CEP Default Index: The Index was always negative, with the tendency growing steadily since Consumption expenditure exceeded more and more the domestic income. In 2010, it even exceeded the total domestic income and total net borrowing by 1.5% of GDP. This consumption was funded through disinvestments. The decline in net borrowing after 2008 was overcompensated for through a drop in capital formation. In 2010, the creditworthiness gap was at least 11.6% of GDP at 27 billion euro. Risk category 4: Greece s solvency has not just been diminishing in the last three years but continuously since The country is not creditworthy. Outlook: The chances that Greece will return into the positive Index area in the medium-term are minimal. Structural reforms would have to boost the economy dramatically, yet in 2010, the net capital formation ratio was even negative. The country is basically impoverished and any chances of a return to the capital market are currently not foreseeable. Overview table 17
Quarterly Financial Accounts Household net worth reaches new peak in Q Irish Household Net Worth
 Quarterly Financial Accounts Q4 2017 4 May 2018 Quarterly Financial Accounts Household net worth reaches new peak in Q4 2017 Household net worth rose by 2.1 per cent in Q4 2017. It now exceeds its pre-crisis
cepstudy cepdefault-index 2018 Creditworthiness Trends of Eurozone Countries Lüder Gerken, Matthias Kullas and Till Brombach
 cepstudy cepdefault-index 2018 Creditworthiness Trends of Eurozone Countries Lüder Gerken, Matthias Kullas and Till Brombach January 2018 II cepstudy cepdefault-index 2018 Key Issues The cepdefault-index
Eurozone. EY Eurozone Forecast March 2014
 Eurozone EY Eurozone Forecast March 2014 Austria Belgium Cyprus Estonia Finland France Germany Greece Ireland Italy Latvia Luxembourg Malta Netherlands Portugal Slovakia Slovenia Spain Outlook for Germany
Eurozone. EY Eurozone Forecast September 2014
 Eurozone EY Eurozone Forecast September 2014 Austria Belgium Cyprus Estonia Finland France Germany Greece Ireland Italy Latvia Luxembourg Malta Netherlands Portugal Slovakia Slovenia Spain Outlook for
EU-28 RECOVERED PAPER STATISTICS. Mr. Giampiero MAGNAGHI On behalf of EuRIC
 EU-28 RECOVERED PAPER STATISTICS Mr. Giampiero MAGNAGHI On behalf of EuRIC CONTENTS EU-28 Paper and Board: Consumption and Production EU-28 Recovered Paper: Effective Consumption and Collection EU-28 -
Eurozone. EY Eurozone Forecast June 2014
 Eurozone EY Eurozone Forecast June 2014 Austria Belgium Cyprus Estonia Finland France Germany Greece Ireland Italy Latvia Luxembourg Malta Netherlands Slovakia Slovenia Spain Outlook for exits bailout,
Eurozone. EY Eurozone Forecast March 2015
 Eurozone EY Eurozone Forecast March 2015 Austria Belgium Cyprus Estonia Finland France Germany Greece Ireland Italy Latvia Lithuania Luxembourg Malta Netherlands Slovakia Slovenia Spain Outlook for Modest
GREEK ECONOMIC OUTLOOK
 CENTRE OF PLANNING AND ECONOMIC RESEARCH Issue 27, June 2015 GREEK ECONOMIC OUTLOOK Macroeconomic analysis and projections Public finance Human resources and social policies Development policies and sectors
Preliminary results of International Trade in 2014: in nominal terms exports increased by 1.8% and imports increased by 3.
 International Trade Statistics 7 July, 215 Preliminary results of International Trade in : in nominal terms exports increased by 1.8% and imports increased by 3.2% vis-à-vis 213 In, exports of goods increased
DG TAXUD. STAT/11/100 1 July 2011
 DG TAXUD STAT/11/100 1 July 2011 Taxation trends in the European Union Recession drove EU27 overall tax revenue down to 38.4% of GDP in 2009 Half of the Member States hiked the standard rate of VAT since
Consumer Credit. Introduction. June, the 6th (2013)
") Consumer Credit in Europe at end-2012 Introduction Crédit Agricole Consumer Finance has published its annual survey of the consumer credit market in 27 European Union countries (EU-27) for the sixth year
Consumer Credit in Europe at end-2012 Introduction Crédit Agricole Consumer Finance has published its annual survey of the consumer credit market in 27 European Union countries (EU-27) for the sixth year
1 World Economy. Value of Finnish Forest Industry Exports Fell by Almost a Quarter in 2009
 1 World Economy The recovery in the world economy that began during 2009 has started to slow since spring 2010 as stocks are replenished and government stimulus packages are gradually brought to an end.
EU BUDGET AND NATIONAL BUDGETS
 DIRECTORATE GENERAL FOR INTERNAL POLICIES POLICY DEPARTMENT ON BUDGETARY AFFAIRS EU BUDGET AND NATIONAL BUDGETS 1999-2009 October 2010 INDEX Foreward 3 Table 1. EU and National budgets 1999-2009; EU-27
EUROPA - Press Releases - Taxation trends in the European Union EU27 tax...of GDP in 2008 Steady decline in top corporate income tax rate since 2000
 DG TAXUD STAT/10/95 28 June 2010 Taxation trends in the European Union EU27 tax ratio fell to 39.3% of GDP in 2008 Steady decline in top corporate income tax rate since 2000 The overall tax-to-gdp ratio1
Eurozone Ernst & Young Eurozone Forecast June 2013
 Eurozone Ernst & Young Eurozone Forecast June 2013 Austria Belgium Cyprus Estonia Finland France Germany Greece Ireland Italy Luxembourg Malta Netherlands Portugal Slovakia Slovenia Spain Ernst & Young
Latvia and the Euro. Ilmārs Rimšēvičs Governor. Latvijas Banka
 Latvia and the Euro Ilmārs Rimšēvičs Governor. Latvijas Banka October, 2013 Despite loud ex ante warnings of protracted recession risks under internal adjustment scenario, a strong V shaped recovery followed
Eurozone. EY Eurozone Forecast June 2014
 Eurozone EY Eurozone Forecast June 2014 Austria Belgium Cyprus Estonia Finland France Germany Greece Ireland Italy Latvia Luxembourg Malta Netherlands Portugal Slovakia Slovenia Spain Outlook for Finland
Statistical Release 06 November 2017
 Statistical Release 06 November 2017 Quarterly Financial Accounts Household investment in deposits at highest level in nine years Household investment in deposits was 1bn in Q2 2017, its highest level
Eurozone Ernst & Young Eurozone Forecast Summer edition June 2011
 Eurozone Ernst & Young Eurozone Forecast Summer edition June 2011 Austria Belgium Cyprus Estonia Finland France Germany Greece Ireland Italy Luxembourg Malta Netherlands Portugal Slovakia Slovenia Spain
Consumer credit market in Europe 2013 overview
 Consumer credit market in Europe 2013 overview Crédit Agricole Consumer Finance published its annual survey of the consumer credit market in 28 European Union countries for seven years running. 9 July
: Monetary Economics and the European Union. Lecture 8. Instructor: Prof Robert Hill. The Costs and Benefits of Monetary Union II
 320.326: Monetary Economics and the European Union Lecture 8 Instructor: Prof Robert Hill The Costs and Benefits of Monetary Union II De Grauwe Chapters 3, 4, 5 1 1. Countries in Trouble in the Eurozone
Eurozone. EY Eurozone Forecast September 2013
 Eurozone EY Eurozone Forecast September 2013 Austria Belgium Cyprus Estonia Finland France Germany Greece Ireland Italy Luxembourg Malta Netherlands Portugal Slovakia Slovenia Spain Outlook for Ireland
Eurozone. EY Eurozone Forecast September 2014
 Eurozone EY Eurozone Forecast September 214 Austria Belgium Cyprus Estonia Finland France Germany Greece Ireland Italy Latvia Luxembourg Malta Netherlands Portugal Slovakia Slovenia Spain Outlook for Cyprus
Eurozone. EY Eurozone Forecast June 2014
 Eurozone EY Eurozone Forecast June 214 Austria Belgium Cyprus Estonia Finland France Germany Greece Ireland Italy Latvia Luxembourg Malta Netherlands Portugal Slovakia Slovenia Spain Outlook for Slovenia
Eurozone. EY Eurozone Forecast December 2013
 Eurozone EY Eurozone Forecast December 213 Austria Belgium Cyprus Estonia Finland France Germany Greece Ireland Italy Luxembourg Malta Netherlands Portugal Slovakia Slovenia Spain Outlook for Germany Strong
Eurozone. EY Eurozone Forecast March 2015
 Eurozone EY Eurozone Forecast March 2015 Austria Belgium Cyprus Estonia Finland France Germany Greece Ireland Italy Latvia Lithuania Luxembourg Netherlands Portugal Slovakia Slovenia Spain Outlook for
Monetary Integration
 Monetary Integration By Michael Möhnle Table of Contents 1. 6-Stages of Economic Integration 2. International Monetary Integration - Bretton Woods 3. European Monetary Integration 4. European (Economic
Eurozone. EY Eurozone Forecast December 2013
 Eurozone EY Eurozone Forecast December 2013 Austria Belgium Cyprus Estonia Finland France Germany Greece Ireland Italy Luxembourg Malta Netherlands Portugal Slovakia Slovenia Spain Outlook for Cyprus Severe
Fiscal rules in Lithuania
 Fiscal rules in Lithuania Algimantas Rimkūnas Vice Minister, Ministry of Finance of Lithuania 3 June, 2016 Evolution of National and EU Fiscal Regulations Stability and Growth Pact (SGP) Maastricht Treaty
Foreign public debt in Euro area countries
 1 Foreign public debt in Euro area countries Introduction Public debt is one of the main categories used to analyze a state s debt. Growing public debt, and in particular an increase in foreign liability,
ILO World of Work Report 2013: EU Snapshot
 Greece Spain Ireland Poland Belgium Portugal Eurozone France Slovenia EU-27 Cyprus Denmark Netherlands Italy Bulgaria Slovakia Romania Lithuania Latvia Czech Republic Estonia Finland United Kingdom Sweden
EMPLOYMENT RATE Employed/Working age population (15 64 years)
") EMPLOYMENT RATE 198 26 Employed/Working age population (15 64 years 8 % Finland 75 EU 15 EU 25 7 65 6 55 5 8 82 84 86 88 9 92 94 96 98 2 4** 6** 14.4.25/SAK /TL Source: European Commission 1 UNEMPLOYMENT
EMPLOYMENT RATE 198 26 Employed/Working age population (15 64 years 8 % Finland 75 EU 15 EU 25 7 65 6 55 5 8 82 84 86 88 9 92 94 96 98 2 4** 6** 14.4.25/SAK /TL Source: European Commission 1 UNEMPLOYMENT
Impact of Greece Debt Crisis on World Economy
 Impact of Greece Debt Crisis on World Economy Kovid Kumar Gupta 1 kovid.gupta@gmail.com Abstract This study aims at exploring the reasons behind the Greece debt crisis that emerged in the 21 st century
Taxation trends in the European Union EU27 tax ratio at 39.8% of GDP in 2007 Steady decline in top personal and corporate income tax rates since 2000
 DG TAXUD STAT/09/92 22 June 2009 Taxation trends in the European Union EU27 tax ratio at 39.8% of GDP in 2007 Steady decline in top personal and corporate income tax rates since 2000 The overall tax-to-gdp
Statistical Release 11 September 2017
 Statistical Release 11 September 2017 Quarterly Financial Accounts Irish household debt continues to decrease more than any other EU country, falling to 145 per cent of disposable income Irish household
Overview of EU public finances
 6 volume 17, 12/29B I Overview of EU public finances PRE-CRISIS DEVELOPMENTS Public finance developments in the EU up to 28 can be divided into three stages: In 1997, the Stability and Growth Pact entered
Eurozone. EY Eurozone Forecast September 2013
 Eurozone EY Eurozone Forecast September 213 Austria Belgium Cyprus Estonia Finland France Germany Greece Ireland Italy Luxembourg Malta Netherlands Portugal Slovakia Slovenia Spain Outlook for Greece Rising
Eurozone. EY Eurozone Forecast September 2014
 Eurozone EY Eurozone Forecast September 2014 Austria Belgium Cyprus Estonia Finland France Germany Greece Ireland Italy Latvia Luxembourg Malta Netherlands Portugal Slovakia Slovenia Spain Outlook for
The European economy since the start of the millennium
 The European economy since the start of the millennium A STATISTICAL PORTRAIT 2018 edition 1 Since the start of the millennium, the European economy has evolved and statistics can help to better perceive
STAT/12/ October Household saving rate fell in the euro area and remained stable in the EU27. Household saving rate (seasonally adjusted)
") STAT/12/152 30 October 2012 Quarterly Sector Accounts: second quarter of 2012 Household saving rate down to 12.9% in the euro area and stable at 11. in the EU27 Household real income per capita fell by
STAT/12/152 30 October 2012 Quarterly Sector Accounts: second quarter of 2012 Household saving rate down to 12.9% in the euro area and stable at 11. in the EU27 Household real income per capita fell by
Auditor s involvement in the contributions to the Single Resolution Fund. Providing assurance for 2014 and 2015 SURVEY
 Auditor s involvement in the contributions to the Single Resolution Fund Providing assurance for 2014 and 2015 SURVEY AUDIT & ASSURANCE SEPTEMBER 2016 HIGHLIGHTS This survey demonstrates divergence across
Courthouse News Service
 14/2009-30 January 2009 Sector Accounts: Third quarter of 2008 Household saving rate at 14.4% in the euro area and 10.7% in the EU27 Business investment rate at 23.5% in the euro area and 23.6% in the
Eurozone Ernst & Young Eurozone Forecast June 2013
 Eurozone Ernst & Young Eurozone Forecast June 2013 Austria Belgium Cyprus Estonia Finland France Germany Greece Ireland Italy Luxembourg Malta Netherlands Portugal Slovakia Slovenia Spain Ernst & Young
EMPLOYMENT RATE IN EU-COUNTRIES 2000 Employed/Working age population (15-64 years)
") EMPLOYMENT RATE IN EU-COUNTRIES 2 Employed/Working age population (15-64 years EU-15 Denmark Netherlands Great Britain Sweden Portugal Finland Austria Germany Ireland Luxembourg France Belgium Greece Spain
EMPLOYMENT RATE IN EU-COUNTRIES 2 Employed/Working age population (15-64 years EU-15 Denmark Netherlands Great Britain Sweden Portugal Finland Austria Germany Ireland Luxembourg France Belgium Greece Spain
Eurozone. EY Eurozone Forecast March 2015
 Eurozone EY Eurozone Forecast March 2015 Austria Belgium Cyprus Estonia Finland France Germany Greece Ireland Italy Latvia Lithuania Luxembourg Malta Netherlands Portugal Slovakia Slovenia Spain Outlook
Irish Economy and Growth Legal Framework for Growth and Jobs High Level Workshop, Sofia
 Irish Economy and Growth Legal Framework for Growth and Jobs High Level Workshop, Sofia Diarmaid Smyth, Central Bank of Ireland 18 June 2015 Agenda 1 Background to Irish economic performance 2 Economic
THE ECONOMY AND THE BANKING SECTOR IN BULGARIA
 THE ECONOMY AND THE BANKING SECTOR IN BULGARIA THIRD QUARTER OF 2018 SOFIA HIGHLIGHTS The Bulgarian economy recorded growth of 3,2% on an annual basis in Q2 2018, driven by the private consumption and
OVERVIEW. The EU recovery is firming. Table 1: Overview - the winter 2014 forecast Real GDP. Unemployment rate. Inflation. Winter 2014 Winter 2014
 OVERVIEW The EU recovery is firming Europe's economic recovery, which began in the second quarter of 2013, is expected to continue spreading across countries and gaining strength while at the same time
Eurozone. EY Eurozone Forecast March 2014
 Eurozone EY Eurozone Forecast March 214 Austria Belgium Cyprus Estonia Finland France Germany Greece Ireland Italy Latvia Luxembourg Malta Netherlands Portugal Slovakia Slovenia Spain Outlook for Estonia
The regional analyses
 The regional analyses EU & EFTA On average, in the EU & EFTA region, the case study company has a Total Tax Rate of 41.1%, made 13.1 tax payments and took 179 hours to comply with its tax obligations in
CANADA EUROPEAN UNION
 THE EUROPEAN UNION S PROFILE Economic Indicators Gross domestic product (GDP) at purchasing power parity (PPP): US$20.3 trillion (2016) GDP per capita at PPP: US$39,600 (2016) Population: 511.5 million
Eurozone. EY Eurozone Forecast September 2013
 Eurozone EY Eurozone Forecast September 213 Austria Belgium Cyprus Estonia Finland France Germany Greece Ireland Italy Luxembourg Malta Netherlands Portugal Slovakia Slovenia Spain Outlook for Germany
Eurozone. EY Eurozone Forecast September 2014
 Eurozone EY Eurozone Forecast September 2014 Austria Belgium Cyprus Estonia Finland France Germany Greece Ireland Italy Latvia Luxembourg Netherlands Portugal Slovakia Slovenia Spain Outlook for Stronger
The impact of the European System of Accounts 2010 on euro area macroeconomic statistics
 Box 8 The impact of the European System of Accounts 21 on euro area macroeconomic statistics The introduction of the new European System of Accounts 21 (ESA 21) in line with international statistical standards
74 ECB THE 2012 MACROECONOMIC IMBALANCE PROCEDURE
 Box 7 THE 2012 MACROECONOMIC IMBALANCE PROCEDURE This year s European Semester (i.e. the framework for EU policy coordination introduced in 2011) includes, for the first time, the implementation of the
139/ October 2006
 139/2006-23 October 2006 Provision of deficit and debt data for 2005 Euro area and EU25 government deficit at 2.4% and 2.3% of GDP respectively Government debt at 70.8% and 63.2% In 2005 the government
Taxation trends in the European Union Further increase in VAT rates in 2012 Corporate and top personal income tax rates inch up after long decline
 STAT/12/77 21 May 2012 Taxation trends in the European Union Further increase in VAT rates in 2012 Corporate and top personal income tax rates inch up after long decline The average standard VAT rate 1
Eurozone. EY Eurozone Forecast March 2014
 Eurozone EY Eurozone Forecast March 2014 Austria Belgium Cyprus Estonia Finland France Germany Greece Ireland Italy Latvia Luxembourg Malta Netherlands Portugal Slovakia Slovenia Spain Outlook for Belgium
Previsions Macroeconòmiques. Macroeconomic scenario for the Catalan economy 2017 and June 2017
 PM Previsions Macroeconòmiques Macroeconomic scenario for the Catalan economy 2017 and 2018 June 2017 Previsions macroeconòmiques Macroeconomic scenario for the Catalan economy June 2017 ISSN: 2013-2182
Lowest implicit tax rates on labour in Malta, on consumption in Spain and on capital in Lithuania
 STAT/13/68 29 April 2013 Taxation trends in the European Union The overall tax-to-gdp ratio in the EU27 up to 38.8% of GDP in 2011 Labour taxes remain major source of tax revenue The overall tax-to-gdp
STAT/07/55 23 April 2007
 STAT/07/55 23 April 2007 Provision of deficit and debt data for 2006 Euro area and EU27 government deficit at 1.6% and 1.7% of GDP respectively Government debt at 69.0% and 61.7% In 2006, the government
Eurozone Ernst & Young Eurozone Forecast Spring edition March 2012
 Eurozone Ernst & Young Eurozone Forecast Spring edition March 2012 Austria Belgium Cyprus Estonia Finland France Germany Greece Ireland Italy Luxembourg Malta Netherlands Portugal Slovakia Slovenia Spain
Main Economic & Financial Indicators Eurozone
 Main Economic & Financial Indicators Eurozone 30 MARCH 2015 AKIKO DARVELL ASSOCIATE ECONOMIST ECONOMIC RESEARCH OFFICE (LONDON) T +44(0)2075771591 E akiko.darvell@uk.mufg.jp The Bank of TokyoMitsubishi
Eurozone. EY Eurozone Forecast September 2014
 Eurozone EY Eurozone Forecast September 2014 Austria Belgium Cyprus Estonia Finland France Germany Greece Ireland Italy Latvia Luxembourg Malta Netherlands Portugal Slovakia Slovenia Spain Outlook for
January 2005 Euro-zone external trade deficit 2.2 bn euro 14.0 bn euro deficit for EU25
 42/2005-23 March 2005 January 2005 Euro-zone external trade deficit 2.2 14.0 deficit for EU25 The first estimate for euro-zone 1 trade with the rest of the world in January 2005 was a 2.2 billion euro
PUBLIC FINANCE IN THE EU: FROM THE MAASTRICHT CONVERGENCE CRITERIA TO THE STABILITY AND GROWTH PACT
 8 : FROM THE MAASTRICHT CONVERGENCE CRITERIA TO THE STABILITY AND GROWTH PACT Ing. Zora Komínková, CSc., National Bank of Slovakia With this contribution, we open up a series of articles on public finance
Governor of the Bank of Latvia
 Lessons from Latvia s internal adjustment strategy Ilmārs Rimšēvičs Governor of the Bank of Latvia September 4, 2012 Presentation outline Overheating of Latvia s economy Expansionary consolidation Lessons
Eurozone Ernst & Young Eurozone Forecast Autumn edition September 2011
 Eurozone Ernst & Young Eurozone Forecast Autumn edition September 2011 Austria Belgium Cyprus Estonia Finland France Germany Greece Ireland Italy Luxembourg Malta Netherlands Portugal Slovakia Slovenia
STAT/09/56 22 April 2009
 STAT/09/56 22 April 2009 Provision of deficit and debt data for 2008 - first notification Euro area and EU27 government deficit at 1.9% and 2.3% of GDP respectively Government debt at 69.3% and 61.5% In
Eurozone Ernst & Young Eurozone Forecast Spring edition March 2012
 Eurozone Ernst & Young Eurozone Forecast Spring edition March 2012 Austria Belgium Cyprus Estonia Finland France Germany Greece Ireland Italy Luxembourg Malta Netherlands Portugal Slovakia Slovenia Spain
August 2005 Euro-zone external trade deficit 2.6 bn euro 14.2 bn euro deficit for EU25
 STAT/05/132 20 October 2005 August 2005 Euro-zone external trade deficit 2.6 14.2 deficit for EU25 The first estimate for euro-zone 1 trade with the rest of the world in August 2005 was a 2.6 billion euro
Eurozone Ernst & Young Eurozone Forecast Winter edition December 2012
 Eurozone Ernst & Young Eurozone Forecast Winter edition December 2012 Austria Belgium Cyprus Estonia Finland France Germany Greece Ireland Italy Luxembourg Malta Netherlands Portugal Slovakia Slovenia
European Advertising Business Climate Index Q4 2016/Q #AdIndex2017
 European Advertising Business Climate Index Q4 216/Q1 217 ABOUT Quarterly survey of European advertising and market research companies Provides information about: managers assessment of their business
1. a. The accompanying table shows each nation s real GDP per capita in terms of its. per capita per capita. Percentage of 1960 real GDP per capita
 AP Krugman Section 7 Problem Solutions 1. a. The accompanying table shows each nation s in terms of its 1960 and 2000 levels. Year Real GDP (2000 Argentina of 1960 of 2000 Real GDP per capita (2000 Ghana
HOUSEHOLD FINANCE AND CONSUMPTION SURVEY: A COMPARISON OF THE MAIN RESULTS FOR MALTA WITH THE EURO AREA AND OTHER PARTICIPATING COUNTRIES
 HOUSEHOLD FINANCE AND CONSUMPTION SURVEY: A COMPARISON OF THE MAIN RESULTS FOR MALTA WITH THE EURO AREA AND OTHER PARTICIPATING COUNTRIES Article published in the Quarterly Review 217:2, pp. 27-33 BOX
Chart pack to council for cooperation on macroprudential policy
 Chart pack to council for cooperation on macroprudential policy Contents List of charts... 3 Macro and macro-financial setting... 5 Swedish macroeconomic setting... 5 Foreign macroeconomic setting... Macro-financial
Burden of Taxation: International Comparisons
 Burden of Taxation: International Comparisons Standard Note: SN/EP/3235 Last updated: 15 October 2008 Author: Bryn Morgan Economic Policy & Statistics Section This note presents data comparing the national
May 2012 Euro area international trade in goods surplus of 6.9 bn euro 3.8 bn euro deficit for EU27
 108/2012-16 July 2012 May 2012 Euro area international trade in goods surplus of 6.9 3.8 deficit for EU27 The first estimate for the euro area 1 (EA17) trade in goods balance with the rest of the world
THE ECONOMY AND THE BANKING SECTOR IN BULGARIA
 THE ECONOMY AND THE BANKING SECTOR IN BULGARIA SECOND QUARTER OF 2018 SOFIA HIGHLIGHTS The Bulgarian economy recorded growth of 3,6% on an annual basis in Q1 2018, driven by the private consumption and
Investment in Germany and the EU
 Investment in Germany and the EU Pedro de Lima Head of the Economics Studies Division Economics Department Berlin 19/12/2016 11/01/2017 1 Slow recovery of investment, with strong heterogeneity Overall
First estimate for 2011 Euro area external trade deficit 7.7 bn euro bn euro deficit for EU27
 27/2012-15 February 2012 First estimate for 2011 Euro area external trade deficit 7.7 152.8 deficit for EU27 The first estimate for the euro area 1 (EA17) trade in goods balance with the rest of the world
Macroeconomic scenarios for skill demand and supply projections, including dealing with the recession
 Alphametrics (AM) Alphametrics Ltd Macroeconomic scenarios for skill demand and supply projections, including dealing with the recession Paper presented at Skillsnet technical workshop on: Forecasting
Problems of monetary integration with the euro area:the case of Poland
 Problems of monetary integration with the euro area:the case of Poland Prof. Andrzej Kaźmierczak, PhD Warsaw School of Economics Monetary Policy Council Member 1 Contents 1. Conditions of effective functioning
STATISTICAL REFLECTIONS
 STATISTICAL REFLECTIONS 29 January 2016 Contents Introduction...1 Changes in property transactions...1 Annual price indices...1 Quarterly pure price index...2 Factors of overall price in the market of
Eurozone. EY Eurozone Forecast March 2015
 Eurozone EY Eurozone Forecast March 2015 Austria Belgium Cyprus Estonia Finland France Germany Greece Ireland Italy Latvia Lithuania Luxembourg Malta Netherlands Portugal Slovakia Slovenia Spain Outlook
The Outlook for the European and the German Economy
 The Outlook for the European and the German Economy Annual Economic Forum of the German American Chamber of Commerce Chicago January 26, 2012 Joachim Scheide, Kiel Institute for the World Economy Once
THE EU S ECONOMIC RECOVERY PICKS UP MOMENTUM
 THE EU S ECONOMIC RECOVERY PICKS UP MOMENTUM ECONOMIC SITUATION The EU economy saw a pick-up in growth momentum at the beginning of this year, boosted by strong business and consumer confidence. Output
PUBLIC PROCUREMENT INDICATORS 2011, Brussels, 5 December 2012
 PUBLIC PROCUREMENT INDICATORS 2011, Brussels, 5 December 2012 1. INTRODUCTION This document provides estimates of three indicators of performance in public procurement within the EU. The indicators are
EMPLOYMENT RATE Employed/Working age population (15-64 years)
") 1 EMPLOYMENT RATE 1980-2003 Employed/Working age population (15-64 years 80 % Finland (Com 75 70 65 60 EU-15 Finland (Stat. Fin. 55 50 80 82 84 86 88 90 92 94 96 98 00 02 9.9.2002/SAK /TL Source: European
1 EMPLOYMENT RATE 1980-2003 Employed/Working age population (15-64 years 80 % Finland (Com 75 70 65 60 EU-15 Finland (Stat. Fin. 55 50 80 82 84 86 88 90 92 94 96 98 00 02 9.9.2002/SAK /TL Source: European
June 2012 Euro area international trade in goods surplus of 14.9 bn euro 0.4 bn euro surplus for EU27
 121/2012-17 August 2012 June 2012 Euro area international trade in goods surplus of 14.9 0.4 surplus for EU27 The first estimate for the euro area 1 (EA17) trade in goods balance with the rest of the world
ECONOMIC AND MONETARY DEVELOPMENTS
 Box 2 RECENT WIDENING IN EURO AREA SOVEREIGN BOND YIELD SPREADS This box looks at recent in euro area countries sovereign bond yield spreads and the potential roles played by credit and liquidity risk.
August 2012 Euro area international trade in goods surplus of 6.6 bn euro 12.6 bn euro deficit for EU27
 146/2012-16 October 2012 August 2012 Euro area international trade in goods surplus of 6.6 12.6 deficit for EU27 The first estimate for the euro area 1 (EA17) trade in goods balance with the rest of the
TUC Statement on the HM Treasury Spring Statement : Time for action
 TUC Statement on the HM Treasury Spring Statement : Time for action Time for action At the Autumn Budget the Chancellor looked to a future that will be full of change; full of new challenges and above
Schwerpunkt Außenwirtschaft 2016/17 Austrian economic activity, Austria's price competitiveness and a summary on external trade
 Schwerpunkt Außenwirtschaft /7 Austrian economic activity, Austria's price competitiveness and a summary on external trade Christian Ragacs, Klaus Vondra Abteilung für volkswirtschaftliche Analysen, OeNB
Insolvency forecasts. Economic Research August 2017
 Insolvency forecasts Economic Research August 2017 Summary We present our new insolvency forecasting model which offers a broader scope of macroeconomic developments to better predict insolvency developments.
Themes Income and wages in Europe Wages, productivity and the wage share Working poverty and minimum wage The gender pay gap
 5. W A G E D E V E L O P M E N T S At the ETUC Congress in Seville in 27, wage developments in Europe were among the most debated issues. One of the key problems highlighted in this respect was the need
Live Long and Prosper? Demographic Change and Europe s Pensions Crisis. Dr. Jochen Pimpertz Brussels, 10 November 2015
 Live Long and Prosper? Demographic Change and Europe s Pensions Crisis Dr. Jochen Pimpertz Brussels, 10 November 2015 Old-age-dependency ratio, EU28 45,9 49,4 50,2 39,0 27,5 31,8 2013 2020 2030 2040 2050
T5-Europe The Jus Semper Global Alliance 01/09/16 1 6
 Table-T5 Living-Wage-Gap and Equalisation analysis (vis-à-vis the U.S.) for all employed in the manufacturing sector in PPP for private consumption terms 1996-2015 (Europe) Beginning with the 2012 living-wage
The EU Craft and SME Barometer 2018/H2
 The EU Craft and SME Barometer 2018/H2 SMEs show stability at high level; SME Climate Index stabilises at 81.7 Internal demand fosters SMEs growth, yet no further acceleration is expected The UEAPME SME
Main Economic & Financial Indicators Eurozone
 Main Economic & Financial Indicators Eurozone 7 MAY 2015 AKIKO DARVELL ASSOCIATE ECONOMIST ECONOMIC RESEARCH OFFICE (LONDON) T +44(0)2075771591 E akiko.darvell@uk.mufg.jp The Bank of TokyoMitsubishi UFJ,