COMMON SIZE ANALYSIS EXERCISE SOLUTION
|
|
|
- Alberta Joseph
- 5 years ago
- Views:
Transcription


1 Department of Management and Law COMMON SIZE ANALYSIS EXERCISE SOLUTION Dr. Camilla Falivena
2
3 Common-Size Income Statement Common-Size Income Statement for William Demant Company Sales 100,00% 100,00% Production Costs 24,76% 25,97% GROSS PROFIT 75,24% 74,03% R&D costs 6,99% 7,15% Distribution costs 47,11% 43,97% Administrative expenses 5,63% 5,75% Share of profit after tax, associates and joint ventures 0,67% 0,45% OPERATING PROFIT (EBIT) 16,18% 17,61%
4
5 Common-Size Balance Sheet Common-Size Balance Sheet for William Demant Company Assets Equity and liabilities Goodwill 40,37% 39,33% Share capital 0,34% 0,38% Patents and licences 0,33% 0,15% Other reserves 44,43% 44,79% Other intangible assets 1,86% 1,91% Equity attributable to Willima Demant Holding A/S's shareholders 44,77% 45,16% Prepayments and assets under development 0,98% 0,14% Equity attributable to minority interests 0,03% 0,01% INTANGIBLE ASSETS 43,53% 41,54% EQUITY 44,80% 45,17% Land and buildings 5,65% 6,25% Interest-bearing debt 12,61% 14,45% Plant and machinery 1,41% 1,27% Deferred tax liabilities 0,98% 0,87% Other plant, fixtures and other equipment 1,87% 1,98% Provisions 1,90% 1,90% Leasehold improvements 1,69% 1,71% Other liabilities 1,10% 0,83% Prepayments and assets under development 0,59% 1,07% Deferred income 1,09% 1,14% PROPERTY, PLANT AND EQUIPMENT 11,20% 12,29% NON-CURRENT LIABILITIES 17,67% 19,19% Investments in associates and joint ventures 3,75% 3,65% Interest-bearing debt 22,81% 21,20% Receivables from associates and joint ventures 2,46% 2,48% Trade payables 3,30% 3,38% Other investments 0,05% 0,08% Payables to associates and joint ventures 0,01% 0,01% Other receivables 3,47% 3,94% Income tax 0,95% 1,01% Deferred tax assets 2,55% 2,61% Provisions 0,21% 0,11% OTHER NON-CURRENT ASSETS 12,28% 12,77% Other liabilities 8,00% 7,63% Unrealised losses on financial contracts 0,30% 0,51% NON-CURRENT ASSETS 67,01% 66,59% Deferred income 1,94% 1,79% CURRENT LIABILITIES 37,52% 35,64% Inventories 8,36% 9,20% Trade receivables 15,69% 15,31% LIABILITIES 55,20% 54,83% Receivables from associates and joint ventures 0,46% 0,37% Income tax 0,94% 0,54% Other receivables 1,67% 1,92% Unrealised gains on financial contracts 0,07% 0,08% Prepaid expenses 1,23% 1,31% Cash 4,57% 4,68% CURRENT ASSETS 32,99% 33,41% TOTAL ASSETS 100,00% 100,00% EQUITY AND LIABILITIES 100,00% 100,00%
6
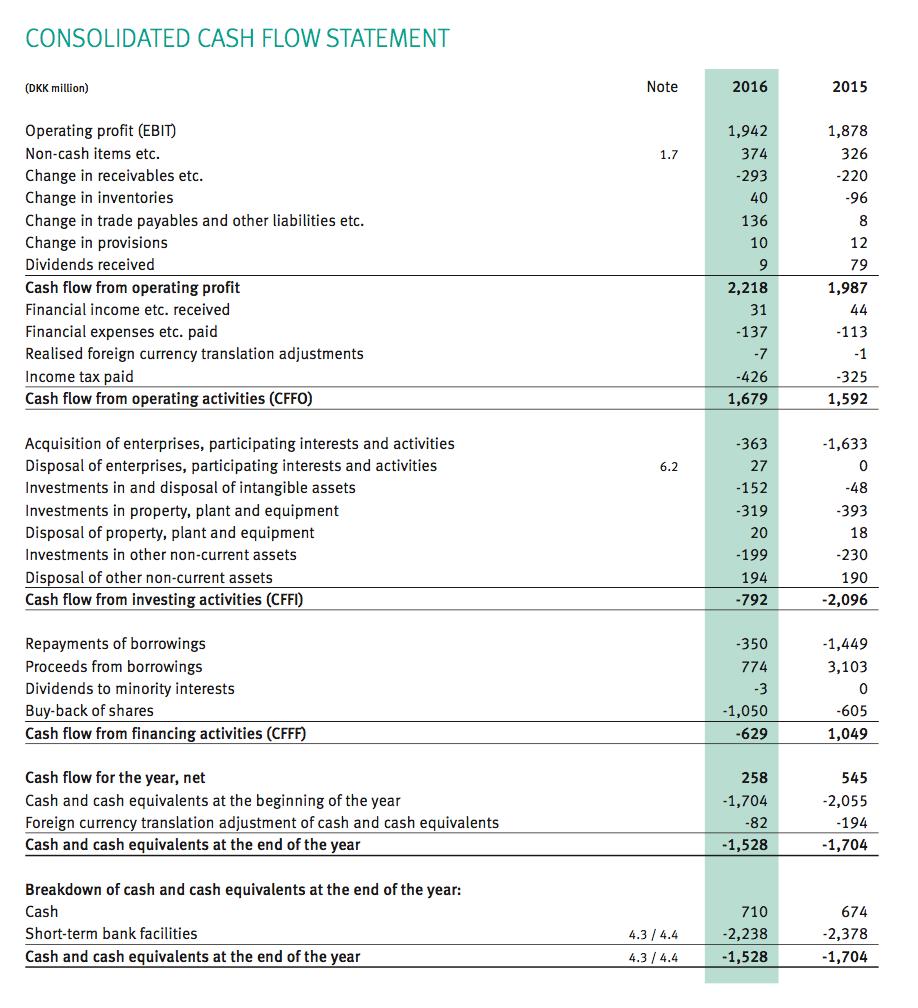
7 Common-Size Cash Flow Statement Common-Size Cash Flow Statement for William Demant Company % of Net Revenue Operating profit (EBIT) 16,18% 17,61% Non-cash items etc. 3,12% 3,06% Change in receivables etc. -2,44% -2,06% Change in inventories 0,33% -0,90% Change in trade payables and other liabilities etc. 1,13% 0,08% Change in provisions 0,08% 0,11% Dividends received 0,07% 0,74% Cash flow from operating profit 18,48% 18,63% Financial income etc. received 0,26% 0,41% Financial expenses etc. paid -1,14% -1,06% Realised foreign currency translation adjustments -0,06% -0,01% Income tax paid -3,55% -3,05% Cash flow from operating activities (CFFO) 13,99% 14,93% Acquisition of enterprises, participating interests and activities -3,02% -15,31% Disposal of enterprises, participating interests and activities 0,22% 0,00% Investments in and disposal of intangible assets -1,27% -0,45% Investments in property, plant and equipment -2,66% -3,68% Disposal of property, plant and equipment 0,17% 0,17% Investments in other non-current assets -1,66% -2,16% Disposal of other non-current assets 1,62% 1,78% Cash flow from investing activities (CFFI) -6,60% -19,65% Repayments of borrowings -2,92% -13,59% Proceeds from borrowings 6,45% 29,10% Dividends to minority interests -0,02% 0,00% Buy-back of shares -8,75% -5,67% Cash flow from financing activities (CFFF) -5,24% 9,84% Cash flow for the year, net 2,15% 5,11%
8
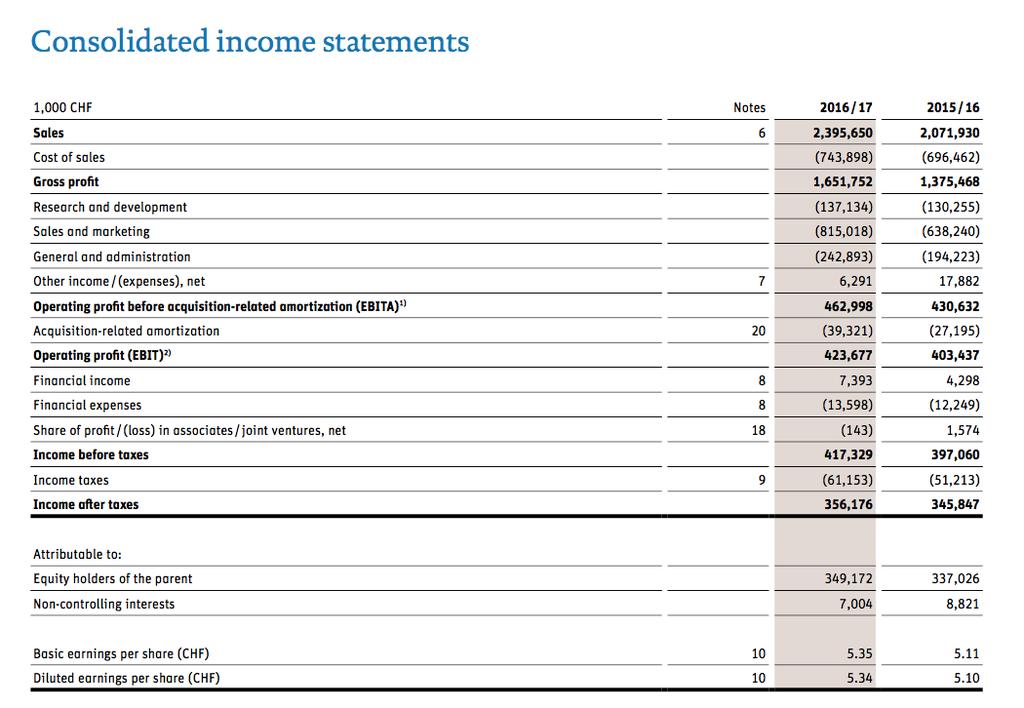
9 Common-Size Income Statement Common-Size Income Statement for Sonova Company Sales 100,00% 100,00% Cost of sales -31,05% -33,61% GROSS PROFIT 68,95% 66,39% Research and development -5,72% -6,29% Sales and marketing -34,02% -30,80% General and administration -10,14% -9,37% Other income/ (expenses), net 0,26% 0,86% Operating profit before acquisition-related amortization (EBITDA) 19,33% 20,78% Acquistion-related amortization -1,64% -1,31% OPERATING PROFIT (EBIT) 17,69% 19,47%
10
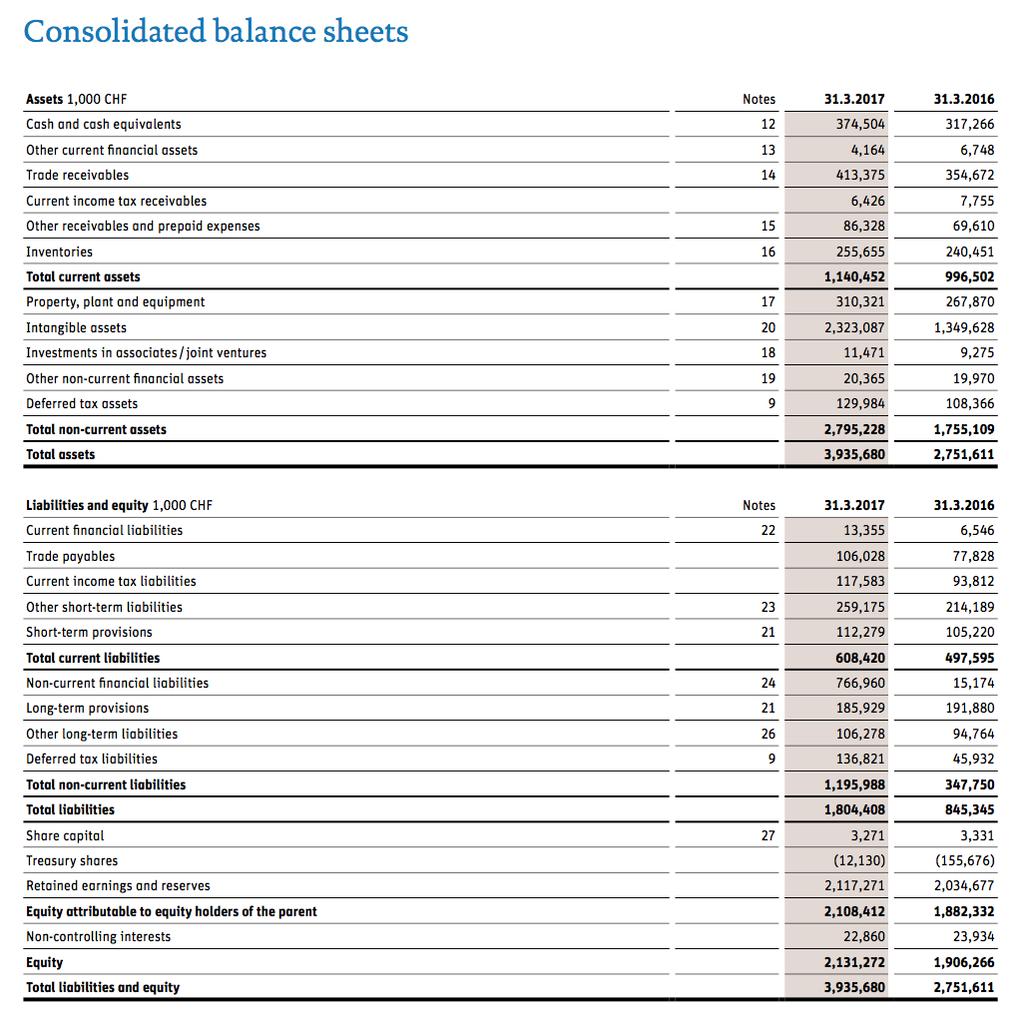
11 Common-Size Balance Sheet Common-Size Balance Sheet for Sonova Company Assets Equity and liabilities Cash and cash equivalents 9,52% 11,53% Current financial liabilities 0,34% 0,24% Other current nancial assets 0,11% 0,25% Trade payables 2,69% 2,83% Trade receivables 10,50% 12,89% Current income tax liabilities 2,99% 3,41% Current income tax receivables 0,16% 0,28% Other short-term liabilities 6,59% 7,78% Other receivables and prepaid expenses 2,19% 2,53% Short-term provisions 2,85% 3,82% Inventories 6,50% 8,74% TOTAL CURRENT LIABILITIES 15,46% 18,08% TOTAL CURRENT ASSETS 28,98% 36,22% Non-current financial liabilities 19,49% 0,55% Property, plant and equipment 7,88% 9,74% Long-term provisions 4,72% 6,97% Intangible assets 59,03% 49,05% Other long-term liabilities 2,70% 3,44% Investments in associates / joint ventures 0,29% 0,34% Deferred tax liabilities 3,48% 1,67% Other non-current financial assets 0,52% 0,73% TOTAL NON-CURRENT LIABILITIES 30,39% 12,64% Deferred tax assets 3,30% 3,94% TOTAL NON-CURRENT ASSETS 71,02% 63,78% TOTAL LIABILITIES 45,85% 30,72% Share capital 0,08% 0,12% Treasury shares -0,31% -5,66% Retained earnings and reserves 53,80% 73,94% Equity attributable to equity holders of the parent 53,57% 68,41% Non-controlling interests 0,58% 0,87% EQUITY 54,15% 69,28% TOTAL ASSETS 100,00% 100,00% TOTAL LIABILITIES AND EQUITY 100,00% 100,00%
12
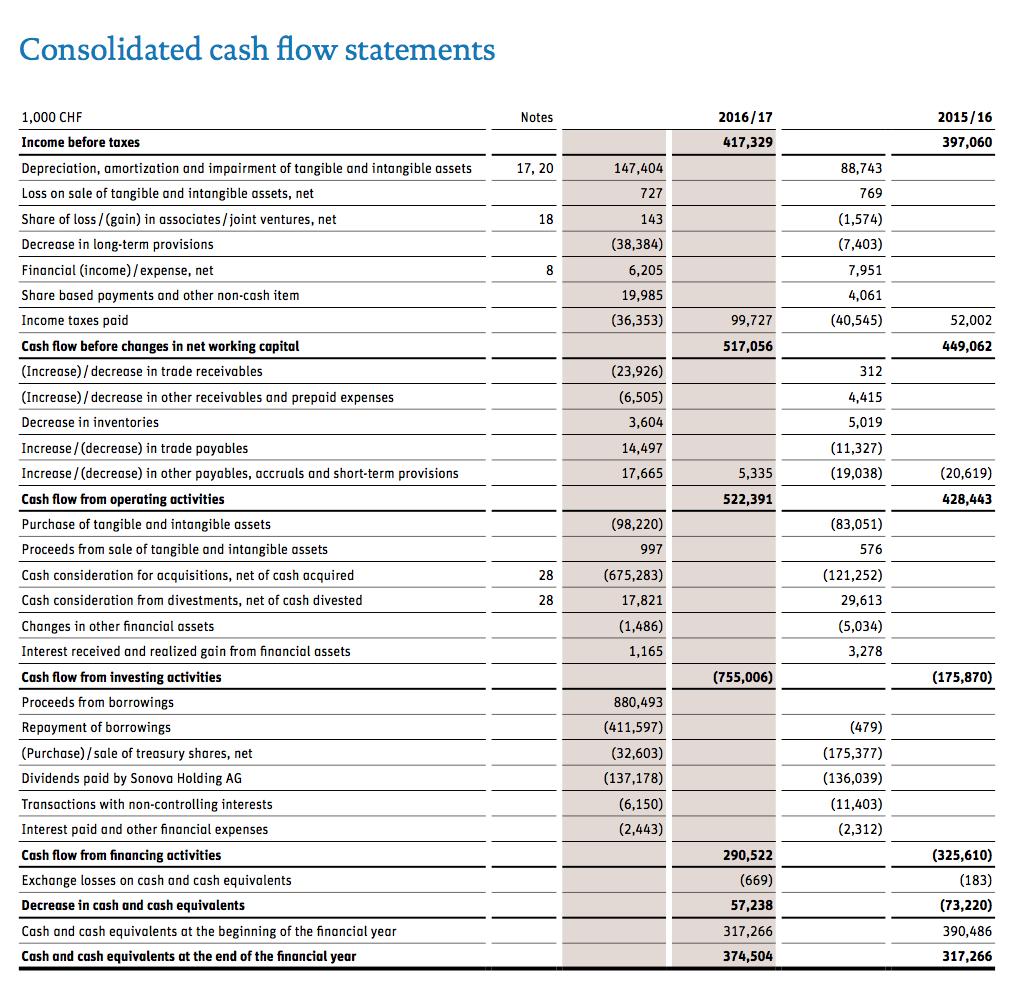
13 Common-Size Cash Flow Statement Common-Size Cash Flow Statement for Sonova Company % of Net Revenue Income before taxes 17,42% 19,16% Depreciation, amortization and impairment of tangible and intangible assets 6,15% 4,28% Loss on sale of tangible and intangible assets, net 0,03% 0,04% Share of loss / (gain) in associates / joint ventures, net 0,01% -0,08% Decrease in long-term provisions -1,60% -0,36% Financial (income) / expense, net 0,26% 0,38% Share based payments and other non-cash item 0,83% 0,20% Income taxes paid -1,52% -1,96% Cash flow before changes in net working capital 21,58% 21,67% (Increase) / decrease in trade receivables -1,00% 0,02% (Increase) / decrease in other receivables and prepaid expenses -0,27% 0,21% Decrease in inventories 0,15% 0,24% Increase / (decrease) in trade payables 0,61% -0,55% Increase / (decrease) in other payables, accruals and short-term provisions 0,74% -0,92% Cash flow from operating activities 21,81% 20,68% Purchase of tangible and intangible assets -4,10% -4,01% Proceeds om sale of tangible and intangible assets 0,04% 0,03% Cash consideration for acquisitions, net of cash acquired -28,19% -5,85% Cash consideration om divestments, net of cash divested 0,74% 1,43% Changes in other financial assets -0,06% -0,24% Interest received and realized gain from financial assets 0,05% 0,16% Cash flow from investing activities -31,52% -8,49% Proceeds om borrowings 36,75% 0,00% Repayment of borrowings -17,18% -0,02% (Purchase) / sale of treasury shares, net -1,36% -8,46% Dividends paid by Sonova Holding AG -5,73% -6,57% Transactions with non-controlling interests -0,26% -0,55% Interest paid and other financial expenses -0,10% -0,11% Cash flow from financing activities 12,13% -15,72% Exchange losses on cash and cash equivalents -0,03% -0,01% Cash flow for the year, net 2,39% -3,53%
Financial Results of the Principal Subsidiaries
 Financial Results of the Principal Subsidiaries Fiscal Year Ended March 31, 2018 May 15, 2018 Copyright 2018 JAPAN POST GROUP. All Rights Reserved. Table of Contents I Japan Post Holdings... 1 Year-on-Year
KCE Electronics Public Company Limited and its subsidiaries
 Statements of financial position Consolidated Separate financial financial 31 December 31 December Assets Note 2012 2011 2012 2011 Current assets Cash and cash equivalents 7 397,177,878 535,535,464 94,974,827
5. Consolidated Financial Statements (1) Consolidated Balance Sheets
 Consolidated Balance Sheets") 5. Consolidated Financial Statements (1) Consolidated Balance Sheets March 31, 2008 Assets Current assets Cash and deposits 84,224 89,218 Notes and accounts receivable-trade 230,156 234,862 Lease receivables
5. Consolidated Financial Statements (1) Consolidated Balance Sheets March 31, 2008 Assets Current assets Cash and deposits 84,224 89,218 Notes and accounts receivable-trade 230,156 234,862 Lease receivables
Via Technologies, Inc. and Subsidiaries Consolidated Financial Statements for the Six Months Ended June 30, 2015 and 2014
 Via Technologies, Inc. and Subsidiaries Consolidated Financial Statements for the Six Months Ended June 30, 2015 and 2014-1 - CONSOLIDATED BALANCE SHEETS June 30, 2015 (Reviewed) December 31, 2014 (Audited)
CONVENIENCE TRANSLATION INTO ENGLISH OF CONDENSED INTERIM CONSOLIDATED FINANCIAL STATEMENTS ORIGINALLY ISSUED IN TURKISH
 CONVENIENCE TRANSLATION INTO ENGLISH OF CONDENSED INTERIM CONSOLIDATED FINANCIAL STATEMENTS ORIGINALLY ISSUED IN TURKISH CONDENSED CONSOLIDATED BALANCE SHEETS AT 30 SEPTEMBER 2017 AND 31 DECEMBER 2016
ORIENTAL UNION CHEMICAL CORPORATION AND SUBSIDIARIES
 CONSOLIDATED BALANCE SHEETS June 30, 2016 (Reviewed) December 31, 2015 (Audited) June 30, 2015 (Reviewed) ASSETS Amount % Amount % Amount % CURRENT ASSETS Cash and cash equivalents $ 1,520,270 4 $ 2,639,717
ANADOLU ANONİM TÜRK SİGORTA ŞİRKETİ DETAILED BALANCE SHEET. ASSETS I- Current Assets
 ASSETS I- Current Assets A- Cash and Cash Equivalents 14 3.775.262.937 3.504.676.959 1- Cash 14 54.840 62.857 2- Cheques Received 3- Banks 14 3.388.494.332 3.105.334.647 4- Cheques Given and Payment Orders
ANADOLU ANONİM TÜRK SİGORTA ŞİRKETİ DETAILED BALANCE SHEET ASSETS
 ASSETS I- Current Assets A- Cash and Cash Equivalents 14 3.815.809.477 3.504.676.959 1- Cash 14 45.563 62.857 2- Cheques Received - - 3- Banks 14 3.402.899.507 3.105.334.647 4- Cheques Given and Payment
Ray Sigorta Anonim Şirketi Balance Sheet As At 30 June 2016 (Currency: Turkish Lira (TL))
)") Balance Sheet ASSETS Current Period 30 June 2016 Audited 31 December 2015 I- Current Assets A- Cash and Cash Equivalents 280.951.812 226.401.451 1- Cash 53.648 45.712 2- Cheques Received 12 12 3- Banks
Balance Sheet ASSETS Current Period 30 June 2016 Audited 31 December 2015 I- Current Assets A- Cash and Cash Equivalents 280.951.812 226.401.451 1- Cash 53.648 45.712 2- Cheques Received 12 12 3- Banks
Annex 1 [RT I 2005, 61, entry into force ] BALANCE SHEET LAYOUT
![Annex 1 [RT I 2005, 61, entry into force ] BALANCE SHEET LAYOUT](/thumbs/89/97819672.jpg "Annex 1 [RT I 2005, 61, entry into force ] BALANCE SHEET LAYOUT") Annex 1 [RT I 2005, 61, 478 - entry into force 01.12.2005] BALANCE SHEET LAYOUT Subdivisions of balance sheet items may be disclosed in the notes on the accounts instead of in the balance sheet. Taking
Annex 1 [RT I 2005, 61, 478 - entry into force 01.12.2005] BALANCE SHEET LAYOUT Subdivisions of balance sheet items may be disclosed in the notes on the accounts instead of in the balance sheet. Taking
Consolidated Statement of Profit or Loss (in million Euro)
") Consolidated Statement of Profit or Loss (in million Euro) Q1 2016 Q1 2017 % change Revenue 603 588-2.5% Cost of sales (408) (396) -2.9% Gross profit 195 192-1.5% Selling expenses (84) (86) 2.4% Research
Consolidated Statement of Profit or Loss (in million Euro) Q1 2016 Q1 2017 % change Revenue 603 588-2.5% Cost of sales (408) (396) -2.9% Gross profit 195 192-1.5% Selling expenses (84) (86) 2.4% Research
Consolidated Statement of Profit or Loss (in million Euro)
") Consolidated Statement of Profit or Loss (in million Euro) Q3 2015 Q3 2016 % change 9m 2015 9m 2016 % change Revenue 661 625-5.4% 1,974 1,873-5.1% Cost of sales (453) (415) -8.4% (1,340) (1,239) -7.5%
Consolidated Statement of Profit or Loss (in million Euro) Q3 2015 Q3 2016 % change 9m 2015 9m 2016 % change Revenue 661 625-5.4% 1,974 1,873-5.1% Cost of sales (453) (415) -8.4% (1,340) (1,239) -7.5%
Financial Statement Balance Sheet
 Financial Statement Balance Sheet Provided by: RUENTEX INDUSTRIES LIMITED Finacial year: Yearly Unit: NT$ thousand Accounting Title 2016/12/31 2015/12/31 Balance Sheet Assets Current assets Cash and cash
ANADOLU ANONİM TÜRK SİGORTA ŞİRKETİ DETAILED BALANCE SHEET (TRY) ASSETS I- Current Assets
 ASSETS I- Current Assets") ASSETS I- Current Assets A- Cash and Cash Equivalents 14 3.066.806.799 3.217.463.827 1- Cash 14 30.243 35.109 2- Cheques Received 3- Banks 14 2.669.454.374 2.795.907.111 4- Cheques Given and Payment Orders
ASSETS I- Current Assets A- Cash and Cash Equivalents 14 3.066.806.799 3.217.463.827 1- Cash 14 30.243 35.109 2- Cheques Received 3- Banks 14 2.669.454.374 2.795.907.111 4- Cheques Given and Payment Orders
ASSETS Amount % Amount % LIABILITIES AND STOCKHOLDERS EQUITY Amount % Amount %
 BALANCE SHEETS JUNE 30, 2010 AND 2009 (In Thousands of New Taiwan Dollars, Except Par Value) ASSETS Amount % Amount % LIABILITIES AND STOCKHOLDERS EQUITY Amount % Amount % CURRENT ASSETS CURRENT LIABILITIES
INTERIM REPORT Q INVESTOR CONFERENCE CALL. Company announcement no. 5/2017 August 29, 2017
 Company announcement no. 5/2017 August 29, 2017 INTERIM REPORT Q2 2017 INVESTOR CONFERENCE CALL Welltec will discuss its results during an investor conference call today at 5pm CEST. The conference call
The accompanying notes on page 13 to 77 are an integral part of these consolidated and company financial statements.
 Statement of Financial Position As at 31 December 2014 Assets 31 December 31 December 1 January 31 December 31 December 1 January 2014 2013 2013 2014 2013 2013 Notes Baht Baht Baht Baht Baht Baht Current
Xiamen C&D Inc. Consolidated Balance Sheet As at 31 December 2013
 Current assets Xiamen C&D Inc. Consolidated Balance Sheet As at 31 December 2013 December 31, 2013 January 1,2013 Monetary funds 6,648,193,063.17 6,271,230,189.99 Trading financial assets 143,168,342.82
AS "MOGO" (UNIFIED REGISTRATION NUMBER LV ) INTERIM CONDENSED FINANCIAL INFORMATION FOR THE NINE MONTH PERIOD ENDED 30 SEPTEMBER 2017
 INTERIM CONDENSED FINANCIAL INFORMATION FOR THE NINE MONTH PERIOD ENDED 30 SEPTEMBER 2017") AS "MOGO" (UNIFIED REGISTRATION NUMBER LV50103541751) INTERIM CONDENSED FINANCIAL INFORMATION FOR THE NINE MONTH PERIOD ENDED 30 SEPTEMBER 2017 Riga, 2017 Statement of Profit or Loss and other Comprehensive
AS "MOGO" (UNIFIED REGISTRATION NUMBER LV50103541751) INTERIM CONDENSED FINANCIAL INFORMATION FOR THE NINE MONTH PERIOD ENDED 30 SEPTEMBER 2017 Riga, 2017 Statement of Profit or Loss and other Comprehensive
FINANCIAL RESULTS. Consolidated Financial Statements - Fiscal Year Ended March 31, Consolidated Balance Sheets
 FINANCIAL RESULTS Consolidated Financial Statements - Fiscal Year Ended March 31, 2007-1. Consolidated Balance Sheets (ASSETS) Prior Year End Current Year End (As of March 31, 2006) (As of March 31, 2007)
 Financial Statement Balance Sheet Page 1 of 5 Financial Statement Balance Sheet Accounting Title 2013/09/30 2012/12/31 2012/09/30 2011/12/31 Balance Sheet Assets Current assets Cash and cash equivalents
KCE Electronics Public Company Limited and its subsidiaries
 Statements of financial position Consolidated financial Separate financial 31 December 31 December 31 December 31 December Assets Note 2014 2013 2014 2013 Current assets Cash and cash equivalents 7 463,016,990
POU CHEN CORPORATION AND SUBSIDIARIES
 CONSOLIDATED BALANCE SHEETS March 31, 2013 December 31, 2012 March 31, 2012 January 1, 2012 ASSETS Amount % Amount % Amount % Amount % CURRENT ASSETS Cash and cash equivalents (Notes 4 and 6) $ 29,346,249
Financial Statement Balance Sheet
 Financial Statement Balance Sheet Provided by: RUENTEX INDUSTRIES LIMITED Finacial year: Yearly Accounting Title 2016/12/31 Balance Sheet Assets Current assets Cash and cash equivalents Total cash and
VESTEL ELEKTRONİK SANAYİ VE TİCARET AŞ
 VESTEL ELEKTRONİK SANAYİ VE TİCARET AŞ SUMMARY FINANCIAL STATEMENTS FOR THE PERIOD 01.01.2017-30.09.2017 (Originally issued in Turkish) CONDENSED INTERIM CONSOLIDATED STATEMENTS OF BALANCE SHEETS AS OF
Millî Reasürans Türk Anonim Şirketi Unconsolidated Balance Sheet As At 30 September 2018 (Currency: Turkish Lira (TL))
)") Unconsolidated Balance Sheet As At ASSETS 1 Audited 31 December 2017 I- Current Assets A- Cash and Cash Equivalents 4.2,14 1.654.893.371 1.223.132.413 1- Cash 4.2,14 58.270 5.842 2- Cheques Received 3-
Unconsolidated Balance Sheet As At ASSETS 1 Audited 31 December 2017 I- Current Assets A- Cash and Cash Equivalents 4.2,14 1.654.893.371 1.223.132.413 1- Cash 4.2,14 58.270 5.842 2- Cheques Received 3-
Millî Reasürans Türk Anonim Şirketi Unconsolidated Balance Sheet As At 30 June 2018 (Currency: Turkish Lira (TL))
)") Unconsolidated Balance Sheet As At ASSETS. 1 31 December 2017 I- Current Assets A- Cash and Cash Equivalents 4.2,14 1.237.184.185 1.223.132.413 1- Cash 4.2,14 52.698 5.842 2- Cheques Received 3- Banks
Unconsolidated Balance Sheet As At ASSETS. 1 31 December 2017 I- Current Assets A- Cash and Cash Equivalents 4.2,14 1.237.184.185 1.223.132.413 1- Cash 4.2,14 52.698 5.842 2- Cheques Received 3- Banks
st IFRS Consolidated Financial Statements
 2461 2018 1st IFRS Consolidated Financial Statements Balance Sheet Balance Sheet Unit: NT$ thousand Accounting Title 2018/03/31 2017/12/31 2017/03/31 Assets Current assets Cash and cash equivalents 1,552,283
Millî Reasürans Türk Anonim Şirketi Consolidated Balance Sheet As At 30 September 2017 (Currency: Turkish Lira (TL))
)") Consolidated Balance Sheet As At ASSETS Restated Audited 31 December 2016 I- Current Assets A- Cash and Cash Equivalents 14 4.776.447.134 4.342.688.861 1- Cash 14 81.993 52.555 2- Cheques Received 450.000
Consolidated Balance Sheet As At ASSETS Restated Audited 31 December 2016 I- Current Assets A- Cash and Cash Equivalents 14 4.776.447.134 4.342.688.861 1- Cash 14 81.993 52.555 2- Cheques Received 450.000
FUJI YAKUHIN CO., Ltd. Consolidated Financial Statements For the Year ended March 31,2017
 FUJI YAKUHIN CO., Ltd. Consolidated Financial Statements For the Year ended March 31,2017 CONSOLIDATED BALANCE SHEET As of March 31,2017 ASSETS Current assets: Cash and deposits 7,156 $ 63,792 Notes and
Accounting Title 2016/3/ /12/ /3/31 Balance Sheet
 Financial Statement Balance Sheet Accounting Title 2016/3/31 2015/12/31 2015/3/31 Balance Sheet Assets Current assets Cash and cash equivalents Total cash and cash equivalents 626,334 624,357 540,732 Current
Financial Statements for Fiscal 2003 (April 1, 2003 to March 31, 2004) Nippon Steel Chemical Co., Ltd.
 Nippon Steel Chemical Co., Ltd.") Financial Statements for Fiscal 2003 (April 1, 2003 to March 31, 2004) Nippon Steel Chemical Co., Ltd. 1 Consolidated Operating Performances 2004 2003 Increase or decrease 2004 from previous term Net sales
Financial Statements for Fiscal 2003 (April 1, 2003 to March 31, 2004) Nippon Steel Chemical Co., Ltd. 1 Consolidated Operating Performances 2004 2003 Increase or decrease 2004 from previous term Net sales
ZORLU ENERJİ ELEKTRİK ÜRETİM A.Ş. CONDENSED INTERIM CONSOLIDATED BALANCE SHEETS AS OF 30 SEPTEMBER 2013 AND 31 DECEMBER 2012
 CONDENSED INTERIM CONSOLIDATED BALANCE SHEETS AS OF 30 SEPTEMBER 2013 AND 31 DECEMBER 2012 Audited ASSETS Note 30.09.2013 31.12.2012 Current Assets 471,526 594,414 Cash and Cash Equivalents 5 172,119 187,379
Consolidated Balance Sheet - 1/2
 Consolidated Balance Sheet March 31, 212 ASSETS CURRENT ASSETS: Cash and cash equivalents (Notes 8 and 19) Time deposits over three months (Note 19) Receivables (Note 19): Trade notes (Note 11) Trade accounts
VESTEL BEYAZ EŞYA SANAYİ VE TİCARET AŞ
 VESTEL BEYAZ EŞYA SANAYİ VE TİCARET AŞ SUMMARY FINANCIAL STATEMENTS FOR THE PERIOD 01.01.2017-30.06.2017 (Originally issued in Turkish) CONDENSED INTERIM STATEMENTS OF BALANCE SHEETS AS OF 30 JUNE 2017
Half year financial report. January June 2017
 Half year financial report January June 2017 Key figures 4-6/2017 4-6/2016 Change% 1-6/2017 1-6/2016 Change% 1-12/2016 Revenue, MEUR 196.0 192.4 1.9% 352.6 350.6 0.6% 775.8 Like-for-like revenue development,
AvivaSA Emeklilik ve Hayat Anonim Şirketi BALANCE SHEET AS OF 31 MARCH 2018 (Amounts expressed in Turkish Lira (TL) unless otherwise stated).
 unless otherwise stated).") BALANCE SHEET AS OF 31 MARCH 2018 ASSETS Audited Previous Period I- CURRENT ASSETS Notes 31 March 2018 31 December 2017 A- Cash and Cash Equivalents 2.12, 14 554.609.140 589.738.443 1- Cash 2- Cheques
BALANCE SHEET AS OF 31 MARCH 2018 ASSETS Audited Previous Period I- CURRENT ASSETS Notes 31 March 2018 31 December 2017 A- Cash and Cash Equivalents 2.12, 14 554.609.140 589.738.443 1- Cash 2- Cheques
AvivaSA Emeklilik ve Hayat Anonim Şirketi BALANCE SHEET AS OF 31 DECEMBER 2017 (Amounts expressed in Turkish Lira (TL) unless otherwise stated).
 unless otherwise stated).") BALANCE SHEET AS OF 31 DECEMBER 2017 ASSETS I- CURRENT ASSETS Notes 31 December 2016 A- Cash and Cash Equivalents 2.12, 14 589.738.443 529.124.443 1- Cash - - 2- Cheques Received - - 3- Banks 2.12, 14
BALANCE SHEET AS OF 31 DECEMBER 2017 ASSETS I- CURRENT ASSETS Notes 31 December 2016 A- Cash and Cash Equivalents 2.12, 14 589.738.443 529.124.443 1- Cash - - 2- Cheques Received - - 3- Banks 2.12, 14
Financial Section. 57 Consolidated Balance Sheets. 59 Consolidated Statements of Operations. 60 Consolidated Statements of Comprehensive Income
 Financial Section 57 Consolidated Balance Sheets 59 Consolidated Statements of Operations 60 Consolidated Statements of Comprehensive Income 61 Consolidated Statements of Changes in Net Assets 63 Consolidated
ASSETS 31 December December 2016
 Condensed Consolidated Interim Balance Sheet as at 31 December 2017 ASSETS 31 December 2017 31 December 2016 Current Assets Cash and Cash Equivalents 7.132 5.159 Financial Investments 736 1.228 Trade Receivables
Marel Food Systems hf. Consolidated Financial Statements for the year 2009
 Marel Food Systems hf. Consolidated Financial Statements for the year 2009 Index Pages Consolidated Statement of Comprehensive Income... 1 Consolidated Statement of Financial Position... 2 Consolidated
VESTEL BEYAZ EŞYA SANAYİ VE TİCARET A.Ş.
 VESTEL BEYAZ EŞYA SANAYİ VE TİCARET A.Ş. SUMMARY FINANCIAL STATEMENTS FOR THE PERIOD (Originally issued in Turkish) CONDENSED INTERIM STATEMENTS OF BALANCE SHEETS AS OF 30 JUNE 2018 AND 31 DECEMBER 2017
Financial Results For the Fiscal Year 2016 ending January 31, 2016
 Financial Results For the Fiscal Year 2016 ending January 31, 2016 March 16, 2016 Balance Sheets (Consolidated) Thousands of Yen 31 Jan., 2016 Assets Current assets: Cash & Cash equivalents 1,984,469 Accounts
TOTAL ASSETS 1,672,316 1,551,904
 CONDENSED CONSOLIDATED STATEMENTS OF FINANCIAL POSITION UNAUDITED AUDITED AS AT AS AT END OF PRECEDING CURRENT FINANCIAL PERIOD YEAR END 30/06/2017 31/12/2016 ASSETS RM '000 RM '000 Non-Current Assets
Unappropriated retained earnings (accumulated deficit) Total unappropriated retained earnings (accumulated deficit) 676, ,797 Total retained ear
 Total unappropriated retained earnings (accumulated deficit) 676, ,797 Total retained ear") Financial Statement Balance Sheet Accounting Title 2014/12/31 2013/12/31 Balance Sheet Assets Current assets Cash and cash equivalents Total cash and cash equivalents 1,183,185 1,177,682 Current bond investment
Financial Statement Balance Sheet Accounting Title 2014/12/31 2013/12/31 Balance Sheet Assets Current assets Cash and cash equivalents Total cash and cash equivalents 1,183,185 1,177,682 Current bond investment
Xiamen C&D Inc. Consolidated Balance Sheet As at 31 December 2014
 Current Xiamen C&D Inc. Consolidated Balance Sheet As at 31 December 2014 1 December 31, 2014 January 1,2014 Monetary funds 6,643,012,173.68 6,648,193,063.17 Financial which are measured by fair value
Consolidated Balance Sheet - 1/2
 Consolidated Balance Sheet March 31, ASSETS CURRENT ASSETS (Note 3): Cash and cash equivalents (Notes 9 and 21) Time deposits over three months (Note 21) Receivables (Note 21): Trade notes (Note 13) Trade
Accounting Title 2014/3/ /12/ /3/31 Balance Sheet
 Financial Statement Balance Sheet Accounting Title 2014/3/31 2013/12/31 2013/3/31 Balance Sheet Assets Current assets Cash and cash equivalents Total cash and cash equivalents 7,974,989 6,997,862 6,433,466
ASSETS 31 December December 2014
 Consolidated Balance Sheet as at 31 December ASSETS 31 December 2015 31 December 2014 Current Assets Cash and Cash Equivalents 2.617 1.474 Financial Investments 180 201 Trade Receivables -Trade Receivables
COMPAL ELECTRONICS, INC. AND SUBSIDIARIES. Consolidated Balance Sheets. December 31, 2012 and 2011 (expressed in thousands of New Taiwan dollars)
") Consolidated Balance Sheets December 31, 2012 and 2011 Assets Amount % Amount % Current assets: Cash and cash equivalents $ 44,154,582 14.3 52,348,302 18.8 Financial assets measured at fair value through
Consolidated Balance Sheets December 31, 2012 and 2011 Assets Amount % Amount % Current assets: Cash and cash equivalents $ 44,154,582 14.3 52,348,302 18.8 Financial assets measured at fair value through
3. CONSOLIDATED QUARTERLY FINANCIAL STATEMENTS
 3. CONSOLIDATED QUARTERLY FINANCIAL STATEMENTS (1) Consolidated Quarterly Balance Sheets September 30, 2013 and March 31, 2013 March 31, 2013 September 30, 2013 Assets Current assets Cash and deposits
Overview of consolidated financial statements
 Overview of consolidated financial statements Consolidated balance sheet On 31 December 2015 On 31 December 2014 In EUR millions Assets Cash and balances at central banks 64,943 43,409 Loans and advances
Test Company Ltd._V.1 Sample Town. Financial Statement. For the business year ended 31 December KENDRIS Ltd.
 Test Company Ltd._V.1 Sample Town Financial Statement For the business year ended 31 December 2015 KENDRIS Ltd. Place, DD/MM/YYYY Test company Ltd_V.1 Sample Street P. O. Box 5000 Sample Town Financial
Interim Financial Statements
 Interim Financial Statements KCA Deutag Alpha Limited For the three months ended 31 March 2018. Page 1 of 11 Table of contents Consolidated income statement 3 Consolidated statement of changes in shareholder's
ACER INCORPORATED Non-Consolidated Balance Sheets September 30, 2005 and 2004 (Expressed in thousands of New Taiwan dollars) Unaudited
 Unaudited") Non-Consolidated Balance Sheets September 30, 2005 and 2004 Assets 2005.9.30 2004.9.30 Current assets: Cash and cash equivalents 10,331,478 2,619,008 Short-term investments 2,464,748 3,313,834 Notes and
Non-Consolidated Balance Sheets September 30, 2005 and 2004 Assets 2005.9.30 2004.9.30 Current assets: Cash and cash equivalents 10,331,478 2,619,008 Short-term investments 2,464,748 3,313,834 Notes and
ACER INCORPORATED Non-Consolidated Balance Sheets December 31, 2005 and 2004 (Expressed in thousands of New Taiwan dollars)
") Non-Consolidated Balance Sheets December 31, 2005 and 2004 Assets 2005.12.31 2004.12.31 Current assets: Cash and cash equivalents 10,918,662 1,683,755 Short-term investments 3,726,081 9,453,202 Notes and
Non-Consolidated Balance Sheets December 31, 2005 and 2004 Assets 2005.12.31 2004.12.31 Current assets: Cash and cash equivalents 10,918,662 1,683,755 Short-term investments 3,726,081 9,453,202 Notes and
Balance Sheet. 6th Fiscal Year (as of Dec ) 5th Fiscal Year (as of Dec )
 5th Fiscal Year (as of Dec )") Balance Sheet 6th Fiscal Year (as of Dec. 31 2006) 5th Fiscal Year (as of Dec. 31 2005) 6th year 5th year ASSETS I. CURRENT ASSETS 501,121,703,544 514,731,203,929 (1) Quick assets 400,439,958,565 446,840,327,827
Balance Sheet 6th Fiscal Year (as of Dec. 31 2006) 5th Fiscal Year (as of Dec. 31 2005) 6th year 5th year ASSETS I. CURRENT ASSETS 501,121,703,544 514,731,203,929 (1) Quick assets 400,439,958,565 446,840,327,827
HON HAI PRECISION INDUSTRY CO., LTD. AND SUBSIDIARIES CONSOLIDATED SHEETS 2016 IFRS Consolidated Financial Statements
 HON HAI PRECISION INDUSTRY CO., LTD. AND SUBSIDIARIES CONSOLIDATED SHEETS 2016 IFRS Consolidated Financial Statements Unit: NT$ thousand Accounting Title 2016/12/31 2015/12/31 Balance Sheet Assets Current
1 January - 30 June. William Demant Holding A/S
 I n t e r i m R e p o r t 2 0 0 3 1 January 30 June William Demant Holding A/S Key figures and ratios GROUP Profit and loss account,dkk million Net revenue 1,903.3 1,976.8 4% 3,923.7 Gross profit 1,254.7
ASSETS 31 March December 2015
 Condensed Consolidated Interim Balance Sheet as at 31 March 2016 Audited ASSETS 31 March 2016 31 December 2015 Current Assets Cash and Cash Equivalents 3.122 2.617 Financial Investments - 180 Trade Receivables
CONSOLIDATED FINANCIAL STATEMENT YEAR ENDED DECEMBER
 CONSOLIDATED FINANCIAL STATEMENT YEAR ENDED DECEMBER 31 2016 BOURBONOFFSHORE.COM SUMMARY 1. Financial position statement...3 2. Statement of comprehensive income... 4 3. Statement of consolidated cash-flows...
Consolidated Balance Sheets
 Consolidated Balance Sheets March 31 2015 2016 2016 Assets: Current assets Cash and cash equivalents 726,888 600,897 $ 5,317,673 Marketable securities 19,033 28,012 247,894 Notes and accounts receivable:
Interim Financial Statements
 Interim Financial Statements KCA Deutag Alpha Limited For the three months ended 31 March 2017 Page 1 of 11 Table of contents Consolidated income statement 3 Consolidated statement of changes in shareholder's
Note 1st Q 2nd Q 3rd Q 4th Q TOTAL 1st Q 2nd Q 3rd Q 4th Q TOTAL VEHICLE VOLUME STATISTICS (in millions)
") Prepared in accordance with U.S. GAAP Note 1st Q 2nd Q 3rd Q 4th Q TOTAL 1st Q 2nd Q 3rd Q 4th Q TOTAL VEHICLE VOLUME STATISTICS (in millions) North American vehicle volumes (including Mexico) 4.534 4.456
Prepared in accordance with U.S. GAAP Note 1st Q 2nd Q 3rd Q 4th Q TOTAL 1st Q 2nd Q 3rd Q 4th Q TOTAL VEHICLE VOLUME STATISTICS (in millions) North American vehicle volumes (including Mexico) 4.534 4.456
ANADOLU ANONİM TÜRK SİGORTA ŞİRKETİ DETAILED BALANCE SHEET. ASSETS I- Current Assets
 ASSETS I Current Assets A Cash and Cash Equivalents 14 3.570.626.911 3.217.463.827 1 Cash 14 50.931 35.109 2 Cheques Received 3 Banks 14 3.232.624.099 2.795.907.111 4 Cheques Given and Payment Orders 14
ANADOLU ANONİM TÜRK SİGORTA ŞİRKETİ DETAILED BALANCE SHEET. ASSETS I- Current Assets
 ASSETS I Current Assets A Cash and Cash Equivalents 14 2.914.657.400 2.304.904.212 1 Cash 14 49.481 18.864 2 Cheques Received 3 Banks 14 2.517.458.090 1.937.834.876 4 Cheques Given and Payment Orders 14
FAR EASTERN NEW CENTURY CORPORATION AND SUBSIDIARIES
 CONSOLIDATED BALANCE SHEETS (In Thousands of New Taiwan Dollars) June 30, 2015 (Reviewed) December 31, (Audited after Restated) June 30, January 1, (Audited after Restated) ASSETS Amount % Amount % Amount
Financial statements 1.Consolidated financial statements (1)Consolidated Balance Sheet (Millions of Yen) As of March 31,2017 As of March 31,2018
Consolidated Balance Sheet (Millions of Yen) As of March 31,2017 As of March 31,2018") Financial statements 1.Consolidated financial statements (1)Consolidated Balance Sheet As of March 31,2017 As of March 31,2018 Assets Current assets Cash and deposits 39,720 39,913 Notes receivable, accounts
Financial statements 1.Consolidated financial statements (1)Consolidated Balance Sheet As of March 31,2017 As of March 31,2018 Assets Current assets Cash and deposits 39,720 39,913 Notes receivable, accounts
CONSOLIDATED BALANCE SHEET
 CONSOLIDATED BALANCE SHEET December 31, 2017 A S S E T S CURRENT ASSETS: Cash and time deposits 31,380 Accounts receivable trade 98,188 Inventories 1,096 Short-term loans receivable 46,282 Deferred tax
Consolidated Balance Sheet Thousands of yen
 Consolidated Balance Sheet (April 30, 2014) (April 30, 2015) Assets Current assets Cash and deposits 2,283,611 3,404,702 Notes and accounts receivable - trade 8,159,645 9,222,242 Electronically recorded
CONSOLIDATED FINANCIAL STATEMENTS These Consolidated Financial Statements were publicly released in the Japanese language on November 9, 2016.
 CONSOLIDATED FINANCIAL STATEMENTS These Consolidated Financial Statements were publicly released in the Japanese language on November 9, 2016. (1)Consolidated balance sheet 2016/3/31 2016/9/30 Assets Current
Consolidated Balance Sheet
 Consolidated Balance Sheet Provided by: RUENTEX INDUSTRIES LIMITED Financial year: Yearly Unit:NT$ thousand Assets Current Assets Cash and cash equivalents 2,867,017.00 6.18 1,894,507.00 7.22 Financial
VESTEL ELEKTRONİK SAN. VE TİC. A.Ş.
 SUMMARY FINANCIAL STATEMENTS FOR THE PERIOD 01.01.2014-31.12.2014 VESTEL ELEKTRONİK SANAYİ VE TİCARET A.Ş. CONSOLIDATED STATEMENTS BALANCE SHEETS AS OF 31 DECEMBER 2014 AND 31 DECEMBER 2013 ASSETS Note
Consolidated Financial Statements for The 3rd Quarter of FY2017 (April 1, December 31, 2017)
") Third Quarter Report Period Ended December 31, 2017 Consolidated Financial Statements for The 3rd Quarter of FY2017 (April 1, 2017 - December 31, 2017) Consolidated Balance Sheets vs. last year Variance
Third Quarter Report Period Ended December 31, 2017 Consolidated Financial Statements for The 3rd Quarter of FY2017 (April 1, 2017 - December 31, 2017) Consolidated Balance Sheets vs. last year Variance
ASSETS II- Non-Current Assets A- Receivables from Technical Operation Due from Insurance Operations 2- Provision for Due from Insurance Operat
 ASSETS I- Current Assets A- Cash and Cash Equivalents 443,645,999.64 1- Cash 19,250.24 2- Cheques Received 11,758.00 3- Banks 443,614,991.40 4- Cheques Given and Payment Orders(-) 5- Other Cash and Cash
Interim Financial Statements
 Interim Financial Statements KCA Deutag Alpha Limited For the six months ended 30 June 2017 Page 1 of 11 Table of contents Consolidated income statement 3 Consolidated statement of changes in shareholder's
CONSOLIDATED BALANCE SHEET
 CONSOLIDATED BALANCE SHEET December 31, 2018 A S S E T S CURRENT ASSETS: Cash and time deposits 51,215 Accounts receivable-trade 95,065 Inventories 5,405 Short-term loans receivable 43,021 Deferred tax
CONSOLIDATED FINANCIAL STATEMENT YEAR ENDED DECEMBER
 CONSOLIDATED FINANCIAL STATEMENT YEAR ENDED DECEMBER 31 2017 BOURBONOFFSHORE.COM SUMMARY 1. Financial position statement...3 2. Statement of comprehensive income... 4 3. Statement of consolidated cash-flows...
Interim Financial Statements
 [Type text] Interim Financial Statements KCA Deutag Alpha Limited For the twelve months ended 31 December 2014 Page 1 of 11 Table of Contents Consolidated income statement... 3 Consolidated statement of
AKSİGORTA ANONİM ŞİRKETİ DETAILED BALANCE SHEET ASSET
 ASSET TRY I- Assets Note 31.03.2008 A- Cash and Cash Equivalents 257.024.009 1- Cash 637 2- Cheques Received 0 3- Banks 35 260.928.960 4- Cheques Given and Payment Orders (-) -3.905.588 5- Other Cash and
Company announcement no Interim Report August 2018
 Company announcement no 2018-08 Interim Report 2018 15 August 2018 Hearing aid wholesale delivered strong organic growth of 11% and expands industry-leading product portfolio Growth in local currencies
For the financial year ended 30 June 2017 Amounts in RM million unless otherwise stated. Note
 167 STATEMENTS OF PROFIT OR LOSS For the financial year ended 2017 Note 2017 2016 2017 2016 Continuing operations Revenue 6 31,087 29,452 1,400 1,270 Operating expenses 7 (30,885) (28,974) (57) (26) Other
Via Technologies, Inc. and Subsidiaries. Consolidated Financial Statements for the Three Months Ended March 31, 2018 and 2017
 Via Technologies, Inc. and Subsidiaries Consolidated Financial Statements for the Three Months Ended March 31, 2018 and 2017 CONSOLIDATED BALANCE SHEETS March 31, 2018 (Reviewed) December 31, 2017 (Audited)
Consolidated Statement of Profit or Loss (in million Euro)
") Consolidated Statement of Profit or Loss (in million Euro) Unaudited, consolidated figures following IFRS accounting policies. Q2 2017 Q2 2018 H1 2017 H1 2018 Revenue 622 559 1,210 1,108 Cost of sales
Consolidated Statement of Profit or Loss (in million Euro) Unaudited, consolidated figures following IFRS accounting policies. Q2 2017 Q2 2018 H1 2017 H1 2018 Revenue 622 559 1,210 1,108 Cost of sales
Accounting Title 2013/12/ /12/ /1/1 Balance Sheet
 Financial Statement Balance Sheet Accounting Title 2013/12/31 2012/12/31 2012/1/1 Balance Sheet Assets Current assets Cash and cash equivalents Total cash and cash equivalents 471,574 507,692 394,913 Notes
Minor International Public Company Limited Statements of Financial Position As at 31 December 2012 and 2011
 Statements of Financial Position As at 31 December 2012 and 2011 Restated Assets Current assets Cash and cash equivalents 7 3,702,393,557 1,145,782,127 2,214,930,902 160,384,206 Trade and other receivables
HON HAI PRECISION INDUSTRY CO., LTD. AND SUBSIDIARIES CONSOLIDATED SHEETS rd IFRS Consolidated Financial Statements
 Balance Sheet HON HAI PRECISION INDUSTRY CO., LTD. AND SUBSIDIARIES CONSOLIDATED SHEETS 2016 3rd IFRS Consolidated Financial Statements Accounting Title 2016/09/30 2015/12/31 2015/09/30 Balance Sheet Assets
BALANCE SHEET as at Obligator: FTB TURIZAM d.d. ZAGREB
 BALANCE SHEET as at 3.2.206. Obligator: FTB TURIZAM d.d. ZAGREB ASSETS A) RECEIVABLES FOR SUBSCRIBED BUT NOT PAID-IN CAPITAL B) LONG-TERM ASSETS (003+00+020+029+033) I. INTANGIBLE ASSETS (004 to 009).
th IFRS Consolidated Financial Statements
 2461 2017 4th IFRS Consolidated Financial Statements Balance Sheet Balance Sheet Unit: NT$ thousand Accounting Title 2017/12/31 2016/12/31 Assets Current assets Cash and cash equivalents Total cash and
2013 CONSOLIDATED ACCOUNTS
 havas.com 1 Consolidated balance sheet ASSETS (in euro million) 12.31.13 Net 12.31.12 12.31.11 Non-current assets Goodwill 1 593 1 603 1 559 Other intangible assets 36 37 41 Property and equipment 255
ITURAN LOCATION AND CONTROL LTD. Consolidated Interim Financial Statements as of March 31, 2013
 Consolidated Interim Financial Statements as of March 31, 2013 Consolidated Financial Statements as of March 31, 2013 Table of Contents Page Consolidated Financial Statements: Balance Sheets 2-3 Statements
INDEPENDENT AUDITORS REPORT. The Board of Directors and Stockholders HannStar Display Corporation
 INDEPENDENT AUDITORS REPORT The Board of Directors and Stockholders HannStar Display Corporation We have audited the accompanying consolidated balance sheets of HannStar Display Corporation and subsidiaries
Abridged Consolidated Financial Statements
 Abridged Consolidated Financial Statements The following abridged consolidated financial statements and notes have been prepared as described in Note 1. While prepared based on the principles of PRC GAAP,
ITURAN LOCATION AND CONTROL LTD. Consolidated Interim Financial Statements as of March 31, 2014
 Consolidated Interim Financial Statements as of March 31, 2014 Consolidated Financial Statements as of March 31, 2014 Table of Contents Page Consolidated Financial Statements: Balance Sheets 2-3 Statements
 5 1. CONSOLIDATED INCOME STATEMENTS (in millions of euros) 2018 2017* REVENUE 2,643 2,505 Cost of sales (1,649) (1,471) GROSS PROFIT 995 1,034 Distribution and marketing costs (250) (224) Research
APPENDICE 1 - Consolidated income statement
 APPENDICE 1 - Consolidated income statement (in millions of euros) 2008 Net sales 2 514 3 554 Metal price effect* (430) (1 135) Sales at constant metal prices* 2 085 2 419 Cost of sales (2 134) (3 065)
Fraport AG Frankfurt Airport Services Worldwide Consolidated Income Statement * million
 Consolidated Income Statement * 2007 2008 Change in % Revenue 2.329,0 2.101,6-9,8 Change in work-in-process 0,5 0,4-20,0 Other internal work capitalized 24,6 33,8 37,4 Other operating income 71,7 66,1-7,8
Consolidated Financial Statements (1) Consolidated Balance Sheets
 Consolidated Balance Sheets") Consolidated Financial Statements (1) Consolidated Balance Sheets End of consolidated (as of End of consolidated (as of Assets Current assets Cash and time deposits 25,726 34,157 Notes and accounts receivable
Consolidated Financial Statements (1) Consolidated Balance Sheets End of consolidated (as of End of consolidated (as of Assets Current assets Cash and time deposits 25,726 34,157 Notes and accounts receivable
Consolidated Financial Results for the Fiscal Year Ended March 31, 2016 [Japanese GAAP] May 27, 2016
![Consolidated Financial Results for the Fiscal Year Ended March 31, 2016 [Japanese GAAP] May 27, 2016](/thumbs/93/113897366.jpg "Consolidated Financial Results for the Fiscal Year Ended March 31, 2016 [Japanese GAAP] May 27, 2016") Consolidated Financial Results for the Fiscal Year Ended [Japanese GAAP] May 27, 2016 MARUHAN Corporation (Amounts of less than one million yen are rounded down.) 1. Consolidated Financial Results for
Consolidated Financial Results for the Fiscal Year Ended [Japanese GAAP] May 27, 2016 MARUHAN Corporation (Amounts of less than one million yen are rounded down.) 1. Consolidated Financial Results for
Organic sales, which exclude exchange rate effects, acquisitions and divestments, increased by 2%
 E x t e n d e d i n f o r m a t i o n I n t e r i m R e p o r t Q 1 2 0 1 7 C o m b i n e d H y g i e n e and F o r e s t p r o d u c t s b u s i n e s s 1 JANUARY 31 MARCH 2017 (compared with same period