Fixed Income Investor Review
|
|
|
- Elwin Lewis
- 5 years ago
- Views:
Transcription


1 Fixed Income Investor Review John Gerspach Chief Financial Officer Eric Aboaf Treasurer October 20, 2011
2 Highlights Continued to execute strategy in challenging environment Remain highly focused on risk management Eurozone countries Emerging markets U.S. mortgage exposure Continued wind down of Citi Holdings Retail Partner Cards to transfer to Citicorp Unquestionable financial strength Still expect to begin returning capital in 2012 Ongoing focus on expenses Note: Throughout this presentation, comments on Citi s capital levels under Basel III are based on Citi s current expectations and understanding of Basel III requirements, and are subject to final regulatory clarity and rulemaking, model calibration and other final implementation guidance. 1
3 Summary Income Statement ($MM, except EPS) 3Q'11 2Q'11 3Q'10 % QoQ % YoY Net Revenues $20,831 $20,622 $20,738 1% 0% Operating Expenses 12,460 12,936 11,520 (4)% 8% Net Credit Losses 4,514 5,147 7,659 (12)% (41)% Net LLR Build (Release) (1) (1,422) (1,979) (1,967) 28% 28% PB&C % 14% Credit Losses, Claims and Benefits 3,351 3,387 5,919 (1)% (43)% Income Taxes 1, % 83% Net Income from Cont. Ops. $3,742 $3,332 $2,601 12% 44% Net Income $3,771 $3,341 $2,168 13% 74% Diluted EPS $1.23 $1.09 $ % 71% Diluted EPS (Ex-CVA) (2) $0.84 $1.06 $0.70 (21)% 20% EOP Assets ($B) $1,936 $1,957 $1,983 (1)% (2)% EOP Loans ($B) (2)% (3)% EOP Deposits ($B) (2)% 0% Note: All per share numbers, throughout this presentation, reflect Citigroup s 1-for-10 reverse stock split, which was effective May 6, Totals may not sum due to rounding. (1) Includes provision for unfunded lending commitments. (2) Credit valuation adjustment (CVA) on Citigroup s fair value option debt and derivatives, net of hedges. Citigroup pre-tax CVA recorded in Securities and Banking and Special Asset Pool totaled $115MM, $164MM and $1,938MM in 3Q 10, 2Q 11, and 3Q 11, respectively. Assumes tax rates of 41.3%, 37.9%, and 37.9% for 3Q 10, 2Q 11, and 3Q 11, respectively. 2
4 Foundation for Sustainable Growth Strong capital base Tier 1 Common of 11.7% Ample liquidity $300B aggregate liquidity resources De-risking of balance sheet Holdings is now 15% of balance sheet Continued improvement in credit trends Net credit losses down 41% YoY Well reserved $32.1B of loan loss reserves, 5.1% of total loans Continued investments in Citicorp Strength in Citicorp s core businesses Citicorp total loans up 13% YoY 3
5 Net Credit Losses and Reserves (1.5) (2.0) (4.0) (6.0) (8.0) ($B) Net Credit Losses (1) Q'09 4Q'09 1Q'10 2Q'10 3Q'10 4Q'10 1Q'11 2Q'11 3Q'11 Loan Loss Reserves (2) (0.1) (1.5) (2.0) (2.3) (2.0) (1.4) (3.3) 3Q'09 4Q'09 1Q'10 2Q'10 3Q'10 4Q'10 1Q'11 2Q'11 3Q' (0.5) (1.0) (1.5) (2.0) (1.0) (3.0) Corporate (0.5) (0.1) (0.5) (1.4) (0.2) 1Q'11 2Q'11 3Q'11 Consumer (2.0) (1.5) (1.2) 1Q'11 2Q'11 3Q'11 Allowance for Loan Losses ($B) (1) Periods prior to 1Q'10 are on a managed basis. For additional information, see Citigroup's Fourth Quarter 2010 Quarterly Financial Data Supplement furnished as an exhibit to Form 8-K filed with the U.S. Securities and Exchange Commission on January 18, (2) Loan Loss Reserves include provision for unfunded lending commitments and credit reserve builds / releases. Note: The adoption of SFAS 166/167 increased the allowance by $13.4B as of January 1, Totals may not sum due to rounding. 4
6 N.A. Consumer Mortgages & Cards ($B) N.A. Citi-Branded Cards Citicorp (1) N.A. Retail Partner Cards Holdings (1) 90+ DPD NCLs EOP 3Q 10 2Q 11 3Q 11 Loans $76.6 $73.7 $ DPD NCLs EOP 3Q 10 2Q 11 3Q 11 Loans $46.0 $41.9 $41.1 $2.19 $2.37 $ $2.30 $2.13 $2.59 $2.68 $2.37 $2.08 $1.95 $2.08 $2.05 $1.88 $1.67 $1.81 $1.43 $1.60 $1.35 $1.23 $1.09 $1.21 $1.05 $2.00 $1.96 $1.93 $2.00 $1.78 $1.74 $1.60 $1.51 $1.35 $1.30 $1.11 $1.06 $1.02 $0.96 $0.78 3Q'09 4Q'09 1Q'10 2Q'10 3Q'10 4Q'10 1Q'11 2Q'11 3Q'11 3Q'09 4Q'09 1Q'10 2Q'10 3Q'10 4Q'10 1Q'11 2Q'11 3Q'11 Residential 1 st Mortgages Citigroup ($B) Home Equity Loans Citigroup ($B) 90+ DPD NCLs $10.40 $10.80 $9.59 EOP 3Q 10 2Q 11 3Q 11 Loans $103.2 $96.8 $ DPD NCLs $1.68 $1.61 $1.41 $1.38 $1.34 $1 32 EOP 3Q 10 2Q 11 3Q 11 Loans $51.6 $46.4 $44.9 $8.03 $7.02 $5.70 $1.34 $1.32 $1.19 $1.05 $1.03 $4.68 $4.08 $3.99 $1.24 $1.10 $0.95 $0.86 $0.80 $0.77 $0.72 $1.01 $0.99 $0.75 $0.70 $0.60 $0.51 $0.57 $0.48 $0.46 $0.63 $0.55 3Q'09 4Q'09 1Q'10 2Q'10 3Q'10 4Q'10 1Q'11 2Q'11 3Q'11 3Q'09 4Q'09 1Q'10 2Q'10 3Q'10 4Q'10 1Q'11 2Q'11 3Q'11 (1) Periods prior to 1Q'10 are on a managed basis. For additional information, see Citigroup's Fourth Quarter 2010 Quarterly Financial Data Supplement furnished as an exhibit to Form 8-K filed with the U.S. Securities and Exchange Commission on January 18, Note: Loans 90+ Days Past Due exclude U.S. mortgage loans that are guaranteed by U.S. government-sponsored agencies, because the potential loss predominantly resides with the U.S. agencies. 5
7 Balance Sheet Trends Assets (1) ($B) $1,562 $1, % $1, $1,649 $1, Cash and Deposits w/ Banks Investments Fed funds sold & securities borrowed Brokerage Receivables Trading Account Assets Loans, net of reserves Goodwill & Intangibles (including MSRs) Other assets (3) $ (31)% $359 $337 $ $ Q'10 4Q'10 1Q' Q'11 (2) (2) 3Q'11 3Q'10 4Q'10 1Q' Q'11 3Q'11 Citicorp & Corp/Other Holdings (1) Quarterly segment balance sheet data is disclosed in Citigroup s Forms 10-Q filed with the U.S. Securities and Exchange Commission. (2) Preliminary. (3) Includes assets related to discontinued operations held for sale. Note: Totals may not sum due to rounding. 6
8 Citi Holdings Asset Summary EOP Assets ($B) 3Q'10 4Q'10 1Q'11 2Q'11 3Q'11 % YoY Brokerage & Asset Mgmt. $28 $27 $27 $27 $26 (7) % MS Smith Barney JV (5) Retail Alt. Investments (32) Local Consumer Lending $298 $252 $237 $228 $218 (27) % North America (27) Mortgages (16) Cards (Retail Partners) (11) Personal (11) Student (90) Auto (39) Commercial Real Estate (73) Other (1) EMEA (29) Asia (37) Special Asset Pool $95 $81 $73 $53 $45 (53) % Securities at HTM (59) Loans, Leases & LCs (72) Securities at AFS (52) Trading MTM (38) Other (40) Total $421 $359 $337 $308 $289 (31)% Note: Totals may not sum due to rounding. 7
9 Loan Trends ($B EOP Loans) 770 Citigroup Loans (1) $654 $649 $637 $648 $ Citi Holdings Citicorp $440 $444 $394 $407 $ Q'10 4Q'10 1Q'11 2Q'11 3Q'11 RCB North America RCB EMEA RCB Latin America RCB Asia Securities & Banking (2) Global Transaction Services (3) Citi Holdings Growth (%) QoQ (%) YoY (%) Total Citicorp 1% 13% Citicorp Corporate 4% 21% Citicorp Consumer (2)% 6% Total Loans in Constant Dollars (4) Citigroup $650 $642 $628 $632 $637 Citi Holdings $261 $242 $220 $206 $194 Citicorp $389 $400 $408 $426 $444 QoQ (%) 1% (6)% 4% YoY (%) (2)% (26)% 14% (1) Reported loans net of unearned income as disclosed in Citigroup's Third Quarter 2011 Quarterly Financial Data Supplement furnished as an exhibit to Form 8-K filed with the U.S. Securities and Exchange Commission on October 17, Regional Consumer Banking numbers include both credit cards and retail banking. (2) Corporate loans. (3) Includes trade finance loans. (4) Loans excluding foreign exchange translation (FX) show non-usd loans expressed at September 30, 2011 foreign exchange rates. Note: Totals may not sum due to rounding. 8
10 Citicorp Drivers in Constant Dollars (1) North America Asia ($B) 3Q'10 2Q'11 3Q'11 YoY % Average Deposits % Retail Bank Average Loans % Cards Average Loans (4%) Cards Purchase Sales % Institutional Avg Loans (2) % ($B) 3Q'10 2Q'11 3Q'11 YoY % Average Deposits % Retail Bank Average Loans % Cards Average Loans % Cards Purchase Sales % Institutional Avg Loans (2) % EMEA ($B) 3Q'10 2Q'11 3Q'11 YoY Average Deposits % Retail Bank Average Loans (1%) Cards Average Loans % Cards Purchase Sales % Latin America ($B) 3Q'10 2Q'11 3Q'11 YoY % Average Deposits % Retail Bank Average Loans % Cards Average Loans % Cards Purchase Sales % Institutional Avg Loans (2) % Institutional Avg Loans (2) % (1) Constant dollars based on September 30, 2011 foreign exchange rates. (2) Loans in Institutional Clients Group include Private Bank. 9
11 Deposits ($B) Time deposits Retail 600 Instit l Clients 500 Group 400 Retail $833 $836 $828 $ $850 $845 $866 $866 $ Citi Holdings Corp/Other Citicorp Operating accounts Instit l Clients 100 Group Q'09 4Q'09 1Q'10 2Q'10 3Q'10 4Q'10 1Q'11 2Q'11 3Q'11 (1) Total Deposits in Constant Dollars (2) $833 $834 $830 $830 $844 $838 $848 $843 $851 (1) Preliminary. (2) Deposits expressed at September 30, 2011 foreign exchange rates. Note: There is not a standard industry definition for operating accounts; numbers reflect Citigroup s internal assessments. Totals may not sum due to rounding. 10
12 3.90% Net Interest Margin 3.70% 3.50% ($Tr) 3.30% % 3.10% % % % 2.50% % Net Interest Margin 288% 2.88% 2.82% 2.83% $1.71 $1.73 $1.72 $1.75 $1.72 3Q'10 4Q'10 1Q'11 2Q'11 3Q'11 Average Interest-Earnings Assets Average Loans (net of unearned income) as a % of Average Interest-Earning Assets 38% 37% 37% 37% 38% Average Long-Term Debt as a % of Average Interest-Earning Assets 21% 21% 21% 21% 19% 11
13 Liquidity & Funding Strategy Bank Non-Bank Liquidity Buffer Maintain ample cash and readily marketable, highly liquid securities on hand to meet short-term funding obligations Maintain ample cash and readily marketable, highly liquid securities on hand to meet short-term funding obligations Funding Components Largely use cost-effective deposits to fund both liquid assets and loans Supplement the funding of bank entities with secured long-term debt and equity Use modest amount of short- term funding for highly liquid assets Continue to primarily fund nonbank businesses with long-term unsecured debt and equity 12
14 Liquidity Resources On Balance Sheet Aggregate Liquidity Resources (1) (EOP $B) $316 $320 $311 $331 $322 $349 $334 $ $ (2) Q'10 2Q'10 3Q'10 4Q'10 1Q'11 2Q'11 3Q'11 (4) Non-Bank 23A Lending Capacity Significant Bank Entities (3) (1) Aggregate Liquidity idit Resources reflect balances of cash at major central banks as well as unencumbered highly hl liquid id securities for the parent holding company (Citigroup Inc.), broker-dealer (CGMHI) and significant bank entities, including Citibank, N.A. (2) Qualifying collateral consisting of unencumbered assets and securities sold under repurchase agreements (repos). Some securities currently encumbered by repos are anticipated to be available as collateral in a stress scenario. (3) Preliminary. (4) Non-Bank includes the parent holding company (Citigroup Inc.) and the broker-dealer (CGMHI). Note: These totals do not include Citigroup s borrowing capacity at the Federal Reserve discount window and from various Federal Home Loan Banks, which capacity is maintained by pledged collateral to all such banks. Totals may not sum due to rounding. 13
15 Non-Bank Liquidity We have enough liquidity that we could operate without issuing long-term debt for a couple of years, 30.0 although we still plan to participate in the debt markets Non-Bank Aggregate Liquidity Resources ($B) Unsecured Commercial Paper Outstanding $ A Lending Capacity Non-Bank "Cash 40Box" Q' Q'11 Expected Long-Term Debt Maturities (1) $14.6 $15.4 $11.8 $9.3 $5.7 $6.7 $8.2 $7.7 4Q'11E 1Q'12E 2Q'12E 3Q'12E 4Q'12E 1Q'13E 2Q'13E 3Q'13E (1) Expected non-bank maturities data is for total Citigroup Inc., excluding (a) securitizations that were consolidated on balance sheet due to SFAS 166/167; (b) FHLB; and (c) local country maturities. Expected aggregate annual long-term debt maturities for total Citigroup Inc., as disclosed in Citigroup Inc. s Second Quarter 2011 Form 10-Q, filed with the Securities and Exchange Commission on August 5, 2011 (2Q 11 Form 10-Q), were $82.5B for 2011, $89.9B for 2012, and $44.4B for Local country liquidity not shown here is applied to local country debt. Modest annual FHLB maturities. 14
16 Long-Term Debt Outstanding By Product: $B $387 $381 $377 $352 $334 ~$ Q'10 4Q'10 1Q'11 2Q'11 3Q'11 YE 2011 Senior (Fixed & Floating) FHLB Structured Notes TLGP Securitizations TruPS Subordinated Other (1) 325 Projected Outstandings (2) Bank vs. Non-Bank: $387 $381 $ $ $334 ~$ Q'10 4Q'10 1Q'11 2Q'11 3Q'11 YE 2011 Bank Non-Bank Projected Outstandings (2) (1) Includes: long-term (original maturity greater than 1 year) fixed/floating rate debt obligations that have been selected for fair value accounting, excluding structured notes; subordinated capital notes; capital lease obligations; and employee deferred awards. (2) Preliminary forecast balances; not actual. Note: Totals may not sum due to rounding. 15
17 Maturities & Issuance of Long-Term Debt $B $ $ $ ~$15 ~$ TBD Maturities Issuance Maturities Issuance Maturities Issuance FY 2011 (1,2) FY 2012 (1,2) FY 2013 (1,2) (2,3) YTD'11 Maturities Issuance $40.7 $11.7 Non-TLGP TLGP Projected Issuance (1) 2011 through 2013 data includes expected maturities. Expected aggregate annual maturities for total Citigroup Inc., as disclosed in Citigroup s 2010 Annual Report of Form 10-K filed with the Securities and Exchange Commission on February 25, 2011, were $71.5B for 2011, $94.2B for 2012, and $37.2B for (2) Preliminary. (3) Issuance data for YTD 11 includes $5.8B for Citigroup Inc. (parent holding company) and $5.9B of CFI gross structural issuance; gross structural issuance for CFI excludes debt that, in Citigroup s internal assessment, may not have an expected life greater than one year. Note: Maturities and issuance data is for total Citigroup Inc., excluding (a) securitizations that were consolidated on balance sheet due to SFAS 166/167; (b) FHLB issuance of $6.0B in the YTD 2011 and expected maturities of $13.0B, $2.7B and $5.3B in 2011, 2012, and 2013, respectively; and (c) local country expected issuance of $5.4B in FY 2011, and expected maturities of $9.0B, $4.5B and $3.8B in 2011, 2012 and 2013, respectively. Totals may not sum due to rounding. 16
18 Long-Term Debt Issuance Details $B $12.7 Structured Benchmark (1.0) $3.6 $ $5.1 $5.9 $ $ $ $2.6 (1) 3Q'09 4Q'09 1Q'10 2Q'10 3Q'10 4Q'10 1Q'11 2Q'11 3Q' Benchmark: Mix of maturities (2, 3, 5, 10, 30 year) Currencies (USD, Sterling, Euro, Thai Baht, JPY) Fixed and Floating Structured: Mix of maturities (across the curve including callable notes) Market-linked notes Fixed and Floating Continue to target a mix of both Benchmark and Structured issuance (1) Benchmark issuance in 1Q 10 includes $2.3B of trust preferred securities. Note: Excludes TLGP issuance for both Citigroup Inc. and Citigroup Funding Inc. (CFI) during Issuance volumes based on trade date. Totals may not sum due to rounding. 17
19 Ratings Moody's S&P Fitch Ratings Summary Rating Outlook Rating Outlook Rating Outlook Citigroup Inc. Senior Debt A3 Negative A Negative A+ Negative Watch Commercial Paper P2 P-2 A1 A-1 F1+ Citibank, N.A. Long-Term Obligations A1 Negative A+ Negative A+ Negative Watch Short-Term Obligations P-1 A-1 F1+ Over the past year and a half, in recognition of our progress, our unsupported ratings have improved at all three of the major agencies Moody s, S&P, and Fitch thereby narrowing the gap between our supported and unsupported ratings. Moody s: On September 21, 2011, concluded its review for possible downgrade and confirmed the A3 long-term rating of Citigroup and the A1 long-term and P-1 short-term ratings of Citibank, N.A. At the same time, Moody's downgraded the short-term rating of Citigroup to P-2 from P-1. The outlook on the long-term senior ratings remains negative. Moody s noted, The downgrade to P-2 is not a reflection of Citigroup's liquidity profile, which strengthened significantly in the past two years and is robust. Standard & Poor s: On April 26, 2011, S&P raised its counterparty credit rating on Citigroup Global Markets Inc. (CGMI) to 'A+/A-1' from 'A/A-1'. Most recently on October 7, 2011, S&P noted they remain on track toward finalizing and implementing their new bank ratings criteria in the fourth quarter. S&P will first publish the new criteria, which will be followed by any rating actions resulting from the newly established criteria. Fitch: On January 26, 2011, Fitch stated, Should Citi's intrinsic performance and fundamental credit profile remain stable or improve, any future lowering or elimination of support from its ratings would still result in a longterm IDR in the 'A' category and short-term IDR of at least 'F1'. On October 13, 2011, Fitch placed the unsupported ratings of 8 banks on Rating Watch Negative. Citigroup's unsupported ratings were not included in the review. 18
20 Key Capital Metrics 16.6% 12.8% 15.3% 14.9% 11.7% 11.3% 16.6% 17.0% 17.2% 16.9% 15.6% 16.1% 12.0% 12.5% 12.9% 13.3% 13.6% 13.5% 9.1% 9.6% 9.1% 9.7% 10.3% 10.8% 11.3% 11.6% 11.7% Tier 1 Capital Total Capital Tier 1 Common (1) 3Q'09 4Q'09 1Q'10 2Q'10 3Q'10 4Q'10 1Q'11 2Q'11 3Q'11 Risk-Weighted Assets ($B) $990 $1,089 $1,064 $1,025 $1,003 $978 $992 $993 $982 (1) Preliminary. Note: The adoption of SFAS 166/167 in 1Q'10 reduced Tier 1 Common, Tier 1 Capital and Total Capital ratios by 138, 141 and 142 basis points, respectively, and increased risk-weighted assets by $24B. The exiting of the loss-sharing agreement with the U.S. government increased 4Q 09 risk-weighted assets by approximately $136B. 19
21 Tier 1 Common Capital Drivers Quarter-over-Quarter: $B $115.4 $2.8 $1.9 $115.3 $(3.6) $(1.1) RWA Tier 1 Common 2Q11 $ % Earnings ex-cva Equity Units (ADIA) (1) (2) (3) Impact of FX Other 3Q $(27) $16 $ % Year-over-Year: $103.7 $10.8 $3.8 $(1.9) $(1.1) $ Q10 Earnings ex-cva Equity Units (ADIA) (1) (2) (3) Impact of FX Other 3Q11 Tier 1 Common 10.3% 11.7% (1) Earnings excluding CVA on Citigroup Inc.'s fair value option debt. (2) Abu Dhabi Investment Authority (ADIA) conversion. (3) Includes Currency Translation Adjustment through AOCI, as well as the impact of FX on reported Goodwill and Intangibles. 20
22 Risk Management: Process & Actions Structural Enhancements post-crisis: Organization & Culture Risk Identification Built bench strength and enhanced the Risk culture Triangulated on risk (business, product, geography) Established and embedded guiding principles Revised performance assessment Continuous VaR methodology improvements Significantly enhanced Citi-wide multiple scenario stress testing Ongoing economic capital methodology enhancements Measurement / Reporting Risk MIS re-vamped Robust quantitative and qualitative reports Dynamic day-to-day d Management: Business Product Geography Institutional (corporate) underwriting criteria Consumer (mortgage, g cards) underwriting criteria Concentration limits by counterparty, geography, and product Limits at multiple levels, e.g. business level, desk-level, factor sensitivity level Regional risk structure; regional and country limits Daily, weekly, monthly monitoring 21
23 3Q 11 Country Risk Exposure Summary As of September 30, 2011 GIIPS (1) France & Belgium (2) Gross Funded Exposure (2) $20.6 $14.4 Less: Margin and Collateral (3) (4.1) (6.8) Less: Purchased Credit Protection (4) (9.4) (5.6) (13.5) (12.4) Net Current Funded Exposure $7.1 $2.0 Additional Collateral Received Not Netted ($4.4) ($4.1) Net Current Funded Exposure Detail: Trading / AFS ($0.6) ($0.1) Credit Exposure Sovereigns 1.5 (0.0) Financial Institutions Corporations 4.1 (0.2) Net Current Funded Exposure $7.1 $2.0 Note: Information based on Citi s internal risk management measures. (1) Greece, Ireland, Italy, Portugal, and Spain. (2) Does not include unfunded commitments of $9.2B to GIIPS (of which $8.4B is to corporations) and $18.0B to Belgium and France (of which $12.4B is to corporations). Details in Appendix on slide 33. (3) Margin posted under legally enforceable margin agreements and collateral pledged under bankruptcy-remote structures. (4) Credit protection purchased from high quality financial institutions predominately outside of GIIPS, France, and Belgium. 22
24 Summary Strength in core businesses Asset reductions Stable deposits & loan growth Modest re-issuance needs Do not expect to replace maturing TLGP Strong capital base Sustained growth Asia achieved positive operating leverage in 3Q 11; Latin America currently projected to do so in 4Q 11 Robust structural liquidity with appetite to lend Expect continued loan growth Lower proportion p of wholesale funding over time Expect approximately $ B longterm debt outstanding by year-end 2011 Continue to expect to begin returning capital to shareholders in 2012 and operate in a Tier 1 Common ratio range of 8-9% under Basel III by end of
25 APPENDIX Table of Contents 25. Citicorp 3Q 11 International 33. 3Q 11 Country Risk Exposure Consumer Loans Summary 26. Citicorp 3Q 11 Consumer Loans Asia 27. Citicorp 3Q 11 Consumer Loans LATAM 28. International Consumer Credit Trends 29. Year-to-Date Expense Drivers 30. Year-to-Date Investments 31. Capital Levels 32. Capital Structure Components 34. Funding Profile 35. Deposits 36. Structural Liquidity 37. Assets 38. Liabilities & Equity 39. Additional Mortgage Details 40. Consumer Mortgage Reps & Warranties 41. Non-GAAP Financial Measures 24


26 Citicorp 3Q 11 International Consumer Loans ($B) Loans as % of Total International RCB Total International Loans by Product Commercial Markets 23% Total EOP Loans 3Q 10 $ Q 11 $ Q 11 $126.4 Total EOP Loans Mortgage $38.1 Cards $35.6 Commercial $29.2 PIL (1) +Other $23.5 Note: Totals may not sum due to rounding. (1) Personal installment loan. 25


27 Citicorp 3Q 11 Consumer Loans Asia ($B) Total EOP Loans Asia Loans by Product Well-diversified within region Over 80% of loans in emerging markets Strict underwriting criteria 40% in mortgages as of 3Q 11 Largest EM markets: Korea, Singapore & Hong Kong Majority of EM loans to borrowers with a Citi banking relationship Regulatory limits cap LTVs in major markets Commercial Korea capped at 60% Markets Singapore capped at 80% 20% Hong Kong capped at 50-70% Citi s average updated LTV in each of these 3 portfolios is roughly 50% or lower Mortgages are full recourse 3Q 10 $77.2 2Q 11 $87.1 3Q 11 $84.5 Current and historical NCL rates close to 0% 24% in cards as of 3Q 11 Largest EM markets: Taiwan, Korea, and Malaysia Seasoned portfolios with historical average NCL rates of 3-4% over the last 10 years New card originations target an estimated operating margin of at least 2x steady state NCL rate Note: Totals may not sum due to rounding. 26
 re-positioned over past 3 years with focus on tighter credit criteria New vintage delinquencies at ~50% of 2007 / 2008 vintages Focused on new originations through existing retail base Brazil")
 has migrated to more transactional users with higher credit quality Regulatory changes to minimum payment terms are impacting industry in near-term 31% in commercial markets as of 3Q 11 Roughly")
28 Citicorp 3Q 11 Consumer Loans LATAM ($B) LATAM Loans by Product Commercial Markets 31% 2 key markets Mexico (~62% of loans) and Brazil (~20% of loans) 37% in cards as of 3Q 11 Mexico cards portfolio ($5.2B) re-positioned over past 3 years with focus on tighter credit criteria New vintage delinquencies at ~50% of 2007 / 2008 vintages Focused on new originations through existing retail base Brazil cards ($4.6B) has migrated to more transactional users with higher credit quality Regulatory changes to minimum payment terms are impacting industry in near-term 31% in commercial markets as of 3Q 11 Roughly 80% in Mexico, which has had historical average NCL rate of <1.0% over past two years Nearly all mortgages g in Mexico Total EOP Loans 3Q 10 $32.2 2Q 11 $37.9 3Q 11 $34.9 Note: Totals may not sum due to rounding. 27


29 International Consumer Credit Trends ($B) Citicorp Asia Consumer Banking EOP 3Q 10 2Q 11 3Q 11 Loans $77.2 $87.1 $84.5 Citicorp Latin America Consumer Banking EOP 3Q 10 2Q 11 3Q 11 Loans $32.2 $37.9 $34.9 Citicorp EMEA Consumer Banking Holdings International ti LCL EOP 3Q 10 2Q 11 3Q 11 Loans $7.3 $7.7 $7.0 EOP 3Q 10 2Q 11 3Q 11 Loans $24.7 $16.6 $
30 Year-to-Date Expense Drivers Year-over-Year Change ($B) 8.1% 5.3% 2.8% (1.4) ~ (0.4) (0.2) 37.7 ~ Operating: +$1.0B Macro / Episodic Driven Expenses: +$1.8B (1) (2) (3) Year-to-date, operating expenses up 2.8% vs. last year Note: Totals may not sum due to rounding. (1) Includes volumes, divestitures,and all other operational expenses. (2) Includes a $0.4B benefit from the absence of the 2Q 10 UK bonus tax. (3) Excludes macro / episodic driven expenses. 29
31 Year-to-Date Investments ($B) Category 2011 YTD Spend YoY Variance Examples of Key Initiatives Revenue Generating Regulatory / Compliance Enhance Capabilities, Productivity & Organizational Effectiveness ~$1.9 ~$1.5 ~$0.6 ~$0.6 ~$0.5 ~$0.5 Cards new acquisition campaigns Branch network expansion Retail sales force expansion Securities & Banking hires Investments related to risk management, finance, and compliance Regulatory mandates Technology and infrastructure Drive productivity gains Franchise-Wide ~$0.2 ~$0.2 Consumer marketing campaigns New sponsorships Total Citi ~$3.2B ~$2.8B 30
32 Capital $90.0 $70.0 $50.0 $30.00 $10.0 $10.0 ($B) $59.8 Tangible Common Equity (1,2) Tier 1 Common (1) $ % 83% $130.0 $136.9 $142.2 $144.7 $129.4 $110.0 $104.5 $105.1 $118.2 $112.5 $115.4 $115.3 $90.0 $70.0 $62.9 $50.0 $31.1 $30.0 $22.9 $10.0 (3) -$10.0 (3) Q'11 2Q'11 3Q' Q'11 2Q'11 3Q'11 Tier 1 Capital Total Capital $150.0 $130.0 $110.0 $90.0 $70.0 $50.0 $30.0 $10.0 -$10.0 $89.2 $118.8 $127.0 $ % $ % $131.5 $134.5 $132.4 $180.0 $160.0 $140.0 $120.0 $100.0 $80.0 $60.0 $40.0 $20.00 $134.1 $156.4 $166.0 $162.2 $168.4 $170.5 $166.3 $0.0 (3) (3) Q'11 2Q'11 3Q' Q'11 2Q'11 3Q'11 (1) Tier 1 Common and Tangible Common Equity totals for 2007 are estimates. (2) Tangible Common Equity is a non-gaap financial measure. See slide 41 for additional information on this metric. (3) Preliminary. 31
33 Capital Structure Components Citi is committed to an optimal mix of common equity and Tier 1 Capital, and we will continue to refine our capital structure to reflect economic conditions, business dynamics and regulatory requirements ($B) Regulatory Capital Qualifying Amounts (1) Subordinated Debt Trust Preferreds Preferred Stock Common Stockholders 60.0 Equity 40.0 $20.7 $16.0 $0.3 $115.3 Tier 2 Capital $33.9B (2) Tier 1 Common $115.3B (3) Tier 1 Capital $132.4B (4) Call Feature Trust Preferreds (5) : # Amount Regulatory Issues $B (6) Call Currently Callable 11 $ Optionally Callable: Prior to Jan $2.8 4 After Jan $6.9 4 Permanently Grandfathered (7) 1 $1.3 N/A Q'11 (1) Qualifying amounts refers to how much of each indicated security class is included in the calculation of each capital measure under current regulatory guidelines. (2) Tier 2 Capital also includes a portion of the Allowance for Credit Losses of $12.6B and Net Unrealized Pretax Gains on Available-for-Sale Equity Securities of $0.7B, not shown on this chart. (3) Qualifying amount of common stockholders equity reflects adjustments and is also principally reduced by disallowed deferred tax assets, goodwill, and other disallowed intangible assets. (4) Tier 1 Capital also includes Qualifying Noncontrolling Interests of $0.8B not shown on this chart. (5) Excludes Citigroup Capital III, which is not redeemable and has a qualifying capital value of approximately $0.2B. (6) Amount of qualifying capital associated with each call feature. (7) Citigroup Capital XIII which is grandfathered under Dodd-Frank but not Basel III and is callable in Note: Totals may not sum due to rounding. 32
34 3Q 11 Country Risk Exposure Summary ($B) As of September 30, 2011 (1) Unfunded Commitments GIIPS France & Belgium Sovereigns $0.4 $1.4 Financial Institutions Corporations Unfunded Commitments $9.2 $18.0 Note: Information based on Citi s internal risk management measures. (1) Greece, Ireland, Italy, Portugal, and Spain. 33
35 Funding Profile ($B) Total Liabilities & Equity: $1,936 billion as of 3Q 11 1, $1, , $ , $179 - Bank (1,3) (2,3) - Non-Bank - Total Equity (3) Deposits S-T Borrowings L-T Debt Secured Financing Brokerage Payables (4) Other Liabilities Total Equity Trading Account Liabilities (1) Bank units include Citibank, N.A. and Citicorp Trust Bank. (2) Non-Bank includes the parent holding company (Citigroup Inc.) and the balances of Citigroup Funding Inc. (CFI), CGMHI (the broker-dealer), Banamex and Citibank Switzerland, Citicorp Treasury and all other remaining non-bank balances. (3) Preliminary. (4) The Bank graph includes $1.3B of Brokerage Payables which may not be apparent due to the scale of the graph, for Citigroup Inc. total Brokerage Payables balance of $56.1B at 3Q 11. Note: Totals may not sum due to rounding. 34
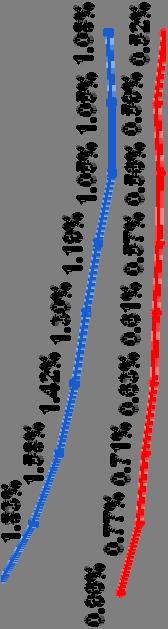
36 Deposits 1.50% Average Rate on Total Deposits (1) Average Rate on Total Deposits (excluding deposit insurance and FDIC assessment) (2) 1.00% 1.12% 101% 1.01% 102% 1.02% 1.00% 101% 1.01% 0.99% 103% 1.03% 103% 1.03% 0.96% 0.98% 0.91% 0.91% 0.88% 0.90% 0.86% 0.85% 0.86% 0.85% (EOP 0.50% Balances, $B) $833 $836 $828 $814 $850 $845 $866 $866 $ Non-Interest- 0.00% Bearing Interest- Bearing Q'09 4Q'09 1Q'10 2Q'10 3Q'10 4Q'10 1Q'11 2Q'11 3Q'11 (1) Average rate is calculated as annualized interest (including deposit insurance and FDIC assessment) divided by average deposits. As previously disclosed, the FDIC assessment increased significantly in 2Q 11. (2) Average rate is calculated as annualized interest (excluding deposit insurance and FDIC assessment) divided by average deposits. Note: Totals may not sum due to rounding. 35
37 Structural Liquidity Structural Liquidity % Total Assets ($B) 80% 70% 60% 50% 62% 66% 5% 7% 20% 19% 73% 71% 71% 71% 73% 73% 71% 70% 8% 8% 8% 8% 9% 9% 9% 9% 20% 22% 21% 20% 20% 19% 18% 17% 40% 30% 20% 38% 40% 45% 41% 42% 43% 44% 44% 44% 44% 10% 0% Q'10 2Q'10 3Q'10 4Q'10 1Q'11 2Q'11 3Q'11 Deposits Long-Term Debt Equity (2) (1) Deposits LTD Equity Structural t Liquidity $1,367 $1,275 $1,353 $1,419 $1,382 $1,400 $1,390 $1,413 $1,395 $1,362 (1) Preliminary. (2) Citigroup Inc. stockholders equity. Note: Totals may not sum due to rounding. 36
38 Assets (EOP $B) $2,002 $1,889 $1,938 $1,983 $1,914 $1,948 $1,957 $1,936 $1, Q'09 4Q'09 1Q' Q'10 3Q'10 4Q'10 1Q' Q'11 3Q'11 (1) Cash and Deposits with Banks Trading Account Assets Loans, net Investments Brokerage Receivables Other Assets (2) Goodwill & Intangible Assets Fed Funds Sold & Secured Lending Discontinued Operations (1) Preliminary. (2) Other Assets includes Mortgage Servicing Rights (MSRs). Note: The adoption of SFAS 166/167 resulted in the consolidation of $137B of incremental assets onto Citigroup s consolidated balance sheet as of January 1, Totals may not sum due to rounding. 37
39 Liabilities & Equity (EOP $B) $1,889 $1,857 $2,002 $1,938 $1,983 $1,914 $1,948 $1,957 $1, (1) 3Q'09 4Q'09 1Q'10 2Q'10 3Q'10 4Q'10 1Q'11 2Q'11 3Q'11 Deposits Long-Term Debt Total Equity Short-Term Borrowings Trading Account Liabilities Other Liabilities (2) Fed Funds Purchased & Secured Financing (1) Preliminary. (2) Other Liabilities also includes Brokerage Payables and Liabilities related to discontinued operations held for sale. Note: The adoption of SFAS 166/167 resulted in the consolidation of $146B of liabilities onto Citigroup s consolidated balance sheet as of January 1, Totals may not sum due to rounding. 38
40 3Q 11 Additional Mortgage Details Third party servicing portfolio: $421B Retained rep & warranty liability for an additional $27B of sold servicing $1.1B repurchase reserve for rep & warranty claims as of 3Q 11 Private label RMBS: $91B of total issuance during CitiMortgage: g $25B of issuance Reduced by $13B of repayments and recoveries and $1B of cumulative losses Remaining $11B has 90+ day delinquency rate of 12.5% S&B: $66B of issuance Reduced by $34B of repayments and recoveries and $8B of cumulative losses Remaining $24B has 90+ day delinquency rate of 26.6% FHA origination i cut significantly ifi over past 3 years In , Citi originated ~7% of industry volume Reduced to ~3% by 2009, and <1% for (1) (2) Note: (1) The $11B of outstanding CitiMortgage issuance is included in the $421B servicing portfolio above. (2) For Securities and Banking, fewer than 2% of mortgages outstanding were originated by Citi; fewer than 10% of mortgages outstanding are serviced by Citi (such mortgages are included in the $421B servicing portfolio above). 39

 Repurchase")
")


 4 5")
 224 296 Losses")


 Includes loans")

41 Consumer Mortgage Reps & Warranties Claims Repurchases (1) Repurchase Reserve Balance ($MM) (Number of Loans 000) 38.9 GSEs Private Investors 12.4 $MM 2Q 11 3Q 11 Beginning balance $944 $1,001 Additions for new sales (2) 4 5 Change in estimate (2) Losses realized (171) (226) Ending balance $1,001 $1,076 Note: Totals may not sum due to rounding. (1) Includes loans repurchased and make-whole payments. (2) Flows through the profit and loss statement (contra-revenue item). 40
42 Non-GAAP Financial Measures RECONCILIATION OF NON-GAAP FINANCIAL MEASURES $MM (1) 3Q'10 4Q'10 1Q'11 2Q'11 3Q'11 Citigroup's Total Stockholders' Equity $162,913 $163,468 $171,037 $176,364 $177,372 Less: Preferred Stock Common Stockholders' Equity $162,601 $163,156 $170,725 $176,052 $177,060 Less: Goodwill as reported 25,797 26,152 26,339 26,621 25,496 Less: Intangible Assets (other than MSRs) - as reported 7,705 7,504 7,280 7,136 6,800 Less: Goodwill & Intangible Assets (other than MSRs) - recorded as Assets of Discontinued Operations Held for Sale Less: Net Deferred Tax Assets Related to Goodwill and Intangible Assets Tangible Common Equity (TCE) $129,040 $129,444 $136,888 $142,245 $144,717 Common Shares Outstanding 2, , , , ,923.7 Tangible Book Value per Share $44.42 $44.55 $46.87 $48.75 $49.50 (Tangible Common Equity / Common Shares Outstanding) (1) Preliminary. Note: Reclassified to conform to the current period s presentation. 41
43 Certain statements in this document are forward-looking statements within the meaning of the rules and regulations of the U.S. Securities and Exchange Commission. These statements are based on management s current expectations ti and are subject to uncertainty t and changes in circumstances. Actual results and capital and other financial condition may differ materially from those included in these statements due to a variety of factors, including the precautionary statements included in this document and those contained in Citigroup s filings with the U.S. Securities and Exchange Commission, including without limitation the Risk Factors section of Citigroup s 2010 Form 10-K.
Fixed Income Investor Review
 Fixed Income Investor Review John Gerspach Chief Financial Officer Eric Aboaf Treasurer April 27, 2011 Citigroup Highlights Continued making progress in 1Q 11 Citigroup earned $3.0B Emerging markets represented
Third Quarter 2011 Earnings Review. October 17, 2011
 Third Quarter 2011 Earnings Review October 17, 2011 Highlights Continued to execute strategy in challenging environment Remain highly focused on risk management Eurozone countries Emerging markets U.S.
Fixed Income Investor Review
 Fixed Income Investor Review John Gerspach Chief Financial Officer Eric Aboaf Treasurer January 21, 2010 Citigroup 2009 Summary Substantial progress in 2009 Built financial strength Reduced our size and
Fourth Quarter 2011 Earnings Review January 17, 2012
 On February 9, 2012, Citi announced an adjustment to its fourth quarter and full year 2011 financial results to reflect an additional $209 million of after-tax ($275 million pre-tax) charges to increase
Second Quarter 2013 Earnings Review
 Citi Investor Relations Second Quarter 2013 Earnings Review July 15, 2013 Overview Progress in improving consistency and quality of earnings Solid markets performance despite higher volatility Sustained
Third Quarter 2009 Earnings Review. October 15, 2009
 Third Quarter 2009 Earnings Review October 15, 2009 Third Quarter 2009 Summary Strong balance sheet: Tangible Common Equity substantially improved to $102B, Tier 1 Capital Ratio stable at 12.7% Franchise
First Quarter 2017 Fixed Income Investor Review
 Citi Fixed Income Investor Relations First Quarter 2017 Fixed Income Investor Review April 20, 2017 John Gerspach Chief Financial Officer James von Moltke Treasurer Agenda 1Q 17 Results $4.1B of net income,
Third Quarter 2016 Fixed Income Investor Review
 Citi Fixed Income Investor Relations Third Quarter 2016 Fixed Income Investor Review October 26, 2016 John Gerspach Chief Financial Officer James von Moltke Treasurer Agenda 3Q 16 Results Earned $3.8B
First Quarter 2015 Earnings Review
 Citi Investor Relations First Quarter 2015 Earnings Review April 16, 2015 Overview First quarter results provide a solid start to 2015 Modest revenue growth and positive operating leverage in Citicorp
Second Quarter 2017 Fixed Income Investor Review
 Citi Fixed Income Investor Relations Second Quarter 2017 Fixed Income Investor Review July 20, 2017 John Gerspach Chief Financial Officer Agenda 1H 17 Results $8B of net income, up 6% year-over-year Efficiency
Second Quarter 2018 Fixed Income Investor Review
 Citi Fixed Income Investor Relations Second Quarter 2018 Fixed Income Investor Review July 26, 2018 John Gerspach Chief Financial Officer Michael Verdeschi Treasurer Agenda 1H 18 Results Net income of
Third Quarter 2018 Fixed Income Investor Review
 Citi Fixed Income Investor Relations Third Quarter 2018 Fixed Income Investor Review October 25, 2018 John Gerspach Chief Financial Officer Michael Verdeschi Treasurer Agenda YTD 18 Results Net income
Credit Suisse Financial Services Forum John Gerspach
 On February 9, 2012, Citi announced an adjustment to its fourth quarter and full year 2011 financial results to reflect an additional $209 million of after-tax ($275 million pre-tax) charges to increase
Third Quarter 2017 Fixed Income Investor Review
 Citi Fixed Income Investor Relations Third Quarter 2017 Fixed Income Investor Review October 26, 2017 John Gerspach Chief Financial Officer Michael Verdeschi Treasurer Agenda YTD 17 Results $12.1B of net
Fixed Income Investor Review
 Citi Fixed Income Investor Relations Fixed Income Investor Review July 21, 2015 John Gerspach Chief Financial Officer Agenda Execution Priorities Balance Sheet Funding $4.7B of net income (1) in 2Q 15
Fourth Quarter 2017 Earnings Review
 Citi Investor Relations On February 23, 2018, Citi announced that it was adjusting downward its fourth quarter and full year 2017 financial results, from those reported on January 16, 2018, due to an updated
Fixed Income Investor Review
 Citi Fixed Income Investor Relations Fixed Income Investor Review April 23, 2015 John Gerspach Chief Financial Officer Agenda 1Q 15 Milestones $4.8B of net income (1) $1.2B of DTA utilization Progress
Fixed Income Investor Review
 Fixed Income Investor Review John Gerspach Chief Financial Officer Eric Aboaf Treasurer October 16, 2009 Third Quarter Earnings Summary Strong balance sheet: Tangible Common Equity (1) substantially improved
Goldman Sachs U.S. Financial Services Conference Vikram Pandit
 Goldman Sachs U.S. Financial Services Conference Vikram Pandit Chief Executive Officer December 6, 2011 Citigroup Market conditions remain challenging Industry is facing significant changes in the economic,
First Quarter 2018 Earnings Review
 Citi Investor Relations First Quarter 2018 Earnings Review April 13, 2018 Overview 1Q 18 showed strong operating results and balanced franchise performance Revenue growth in both Cards and Retail Banking
Fourth Quarter 2014 Earnings Review
 Citi Investor Relations Fourth Quarter 2014 Earnings Review January 15, 2015 Overview Fourth quarter revenues impacted by more challenging macro environment Markets performance reflected difficult trading
First Quarter 2018 Fixed Income Investor Review
 Citi Fixed Income Investor Relations First Quarter 2018 Fixed Income Investor Review April 20, 2018 John Gerspach Chief Financial Officer Michael Verdeschi Treasurer Agenda 1Q 18 Results Net income of
Fourth Quarter 2017 Fixed Income Investor Review
 Citi Fixed Income Investor Relations On February 23, 2018, Citi announced that it was adjusting downward its fourth quarter and full year 2017 financial results, from those reported on January 16, 2018,
Third Quarter 2017 Earnings Review
 Citi Investor Relations Third Quarter 2017 Earnings Review October 12, 2017 Overview 3Q 17 showed strong results and balanced performance across the franchise Revenue growth and positive operating leverage
Third Quarter 2014 Earnings Review
 Citi Investor Relations On October 30, 2014, Citi announced that it was adjusting downward its third quarter 2014 financial results, from those reported on October 14, 2014, due to a $600 million (pretax
Fourth Quarter 2018 Earnings Review
 Citi Investor Relations Fourth Quarter 2018 Earnings Review January 14, 2019 Overview 4Q 18 showed continued progress in a challenging environment Continued momentum in Institutional accrual businesses
Third Quarter 2018 Earnings Review
 Citi Investor Relations Third Quarter 2018 Earnings Review October 12, 2018 Overview Solid operating results in 3Q 18 Continued momentum in Institutional accrual businesses and strong results in Fixed
Credit Suisse Financial Services Forum John Gerspach. February 11, 2010
 Credit Suisse Financial Services Forum John Gerspach Chief Financial Officer February 11, 2010 Agenda Two distinct cycles Progress over the last two years Citicorp Citi Holdings Capital and Reserves 1
Fixed Income Investor Review
 Citi Fixed Income Investor Relations Fixed Income Investor Review January 23, 2015 John Gerspach Chief Financial Officer Eric Aboaf Treasurer Agenda 2014 Milestones $11.5B of net income including significant
Second Quarter 2018 Earnings Review
 Citi Investor Relations Second Quarter 2018 Earnings Review July 13, 2018 Overview Solid operating results in 2Q 18 Revenue growth in all regions and across products in Consumer Continued momentum in Institutional
Citi Technology Clients Summit John Gerspach. May 16, 2012
 Citi Technology Clients Summit John Gerspach Chief Financial Officer May 16, 2012 Uniquely Positioned for the Future Growth in every core business in 1Q 1212 Difficult to replicate Citi s global footprint
Bank of America Merrill Lynch Financial Services Conference Ned Kelly
 Bank of America Merrill Lynch Financial Services Conference Ned Kelly Vice-Chairman November 11, 2009 Citigroup Reorganization Citicorp Global bank for businesses and consumers Unmatched global network
Raymond James Annual Investors Conference
 Citi Investor Relations Raymond James Annual Investors Conference March 2, 2015 John Gerspach Chief Financial Officer Highlights Stronger, simpler and safer institution Compact balance sheet with strong
CITIGROUP REPORTS FIRST QUARTER 2013 EARNINGS PER SHARE OF $1.23; $1.29 EXCLUDING CVA/DVA 1 NET INCOME OF $3.8 BILLION; $4.0 BILLION EXCLUDING CVA/DVA
 For Immediate Release Citigroup Inc. (NYSE: C) April 15, 2013 CITIGROUP REPORTS FIRST QUARTER 2013 EARNINGS PER SHARE OF $1.23; $1.29 EXCLUDING CVA/DVA 1 NET INCOME OF $3.8 BILLION; $4.0 BILLION EXCLUDING
CITIGROUP REPORTS SECOND QUARTER 2013 EARNINGS PER SHARE OF $1.34; $1.25 EXCLUDING CVA/DVA 1
 For Immediate Release Citigroup Inc. (NYSE: C) July 15, 2013 CITIGROUP REPORTS SECOND QUARTER 2013 EARNINGS PER SHARE OF $1.34; $1.25 EXCLUDING CVA/DVA 1 NET INCOME OF $4.2 BILLION; $3.9 BILLION EXCLUDING
CITIGROUP - QUARTERLY FINANCIAL DATA SUPPLEMENT
 CITIGROUP - QUARTERLY FINANCIAL DATA SUPPLEMENT 4Q17 Page Citigroup Consolidated Financial Summary 1 Consolidated Statement of Income 2 Consolidated Balance Sheet 3 Segment Detail Net Revenues 4 Income
CITIGROUP REPORTS THIRD QUARTER 2014 EARNINGS PER SHARE OF $1.07; $1.15 EXCLUDING CVA/DVA 1
 For Immediate Release Citigroup Inc. (NYSE: C) October 14, 2014 CITIGROUP REPORTS THIRD QUARTER 2014 EARNINGS PER SHARE OF $1.07; $1.15 EXCLUDING CVA/DVA 1 ANNOUNCES STRATEGIC ACTIONS IN GLOBAL CONSUMER
CITIGROUP - QUARTERLY FINANCIAL DATA SUPPLEMENT
 CITIGROUP - QUARTERLY FINANCIAL DATA SUPPLEMENT 1Q18 Page Citigroup Consolidated Financial Summary 1 Consolidated Statement of Income 2 Consolidated Balance Sheet 3 Segment Detail Net Revenues 4 Income
CITIGROUP REPORTS THIRD QUARTER 2012 EARNINGS PER SHARE OF $0.15; $1.06 EXCLUDING CVA/DVA 1, LOSS ON MSSB 2 AND TAX BENEFIT 3
 For Immediate Release Citigroup Inc. (NYSE: C) October 15, 2012 CITIGROUP REPORTS THIRD QUARTER 2012 EARNINGS PER SHARE OF $0.15; $1.06 EXCLUDING CVA/DVA 1, LOSS ON MSSB 2 AND TAX BENEFIT 3 CITIGROUP NET
CITIGROUP - QUARTERLY FINANCIAL DATA SUPPLEMENT
 CITIGROUP - QUARTERLY FINANCIAL DATA SUPPLEMENT 4Q15 HISTORICAL Page Citigroup Consolidated Financial Summary 1 Consolidated Statement of Income 2 Consolidated Balance Sheet 3 Segment Detail Net Revenues
Citigroup Inc. (Exact name of registrant as specified in its charter)
") UNITED STATES SECURITIES AND EXCHANGE COMMISSION WASHINGTON, D.C. 20549 FORM 10-Q QUARTERLY REPORT PURSUANT TO SECTION 13 OR 15(d) OF THE SECURITIES EXCHANGE ACT OF 1934 For the quarterly period ended
UNITED STATES SECURITIES AND EXCHANGE COMMISSION WASHINGTON, D.C. 20549 FORM 10-Q QUARTERLY REPORT PURSUANT TO SECTION 13 OR 15(d) OF THE SECURITIES EXCHANGE ACT OF 1934 For the quarterly period ended
CITIGROUP REPORTS SECOND QUARTER 2015 EARNINGS PER SHARE OF $1.51; $1.45 EXCLUDING CVA/DVA 1
 For Immediate Release Citigroup Inc. (NYSE: C) July 16, 2015 CITIGROUP REPORTS SECOND QUARTER 2015 EARNINGS PER SHARE OF $1.51; $1.45 EXCLUDING CVA/DVA 1 NET INCOME OF $4.8 BILLION; $4.7 BILLION EXCLUDING
CITIGROUP - QUARTERLY FINANCIAL DATA SUPPLEMENT
 CITIGROUP - QUARTERLY FINANCIAL DATA SUPPLEMENT 3Q17 Page Citigroup Consolidated Financial Summary 1 Consolidated Statement of Income 2 Consolidated Balance Sheet 3 Segment Detail Net Revenues 4 Income
CITIGROUP NET INCOME OF $2.9 BILLION; $3.1 BILLION EXCLUDING CVA/DVA AND THE LOSS ON AKBANK
 For Immediate Release Citigroup Inc. (NYSE: C) July 16, 2012 CITIGROUP REPORTS SECOND QUARTER 2012 EARNINGS PER SHARE 1 OF $0.95; $1.00 EXCLUDING THE IMPACT OF POSITIVE CVA/DVA 2 AND A NET LOSS ON THE
Repaying TARP and Other Capital Actions. December 14, 2009
 Repaying TARP and Other Capital Actions December 14, 2009 Overview Citigroup, U.S. government and regulators agree to TARP repayment Repaying $20 billion of TARP trust preferred securities Agreement reached
CEO COMMENTARY FOURTH QUARTER 2017 RESULTS AND KEY METRICS. Adjusted ROE: 6.5% 2 Adjusted RoTCE ex. DTA: 8.9% 3. Adjusted Payout Ratio 187% 6
 On February 23, 2018, Citi announced that it was adjusting downward its fourth quarter and full year 2017 financial results, from those reported on January 16, 2018, due to an updated estimate for a one-time,
UNITED STATES SECURITIES AND EXCHANGE COMMISSION WASHINGTON, D.C FORM 8-K
 UNITED STATES SECURITIES AND EXCHANGE COMMISSION WASHINGTON, D.C. 20549 FORM 8-K CURRENT REPORT Pursuant to Section 13 or 15(d) of the Securities Exchange Act of 1934 Date of Report (Date of earliest event
Deutsche Bank Global Financial Services Investor Conference
 Citi Investor Relations Deutsche Bank Global Financial Services Investor Conference May 27, 2014 John Gerspach Chief Financial Officer Highlights Focused on execution in challenging operating environment
Citi Financial Services Conference Vikram Pandit. March 9, 2011
 Citi Financial Services Conference Vikram Pandit Chief Executive Officer March 9, 2011 Solid Foundation For Sustainable Growth Returned to profitability in 2010 Increased investments in Citicorp Continued
First Quarter 2008 Earnings Review. April 18, 2008
 First Quarter 2008 Earnings Review April 18, 2008 Summary Income Statement ($B, except EPS) 1Q 08 1Q 07 % Net Interest Revenue $13.5 $10.6 27% Other Revenue (0.3) 14.8 NM Net Revenues $13.2 $25.5 (48%)
CITIGROUP REPORTS FIRST QUARTER 2015 EARNINGS PER SHARE OF $1.51; $1.52 EXCLUDING CVA/DVA 1 NET INCOME OF $4.8 BILLION
 For Immediate Release Citigroup Inc. (NYSE: C) April 16, 2015 CITIGROUP REPORTS FIRST QUARTER 2015 EARNINGS PER SHARE OF $1.51; $1.52 EXCLUDING CVA/DVA 1 NET INCOME OF $4.8 BILLION REVENUES OF $19.7 BILLION;
Raymond James Annual Investors Conference
 Citi Investor Relations Raymond James Annual Investors Conference March 3, 2014 John Gerspach Chief Financial Officer Highlights Improved performance in 2013 reflects ongoing transformation Continued to
CEO COMMENTARY FOURTH QUARTER AND FULL YEAR 2018 RESULTS AND KEY METRICS ROE 9.4% 2018 RoTCE 10.9% Efficiency Ratio 57.
 For Immediate Release Citigroup Inc. (NYSE: C) January 14, 2019 FOURTH QUARTER AND FULL YEAR 2018 RESULTS AND KEY METRICS 2018 Efficiency Ratio 57.4% 1 2018 ROE 9.4% 2018 RoTCE 10.9% 2 CET1 Capital Ratio
Citigroup Inc. (Exact name of registrant as specified in its charter)
") UNITED STATES SECURITIES AND EXCHANGE COMMISSION WASHINGTON, D.C. 20549 FORM 10-Q QUARTERLY REPORT PURSUANT TO SECTION 13 OR 15(d) OF THE SECURITIES EXCHANGE ACT OF 1934 For the quarterly period ended
UNITED STATES SECURITIES AND EXCHANGE COMMISSION WASHINGTON, D.C. 20549 FORM 10-Q QUARTERLY REPORT PURSUANT TO SECTION 13 OR 15(d) OF THE SECURITIES EXCHANGE ACT OF 1934 For the quarterly period ended
2017 Investor Day Financial Overview. John Gerspach, Chief Financial Officer July 25, 2017
 2017 Investor Day Financial Overview John Gerspach, Chief Financial Officer July 25, 2017 Key Takeaways: Setting the Stage Committed to our medium and longer-term financial targets 2017 Approved for CCAR
CEO COMMENTARY FIRST QUARTER 2018 RESULTS AND KEY METRICS. CET1 Capital Ratio 12.1% 3. ROE: 9.7% RoTCE: 11.4% 2. Payout Ratio 71% 4
 For Immediate Release Citigroup Inc. (NYSE: C) April 13, 2018 FIRST QUARTER 2018 RESULTS AND KEY METRICS Efficiency Ratio 58% 1 ROE: 9.7% RoTCE: 11.4% 2 CET1 Capital Ratio 12.1% 3 EARNINGS PER SHARE OF
To read CEO Michael L. Corbat s Letter to Shareholders, please visit citi.com/annualreport
 To read CEO Michael L. Corbat s Letter to Shareholders, please visit citi.com/annualreport This page intentionally left blank. Delaware (State or other jurisdiction of incorporation or organization) 399
SLR 6.6% 3 BOOK VALUE PER SHARE OF $71.95 TANGIBLE BOOK VALUE PER SHARE OF $
 For Immediate Release Citigroup Inc. (NYSE: C) July 13, 2018 SECOND QUARTER 2018 RESULTS AND KEY METRICS CEO COMMENTARY Efficiency Ratio 58% 1 ROE: 9.2% RoTCE: 10.8% 2 CET1 Capital Ratio 12.1% 3 SLR 6.6%
MORGAN STANLEY Financial Supplement - 1Q 2015 Table of Contents
 Page # MORGAN STANLEY Financial Supplement - 1Q 2015 Table of Contents 1. Quarterly Financial Summary 2. Quarterly Consolidated Income Statement Information 3. Quarterly Earnings Per Share Summary 4-5.
Citigroup Inc. (Exact name of registrant as specified in its charter)
") UNITED STATES SECURITIES AND EXCHANGE COMMISSION WASHINGTON, D.C. 20549 FORM 10-Q QUARTERLY REPORT PURSUANT TO SECTION 13 OR 15(d) OF THE SECURITIES EXCHANGE ACT OF 1934 For the quarterly period ended
UNITED STATES SECURITIES AND EXCHANGE COMMISSION WASHINGTON, D.C. 20549 FORM 10-Q QUARTERLY REPORT PURSUANT TO SECTION 13 OR 15(d) OF THE SECURITIES EXCHANGE ACT OF 1934 For the quarterly period ended
CEO COMMENTARY FIRST QUARTER 2019 RESULTS AND KEY METRICS. ROE 10.2% RoTCE 11.9% 2. CET1 Capital Ratio 11.9% 3. Payout Ratio 115% 4
 For Immediate Release Citigroup Inc. (NYSE: C) April 15, 2019 FIRST QUARTER 2019 RESULTS AND KEY METRICS Efficiency Ratio 57.0% 1 ROE 10.2% RoTCE 11.9% 2 CET1 Capital Ratio 11.9% 3 NET INCOME OF $4.7 BILLION
Bank of America Merrill Lynch The Future of Financials Conference. November 16, Citi Investor Relations
 Citi Investor Relations Bank of America Merrill Lynch The Future of Financials Conference November 16, 2016 Jamie Forese President, Citigroup CEO, Institutional Clients Group Institutional Clients Group
Ally Financial Inc. 1Q Earnings Review
 Ally Financial Inc. 1Q Earnings Review May 1, 2013 Contact Ally Investor Relations at (866) 710-4623 or investor.relations@ally.com Forward-Looking Statements and Additional Information The following should
Ally Financial Inc. 3Q 2018 Earnings Review
 Ally Financial Inc. 3Q 2018 Earnings Review October 25, 2018 Contact Ally Investor Relations at (866) 710-4623 or investor.relations@ally.com Forward-Looking Statements and Additional Information This
Citigroup Inc. (Exact name of registrant as specified in its charter)
") UNITED STATES SECURITIES AND EXCHANGE COMMISSION Washington, D. C. 20549 FORM 10-Q QUARTERLY REPORT PURSUANT TO SECTION 13 OR 15(d) OF THE SECURITIES EXCHANGE ACT OF 1934 For the quarterly period ended
UNITED STATES SECURITIES AND EXCHANGE COMMISSION Washington, D. C. 20549 FORM 10-Q QUARTERLY REPORT PURSUANT TO SECTION 13 OR 15(d) OF THE SECURITIES EXCHANGE ACT OF 1934 For the quarterly period ended
Citigroup Inc. (Exact name of registrant as specified in its charter)
") UNITED STATES SECURITIES AND EXCHANGE COMMISSION WASHINGTON, D.C. 20549 FORM 10-Q QUARTERLY REPORT PURSUANT TO SECTION 13 OR 15(d) OF THE SECURITIES EXCHANGE ACT OF 1934 For the quarterly period ended
UNITED STATES SECURITIES AND EXCHANGE COMMISSION WASHINGTON, D.C. 20549 FORM 10-Q QUARTERLY REPORT PURSUANT TO SECTION 13 OR 15(d) OF THE SECURITIES EXCHANGE ACT OF 1934 For the quarterly period ended
Overview of Goldman Sachs. November 2017
 Overview of Goldman Sachs November 207 Cautionary Note on Forward-Looking Statements This presentation may include forward-looking statements. These statements are not historical facts, but instead represent
CITI REPORTS FOURTH QUARTER NET LOSS OF $8.29 BILLION, LOSS PER SHARE OF $1.72
 On February 27, 2009, Citi announced a fourth quarter 2008 goodwill impairment charge and a further impairment to the intangible asset related to Nikko Asset Management. These pre-tax charges of approximately
3Q17 Quarterly Supplement
 3Q17 Quarterly Supplement October 13, 2017 2017 Wells Fargo & Company. All rights reserved. Table of contents 3Q17 Results 3Q17 Highlights Year-over-year results Page 2 Balance Sheet and credit overview
2017 DFAST Mid-Cycle Stress Test Disclosure Citi Severely Adverse Scenario
 Citi 2017 2017 DFAST Mid-Cycle Stress Test Disclosure Citi Severely Adverse Scenario October 27, 2017 2017 Mid-Cycle Stress Test Overview Under the stress testing requirements of the Dodd-Frank Wall Street
Overview of Goldman Sachs. October 2014
 Overview of Goldman Sachs October 2014 Cautionary Note on Forward Looking Statements Today s presentation may include forward-looking statements. These statements are not historical facts, but instead
Citigroup Inc. (Exact name of registrant as specified in its charter)
") UNITED STATES SECURITIES AND EXCHANGE COMMISSION WASHINGTON, D.C. 20549 FORM 10-Q QUARTERLY REPORT PURSUANT TO SECTION 13 OR 15(d) OF THE SECURITIES EXCHANGE ACT OF 1934 For the quarterly period ended
UNITED STATES SECURITIES AND EXCHANGE COMMISSION WASHINGTON, D.C. 20549 FORM 10-Q QUARTERLY REPORT PURSUANT TO SECTION 13 OR 15(d) OF THE SECURITIES EXCHANGE ACT OF 1934 For the quarterly period ended
Ally Financial Inc. 2Q Earnings Review
 Ally Financial Inc. 2Q Earnings Review July 29, 2014 Contact Ally Investor Relations at (866) 710-4623 or investor.relations@ally.com Forward-Looking Statements and Additional Information The following
Deutsche Bank Q results
 Cost and capital fully on track revenue growth is now key Disciplined execution against our 2018 adjusted cost and headcount targets On track to meet our 2019 commitments Franchise focus regaining market
Citigroup Inc. (Exact name of registrant as specified in its charter)
") UNITED STATES SECURITIES AND EXCHANGE COMMISSION WASHINGTON, D.C. 20549 FORM 10-Q QUARTERLY REPORT PURSUANT TO SECTION 13 OR 15(d) OF THE SECURITIES EXCHANGE ACT OF 1934 For the quarterly period ended
UNITED STATES SECURITIES AND EXCHANGE COMMISSION WASHINGTON, D.C. 20549 FORM 10-Q QUARTERLY REPORT PURSUANT TO SECTION 13 OR 15(d) OF THE SECURITIES EXCHANGE ACT OF 1934 For the quarterly period ended
SUPPLEMENTARY FINANCIAL INFORMATION
 SUPPLEMENTARY FINANCIAL INFORMATION July 31, INDEX Page Page Enhanced Disclosure Task Force Recommendations Average Balance Sheet 13 Reference Table EDTF Consolidated Statement of Changes in Equity 14
SUPPLEMENTARY FINANCIAL INFORMATION
 SUPPLEMENTARY FINANCIAL INFORMATION January 31, 2018 Page INDEX Page Notes - Adoption of IFRS 9 Average Balance Sheet 13 Enhanced Disclosure Task Force Recommendations Consolidated Statement of Changes
CITI REPORTS THIRD QUARTER NET LOSS OF $2.8 BILLION, LOSS PER SHARE OF $0.60
 CITI REPORTS THIRD QUARTER NET LOSS OF $2.8 BILLION, LOSS PER SHARE OF $0.60 NET LOSS FROM CONTINUING OPERATIONS OF $3.4 BILLION, LOSS PER SHARE OF $0.71, PRIMARILY DUE TO FIXED INCOME WRITE-DOWNS AND
Citigroup Inc. (Exact name of registrant as specified in its charter)
") UNITED STATES SECURITIES AND EXCHANGE COMMISSION WASHINGTON, D.C. 20549 FORM 10-Q QUARTERLY REPORT PURSUANT TO SECTION 13 OR 15(d) OF THE SECURITIES EXCHANGE ACT OF 1934 Delaware (State or other jurisdiction
UNITED STATES SECURITIES AND EXCHANGE COMMISSION WASHINGTON, D.C. 20549 FORM 10-Q QUARTERLY REPORT PURSUANT TO SECTION 13 OR 15(d) OF THE SECURITIES EXCHANGE ACT OF 1934 Delaware (State or other jurisdiction
SUPPLEMENTARY FINANCIAL INFORMATION
 SUPPLEMENTARY FINANCIAL INFORMATION April 30, 2018 Page INDEX Page Notes - Adoption of IFRS 9 Average Balance Sheet 13 Enhanced Disclosure Task Force Recommendations Consolidated Statement of Changes in
SUPPLEMENTARY FINANCIAL INFORMATION
 SUPPLEMENTARY FINANCIAL INFORMATION October 31, INDEX Page Page Enhanced Disclosure Task Force Recommendations Average Balance Sheet 13 Reference Table EDTF Consolidated Statement of Changes in Equity
Ally Financial Inc. Auto Securitization - Corporate Overview 2Q 2018
 Ally Financial Inc. Auto Securitization - Corporate Overview 2Q 2018 Contact Ally Investor Relations at (866) 710-4623 or investor.relations@ally.com Forward-Looking Statements and Additional Information
SUPPLEMENTARY FINANCIAL INFORMATION
 SUPPLEMENTARY FINANCIAL INFORMATION January 31, 2018 INDEX Page Page Notes - Adoption of IFRS 9 Average Balance Sheet 13 Enhanced Disclosure Task Force Recommendations Consolidated Statement of Changes
2018 Annual Stress Test Disclosure Dodd-Frank Wall Street Reform and Consumer Protection Act
 Citi 2018 2018 Annual Stress Test Disclosure Dodd-Frank Wall Street Reform and Consumer Protection Act June 21, 2018 Overview 2018 Annual Stress Test In February 2018, the Federal Reserve Board (FRB) launched
SUPPLEMENTARY FINANCIAL INFORMATION
 SUPPLEMENTARY FINANCIAL INFORMATION October 31, 2012 INDEX Page Page Highlights 1 Consolidated Statement of Financial Position (Spot Balances) 12 & 13 Common Share and Other Information 2 Average Balance
Morgan Stanley Fixed Income Investor Conference Call
 Morgan Stanley Fixed Income Investor Conference Call August 3, 2012 Notice The information provided herein may include certain non-gaap financial measures. The reconciliation of such measures to the comparable
Ally Financial Inc. 4Q 2017 Earnings Review
 Ally Financial Inc. 4Q 2017 Earnings Review January 30, 2018 Contact Ally Investor Relations at (866) 710-4623 or investor.relations@ally.com Forward-Looking Statements and Additional Information This
SUPPLEMENTARY FINANCIAL INFORMATION
 SUPPLEMENTARY FINANCIAL INFORMATION July 31, INDEX Page Page Enhanced Disclosure Task Force Recommendations Average Balance Sheet 13 Reference Table EDTF Consolidated Statement of Changes in Equity 14
Overview of Goldman Sachs. February 2019
 Overview of Goldman Sachs February 209 Cautionary Note on Forward-Looking Statements This presentation includes forward-looking statements. These statements are not historical facts, but instead represent
Overview of Goldman Sachs. May 9, 2018
 Overview of Goldman Sachs May 9, 208 Cautionary Note on Forward-Looking Statements This presentation includes forward-looking statements. These statements are not historical facts, but instead represent
Bank of America Second Quarter 2009 Results
 Bank of America Second Quarter 2009 Results Ken Lewis CEO and President Joe Price Chief Financial Officer July 17, 2009 Forward Looking Statements Bank of America and its management may make certain statements
4Q17 and FY2017 Financial Results. January 19, 2018
 4Q17 and FY2017 Financial Results January 19, 2018 Forward-looking statements and use of key performance metrics and non-gaap Financial Measures This document contains forward-looking statements within
Ally Financial Inc. 1Q 2015 Earnings Review
 Ally Financial Inc. 1Q 2015 Earnings Review April 28, 2015 Contact Ally Investor Relations at (866) 710-4623 or investor.relations@ally.com Forward-Looking Statements and Additional Information The following
SUPPLEMENTARY FINANCIAL INFORMATION
 SUPPLEMENTARY FINANCIAL INFORMATION July 31, 2015 INDEX Page Page Enhanced Disclosure Task Force Recommendations Consolidated Statement of Financial Position (Spot Balances) 11 & 12 Reference Table EDTF
Citi Reports Fourth Quarter Net Loss of $8.29 Billion, Loss Per Share of $1.72
 Citigroup Inc. (NYSE: C) January 16 2009 Citi Reports Fourth Quarter Net Loss of $8.29 Billion, Loss Per Share of $1.72 Net Loss from Continuing Operations of $12.14 Billion, Loss Per Share of $2.44, Primarily
1Q17 Quarterly Supplement
 1Q17 Quarterly Supplement April 13, 2017 2017 Wells Fargo & Company. All rights reserved. Table of contents 1Q17 Results Year-over-year results Retail Banking customer activity 1Q17 Highlights Page 2 Balance
SUPPLEMENTARY FINANCIAL INFORMATION
 SUPPLEMENTARY FINANCIAL INFORMATION April 30, INDEX Page Page Enhanced Disclosure Task Force Recommendations Average Balance Sheet 13 Reference Table EDTF Consolidated Statement of Changes in Equity 14
PEOPLE'S UNITED BANK, N.A Dodd-Frank Act Stress Test (DFAST) Disclosure. June 18, 2015
 Disclosure. June 18, 2015") PEOPLE'S UNITED BANK, N.A. 2015 Dodd-Frank Act Stress Test (DFAST) Disclosure June 18, 2015 1. Requirements for Dodd-Frank Stress Test In accordance with the Dodd-Frank Wall Street Reform and Consumer
PEOPLE'S UNITED BANK, N.A. 2015 Dodd-Frank Act Stress Test (DFAST) Disclosure June 18, 2015 1. Requirements for Dodd-Frank Stress Test In accordance with the Dodd-Frank Wall Street Reform and Consumer
F I N A N C I A L R E S U L T S
 J U L Y 1 8, 2 0 0 7 F I N A N C I A L R E S U L T S Second Quarter 2007 2Q07 Managed Results 1 $ in millions 1Q07 2Q Revenue (FTE) 1 $19,819 $78 $3,955 -- 25% Credit Costs 1 2,119 518 1,5 32% 101% Expense
Ally Financial Inc. 2Q 2018 Earnings Review
 Ally Financial Inc. 2Q 2018 Earnings Review July 26, 2018 Contact Ally Investor Relations at (866) 710-4623 or investor.relations@ally.com Forward-Looking Statements and Additional Information This presentation