2012 Annual Report AGRIBANK, FCB AND AFFILIATED ASSOCIATIONS
|
|
|
- Roger Robertson
- 5 years ago
- Views:
Transcription


1 AA 2012 Annual Report AGRIBANK, FCB AND AFFILIATED ASSOCIATIONS
2 TABLE OF CONTENTS AgriBank, FCB and Affiliated Associations Combined Five-Year Summary of Selected Financial Data... 1 Management's Discussion and Analysis... 2 Report of Managment Independent Auditor s Report Combined Financial Statements Notes to Combined Financial Statements Disclosure Information Required by Regulations Young, Beginning and Small Farmers and Ranchers Risk Factors Additional copies of our annual or quarterly reports may be requested free of charge by contacting AgriBank, FCB at 30 East 7 th Street, St. Paul, MN , (651) , or via to agribankmn@agribank.com. These reports are also available through AgriBank s website at To request free copies of our Annual or Quarterly Reports contact us as stated above. The Annual Report is available on our website approximately 75 days after the end of the calendar year and members are provided a copy of such report 90 days after the end of the calendar year. The Quarterly Reports are available on our website approximately 40 days after the end of each calendar quarter.
3 Combined Five-Year Summary of Selected Financial Data AgriBank, FCB and Affiliated Associations (Dollars in thousands) Combined Statement of Condition Data Loans $77,089,134 $68,349,565 $65,035,081 $60,245,483 $57,151,728 Allowance for loan losses 262, , , , ,254 Net loans 76,826,204 68,049,057 64,628,735 59,859,481 56,940,474 Investment securities and federal funds - AgriBank, FCB 11,731,861 9,988,547 10,647,108 9,575,083 9,393,119 Investment securities - Affiliated Associations 2,275,266 2,262,747 2,033,809 1,877,871 1,613,670 Other property owned 67, ,260 94,491 55,821 18,991 Other assets 2,607,512 2,723,064 2,368,284 2,456,481 2,501,265 Total assets $93,508,679 $83,136,675 $79,772,427 $73,824,737 $70,467,519 Obligations with maturities of one year or less $25,863,061 $22,700,685 $23,791,456 $22,692,372 $22,761,577 Other obligations with maturities greater than one year 52,717,155 47,002,090 43,723,027 40,289,214 38,437,214 Subordinated notes with maturities greater than one year 600, , , , Total liabilities 79,180,216 70,302,775 68,114,483 63,481,586 61,198,791 Protected borrower equity 305 2,056 2,716 3,391 4,124 At-risk borrower equity 261, , , , ,168 Allocated surplus 302, , , , ,300 Unallocated surplus 14,324,793 12,875,783 11,576,553 10,350,806 9,541,610 Accumulated other comprehensive loss (583,324) (594,096) (433,529) (480,959) (705,474) Noncontrolling interest 22,082 6, Total members' equity 14,328,463 12,833,900 11,657,944 10,343,151 9,268,728 Total liabilities and members' equity $93,508,679 $83,136,675 $79,772,427 $73,824,737 $70,467,519 Combined Statement of Income Data Net interest income $2,311,454 $2,172,337 $2,052,135 $1,828,414 $1,563,691 Provision for credit losses (33,907) (23,637) (189,913) (320,374) (126,220) Provision for income taxes (39,116) (55,726) (50,901) (29,411) (22,291) Other expenses, net (519,042) (553,180) (374,249) (579,279) (428,591) Net income $1,719,389 $1,539,794 $1,437,072 $899,350 $986,589 Combined Key Financial Ratios Return on average assets 1.98% 1.91% 1.91% 1.26% 1.52% Return on average members' equity 12.56% 12.47% 12.98% 9.16% 10.71% Net interest income as a percentage of average earning assets 2.73% 2.76% 2.79% 2.64% 2.48% Members' equity as a percentage of total assets 15.32% 15.44% 14.61% 14.01% 13.15% Net charge-offs as a percentage of average loans 0.09% 0.18% 0.28% 0.25% -- Allowance for loan losses as a percentage of loans 0.34% 0.44% 0.62% 0.64% 0.37% Debt to members' equity (:1) Permanent capital ratio (AgriBank only) 21.1% 20.9% 20.6% 18.4% 15.4% Total surplus ratio (AgriBank only) 17.4% 17.3% 16.7% 14.3% 11.5% Core surplus ratio (AgriBank only) 10.4% 10.1% 10.0% 8.2% 7.6% Net collateral ratio (AgriBank only) 106.0% 106.2% 105.8% 105.6% 104.6% Other Cash patronage paid in the current year $5,404 $428 $374 $336 $913 Cash patronage to be paid in the next fiscal year 209, , ,902 93, ,966 Total cash patronage refunds to members $214,586 $199,854 $175,276 $93,793 $107,879 Stock patronage issued in the current year $474 $361 $377 $333 $ -- Stock patronage to be issued in the next fiscal year Total stock patronage refunds to members $826 $695 $945 $675 $ -- Net surplus allocated under nonqualified patronage program $54,967 $40,015 $36,409 $27,206 $33,769 Redemption of surplus allocated under nonqualified patronage program 42,694 14,509 1,262 1,642 18,299 No dividend distributions were made during the years presented. 1
4 Management s Discussion and Analysis AgriBank, FCB and Affiliated Associations The following commentary reviews the financial condition and results of operations of AgriBank, FCB (AgriBank) and affiliated Associations (the District) and provides additional specific information. The accompanying combined financial statements and notes to the combined financial statements also contain important information about our financial condition and results of operations. The Farm Credit System The Farm Credit System (the System) is a nationwide network of borrower-owned lending institutions and specialized service organizations. Farm Credit provides more than $191 billion in loans, leases and related services to farmers, ranchers, rural homeowners, aquatic producers, timber harvesters, agribusinesses and agricultural and rural utility cooperatives. Congress established the System in 1916 to provide a reliable source of credit for the nation's farmers and ranchers. Today, the System provides more than one-third of the credit needed by those who live and work in rural America. Farmers, ranchers, agribusiness, rural homeowners and rural utilities depend on the Farm Credit System s funding and services to produce the high quality food and agricultural products enjoyed in the United States and around the globe. The Farm Credit mission is to provide a reliable source of credit for American agriculture by making loans to qualified borrowers at competitive rates and providing insurance and related services. Nearing our 100th anniversary, the System has: Assets in excess of $246 billion Nearly 500,000 member-borrowers More than 12,000 employees Coverage in every county in all 50 states plus Washington DC and Puerto Rico At December 31, 2012, the System was comprised of three Farm Credit Banks, one Agricultural Credit Bank and 82 Associations across the nation. Farm Credit System entities have specific lending authorities within their chartered territories. Farm Credit System Banks and Associations are subject to examination and regulation by an independent federal agency, the Farm Credit Administration (FCA). The Federal Farm Credit Banks Funding Corporation (the Funding Corporation) issues a variety of Federal Farm Credit Banks Consolidated Systemwide Debt Securities with broad ranges of maturities and structures on behalf of the Farm Credit System Banks. The Farm Credit System Insurance Corporation insures the timely payment of principal and interest on insured notes, bonds, and other obligations issued on behalf of Farm Credit System Banks. The Farm Credit System 2012 Annual Information Statement, issued by the Funding Corporation, includes additional information about the Farm Credit System, its funding activities and its combined financial results. You can obtain a copy of that report by contacting the Funding Corporation or visiting their website. Their contact information is located at the end of this annual report. 2
5 AgriBank and Affiliated Associations AgriBank is owned by 17 affiliated Farm Credit Associations and other financial institution (OFI) customers. AgriBank, FCB and affiliated Associations are collectively referred to as the District. AgriBank and affiliated Associations have more than $93 billion in assets. The District covers America s Midwest, a fifteen state area from Wyoming to Ohio and Minnesota to Arkansas. More than half of the nation s cropland is located within the AgriBank District. Basis of Presentation The combined financial statements and related financial information found in this Annual Report include the accounts of AgriBank and its affiliated Associations and related entities. These financial statements are presented on a combined basis due to the financial and operational interdependence of the District entities. This interdependence results, in part, from the fact that AgriBank serves as an intermediary between the financial markets and the retail lending activities of the affiliated Associations. As a result, the loans made by the Associations to the borrowers are substantially funded by Systemwide debt securities issued by AgriBank. AgriBank s ability to repay the Systemwide debt securities is dependent upon the ability of the Association borrowers to repay their loans. In the combined financial statements, the accounts of the individual District entities are combined and all significant intra-district transactions and balances are eliminated. Risk Management Risk is inherent in our business and sound risk management practices are a fundamental component of our operations. AgriBank s prudent and disciplined approach to risk management includes a formal enterprise risk management structure established to identify emerging risks and evaluate risk implications of the decisions and actions of AgriBank and others while these practices vary by entity, the overarching goals of our collective enterprise risk management practices are to: effectively assess, prioritize, monitor and report key organizational risks enhancing our ability to achieve our business objectives; embed a risk-aware culture throughout the District; identify and implement strategies to mitigate risk where appropriate; and ensure we are adequately compensated for the risks that we take. The Board of Directors of each of the entities within the District oversee risk management by adopting policies to guide the organization s risk tolerance and by monitoring performance against established risk limits. Within each Board s risk framework and limits, management establishes controls to guide the day-to-day risk management activities of the organization. Each Board, through its Audit Committee, also monitors risk management and policy compliance through the Internal Audit function. Information on some of the major types of risk inherent in our business follows: Credit risk is the risk of loss arising from a borrower or counterparty failing to perform on an obligation. Our primary sources of credit risk are our lending activities, investment portfolio and derivative contracts. We are also exposed to credit risk under our joint and several liability for Systemwide debt securities. 3
6 Interest rate risk is the risk that changes in interest rates may adversely affect operating results and financial condition. Our interest rate risk arises primarily from financing fixed rate instruments that can be prepaid, adjustable rate loans with interest rate caps and from decisions related to the investment of our equity. Substantially all of interest rate risk is managed by AgriBank. Liquidity risk is the risk of loss arising from the inability to meet obligations when they come due without incurring excessive costs. Our primary source of liquidity is access to the debt markets, which could be temporarily disrupted or available only by paying a high rate of interest. A secondary source of liquidity is provided by AgriBank s investment portfolio. Events or concerns in a particular sector could result in segments of AgriBank s investment portfolio becoming illiquid or liquid only at a severe discount to carrying value. Operational risk is the risk of loss resulting from inadequate or failed internal processes or systems, errors by employees or from external events. Reputation risk is the risk of loss resulting from events, real or perceived, that shape the image of the Farm Credit System or any of its entities. Such risks include the impact of investors perceptions about agriculture, the reliability of the Farm Credit System financial information, or the overt actions of any Farm Credit System Institution. These risks, and the methods we use to manage them, are discussed in the following sections. District Merger Activity On January 1, 2008, AgCountry Farm Credit Services, ACA and Farm Credit Services of Grand Forks, ACA consolidated to form a new Association known as AgCountry Farm Credit Services, ACA. Simultaneously, the subsidiaries of Farm Credit Services of Grand Forks, ACA merged into the subsidiaries of AgCountry Farm Credit Services, ACA. The associations had been operating under a joint management agreement since April 1, The consolidation was accounted for on a historical cost basis similar to that of a pooling of interests. Forward-Looking Information This Annual Report includes, and our representatives may from time to time make, projections concerning financial information and statements concerning future economic performance and events, plans and objectives relating to management, operations, products and services, and assumptions underlying these projections and statements. These projections and statements are not historical facts but instead represent only our belief regarding future events, many of which, by their nature, are inherently uncertain and outside our control. These projections and statements may address, among other things, business strategy, competitive strengths, goals, market and industry developments and the growth of our businesses and operations. The words anticipate, believe, estimate, expect, intend and similar expressions, as they relate to the District or its management, are intended to identify forward looking statements. Such statements reflect the current views of the District with respect to future events and are subject to certain risks, uncertainties and assumptions, including the risk factors described in this Annual Report. Should one or more of these risks or uncertainties materialize, or should underlying assumptions prove incorrect, actual results may vary materially from those described herein as anticipated, believed, estimated, expected or intended. 4
7 Such forward looking statements are not guarantees of future performance and involve risks and uncertainties and actual results may differ from those in the forward looking statements as a result of various factors. The information contained in this Annual Report, including without limitation, the information under Management s Discussion and Analysis identifies important factors that could cause such differences, including but not limited to a change in the U.S. agricultural economy, overall economic conditions, changes in market rates of interest and the effect of new legislation or government regulations or directives. However, actual results and developments may differ materially from our expectations and predictions due to a number of risks and uncertainties, many of which are beyond our control. These risks and uncertainties include, but are not limited to: political, legal, regulatory, financial markets and economic conditions and developments in the U.S. and abroad; economic fluctuations in the agricultural, international and farm-related business sectors; weather-related, disease and other adverse climatic or biological conditions that periodically occur that impact agricultural productivity and income; changes in U.S. government support of the agricultural industry and the Farm Credit System as a government-sponsored enterprise, as well as investor and rating agency reactions to events involving the U.S. government, other government-sponsored enterprises and other financial institutions; actions taken by the Federal Reserve System in implementing monetary policy; credit, interest rate and liquidity risk inherent in our lending activities; and changes in our assumptions for determining the allowance for loan losses, other than temporary impairment and fair value measurements. Refer to additional discussion in the Risk Factors section at the end of this report. Critical Accounting Policies Our combined financial statements are reported based on accounting principles generally accepted in the United States of America and require that significant judgment be applied to various accounting, reporting and disclosure matters. We use assumptions and estimates to apply these principles where actual measurement is not possible or practical. For a complete discussion of significant accounting policies, refer to Note 2 of the accompanying combined financial statements. The following is a summary of certain critical accounting policies: Allowance for loan losses The allowance for loan losses is our best estimate of the amount of losses on loans in our portfolio as of the date of the financial statements. We determine the allowance for loan losses based on a periodic evaluation of our loan portfolio, which considers loan loss history, probability of default, estimated loss severity, portfolio quality and current economic and environmental conditions. Refer to the Loan Portfolio Analysis of the Allowance for Loan Losses section for further discussion. Valuation methods We apply various valuation methods to assets and liabilities that often involve judgment, particularly when liquid markets do not exist for the particular items being valued. Quoted market prices are referred to when estimating fair values for certain assets, such as certain investment securities. However, for those items for which an observable active market does not exist, management utilizes significant estimates and assumptions to value such items. These valuations require the use of various assumptions, including, among others, discount rates, rates of return on assets, repayment rates, cash flows, default rates, loss severity rates, third party prices, costs of servicing and liquidation values. The use of different assumptions could produce significantly different results. 5
8 Financial Overview Our financial performance reflected strong earnings and continued loan growth for We recorded record net income of $1.7 billion in 2012, an increase of $179.6 million or 11.7% from one year ago. The most significant drivers were increases in net interest income of $139.2 million and non-interest income of $72.7 million (primarily a non-recurring distribution received from the Farm Credit System Allocated Insurance Reserve Accounts (AIRA) and mineral income) and a decrease in provision for income taxes of $16.6 million. These favorable variances were partially offset by increases in non-interest expenses and provision for credit losses of $38.6 million and $10.3 million, respectively. Refer to the Results of Operations section for further explanation of these changes. Loan Portfolio The components of loans are presented in the accompanying table: (in millions) As of December 31, Accrual loans: Real estate mortgage $43,388.4 $37,783.6 $35,110.6 $32,663.8 $31,350.4 Production and intermediate term 21, , , , ,838.8 Agribusiness 6, , , , ,053.7 Rural residential real estate 2, , , , ,005.2 Other 3, , , , ,074.6 Nonaccrual loans , Total loans $77,089.1 $68,349.6 $65,035.1 $60,245.5 $57,151.7 The other category is primarily comprised of communication and energy related loans and finance leases as well as AgriBank s loans to other financial institutions (OFIs) and loans originated under our Mission Related Investment authority. All of these categories have seen growth during The increase in total loans from December 31, 2011 was primarily in the real estate mortgage sector driven by demand for cropland. In addition, following seasonal patterns, loans increased significantly in December 2012 as borrowers increased their operating lines as they purchased 2013 production inputs primarily for tax planning strategies. The seasonal increase was magnified by increased real estate activity, which in part was spurred by uncertainty regarding potential tax law changes as of January 1, Beginning in April 2011, AgriBank began participating in the AgDirect program. The increase in the production and intermediate term sector from December 31, 2011 was primarily driven by this program. Under this program, AgriBank purchases 100% loan participation interests in retail equipment financing loans from AgDirect LLP (LLP), a Limited Liability Partnership. At December 31, 2012, the LLP was owned by five District Associations and four Associations from outside the District. Our loan portfolio exhibits some seasonality relating to the patterns of operating loans made to crop producers. Loans are normally at lowest levels during the winter months because of repayments following harvest and then increase throughout the year due to borrowings to fund operating needs, although we do see temporary increases in operating loans in December primarily due to tax planning strategies. 6
9 Loan Credit Risk Management The eligible borrowers, to whom we are authorized to make loans or participate in loans made to, are specified under the Farm Credit Act. As a result, our loan portfolio is concentrated in the agricultural industry. Earnings, loan growth and the credit quality of our loan portfolio can be affected significantly by the general state of the economy primarily as it affects agriculture and users of agricultural products. We actively manage our credit risk through various policies and standards, including our loan committees reviewing significant loan transactions. Underwriting standards include analysis of five credit factors: repayment capacity, capital position, collateral, management ability and loan terms. These standards vary by agricultural sector and are updated to reflect current market conditions. Many of the credits in our portfolio are large and complex and we do not use standardized credit scoring on these loans. Loans under $250 thousand comprise 90.8% of District customers by number and 38.5% of our loan volume. Associations generally use statistically validated scorecards to evaluate smaller credits. We use credit factors to evaluate, identify and disclose risk in our loan portfolio based on the FCA s Uniform Classification System. We assign an asset quality classification to each loan in our loan portfolio within the following categories: Acceptable assets are non-criticized assets representing the highest quality. They are expected to be fully collectible. This category is further differentiated into various probabilities of default; Other Assets Especially Mentioned (Special Mention) assets are currently collectible but exhibit some potential weakness. These assets involve increased credit risk, but not to the point of justifying a substandard classification; Substandard assets exhibit some serious weakness in repayment capacity, equity and/or collateral pledged on the loan; Doubtful assets exhibit similar weaknesses as substandard assets. However, doubtful assets have additional weaknesses in existing factors, conditions and values that make collection in full highly questionable; and Loss assets are considered uncollectible. 7
10 The following table presents the credit quality of our loan portfolio under the FCA Uniform Loan Classification System by loan type (accruing loans include accrued interest receivable): (in millions) As of December 31, 2012 Acceptable Special mention Substandard/Doubtful Total Real estate mortgage $42, % $ % $1, % $44, % Production and intermediate term 20, % % % 21, % Agribusiness 5, % % % 6, % Rural residential real estate 2, % % % 2, % Other 3, % % % 3, % Total loans $74, % $1, % $2, % $77, % (in millions) As of December 31, 2011 Acceptable Special mention Substandard/Doubtful Total Real estate mortgage $36, % $ % $1, % $38, % Production and intermediate term 18, % % % 19, % Agribusiness 5, % % % 5, % Rural residential real estate 2, % % % 2, % Other 2, % % % 2, % Total loans $64, % $1, % $2, % $69, % (in millions) As of December 31, 2010 Acceptable Special mention Substandard/Doubtful Total Real estate mortgage $33, % $1, % $1, % $36, % Production and intermediate term 17, % % % 18, % Agribusiness 5, % % % 6, % Rural residential real estate 2, % % % 2, % Other 2, % % % 2, % Total loans $60, % $2, % $2, % $65, % The credit quality of our loan portfolio remains strong at December 31, 2012 with 97.4% of our portfolio in the acceptable and special mention categories compared to 96.8% and 95.5% at December 31, 2011 and 2010, respectively. Agriculture has experienced mostly positive economic conditions over the past decade. However, agriculture is a cyclical industry and is expected to experience periodic downturns. In addition to the FCA s Uniform Classification System, we also use a two-dimensional loan rating model that incorporates a 14-point probability of default scale to identify and track the probability of borrower default and a separate 6-tier scale addressing loss given default over a period of time. Each of the probability of default rating categories carries a distinct percentage of default probability. The 14-point probability of default scale provides for granularity of the probability of default, especially in the acceptable ratings. There are 9 acceptable categories that range from a borrower of the highest quality to a borrower of minimally acceptable quality. The range of probabilities of default between 1 and 9 is very narrow and would reflect almost no default to a minimal default percentage. The probability of default increases more rapidly as a loan moves from a 9 to a 10 and increases significantly as a loan moves to an 11. A 12 or worse rating indicates that default is almost certain. The 6-tier scale for loss given default measures the expected loss severity based upon the adequacy of the collateral supporting the loan. A substantial portion of the loan portfolio is collateralized, which reduces our exposure to credit losses. Additionally, our credit policies reduce credit risk with emphasis placed on repayment capacity rather than exclusively on the underlying collateral. Although FCA regulations allow real estate 8
11 mortgage loans of up to 85% of appraised value, our underwriting standards generally allow only 65%. While underwriting exceptions on loan to appraised value are granted, they are often structured with additional principal payments in the early years. Refer to further discussion within the Land Values portion of the Agricultural Conditions section of this report. Borrower and commodity concentration lending limits have been established to manage credit exposure. The lending limit to a single borrower, as set out in the Associations General Financing Agreement (GFA) with AgriBank, is generally 15% of each Association s permanent capital. We reduce credit risk in the loan portfolio through government guarantee programs. At December 31, 2012, $1.7 billion of loans contained various levels of guarantees under such programs. One Association has reduced risk in their loan portfolios through the use of credit default swaps in connection with synthetic securitizations. The amount of loans under credit default swaps was $417.7 million at December 31, During 2012, another Association terminated its credit default swap agreement. We also manage credit risk through loan participations. We diversify our portfolio and limit our exposure to an individual borrower or commodity through buying and selling loans to other institutions within or outside of the Farm Credit System. Managing loans through participations also allows us to manage growth and capital primarily to improve geographic or commodity diversification. Portfolio Maturities The contractual maturities of loans were as follows: (in thousands) Over One One Year Through Over Five As of December 31, 2012 or Less Five Years Years Total Real estate mortgage $4,742,842 $15,931,999 $23,133,979 $43,808,820 Production and intermediate term 10,873,031 9,629, ,522 21,293,391 Agribusiness 3,124,751 2,228,075 1,049,959 6,402,785 Rural residential real estate 160, ,038 1,707,705 2,501,794 Other 1,413,630 1,000, ,288 3,082,344 Total loans $20,314,305 $29,424,376 $27,350,453 $77,089,134 Total of loans due after one year with: Fixed interest rates $25,703,320 Variable and adjustable interest rates 31,071,509 9
12 Portfolio Diversification Loan concentrations exist when amounts loaned to multiple borrowers engaged in similar activities, or within close proximity, would cause them to be similarly affected by economic or other conditions. The charts below illustrate commodity and geographic distribution of our portfolio as of December 31, 2012: Poultry, 3% Food products, 3% Ethanol, 1% Investor real estate, 5% Residential real estate, 5% District Portfolio Commodity Distribution Timber, 3% Other, 10% Dairy, 8% Cattle, 9% Pork, 5% Crops, 48% District Portfolio State Distribution Iowa 12% Illinois 10% Minnesota 9% Nebraska 8% Indiana 6% Wisconsin 6% Michigan 6% Ohio 6% Tennessee 5% South Dakota 5% Missouri 5% Kentucky 4% North Dakota 4% Arkansas 3% Wyoming 1% Other states 10% 100% While the portfolio has concentrations in crops, these crops represent staple commodities of agriculture corn, soybeans and wheat. There is diversification of these crops geographically with multiple states being significant producers of these important crops. There is further concentration in crops to some extent in the investor real estate loans. These loans are typically made for the purchase of land that is rented for crop production. Certain Associations have diversified the concentration in agricultural production through rural residential real estate and part-time farmer loans as well as agribusiness loans. Rural residential real estate, investor real estate and part-time farmer borrowers (agri-consumers) generally have significant off-farm sources of income, and therefore, are less subject to cycles in agriculture. These borrowers have been more susceptible to changes in the general economy and the condition of the general economy will influence the credit quality of these segments of the portfolio. It is important to note the counter-cyclical diversification effect of grain and livestock production. High grain prices are generally favorable to crop producers; however, livestock producers are adversely affected through higher feed costs. Conversely, low grain prices are generally negative to crop producers but tend to improve the profitability for those livestock producers who purchase most or all of their feed. Extreme volatility in commodity prices can negatively impact our District producers. The ten largest customers as of December 31, 2012 represented 2.2% of total loans (includes accrued interest receivable). Small loans (less than $250 thousand) account for 90.8% of District customers by number and 38.5% of our loan volume. Credit risk on small loans is usually reduced by non-farm income sources. Loans under $250 thousand are generally evaluated using statistically validated scorecards. The scorecards widely used by District institutions are related to operating, intermediate term (generally for farm equipment), agricultural mortgage and home mortgage loans. At December 31, 2012, we had 365 thousand scored loans, 10
13 or 62.2% by number of loans of the portfolio representing $14.7 billion, or 18.8% of total loans (includes accrued interest receivable), of which only 0.9% were delinquent. Of the ten largest customers, 98.9% of these loans were classified as acceptable, and 1.1% were classified as special mention. Within these ten largest customers there are concentrations in three significant industries: food products at 28.2%; farm machinery and equipment at 25.2%; and timber at 20.3%. Agricultural Conditions The United States Department of Agriculture (USDA) projects that U.S. net farm income will decline $5.1 billion in 2012, to $112.8 billion, when compared to the $117.9 billion for Net cash income is expected to increase by $0.9 billion, to $135.6 billion when compared to the previous record of $134.7 billion in The increase in net cash income was driven by an $11.4 billion reduction in inventory levels. The farm sector s debtto-asset ratio for 2012 is now forecasted at 10.6% which is incrementally stronger than 2011 at 10.7% net farm income is forecasted at $128.2 billion which is up 14% from The value of feed grain and oil seed crop production is forecasted to rise in 2013 as large production increases more than offset expected price declines. The 2013 forecast assumes a return to trend in crop yields and production following the 2012 U.S. drought. A 3.5% increase is forecasted in the value of livestock, dairy and poultry production production expenses are forecasted up $19.2 billion or 5.7% and continue a string of large year-over-year increases. Direct government payments to farmers, excluding the crop insurance program, are forecasted to remain steady in 2013 as compared to The farm sector s debt-to-asset ratio for 2013 is forecasted at 10.2% reflecting continued improvement. Drought Impact Extensive drought in the U.S., particularly in the Midwest, has reduced crop yields, resulting in increased crop prices. Multi-peril crop insurance (MPCI) will generally mitigate the economic impact of the drought for most crop producers. These insurance policies range in coverage levels from catastrophic and yield protection (at the lower end) to revenue protection (at the higher end). The MPCI policies are sold and serviced through private insurance companies designated by the USDA to provide insurance coverage. These companies share the risk of loss by reinsuring with large reinsurance companies. In addition, the USDA and its Federal Crop Insurance Corporation reinsures a portion of the risk along with the other private reinsurance companies. The USDA has reported that 84% of corn and soybean acres (collectively) were covered under MPCI in This is modestly lower than the 88% and 85% for corn and soybeans, respectively, covered in The majority of these policies provide for revenue protection. In addition, many crop producers have strengthened their financial positions over the past several years and are expected to withstand the financial impact of the drought. However, increased prices for corn and soybeans and other grains are placing pressure on livestock, poultry, ethanol and dairy producers who rely on these inputs. Some producers mitigated a portion of this risk by locking in prices for these inputs for However, some users of corn and soybeans in our portfolio will be unable to avoid some level of losses in Land Values Monitoring of agricultural land values is extensive within the District. The AgriBank District conducts an annual Benchmark Survey, completed by licensed real estate appraisers, of a sample of benchmark farms selected to represent the lending footprint of associations throughout the District. The District s most recent real estate market value survey indicated that District real estate values, on average, increased 15.7% over the twelvemonth period ending June 30, Qualitative surveys of lending officers compiled by the Federal Reserve Banks of Chicago, Kansas City and Minneapolis as of the end of the third quarter 2012 also indicated sharply 11
14 increasing farmland values. The Federal Reserve Banks survey cited year-over-year increase in the average value of non-irrigated farmland of 13% to 26%. Declining land values are a potential lending risk following periods of sustained, rapid land value increases. Nominal and real (inflation-adjusted) agricultural land values have increased in proportions greater than other asset classes such as stocks and urban residential and commercial land during the last decade, but District agricultural land values have, for the most part, escaped the valuation declines that other assets suffered during the recession. This is largely because the agricultural sector, particularly crop farming, has remained profitable throughout the economic crisis period, and demand for agricultural land has remained very strong. AgriBank District credit risk policies focus on loan repayment capacity in addition to conservative loan-to-value levels on the collateral that secure loans. Although FCA regulations allow real estate mortgage loans of up to 85% of appraised value, our underwriting standards generally limit lending to no more than 65% at origination. Due to very strong land values in much of our District, many Associations have implemented risk management practices that incorporate loan-to-appraised value thresholds below 65%. In addition, many District lenders impose lending caps per acre based on the land s sustainable income-producing capacity. While underwriting exceptions on loan-to-appraised-value are sometimes granted, in such cases loans are typically structured with shorter amortization schedules and/or additional principal payments in the early years to reduce risk. Specific Industry Conditions Specific conditions for our primary commodity exposures are discussed below. The commodity information was obtained from USDA National Agricultural Statistics Service publications as of December 31, Comparative amounts are the most recently published information, if revised. The commodity information for eggs was obtained from the Midwest Urner Barry report. 12/31/2012 9/30/2012 6/30/2012 3/31/ /31/2011 Crops Overall (Index) Corn ($ per bushel) Soybeans ($ per bushel) Wheat (all, $ per bushel) Cattle (all, $ per hundredweight) Hog (all, $ per hundredweight) Dairy ($ per hundredweight) Broilers ($ per pound) Eggs ($ per dozen) Rice ($ per hundredweight) Cotton ($ per pound) Crops Crops represent 48% of the District loan portfolio. Crop producers have enjoyed several years of strong income driven by favorable commodity prices. Prices have been driven by export demand for feed grains and animal protein as well as the expanded use of grains for bio-fuel production and by the impact of reduced yields from the drought in Therefore, District credit quality in this segment was strong with only 1.3% adversely classified at December 31, With dramatically lower than expected corn and soybean production due to the widespread drought, prices increased materially during the third quarter but moderated some during the fourth quarter of Further, with most producers having crop insurance protection, and a significant portion taking advantage of the revenue protection provision, we expect grain producer incomes to remain favorable. Strong liquidity and equity positions should be maintained and we expect continued favorable credit quality in this portfolio segment during the next 12 months. Domestic stocks of corn and soybeans are expected to be at 12
15 historically low levels, negatively impacting industries which use those commodities for inputs and ultimately the end user consumers. Corn: The 2012 corn crop was originally estimated to be 14.8 billion bushels by the USDA, up significantly from the 12.4 billion bushels in 2011 and However, the hot and dry weather throughout the corn belt during the 2012 growing season reduced yields substantially. While trend-line yields suggested a 166 bushel yield could be expected, adverse weather reduced yields to the current forecast of 123 bushels per acre. Planted acres for the 2012 corn crop were significantly higher than prior years with 97 million planted acres compared to 92 million planted acres in 2011 and 88 million planted acres in This is the most acres planted to corn since the 1930 s. Based on these factors, a 10.8 billion bushel corn crop is now projected for The 2011 / 2012 marketing year carryout-to-use ratio was already historically tight at 7.9%. The 2012 / 2013 marketing year projected carryout-to-use ratio of 5.6% would indicate the need for demand rationing. Feed use demand and exports are projected to bear the brunt of this rationing with a 1.0 billion bushel reduction in feed usage and a 1.0 billion bushel reduction in exports as compared to initial USDA estimates. Also, projected is a reduction of 500 million bushels for ethanol production as compared to original USDA estimates. Soybeans: Soybean production for 2012 was estimated at 3.2 billion bushels, but the hot and dry weather throughout the central U.S. has reduced yield estimates from 43.9 bushels per acre to 39.6 bushels per acre in the latest USDA World Agricultural Supply and Demand Estimates report. Therefore, soybean production estimates have fallen to 3.0 billion bushels. The drop in the production estimate was partially buffered by a 3.3 million increase in planted acres from the original estimate of 73.9 million acres to the latest USDA estimate of 77.2 million acres. Production in 2011 and 2010 measured 3.1 billion and 3.3 billion bushels, respectively. As was the case with corn, soybeans ended the 2011 / 2012 market year with extremely tight stocks reflected in an ending carryout-to-use ratio of 5.4%. Another short crop in 2012 implies rationing of available soybean supplies with an ending carryout-to-use ratio projected at 4.1%. Most of the demand rationing so far has occurred in exports, which have been reduced by 160 million bushels from the original estimate. Wheat: Estimated planted wheat acreage for 2012 is 55.7 million acres, up 2.4% from Yield per acre for 2012 is now estimated at 46.3 bushels per acre, up 0.6 bushels from the initial USDA estimate and 5.9% larger than the drought-reduced 2011 yield of 43.7 bushels per acre. Projected 2012 production is 2.3 billion bushels. The combination of a larger wheat crop, poor projected wheat crops in the former Soviet Union and Australia, and tighter corn and soybean stocks has resulted in a 219 million bushel increase in total use to 2.5 billion bushels. Ending carryout stocks for the 2012 / 2013 marketing year are projected at 28.2% which is down from a 33.3% carryout-to-use ratio for the 2011 / 2012 marketing year. Livestock Cattle: Cattle represent 9% of the District loan portfolio. This segment consists of two different and distinct risk categories: cow/calf producers and cattle feedlots. At December 31, 2012, 2.5% of the cattle portfolio was adversely classified. Cow/calf: Cow/calf producers are typically small, many of whom are supported with off-farm income. While these producers typically do not generate large profits, they generally are well capitalized and represent limited credit loss exposure. They continue to represent about 75% of the total cattle portfolio. The District has cow/calf producers in almost all 15 states, with the heaviest concentrations in Tennessee, Kentucky, Nebraska, Missouri, North Dakota and South Dakota. Cattle Feedlots: Cattle feedlot producers generally operate with higher leverage, having solvency positions of 25-40%. Feedlot operator profitability is highly variable as they are dependent upon the price 13
16 difference between feeder and slaughter prices for cattle, and the cost of weight gain which is directly tied to grain prices. The District s exposure to this sector is about 25% of the total cattle portfolio and most feedlots are concentrated in Nebraska, South Dakota and Iowa. The U.S. beef cow herd size is now the smallest it has been since the early 1970 s and has declined further throughout Projections are that the beef cow herd will continue to shrink in Both feedlot and cow/calf operations have faced higher breakeven price levels in 2012 due to the continued high price of corn, other feed stocks for cattle feedlots and high hay costs for cow/calf producers. However, cow/calf operators have received record or near record prices for feeder cattle for most of this year and for those operators that have adequate pasture or feedstock, the demand for feeder cattle should provide opportunities for solid profits for the next 2-3 years. For those operators in the areas hardest hit by this year s drought, selling calves earlier than normal and liquidating cow herds has been very common. Despite a trend of increasing exports, albeit down in 2012 compared to 2011 levels, and record or near record high fed cattle prices in much of 2011 and 2012, most feedlots operators have experienced negative operating margins (prior to any risk management strategies) due to the high costs of feeder cattle, feed stocks and energy. The feedlot segment lost money in 2012 and projects to be unprofitable into the first half of Operators will need to use strong risk management practices to remain above breakeven for Dairy: Dairy represents 8% of the District loan portfolio. At December 31, 2012, 6.4% of the dairy portfolio was adversely classified. Most Midwest dairy producers should report profitable operations in The relatively high cost of feed was offset by strong milk prices, especially in the last quarter of The ratio of milk price to feed cost was higher during the last three months of the year than for all previous months except January. The outlook for 2013 has dampened somewhat with weaker demand driving a reduction in milk price. However, the market continues to present opportunities to capture positive margins over average cost of production. No significant change in dairy portfolio credit quality, either positive or negative, is anticipated at this time. Pork: Pork represents 5% of the District loan portfolio. At December 31, 2012, 3.7% of the pork portfolio was adversely classified. A large portion of U.S. pork production is concentrated in Iowa, Minnesota, Nebraska, Indiana and Illinois. The industry was, for the most part, profitable in 2010, 2011 and 2012, allowing for substantial recovery of losses incurred in previous years ( ). Many producers have been able to build working capital levels necessary to weather the losses associated with the rapid and extreme price increases of corn and soybeans that occurred as a result of the short 2012 crop. The current outlook is that those producers with limited use of available risk management tools will likely incur losses during the first half of Robust price risk and margin management practices by some producers will partially mitigate the losses expected in the first half of the year. However extreme volatility remains in this industry. Due to the relative strength of producer balance sheets and the relatively wide use of risk management practices in the industry entering this downturn, credit quality is expected to remain fairly stable in the near term. Poultry Poultry represents 3% of the District loan portfolio. At December 31, 2012, 6.4% of the poultry portfolio was adversely classified. Broilers: Much of the District s broiler exposure is to contract growers. Over 90% of U.S. broiler production is contracted through poultry integrators (processors) represented the worst prolonged period of losses in broiler industry history due to the combination of sharply higher feed costs and oversupply of broiler meat. The industry responded to losses in 2011 with significant reductions in egg sets and chick placements in late 2011 and throughout Due to these production cutbacks and resulting lower cold storage stocks, prices improved 14
17 substantially throughout With stronger prices, easing of feed costs and record export levels, the industry achieved profitability and improved balance sheets throughout most of However, the 2012 U.S. drought has driven up feed costs again, resulting in modest losses for some in the industry in late 2012 and continuing into However, the broiler industry is in a better position today than two years ago to withstand higher feed costs due to continued management of production levels and strong broiler market pricing. Therefore, while some downgrades are likely in 2013, credit quality is expected to remain relatively stable. Turkeys: The turkey industry has enjoyed three years of profitability due to well controlled production, steady domestic demand and record export demand. Record prices continued throughout However, with an estimated 3% production increase in 2012 and the recent sharp rise in feed costs, profitability is likely to be challenged in Production is forecasted to decrease by 3% in 2013 in response to higher feed costs. Due to the balance sheet strength built up by the industry over the past three years credit quality is expected to remain relatively stable in Eggs: Egg prices improved modestly during 2012 averaging $1.23 per dozen in 2012 compared to $1.19 per dozen in Liquid egg prices were up slightly in 2012 compared to prices in 2011, at $0.64 per dozen vs. $0.62, respectively. The industry has continued to generally manage the overall flock size and supplies are generally in line with demand. However, projections for year end 2012 suggest a 1.7% increase in hen numbers year-over-year which is projected to have a modest negative impact on overall egg prices in Continued high feed costs have stressed producer margins but with overall higher 2012 egg prices, most egg producers should be marginally profitable for the year. Overall, with pricing expectations being slightly lower in 2013, and continued high costs of production, tighter margins are expected. While some downgrades are possible in 2013, credit quality is expected to remain relatively stable. Other Timber: Timber and wood products represent 3% of the District loan portfolio. At December 31, 2012, 4.8% of the timber portfolio was adversely classified. The timber and forest products industry has seen limited new loan activity in recent years due to the weak economy and the continued weak housing market. However, housing starts, although well below levels of , are showing improvement which is fostering some guarded optimism in the industry. U.S. housing starts are now projected to be at 800,000+ on a seasonally adjusted basis, well above the low point of 450,000 starts. The continued slow economic growth and high levels of unemployment continue to challenge the industry. Improvement in the housing markets is expected to be gradual over the next 2-3 years with starts projected to increase to 1,000,000 by Minimal improvement in credit quality can be expected until there is a significant housing recovery. We expect limited loan losses due to generally strong (low) and stable loan to appraised value positions for most loan exposures. Additionally, the District s timber exposure is primarily in timber production supported by land rather than timber processing. Ethanol: The District has ethanol exposure of approximately 1% of the District portfolio. At December 31, 2012, 10.8% of the ethanol portfolio was adversely classified. Margin pressure continued as a result of high priced corn, lower than expected motor fuel prices and excess ethanol inventory, resulting in losses for many producers throughout Although ethanol inventories are expected to decline, resulting in improved margins, the timing of the anticipated recovery is uncertain. While District ethanol exposure is relatively small, the impact of ethanol within the District is amplified due to ethanol s use of corn, and its relationship to corn prices. Production capacity in the industry is static, with essentially no new capacity contemplated at this time. The Renewable Fuels Standard (RFS) level for corn based ethanol in calendar year 2012 was 13.2 billion gallons and increased to 13.8 billion gallons in 2013, ultimately reaching 15 billion gallons in While there have been RFS waiver requests from various groups, these requests have not been granted. With continued 15
18 governmental support of the ethanol industry via RFS, ethanol demand is expected to recover to levels whereby producer margins will improve. We expect this portfolio to show a degree of deterioration in early 2013 and stabilize throughout the year. Other: Although not significant from a District-wide perspective, certain Associations have significant concentrations in rice, cotton and sugar beets. Competitive Conditions Competition historically is from small commercial banks, insurance companies, large banks, manufacturers/suppliers and captive finance companies. In general, community banks continue to be very competitive, and insurance companies and regional/national banks are increasingly more competitive particularly on the highest quality larger credits. Associations market shares vary greatly, with Farm Credit dominating the market in certain Association s territories, while in other territories the competition holds significant market share positions. In our traditional markets, affiliated Associations have historically been most competitive in falling interest rate environments because Farm Credit cost of funds declines more rapidly than that of our competitors. In a rising rate environment, our cost of funds tends to increase more quickly than competitors, resulting in significant competitive pressure and narrowing spreads. Many affiliated Associations have increased their spreads to enhance earnings and to reflect increased risk. Most affiliated Associations anticipate spreads will narrow in 2013 from increased competition which could be exacerbated if there was also an increase in interest rates. An increase in interest rates would create a challenging competitive environment in which the affiliated Associations may not be able, or choose not, to maintain current spreads. During 2012, retail credit spreads, measuring the difference between the rate on the retail loan and the marginal cost of debt (MCD) to fund that loan increased. The increase reflects the increased level of conversions throughout 2012 reflecting the affiliated Associations abilities to re-price borrowers loans at lower interest rates and increase spreads. During 2012, approximately $15.4 billion of retail volume converted resulting in a weighted average MCD savings of 120 basis points between AgriBank and the affiliated Associations, and a weighted average retail rate savings of 77 basis points between the affiliated Associations and the customers. The difference between the MCD the affiliated Associations paid AgriBank and the lower retail rate the affiliated Associations received from the customers was 43 basis points, which increased the retail spread at the affiliated Associations while significantly reducing farmer borrowing costs. 16
19 Analysis of Risk Assets Risk assets are comprised of nonaccrual loans, accruing restructured loans and accruing loans 90 days or more past due (risk loans) and other property owned. Comparative information regarding risk assets in the portfolio follows: (in millions) As of December 31, Nonaccrual loans $700.8 $884.9 $959.8 $1,152.8 $829.0 Accruing restructured loans Accruing loans 90 days or more past due Total risk loans , Other property owned Total risk assets $834.7 $1,033.6 $1,083.1 $1,251.0 $907.3 Risk loans as a % of total loans 0.99% 1.33% 1.50% 1.96% 1.53% Delinquencies as a % of total loans 0.65% 0.74% 0.94% 1.39% 0.95% The decrease in risk assets in 2012 was due primarily to decreases in nonaccrual loans related to repayments, net charge-offs and transfers of loans to accrual status partially offset by transfers to nonaccrual status. The decrease in other property owned was primarily due to the sale of a commercial dairy, a large tract of timber and a lumber concentration yard business at one affiliated Association. Nonaccrual loans represented 0.9% of total loans at December 31, At December 31, 2012, 61.2% of nonaccrual loans were current as to principal and interest. Total risk loans as a percentage of total loans remains within acceptable limits. The decrease in risk assets in 2011 from 2010 was due primarily to decreases in nonaccrual loans related to a customer in accrual status purchasing the assets of a large dairy customer whose loans were previously in nonaccrual status. The decrease in total risk assets in 2010 from 2009 was due to the decrease in nonaccrual loans as a few large customers loans transferred to accrual status during the fourth quarter of These customers were in the pork, dairy and ethanol industries. The increase in other property owned was primarily due to one affiliated Association acquiring a large timber operation during The increase in total risk assets in 2009 from 2008 was primarily due to the increase in nonaccrual loans as a number of accrual loans in the dairy, ethanol and pork industries transferred to nonaccrual status. Our accounting policy generally requires loans past due 90 days to be transferred into nonaccrual status. Based on management's analysis, all accruing loans 90 days or more past due were adequately secured and in the process of collection and, as such, were eligible to remain in accruing status. 17
20 The following table sets forth interest income that would have been recognized if nonaccrual and formally restructured loans had been fully performing: (in thousands) For the year ended December 31, 2012 Interest income which would have been recognized under original contract terms $87,870 Less: interest income recognized 36,503 Interest income not recognized $51,367 Cash received on nonaccrual loans is applied to reduce the recorded investment in the loan asset, except in those cases where the collection of the recorded investment is fully expected and the loan has no unrecovered prior charge-offs. Analysis of the Allowance for Loan Losses The allowance for loan losses is an estimate of losses on loans in our portfolio as of the financial statement date. We determine the appropriate level of allowance for loan losses based on the periodic evaluation of factors such as: loan loss history; probability of default; estimated loss severity; portfolio quality; and current economic and environmental conditions. Comparative allowance coverage of various loan categories is presented in the accompanying table: As of December 31, Allowance as a % of: Loans 0.34% 0.44% 0.62% 0.64% 0.37% Nonaccrual loans 37.52% 33.96% 42.34% 33.49% 25.48% Total risk loans 34.29% 32.65% 41.10% 32.30% 23.78% Net charge-offs as a % of average loans 0.09% 0.18% 0.28% 0.25% 0.00% Adverse loans as a % of risk funds* 14.03% 16.89% 24.65% 29.80% 18.00% *Risk funds includes total capital and allowance for loan losses. AgriBank and affiliated Association management teams believe the allowances are adequate in relation to the probable losses in each portfolio as of December 31, The allowance for loan losses totaled $262.9 million at December 31, 2012 a decline from $300.5 million at December 31, The decline in the allowance for loan losses was primarily driven by net charge-offs of $64.7 million partially offset by provision expense of $27.1 million during The provision for credit losses reported in the Combined Statements of Comprehensive Income includes provision expense for unfunded commitments and unfunded letters of credit of $3.0 million and $3.8 million, respectively. The reserves for unfunded commitments and letters of credit are recorded as liabilities on the Combined Statements of Condition. 18
21 A summary of the activity in the allowance for loan losses follows: (in thousands) For the year ended December 31, Balance at beginning of year $300,508 $406,346 $386,002 $211,254 $101,177 Charge-offs: Real estate mortgage (28,538) (30,938) (60,411) (49,388) (5,241) Production and intermediate term (46,079) (33,922) (84,104) (32,001) (7,180) Agribusiness (1,036) (54,701) (27,749) (63,872) (7,206) Rural residential real estate (7,038) (6,044) (8,798) (5,569) (1,611) Other (260) (16,518) (8,858) (4,422) (1,755) Total charge-offs (82,951) (142,123) (189,920) (155,252) (22,993) Recoveries: Real estate mortgage 8,477 6,306 2,991 2, Production and intermediate term 9,141 12,537 9,476 3,538 1,733 Agribusiness 368 3,399 6,753 2,612 2,970 Rural residential real estate Other ,408 Total recoveries 18,216 22,648 20,351 9,626 6,850 Net charge-offs (64,735) (119,475) (169,569) (145,626) (16,143) Provision for loan losses 27,157 13, , , ,220 Balance at end of year $262,930 $300,508 $406,346 $386,002 $211,254 We determine the amount of allowance that is required by analyzing risk loans individually and all other loans by grouping them into loan segments sharing similar risk characteristics. For loans that were not individually evaluated for impairment we use a two-dimensional loan risk rating model that incorporates a 14-point rating scale to identify and track the probability of borrower default and a separate 6-point scale addressing the loss given default. An allowance is recorded for the loan segments evaluated collectively for probable and estimable credit losses as of the financial statement date based on loss probability and loss severity appropriate for its segment. These estimated losses may be adjusted for relevant current environmental factors. These factors may vary by the different segments reflecting the risk characteristics of each segment. As loss probability, loss severity and environmental factors change, earnings are impacted. Risk loans are analyzed individually to establish specific allowances. We record a specific allowance, if appropriate, to reduce the carrying amount of the risk loan to the lower of book value or the net realizable value of collateral. The following table shows the amount of the allowance for loan losses by loan category: (in thousands) As of December 31, Amount % Amount % Amount % Amount % Amount % Real estate mortgage $94, % $107, % $170, % $115, % $72, % Production and intermediate term 91, % 124, % 145, % 131, % 60, % Agribusiness 48, % 47, % 68, % 123, % 66, % Rural residential real estate 11, % 12, % 12, % 8, % 2, % Other 16, % 8, % 8, % 8, % 9, % Total allowance $262, % $300, % $406, % $386, % $211, % 19
22 Frequency Investment Portfolio and Liquidity Liquidity Risk Management The Farm Credit System continues to have reliable access to the debt capital markets to support its mission of providing credit to farmers, ranchers and other eligible borrowers. During 2012, investor demand for Systemwide debt securities remained favorable across all products and maturities within those products. Given the continued low interest rate environment and demand for Systemwide debt securities, we refinanced callable bonds, when advantageous, in order to lower our cost of funds. AgriBank is responsible for meeting the District's funding, liquidity and asset/liability management needs. Access to funding remains the primary source of AgriBank s liquidity. AgriBank also maintains liquidity through the investment portfolio. AgriBank s liquidity policy and FCA regulations require maintaining a minimum of 90 days of liquidity on a continuous basis, assuming no access to the debt capital markets. This days of liquidity measurement refers to the number of days of maturing debt covered by liquid investments. AgriBank currently operates with a liquidity target of at least 125 days. As of December 31, 2012, AgriBank had sufficient liquidity to fund all debt maturing within 139 days. AgriBank also has a liquidity contingency plan that addresses actions AgriBank would consider in the event that there is not ready access to traditional funding sources. These potential actions include borrowing overnight via federal funds, using investment securities as collateral to borrow, using the proceeds from maturing investments and selling liquid investments. The composition of the liquidity investment portfolio is structured to provide at least 15 days of liquidity coverage in a combination of U.S. Treasury securities maturing within three years, debt to be settled and cash held in Federal Reserve Banks. As of December 31, 2012, AgriBank held U.S. Treasury securities with a book value of $3.2 billion. At December 31, 2012, AgriBank held qualifying assets in excess of that required to meet the 15 days of liquidity coverage. The following chart shows AgriBank s daily liquidity position for 2012: Frequency of Days Liquidity < Liquidity Coverage Range 20
23 Information regarding cumulative debt maturities is outlined below: (in millions) Bonds and Notes As of December 31, 2012 Amount Cumulative debt maturing in: 15 days $3, days 5, days 8, days 10,710.0 One year 24,418.7 One to five years 64,540.7 Five to ten years 73,954.7 More than ten years 77,735.9 AgriBank Investment Securities and Federal Funds AgriBank s liquid investment portfolio is comprised of mortgage-backed securities, U.S. Treasury securities, commercial paper, federal funds, asset-backed securities and U.S. Agency securities. The following table provides detail on the composition of the investment portfolio: (in millions) As of December 31, Mortgage-backed securities: Government collateralized mortgage obligations $2,453.0 $2,291.9 $2,071.6 $1,151.0 $111.6 Agency collateralized mortgage obligations 1, , , , ,729.5 Agency pass through Non-agency Total mortgage-backed securities 4, , , , ,121.6 U.S. Treasury securities 3, , , , Commercial paper and other 2, , , , ,994.6 Federal funds Asset-backed securities: Automobile Home equity Equipment Student loans Credit card receivables Total asset-backed securities U.S. Agencies Total $11,731.9 $9,988.5 $10,647.1 $9,575.1 $9,393.1 AgriBank increased its investment portfolio in 2012 in order to maintain its desired level of liquidity coverage as the loan and debt portfolios grew. With the exception of AgriBank s asset-backed and mortgage-backed securities, the majority of investments mature within one year. The expected average life is 1.6 years for asset-backed securities and 2.9 years for mortgage-backed securities at December 31, A floating rate of interest is carried by 23% of asset-backed securities and 81% of mortgage-backed securities. AgriBank has increased its asset-backed securities in the automobile and equipment segments as these segments have been targeted for growth from a strategic perspective. The characteristics of these segments (liquidity, volume, risk, spread, cash flows) complement the existing investment and loan portfolios. Targeting 21
24 these segments has changed the repricing characteristics of the asset-backed securities portfolio mix from predominately floating to predominately fixed rate. The market for investment securities is materially affected by conditions in the global financial markets and general economic conditions that may change suddenly and dramatically. Unfavorable or uncertain economic and market conditions, caused by declines in economic growth, business activity, investor confidence, limitations on the availability or increases in the cost of credit and capital and increases in inflation or interest rates may adversely affect our business and profitability. AgriBank s Asset-Liability Committee (ALCO) and Investment Credit Risk Group oversee the credit risk in their investment portfolio. AgriBank manages investment portfolio credit risk by investing only in securities that are liquid, of high quality and whose risks are well understood. At purchase all securities must meet eligibility requirements related to rating categories assigned by one or more Nationally Recognized Statistical Rating Organizations. These requirements vary by asset class but require either the highest or second highest ratings. Issues in the residential mortgage market and downgrades of certain bond insurance companies over the past four years increased the credit risk in this sector of their investment portfolio. AgriBank continually monitors the credit risk in this portfolio. 22
25 The fair value of investments by type and credit rating were: (in millions) Eligible Ineligible (2) As of December 31, 2012 AAA/Aaa A1/P1/F1 A2/P2/F2 Split Rated (1) AA/Aa A BBB BB B CCC/Caa CC/Ca C and below Total Mortgage-backed securities $ -- $ -- $ -- $3,955.1 $19.1 $28.5 $16.7 $10.4 $24.5 $64.2 $31.7 $23.4 $4,173.6 U.S. Treasury securities , ,190.6 Commercial paper and other -- 1, ,856.6 Federal funds Asset-backed securities U.S. Agencies Total $419.9 $2,268.8 $ -- $8,722.1 $21.3 $30.1 $26.1 $15.6 $40.5 $125.4 $36.8 $25.3 $11,731.9 (1) Investments that received the highest credit rating from at least one rating organization. (2) Investments that received the indicated rating as the highest rating from at least one rating organization. A substantial portion of split-rated securities are due to the 2011 downgrade of the U.S. government and any related U.S. agency or guaranteed securities. AgriBank does not believe these downgrades are reflective of deterioration in credit quality of these investment securities. At December 31, 2012, AgriBank had securities that, because the ratings were downgraded below AAA, were no longer eligible under the FCA regulations. The fair value of all ineligible investments totaled $321.1 million, including $189.1 million on which AgriBank has taken impairment charges. Of the securities ineligible under the FCA regulations, securities totaling $282.7 million have been approved by the FCA to hold beyond six months and are included in AgriBank s net collateral ratio. Securities with a fair value of $38.4 million were submitted to the FCA for approval during February Effective January 1, 2013, securities that become ineligible no longer require formal FCA approval to hold beyond six months and to include in the net collateral ratio, provided certain conditions are met, including the security having been eligible at the time it was purchased. In addition to the ineligible securities discussed above, AgriBank held split-rated non-agency mortgage-backed securities and home equity assetbacked securities with a fair value of $35.8 million that were downgraded below AAA by at least one rating agency. There are no split-rated securities on which AgriBank has taken impairment. AgriBank also held $4.0 million of home equity asset-backed securities on credit watch negative. 23
26 AgriBank continues to closely monitor its home equity asset-backed securities (ABS) and non-agency mortgage-backed securities (MBS), which are detailed in the table below: (in millions) As of December 31, 2012 As of December 31, 2011 As of December 31, 2010 Amortized Unrealized Unrealized Fair Amortized Unrealized Unrealized Fair Amortized Unrealized Unrealized Fair Cost Gains Losses Value Cost Gains Losses Value Cost Gains Losses Value First liens $117.7 $ -- $20.1 $97.6 $163.9 $ -- $51.7 $112.2 $237.9 $ -- $51.1 $186.8 Second liens Wrapped ABS Total home equity asset-backed securities $139.3 $5.1 $23.7 $120.7 $190.4 $3.7 $58.0 $136.1 $271.9 $1.8 $63.7 $210.0 Alt-A non-agency MBS - floating $12.0 $1.1 $1.5 $11.6 $16.9 $0.8 $4.2 $13.5 $22.0 $0.4 $6.6 $15.8 Alt-A non-agency MBS - fixed Alt-A non-agency MBS - ARM Jumbo non-agency MBS - floating Jumbo non-agency MBS - fixed Jumbo non-agency MBS - ARM Total non-agency mortgage-backed securities $244.8 $6.5 $10.8 $240.5 $300.9 $0.8 $47.9 $253.8 $376.9 $0.5 $63.0 $314.4 Total of above segments $384.1 $11.6 $34.5 $361.2 $491.3 $4.5 $105.9 $389.9 $648.8 $2.3 $126.7 $524.4 (in millions) As of December 31, 2009 As of December 31, 2008 Amortized Unrealized Fair Amortized Unrealized Fair Cost Losses Value Cost Losses Value First liens $334.6 $74.4 $260.2 $498.4 $83.4 $415.0 Second liens Wrapped ABS Total home equity asset-backed securities $391.0 $92.6 $298.4 $608.3 $126.9 $481.4 Alt-A non-agency MBS - floating $30.5 $8.9 $21.6 $47.4 $17.4 $30.0 Alt-A non-agency MBS - fixed Alt-A non-agency MBS - ARM Jumbo non-agency MBS - floating Jumbo non-agency MBS - fixed Jumbo non-agency MBS - ARM Total non-agency mortgage-backed securities $511.0 $129.0 $382.0 $763.1 $218.4 $544.6 Total of above segments $902.0 $221.6 $680.4 $1,371.4 $345.8 $1,
27 Beginning in mid-2007, the home equity ABS and non-agency MBS markets experienced reduced liquidity and credit issues. The liquidity in these markets has improved since AgriBank s exposure on these components of the investment portfolio has been reduced primarily by paydowns and maturities and, to a lesser extent, impairment losses. As demonstrated in the housing related asset-backed and mortgage-backed securities sectors, the liquidity of AgriBank s investment portfolio can be greatly influenced by factors such as U.S. and global economic conditions and liquidity. Accordingly, there is no guarantee our investments could be sold easily or at acceptable prices. In addition, because of the inherent uncertainty and judgment involved in estimating the fair value of investments which may not have an active market, the fair value at which we carry our investments may differ significantly from the values that would be realized if we were to sell the securities. AgriBank evaluates all investments in an unrealized loss position for other-than-temporary impairment (OTTI) on a quarterly basis. As a result of our evaluations, AgriBank recognized $25.5 million in impairment losses during 2012 representing $4.8 million on newly impaired securities and $20.7 million additional impairment on previously impaired securities. No other securities were in an other-than-temporary loss position at December 31, AgriBank has not significantly changed its methodology for identifying securities on which AgriBank performs its cash flow analysis nor has AgriBank significantly changed its methodology for determining fair value during AgriBank evaluates its assumptions used in estimating fair value and impairment and adjusts those assumptions as appropriate. The other-than-temporary impairment recorded in 2012 was similar to the amount recorded in In 2012, the impact of changes in assumptions related to reduced servicers principal and interest advances and eroding credit enhancements on selected transactions contributed to the recorded impairment. AgriBank continued to adjust selected assumptions on certain securities where the specific security information appeared inconsistent with the general assumptions used in our modeling. The following quantifies the impairment recorded: (in millions) For the year ended December 31, Impairment on non-agency MBS $11.2 $11.0 $15.8 Impairment on home-equity ABS Total impairment $25.5 $23.3 $16.0 Reflected in non-interest income in 2010 was a $7.6 million gain from the sale of previously impaired securities. AgriBank recorded $16.6 million of impairment expense in prior years on these securities. 25
28 Association Investment Securities The following table provides detail on the investment portfolios held by affiliated Associations: (in thousands) Weighted Amortized Unrealized Unrealized Fair Average As of December 31, 2012 Cost Gains Losses Value Yield Government guaranteed instruments $1,968,661 $21,922 $34,217 $1,956, % Farmer Mac mortgage-backed securities 302,650 5, , % ARC bonds % Venture capital equity investment 3,235 * * * * Total $2,275,266 $27,318 $34,329 $2,265, % Weighted Amortized Unrealized Unrealized Fair Average As of December 31, 2011 Cost Gains Losses Value Yield Government guaranteed instruments $1,915,583 $19,195 $36,578 $1,898, % Farmer Mac mortgage-backed securities 340,181 7, , % Investment notes in a trust of equipment loans 1, , % ARC bonds 3, , % Venture capital equity investment 1,885 * * * * Total $2,262,747 $26,591 $36,773 $2,250, % Weighted Amortized Unrealized Unrealized Fair Average As of December 31, 2010 Cost Gains Losses Value Yield Government guaranteed instruments $1,593,872 $19,721 $32,396 $1,581, % Farmer Mac mortgage-backed securities 386,935 7,136 1, , % Investment notes in a trust of equipment loans 38,238 1, , % ARC bonds 13, , % Venture capital equity investment 1,234 * * * * Total $2,033,809 $28,409 $34,487 $2,026, % Weighted Amortized Unrealized Unrealized Fair Average As of December 31, 2009 Cost Gains Losses Value Yield Government guaranteed instruments $1,359,322 $9,933 $22,146 $1,347, % Farmer Mac mortgage-backed securities 459,431 9,037 7, , % Investment notes in a trust of equipment loans 41, , % ARC bonds 15, , % Venture capital equity investment 503 * * * * Total $1,876,339 $20,003 $29,916 $1,865, % Weighted Amortized Unrealized Unrealized Fair Average As of December 31, 2008 Cost Gains Losses Value Yield Government guaranteed instruments $991,834 $13,067 $16,199 $988, % Farmer Mac mortgage-backed securities 542, , , % Investment notes in a trust of equipment loans 58, ,266 51, % ARC bonds 18,755 1, , % Venture capital equity investment 250 * * * * Total $1,611,350 $14,467 $45,179 $1,580, % * Not applicable due to the nature of the investment. 26
29 The investment portfolios were evaluated for OTTI. As a result of its evaluations, one affiliated Association has recognized $14 thousand and $570 thousand of impairment losses during 2012 and 2011, respectively. No securities were other-than-temporarily impaired in 2010, 2009 or Other Earning Assets Other earning assets are comprised of successor-in-interest contracts from involvement with the federal government s tobacco buy-out program by one Association. The volume was $144.2 million, $210.9 million, $272.0 million, $321.1 million and $353.3 million at December 31, 2012, 2011, 2010, 2009 and 2008, respectively. These amounts include both principal and interest income receivable. This Association has not purchased any contracts since Results of Operations We recorded record earnings of $1.7 billion in The following table illustrates profitability information: (dollars in millions) For the year ended December 31, Net income $1,719.4 $1,539.8 $1,437.1 Return on average assets 1.98% 1.91% 1.91% Return on average members' equity 12.56% 12.47% 12.98% The following table illustrates the changes in significant components of net income: (in millions) Current Year Prior Year Increase Increase (Decrease) in (Decrease) in For the year ended December 31, Net Income Net Income Net interest income $2,311.5 $2,172.3 $2,052.1 $139.2 $120.2 Provision for credit losses (33.9) (23.6) (189.9) (10.3) Non-interest income (114.0) Salaries and employee benefits (537.8) (515.0) (478.8) (22.8) (36.2) Other operating expenses (284.5) (267.2) (242.4) (17.3) (24.8) Farm Credit System insurance expense (32.2) (36.4) (29.4) 4.2 (7.0) Loss on debt extinguishment (0.8) (0.3) (10.6) (0.5) 10.3 Net impairment losses recognized in earnings (25.5) (23.3) (16.0) (2.2) (7.3) Provision for income taxes (39.1) (55.7) (50.9) 16.6 (4.8) Net income $1,719.4 $1,539.8 $1,437.1 $179.6 $
30 Net Interest Income The following table quantifies changes in net interest income: (in millions) For the year ended December 31, 2012 vs vs Increase (decrease) due to: Volume Rate Total Volume Rate Total Interest income: Loans $238.8 $(230.5) $8.3 $229.7 $(182.9) $46.8 Investments 7.0 (11.6) (4.6) 7.3 (16.1) (8.8) Other earning assets (3.5) -- (3.5) (3.0) (0.1) (3.1) Total interest income (242.1) (199.1) 34.9 Interest expense: Systemwide debt securities and other (69.8) (71.3) Net change in net interest income $172.5 $(33.3) $139.2 $162.7 $(42.5) $120.2 Information regarding the average daily balances (ADB), average rates earned and paid and components of net interest income (NII) on our portfolio follows: (in millions) For the year ended December 31, ADB Rate NII ADB Rate NII ADB Rate NII Interest earning assets: Accrual loans $70, % $3,057.1 $64, % $3,045.1 $59, % $3,005.1 Nonaccrual loans % % , % 33.5 Investment securities and federal funds 13, % , % , % Other earning assets % % % 14.1 Total 84, % 3, , % 3, , % 3,208.2 Interest bearing liabilities 71, % , % 1, , % 1,156.1 Interest rate spread $12, % $11, % $10, % Impact of equity financing 0.20% 0.24% 0.26% Net interest margin 2.73% 2.76% 2.79% Net interest income $2,311.5 $2,172.3 $2,052.1 Net interest margin has decreased by three basis points over the same period last year due to a four basis point decline in the impact of equity financing offset by a one basis point increase in interest rate spread. The slight increase in interest rate spread was due to increased association spreads on converted fixed rate loans and the impact of funding actions, primarily the calling of debt. In general, Associations have been able to maintain or widen spreads. The equity financing represents the benefit of non-interest bearing funding, which was lower because of falling interest rates. Provision for Credit Losses The provision for credit losses was $33.9 million, $23.6 million and $189.9 million in 2012, 2011 and 2010, respectively. The amounts reflect the change in the estimated losses in the loan portfolio during the periods. The amount of provision recorded during the last half of 2012 was partially offset by reversals during the first half of the year reflecting strong collateralization of the portfolios and continued improvement in credit quality. The provision expense recorded during the last half of 2012 was primarily due to additional specific reserves on a participated dairy credit, specific reserves related to a horticultural specialties credit and additional reserves for the impact of the drought. In addition, factors driving the increase during the last half of 2012 include high unemployment (impact of non-farm income) and general weakness in the economy. Included in the provision for credit losses was provision expense for unfunded commitments and unfunded letters of credit of $3.0 million and $3.8 million, respectively. The reserves for unfunded commitments and letters of credit are recorded as liabilities on the Combined Statements of Condition. 28
31 Refer to the discussion of the allowance for loan losses in the Analysis of the Allowance for Loan Losses section of this report. Non-interest Income The components of non-interest income are presented in the following chart: (in thousands) For the year ended December 31, Financially related services $151,603 $149,930 $163,856 Allocated insurance reserve accounts distribution 79, ,186 Mineral income 76,701 45,990 47,669 Loan prepayment and fee income 45,782 56,413 57,277 Miscellaneous income and other gains (losses), net: Operating lease income 18,240 20,070 19,889 Loan servicing fee income 11,738 11,297 23,221 Other property owned (losses) income, net (23,974) (6,577) 5,424 Debt and derivative fair value adjustments (12,665) 1,166 (1,656) Other 15,251 10,728 16,171 Total $361,741 $289,017 $403,037 Financially related services primarily consist of multi-peril and other crop insurance income. The decrease from 2010 was due to a decrease in crop insurance fees. The volume of crop insurance coverage has increased throughout the District but, due to changes in the crop insurance program, commission rates have dropped and resulted in lower fee income. We received $79.1 million and $71.2 million in 2012 and 2010 as our share of non-recurring distributions from the AIRAs. There were no distributions in These reserve accounts were established by the Farm Credit System Insurance Corporation when premiums collected increased the level of the insurance fund above the required 2% of insured debt. Mineral income was earned from mineral rights, with lease bonus and royalty income continuing to remain strong, specifically in the Williston Basin in western North Dakota. The increase reflects the continued relatively high level of energy costs resulting in continued demand for exploration rights on these properties. Loan prepayment and fee income primarily represents fee income not subject to deferral. The decline was primarily related to a decline in unused commitment and letter of credit fees. The change in other property owned (losses) income, net in 2012 was primarily due to an $8.5 million writedown on a large timber relationship at one Association. During 2011, the change was due to valuation writedowns, an increase in operating expenses and losses on sales of other property owned compared to the impact of a $9.9 million gain on the sale of ethanol plants during The losses on derivatives are primarily due to losses related to receive-fixed swaps that were de-designated as hedging instruments. This loss was partially offset by an $8.2 million gain recorded on the hedged instrument recorded in net interest income. Refer to Note 18 for further discussion. 29
32 Salaries and Employee Benefits, Other Operating Expenses and Farm Credit System Insurance Expense Various components of non-interest expenses are presented in the following chart: (in thousands) For the year ended December 31, Salaries and employee benefits $537,781 $514,960 $478,829 Other operating expenses: Purchased services 39,043 35,053 33,216 Occupancy and equipment 84,243 82,801 75,943 Examination expense 19,772 18,923 17,300 Other 141, , ,961 Farm Credit System insurance expense 32,220 36,368 29,433 Total $854,467 $818,599 $750,682 Operating rate 1.0% 1.0% 1.0% The increase in 2012 non-interest expenses was primarily due to increases in salaries and employee benefits, driven by the following: An $18.3 million increase in benefits expense driven primarily by i) an increase in the pension expense of $8.6 million reflecting the impact of the decline in the discount rate and the continued amortization of losses on plan assets in 2008, ii) an increase in salary based benefits and taxes of $3.4 million, iii) an increase in the defined contribution plan expense of $3.0 million reflecting the increase in staffing (all new employees are in the defined contribution plan) and iv) an increase in medical insurance expenses of $2.8 million due to the rising cost of medical care. A $4.5 million increase in salary expense due to annual merit increases and incentive payments as well as an increase in head count by 324 full-time equivalents, or 6.1% from December 31, The change in Farm Credit System Insurance Corporation expense was due primarily to changes in the premium rates. The rates were five basis points, six basis points and five basis points in 2012, 2011 and 2010, respectively. The operating rate is total operating expenses divided by average earning assets. The operating rate has remained relatively stable with operating expenses increasing at approximately the same rate as loan volume growth. Loss on Debt Extinguishment During 2012, 2011 and 2010, AgriBank transferred $10.0 million, $15.0 million and $165.0 million, respectively, of debt to other Farm Credit System banks to restructure liabilities. These transfers resulted in $0.8 million, $0.3 million and $10.6 million, respectively, of losses on debt extinguishment. These transactions are for asset/liability rebalancing purposes with the volume of all debt transfers occurring at fair value. These losses were more than offset by the prepayment and conversion fees collected in the years of the transfers. Net Impairment Losses Recognized in Earnings AgriBank evaluates all investments in an unrealized loss position quarterly and determined that certain securities were in other-than-temporary loss positions at December 31, AgriBank determined underlying credit issues in housing-related mortgages that support these securities may result in not collecting all principal and interest contractually due. As a result of its evaluations, AgriBank recognized $
33 million in impairment losses during 2012 compared to $23.3 million and $16.0 million in 2011 and 2010, respectively. The total of losses recognized through earnings life to date on impaired securities was $129.2 million. AgriBank estimates that the future expected principal and interest shortfall on our impaired securities will be significantly less than the likely impairment required to be recorded under GAAP. Since January 1, 2007, we have incurred actual principal cash shortfalls of $13.6 million on impaired securities. However, many of our investments were structured so that realized losses are recognized when the investment matures. AgriBank has an additional $20.2 million of losses where projected cash flows within the transaction structure indicate AgriBank will not recover the amortized cost basis of these securities. Affiliated Associations also evaluate all investments in an unrealized loss position quarterly and determined that certain securities were in other-than-temporary loss positions at December 31, As a result of its evaluations, one Association recognized $14 thousand and $570 thousand in impairment losses during 2012 and 2011, respectively. No securities were other-than-temporarily impaired in Refer to Note 4 for further discussion on investment impairment. Provision for Income Taxes The decrease in tax provision from the prior year was primarily related to decreased income in taxable entities including the impact of increased patronage deductions. Refer to Note 11 for further discussion. Interest Rate Risk Management Interest rate risk is the risk that changes in interest rates may adversely affect operating results and financial condition. Interest rate risk arises primarily from financing fixed rate loans that can be prepaid, adjustable rate loans with interest rate caps, and from decisions related to the investment of our equity. While AgriBank manages substantially all of the District s interest rate risk, the Associations manage retail spread compression risk. Spread compression is the risk that changes in the cost of funds cannot be offset by similar changes in the retail rates charged to customers. AgriBank s primary method of managing interest rate risk is to issue debt with similar terms as the assets originated by the Associations. Because a substantial portion of those assets are prepayable, AgriBank issues a significant amount of callable debt. AgriBank s ability to effectively manage interest rate risk relies on its ability to issue debt with terms and structures that match the asset terms and structures. AgriBank also utilizes derivatives to manage interest rate risk and reduce funding costs. AgriBank manages exposure to changes in interest rates under policies established by its Board of Directors and guidelines established by its ALCO. Policies and guidelines limit maximum exposure to net interest income and market value of equity changes for specified changes in market interest rates. A full analysis of interest rate risk is completed monthly. Through these analyses, appropriate funding strategies are developed to manage the sensitivity of net interest income and market value of equity to changes in interest rates. AgriBank s primary analytical techniques used to analyze interest rate risk are outlined below: Interest rate gap analysis, which compares the amount of interest sensitive assets to interest sensitive liabilities repricing in selected time periods under various interest rate and prepayment assumptions. Net interest income sensitivity analysis, which projects net interest income in each of the next two years given various rate scenarios. 31
34 Market value of equity sensitivity analysis, which estimates the market value of assets, liabilities and equity given various rate scenarios. The assumptions used in AgriBank s analyses are monitored routinely and adjusted as necessary. Assumptions about loan prepayment behavior are the most significant to the results. Prepayment speeds are estimated as a function of rate levels, age and seasoning. AgriBank monitors and tracks actual prepayment history and considers adjustments to the assumed prepayment speeds based on the historical observed experience. AgriBank uses third party data for prepayment assumptions on asset-backed and mortgagebacked securities. Policy limits related to interest rate sensitivity assume interest rates for all maturities change immediately in the same direction and amount (a parallel shock). AgriBank also routinely reviews the impact of a gradual change over one year in interest rates in the same direction and same amount (a parallel ramp). Periodically, AgriBank reviews forward market value risk profiles, multi-year net interest income projections and the impact of varying the amount of change in rates at different maturities (a twist, flattening or steepening of the yield curve). AgriBank s policies establish a maximum variance from our base case in a plus or minus 200 basis point change in rates, except when the U.S. Treasury three-month rate is below 4%, when the minus scenario is limited to one-half of the U.S. Treasury three-month rate. Interest rate gap analysis compares interest sensitive assets and liabilities in defined time segments. The following table presents the AgriBank interest rate gap analysis as of December 31, The repricing characteristics of wholesale loans are modeled to reflect the characteristics of the underlying retail loans at the Associations. The table is based on the known repricing dates of certain assets and liabilities and the assumed or estimated repricing dates of others under an implied forward rate scenario. Prepayment estimates for loans are assumed consistent with AgriBank s standard prepayment assumptions. Callable debt is reflected at the first call date it is expected to be exercised given implied forward rates. Various assets and liabilities may not reprice according to the assumptions and estimates used. The analysis provides a static view of AgriBank s interest rate sensitivity position and does not capture the dynamics of balance sheet, interest rate and spread changes in different interest rate environments including the active role of management of assets and liabilities. 32
35 (in millions) AgriBank, FCB (Bank Only) Repricing Intervals As of December 31, 2012 Year 1 Year 2 Year 3 Year 4 Year 5 Over 5 Years Total Earning assets: Prepayable loans $39,775 $6,903 $4,548 $3,168 $3,511 $8,781 $66,686 Other loans ,060 3,013 Investments and federal funds 9,241 1, ,732 Total earning assets 49,582 8,706 5,660 3,608 3,925 9,950 81,431 Callable debt 10, ,245 2,060 2,291 8,153 25,739 Other debt 40,337 6,575 2, ,666 51,897 Effect of interest rate swaps and other derivatives 1,061 (1,248) (343) (54) (142) Total rate-sensitive liabilities 51,508 6,207 4,030 2,613 2,733 10,545 77,636 Interest rate sensitivity gap $(1,926) $2,499 $1,630 $995 $1,192 $(595) $3,795 Cumulative gap $(1,926) $573 $2,203 $3,198 $4,390 $3,795 Cumulative gap as a % of earning assets -3.9% 1.0% 3.4% 4.7% 6.1% 4.7% Net interest income (NII) sensitivity analysis is used to measure the sensitivity of net interest income to immediate changes in interest rates and to gradual changes in interest rates occurring over one year. AgriBank Board policies establish limits for a plus or minus 200 basis point change in rates, except when the U.S. Treasury three-month rate is below 4%, when the minus scenario is limited to one-half of the U.S. Treasury three-month rate. Because of the low interest rates at December 31, 2012, the down 200 scenario is limited to a down 3 basis point change. The following table summarizes the net interest income sensitivity analysis results: As of December 31, 2012 Basis Point Interest Rate Change Down 3 Up 100 Up 200 Immediate Change (Shock): District NII sensitivity 0.0% 1.8% 2.7% AgriBank NII sensitivity 0.1% 2.2% 1.5% AgriBank and District thresholds -15.0% -15.0% Gradual Change (Ramp): AgriBank net interest income sensitivity 0.8% 1.4% Market value of equity (MVE) sensitivity analysis is used to measure the effect of changes in interest rates on the estimated value of equity. The MVE measures the degree to which the market value of our assets and liabilities change given a change in interest rates. AgriBank also monitors the ratio of market value of equity to book value of equity across interest rate scenarios. 33
36 The following table summarizes the MVE sensitivity analysis results: Basis Point Interest Rate Change As of December 31, 2012 Down 3 Base Up 100 Up 200 Immediate Change (Shock): AgriBank MVE sensitivity 0.0% -0.9% -3.8% AgriBank policy constraints -12.0% -12.0% District MVE sensitivity 0.0% -2.2% -5.1% District thresholds -15.0% -15.0% AgriBank market value / book value 103.6% 103.6% 102.6% 99.6% AgriBank operates in a relatively conservative position with regard to its board policy constraints for both MVE and NII. Particularly with MVE risk AgriBank has established an ALCO operating guideline of -11% change in the shock up 200 basis points scenarios (tighter than the board policy limit) in this time of historically low rates. The measured risk at December 31, 2012 was -3.8% for a +200 basis points shock. AgriBank expects this risk measure to increase somewhat in AgriBank monitors, reports and controls interest rate risk associated with long-term fixed rate lending. Approximately 22% of our loan portfolio has contractual maturities greater than 10 years and is freely prepayable; another 3% of loans have contractual maturities greater than 10 years and carry fees for prepayments. Prepayment fees assessed by AgriBank are structured to not penalize the borrower when prepayments would be beneficial to AgriBank (generally, when interest rates have risen). Almost all of these loans are structured with amortizing principal payments. AgriBank s historical experience indicates minimum prepayment speeds of 6 to 7% have occurred in our freely prepayable loan portfolio. AgriBank s current loan pricing and risk measurement uses a 5% minimum prepayment speed. Amortization and minimum prepayments result in at least 50% of the principal being paid off within 10 years. AgriBank routinely monitors the risk exposure on our long-term fixed rate lending, including gap analysis of an up 1000 bps shock, which would drive prepayments to a minimum level. In addition, AgriBank regularly runs stress test scenarios with minimum prepayment speeds of 3% and 4% to measure the impact of unexpected lengthening of the cash flows and duration of long term fixed rate loans. Derivative Financial Instruments AgriBank uses derivative financial instruments to reduce funding costs, improve liquidity and manage interest rate sensitivity. AgriBank does not hold or issue derivatives for trading purposes. The types and uses of derivatives used by AgriBank are outlined below: Receive fixed swaps are used by AgriBank to convert interest payments on fixed rate bonds into floating rates. These transactions enable us to improve liquidity, obtain lower funding cost or to hedge basis risk; Pay fixed swaps including forward starting swaps, are used by AgriBank primarily to create lower cost synthetic fixed rate funding or to hedge future debt issuance costs; Swaps with floors are used by AgriBank to hedge cash flow exposure to falling rates on floating rate assets. Caps and swaps with caps are used by AgriBank to hedge cash flow risk in caps sold with retail loans or embedded in investments, or to cap interest rates on floating rate debt; Pay fixed swaptions (option to enter into a pay fixed swap) are used by AgriBank to hedge future debt issuance costs; 34
37 Corridors are used by AgriBank to limit net interest costs on floating rate or rolling short term debt in rising rate scenarios by using a purchased cap and a sold cap with a higher strike rate; and Swap with Customer was in support of one Association s securitization of term loans in its portfolio. This swap converted the debt relating to these term loans to a variable rate allowing AgriBank to use this debt as replacement of maturing variable debt. This swap was terminated in Derivative activities are guided by AgriBank s Board policy and monitored by AgriBank s ALCO. The Committee is responsible for approving strategies that are developed through analysis of data derived from financial simulation models and other internal and industry sources. The resulting strategies are incorporated into AgriBank s overall interest rate risk management strategies. By using derivative instruments, AgriBank is subject to credit and market risk. If a counterparty is unable to perform under a derivative contract, AgriBank s credit risk equals the net amount due to AgriBank. Generally, when the fair value of a derivative contract is positive, AgriBank has credit exposure to the counterparty, creating credit risk for AgriBank. When the fair value of the derivative contract is negative, AgriBank does not have credit exposure, however, there is a risk of nonperformance under the terms of the derivative transaction. The fair value of derivatives includes credit valuation adjustments (CVA) which resulted in an increase in the fair value of derivative assets of $0.6 million at December 31, 2012 and decreases in the fair value of derivative assets of $0.3 million and $1.4 million at December 31, 2011 and 2010, respectively. The CVA reflects credit risk of each derivative counterparty to which AgriBank has exposure, net of any collateral posted by the counterparty and an adjustment for AgriBank s credit worthiness where the counterparty has exposure to AgriBank. The change in the CVA for the year is included in Miscellaneous income and other gains (losses), net on the Combined Statements of Comprehensive Income. AgriBank manages credit risk by entering into transactions with high-quality investment grade counterparties, monitoring the credit standing and managing levels of exposure to individual counterparties. AgriBank anticipates performance by all of its counterparties. AgriBank enters into master agreements that contain netting provisions which allow AgriBank to offset amounts AgriBank owes the counterparty on one derivative contract to amounts owed to AgriBank by the same counterparty on another derivative contract. These provisions allow AgriBank to require the net settlement of covered contracts with the same counterparty in the event of default by the counterparty on one or more contracts. All of our derivative transactions are supported by collateral arrangements with counterparties. AgriBank had cash collateral pledged by its derivative counterparties of $22.3 million, $103.1 million and $188.8 million at December 31, 2012, 2011 and 2010, respectively. At December 31, 2012, AgriBank also had $19.1 million of investment securities pledged in its name as collateral from counterparties. AgriBank did not have pledged securities as collateral in 2011 or As counterparty credit ratings are downgraded, AgriBank lowers the level at which collateral must be pledged, therefore reducing AgriBank s exposure to counterparty risk. 35
38 The following table provides a summary of credit ratings for the counterparties on which AgriBank has credit exposure on derivatives at December 31, Derivative credit loss exposure represents the exposure to credit loss on derivative instruments, which is estimated by calculating the cost, on a present value basis, to replace all outstanding derivative contracts in a gain position. Within each maturity category, contracts in a loss position are netted against contracts in a gain position with the same counterparty. If the net position within a maturity category with a particular counterparty is a loss, no amount is reported. Maturity distribution netting represents the impact of netting of derivatives in a gain position and derivatives in a loss position for the same counterparty across different maturity categories. (in millions) Years to maturity Maturity Exposure As of December 31, 2012 Less than One to Over Distribution Collateral Net of Derivative Credit Loss Exposure one year five years five years Netting Exposure Pledged Collateral Moody's Credit Rating Aa3 $18.5 $24.3 $ -- $(35.7) $7.1 $ -- $7.1 A (26.2) A (5.2) A (2.2) Baa Total $35.7 $118.6 $ -- $(69.3) $85.0 $41.4 $43.6 Derivative instruments are discussed further in Notes 2, 17 and
39 The following table provides information concerning derivative products and other financial instruments that are used to manage interest rate risk. The table summarizes the expected maturities and weighted-average interest rates to be paid, and in the case of derivatives, interest rates to be received used in our interest rate risk management activities at December 31, The table was prepared based on implied forward variable interest rates as of December 31, 2012 and, accordingly, the actual interest rates to be received or paid will be different to the extent that the variable rates fluctuate from December 31, 2012 implied forward rates. (in millions) Maturities of Derivative Products and Other Financial Instruments 2018 and Fair As of December 31, thereafter Total Value Bonds and Notes: Fixed rate $13,784 $8,897 $6,171 $4,465 $4,660 $12,566 $50,543 $50,874 Average interest rate 1.5% 0.8% 1.0% 1.2% 1.4% 2.5% 1.5% Variable rate 10,636 9,780 4, ,593 26,761 Average interest rate 0.3% 0.2% 0.2% 0.4% 0.3% 0.3% 0.3% Subordinated notes Average interest rate % 9.1% Total bonds and notes $24,420 $18,677 $11,069 $5,315 $5,060 $13,195 $77,736 $78,406 Derivative Instruments: Receive fixed swaps Notional value $1,350 $1,150 $700 $200 $100 $ -- $3,500 $149 Weighted average receive rate 3.1% 2.4% 2.0% 5.2% 5.0% % Weighted average pay rate 0.4% 0.7% 1.0% 1.4% 1.8% % Pay fixed swaps Notional value ,039 (79) Weighted average receive rate 0.4% 0.5% 1.0% % 2.0% Weighted average pay rate 3.5% 4.4% 4.4% % 3.2% Amortizing pay fixed swaps Notional value (1) Weighted average receive rate % % Weighted average pay rate % % Floating for floating swaps Notional value ,750 (11) Weighted average receive rate 0.4% 0.5% 1.0% 1.5% 2.0% 2.7% 1.3% Weighted average pay rate 0.6% 0.9% 1.1% 2.0% 2.1% 3.0% 1.5% Forward starting swaps Notional value (7) Weighted average receive rate % % Weighted average pay rate % % Credit valuation adjustment Total derivative instruments $1,914 $1,412 $1,250 $400 $500 $950 $6,426 $52 Total weighted average rates on swaps: Receive rate 2.3% 2.1% 1.6% 3.4% 2.6% 2.6% 2.2% Pay rate 0.7% 0.9% 1.6% 1.7% 2.0% 2.9% 1.4% 37
40 Other Risks Operational Risk Operational risk represents the risk of loss resulting from our operations. Operational risk includes risks related to such things as fraud, processing errors, breaches of internal controls and natural disasters. Operational risk is inherent in all business activities, and the management of this risk is important to the achievement of our objectives. We manage operational risk through established internal control processes and disaster recovery plans. We maintain systems of controls with the objectives of providing proper transaction authorization and execution, proper system operations, safeguarding of assets and reliability of financial and other data. We maintain a strong control environment including independent audit committees, codes of ethics for senior officers and key financial personnel and an anonymous whistleblower program. We maintain and routinely test disaster recovery plans with the goal of ensuring on-going operations after a disaster. All District entities document, test and evaluate controls supporting financial reporting consistent with that required by Sarbanes-Oxley Section 404. All significant processes supporting the internal controls over financial reporting are covered by this effort. This effort supports strong control environments through increased awareness, documentation and testing of controls. Individual District entities with assets greater than $1.0 billion at the preceding calendar year end also include a report of management s assessment of internal controls over financial reporting for the current year. Each of these management reports expressed that internal controls over financial reporting were effective and there were no material weaknesses at December 31, AgriBank also receives Statement on Standards for Attestation Engagements No. 16, Reporting on Controls at a Service Organization reports covering the internal controls for various information technology systems. Reputation Risk Reputation risk is defined as the negative impact resulting from events, real or perceived, that shape the image of the Farm Credit System or any of its entities. Such risks include impacts related to investors perceptions about agriculture, the reliability of the Farm Credit System financial information or overt actions by any Farm Credit System institution. The Farm Credit System addressed its current position by engaging an independent firm to develop criteria to measure the current status, including an assessment of the current reputation with its stakeholders, and to identify specific reputation risks and opportunities. A Farm Credit System Reputation Committee develops risk mitigation strategies, and actively monitors and manages this risk with all Farm Credit System entities. Joint and Several Liability We have credit risk because AgriBank is jointly and severally liable for all Systemwide debt issued. Under joint and several liability, if another Farm Credit System Bank is unable to pay its obligations as they come due, the other Banks in the Farm Credit System would ultimately be called upon to fulfill those obligations. Total Systemwide debt at December 31, 2012 was $198.0 billion. The existence of the Farm Credit Insurance Fund (Insurance Fund), the Market Access Agreement (MAA) and the Contractual Interbank Performance Agreement (CIPA) help to mitigate this risk. 38
41 The Farm Credit Act established the Farm Credit System Insurance Corporation (Insurance Corporation) to administer the Insurance Fund. The Insurance Fund is used: to insure the timely payment of principal and interest on Farm Credit Systemwide debt obligations; to insure the retirement of protected borrower capital at par or stated value; and for other specified purposes. At the discretion of the Insurance Corporation, the Insurance Fund is also available to provide assistance to certain troubled Farm Credit System institutions and for the operating expenses of the Insurance Corporation. Each Farm Credit System Bank has been required to pay premiums into the Insurance Fund until the assets in the Insurance Fund equal 2% of the aggregated insured obligations adjusted to reflect the reduced risk on loans or investments guaranteed by federal or state governments. The percentage of aggregate obligations can be changed by the Insurance Corporation, at its sole discretion, to a percentage it determines to be actuarially sound. During 2012 and 2010, we received $79.1 million and $71.2 million, respectively as our share of distributions from the AIRAs. These reserve accounts were established by the Farm Credit System Insurance Corporation when premiums collected increased the level of the insurance fund above the required 2% of insured debt. There were no distributions in The basis for assessing premiums is insured debt outstanding. Nonaccrual loans and impaired investments are assessed a surcharge while guaranteed loans and investments are deductions from the premium base. AgriBank, in turn, assesses the Associations premiums each year based on similar factors. The Insurance Corporation does not insure any payments on AgriBank s or its affiliated Association s subordinated notes, preferred stock, at-risk common stock or at-risk participation certificates. To the extent AgriBank must fund its allocated portion of another Farm Credit System Bank s portion of the Systemwide debt securities due to default, AgriBank s earnings and total shareholders equity would be negatively impacted. AgriBank, together with all Farm Credit System Banks and the Federal Farm Credit Banks Funding Corporation, have entered into the CIPA. This agreement establishes agreed-upon standards of District financial condition and performance to achieve and maintain. AgriBank, and each of the other Farm Credit System Banks, exceeded the minimum performance measures at December 31, AgriBank, together with all Farm Credit System Banks and the Federal Farm Credit Banks Funding Corporation, have entered into the MAA. This agreement establishes criteria and procedures for the Banks to provide information and, under specific circumstances, restricting or prohibiting participation in issuances of Systemwide debt securities. The agreement is intended to identify and resolve individual Bank financial problems in a timely manner. AgriBank, and each of the other Farm Credit System Banks, are in compliance with all aspects of the agreement at December 31, If a Farm Credit System Bank fails to meet the MAA performance criteria, it will be placed into one of three categories. Each category gives the other Farm Credit System Banks progressively more control over debt issuances at a Farm Credit System Bank that has declining financial performance under the MAA performance criteria. A Category I Bank is subject to additional monitoring and reporting requirements; a Category II Bank s ability to participate in issuances of Systemwide debt securities may be limited to refinancing maturing debt obligations; and a Category III Bank may not be permitted to participate in issuances of Systemwide debt securities. 39
42 Members Equity We believe a sound capital position, with its foundation in surplus, is critical to long-term financial stability. We maintain adequate capital to protect against unanticipated losses as well as to meet our growth needs. Total members equity at December 31, 2012 was $14.3 billion, compared to $12.8 billion and $11.7 billion at December 31, 2011 and 2010, respectively. The $1.5 billion increase in members equity during 2012 primarily reflects net income which was partially offset by increased patronage distributions. Selected capital ratios are presented in the accompanying chart: Regulatory As of December 31, minimums Members' equity to assets 15.3% 15.4% 14.6% 14.0% 13.2% Surplus and allowance to risk loans (:1) Surplus to total members' equity 102.1% 102.6% 101.6% 102.3% 105.1% Permanent capital ratio (AgriBank only) 7.0% 21.1% 20.9% 20.6% 18.4% 15.4% Total surplus ratio (AgriBank only) 7.0% 17.4% 17.3% 16.7% 14.3% 11.5% Core surplus ratio (AgriBank only) 3.5% 10.4% 10.1% 10.0% 8.2% 7.6% Net collateral ratio * 104.0% 106.0% 106.2% 105.8% 105.6% 104.6% * Farm Credit Administration regulations require AgriBank to maintain a net collateral ratio of at least 103.0%. However, AgriBank is required by the FCA to maintain a higher minimum of 104.0% during the period in which AgriBank has subordinated notes outstanding. At December 31, 2012, AgriBank and each affiliated Association exceeded regulatory minimum capital ratios, which are further discussed in Note 10. Capital Plan and Regulatory Requirements Each institution s Board of Directors establishes a formal capital plan that addresses its capital targets in relation to its risk. The capital plans assess the capital level and composition necessary to assure financial viability and to provide for growth. These plans are updated at least annually and are approved by the institutions Board of Directors. At a minimum, the plans consider the following factors in determining optimal capital levels: asset quality and the adequacy of the allowance for losses to absorb potential losses within the loan and lease portfolios; quality and quantity of earnings; sufficiency of liquid funds; capability of management and the quality of operating policies, procedures and internal controls; needs of an institution's customer base; and other risk-oriented activities, such as funding and interest rate risks, potential obligations under joint and several liability, contingent and off-balance-sheet liabilities and other conditions warranting additional capital. We model economic capital requirements which measure total enterprise risk looking at credit, interest rate and operational risk. 40
43 Patronage Distributions and Dividends Payment of patronage and/or dividends is generally allowed under Association bylaws if the distribution is in accordance with applicable laws and regulations, including the FCA capital adequacy regulations. Affiliated Associations designated $208.6 million, $199.1 million and $174.8 million of earnings for patronage during 2012, 2011 and 2010, respectively. In response to adverse weather conditions and the impact on Wisconsin farm families, a special, one-time patronage distribution of $5.2 million was paid in cash in October 2012 by one affiliated Association. Additionally, one affiliated Association has a nonqualified patronage program that allocated surplus of $55.0 million, $40.0 million and $36.4 million in 2012, 2011 and 2010, respectively. Nonqualified patronage of $42.7 million, $14.5 million and $1.3 million was redeemed during 2012, 2011 and 2010, respectively. Certain affiliated Associations attribute to shareholders all income in excess of the qualified patronage program. It is communicated to shareholders that this amount will not be redeemed and as such, is not considered allocated surplus. AgriBank also pays patronage, substantially all of which was eliminated in combination except $1.6 million at December 31, 2012 and $1.4 million at December 31, 2011 and 2010, respectively, to OFIs. Accumulated Other Comprehensive Loss AgriBank s investment portfolio is held primarily for liquidity purposes; accordingly, it is considered availablefor-sale and is carried at fair value. Unrealized gains and losses on investment securities that are not otherthan-temporarily impaired are reported as a separate component of members equity. Unrealized gains and losses related to the non-credit component of other-than-temporarily impaired investment securities are recognized in accumulated other comprehensive income or loss. For the year ended December 31, 2012, the change in net unrealized losses on investment securities totaled $77.3 million of other comprehensive income, reflecting OTTI recognized, continued pay downs and declines in interest rates. AgriBank s derivative portfolio includes certain derivatives designated as cash flow hedges. Unrealized gains and losses on the effective portion of cash flow hedges are reported as a separate component of members equity. For the year ended December 31, 2012, the change in net unrealized losses on cash flow derivatives totaled $6.4 million of other comprehensive income. Most of the cash flow derivatives are hedging rising longterm interest rates, so as rates declined from the time the derivatives were initiated, the value of AgriBank s cash flow swaps decreased creating the accumulated other comprehensive loss. During 2012, AgriBank has seen a slight increase in interest rates reducing this accumulated other comprehensive loss. The unfunded status of our pension and post-employment benefit plans is recognized as a liability on our Combined Statements of Condition. To record the unfunded liability, we adjust any prepaid assets or accrued liabilities that were recorded at the individual District entity level and recognize the offset as a separate component of members equity. For the year ended December 31, 2012, the change in net unrealized losses recognized in other comprehensive losses for pension and post-employment liabilities totaled $72.9 million. The increase in accumulated other comprehensive loss was primarily related to the decline in the discount rate used to value the liability. Refer to Notes 2 and 12 for further discussion. 41
44 Report of Management AgriBank, FCB and Affiliated Associations The accompanying combined financial statements of AgriBank, FCB and affiliated Associations are prepared by management, which is responsible for their integrity and objectivity, including amounts that must necessarily be based on judgments and estimates. The combined financial statements have been prepared in conformity with accounting principles generally accepted in the United States of America. The combined financial statements, in the opinion of management, present fairly the financial condition of AgriBank, FCB and affiliated Associations. Other financial information included in the Annual Report is consistent with that in the combined financial statements. To meet its responsibility for reliable financial information, management depends on the accounting and internal control systems which have been designed to provide reasonable, but not absolute, assurance that assets are safeguarded and transactions are properly authorized and recorded. The systems have been designed to recognize that the cost must be reasonable in relation to the benefits derived. To monitor compliance, financial operations audits are performed. The combined financial statements are audited by PricewaterhouseCoopers LLP, our independent auditors, who also conduct a review of internal controls to the extent necessary to comply with auditing standards generally accepted in the United States of America. The Farm Credit Administration also performs examinations for safety and soundness as well as compliance with applicable laws and regulations. AgriBank s Board of Directors has overall responsibility for AgriBank s system of internal controls and financial reporting. The Board of Directors consults regularly with management and through its Audit Committee meets periodically with the independent auditors and other auditors to review the scope and results of their work. The independent auditors have direct access to the Board of Directors, which is composed solely of directors who are not officers or employees of AgriBank or the Associations. The undersigned certify that the combined AgriBank, FCB and affiliated Associations' December 31, 2012 Annual Report has been prepared under the oversight of the Audit Committee of AgriBank, FCB, and in accordance with applicable statutory and regulatory requirements and the information contained herein is true, accurate and complete to the best of our knowledge and belief. Richard Davidson Chairman of the Board of Directors AgriBank, FCB L. William York Chief Executive Officer AgriBank, FCB Brian J. O Keane Executive Vice President, Banking and Finance and Chief Financial Officer AgriBank, FCB March 15,
45 Independent Auditor's Report To the Boards of Directors and Members of AgriBank, FCB and Affiliated Associations: We have audited the accompanying combined financial statements of AgriBank, FCB and affiliated Associations (the District), which comprise the combined statements of condition as of December 31, 2012, 2011 and 2010, and the related combined statements of comprehensive income, of changes in members equity and of cash flows for the years then ended. Management's Responsibility for the Combined Financial Statements Management is responsible for the preparation and fair presentation of the combined financial statements in accordance with accounting principles generally accepted in the United States of America; this includes the design, implementation, and maintenance of internal control relevant to the preparation and fair presentation of financial statements that are free from material misstatement, whether due to fraud or error. Auditor's Responsibility Our responsibility is to express an opinion on the combined financial statements based on our audits. We conducted our audits in accordance with auditing standards generally accepted in the United States of America. Those standards require that we plan and perform the audit to obtain reasonable assurance about whether the financial statements are free from material misstatement. An audit involves performing procedures to obtain audit evidence about the amounts and disclosures in the combined financial statements. The procedures selected depend on our judgment, including the assessment of the risks of material misstatement of the combined financial statements, whether due to fraud or error. In making those risk assessments, we consider internal control relevant to the District's preparation and fair presentation of the combined financial statements in order to design audit procedures that are appropriate in the circumstances, but not for the purpose of expressing an opinion on the effectiveness of the District s internal control. Accordingly, we express no such opinion. An audit also includes evaluating the appropriateness of accounting policies used and the reasonableness of significant accounting estimates made by management, as well as evaluating the overall presentation of the combined financial statements. We believe that the audit evidence we have obtained is sufficient and appropriate to provide a basis for our audit opinion. Opinion In our opinion, the combined financial statements referred to above present fairly, in all material respects, the combined financial position of AgriBank, FCB and the affiliated Associations at December 31, 2012, 2011 and 2010, and the results of its operations and its cash flows for the years then ended in accordance with accounting principles generally accepted in the United States of America. March 15, 2013 PricewaterhouseCoopers LLP, 225 South Sixth Street, Suite 1400, Minneapolis, MN T: (612) , 43
46 Combined Statements of Condition AgriBank, FCB and Affiliated Associations (Dollars in thousands) As of December 31, Assets Loans $77,089,134 $68,349,565 $65,035,081 Allowance for loan losses 262, , ,346 Net loans 76,826,204 68,049,057 64,628,735 Investment securities - AgriBank, FCB 10,987,313 9,688,571 9,997,892 Investment securities - Affiliated Associations 2,275,266 2,262,747 2,033,809 Other earning assets 144, , ,957 Cash 560, , ,492 Federal funds 744, , ,216 Accrued interest receivable 793, , ,104 Premises and equipment, net 360, , ,286 Deferred tax assets, net 10,919 7,806 1,804 Assets held for lease, net 505, , ,497 Derivative assets 70, , ,213 Other property owned 67, ,260 94,491 Debt issuance costs 53,769 53,700 54,356 Other assets 108, , ,575 Total assets $93,508,679 $83,136,675 $79,772,427 Liabilities Bonds and notes $77,135,855 $68,262,968 $66,179,450 Subordinated notes 600, , ,000 Accrued interest payable 195, , ,360 Derivative liabilities 18,345 17,466 8,718 Deferred tax liabilities, net 145, ,798 99,176 Accounts payable 124, , ,423 Patronage payable 209, , ,957 Postretirement liability 499, , ,185 Cash collateral pledged by counterparties 22, , ,840 Other liabilities 229, , ,374 Total liabilities 79,180,216 70,302,775 68,114,483 Commitments and contingencies Members' equity Protected borrower equities 305 2,056 2,716 Capital stock and participation certificates 261, , ,194 Allocated surplus 302, , ,010 Unallocated surplus 14,324,793 12,875,783 11,576,553 Accumulated other comprehensive loss (583,324) (594,096) (433,529) Noncontrolling interest 22,082 6, Total members' equity 14,328,463 12,833,900 11,657,944 Total liabilities and members' equity $93,508,679 $83,136,675 $79,772,427 The accompanying notes are an integral part of these combined financial statements. 44
47 Combined Statements of Comprehensive Income AgriBank, FCB and Affiliated Associations (Dollars in thousands) For the year ended December 31, Interest income Loans $3,093,608 $3,085,483 $3,038,680 Investment securities and other earning assets 149, , ,563 Total interest income 3,243,278 3,243,147 3,208,243 Interest expense 931,824 1,070,810 1,156,108 Net interest income 2,311,454 2,172,337 2,052,135 Provision for credit losses 33,907 23, ,913 Net interest income after provision for credit losses 2,277,547 2,148,700 1,862,222 Non-interest income Financially related services 151, , ,856 Allocated insurance reserve accounts distribution 79, ,186 Mineral income 76,701 45,990 47,669 Loan prepayment and fee income 45,782 56,413 57,277 Miscellaneous income and other gains (losses), net 8,590 36,684 63,049 Total non-interest income 361, , ,037 Non-interest expense Salaries and employee benefits 537, , ,829 Other operating expenses 284, , ,420 Farm Credit insurance expense 32,220 36,368 29,433 Loss on debt extinguishment ,619 Impairment losses recognized in earnings: Total other-than-temporary impairment losses 38,271 31,423 28,907 Portion of loss recognized in other comprehensive income (12,786) (8,137) (12,922) Net impairment losses recognized in earnings 25,485 23,286 15,985 Total non-interest expense 880, , ,286 Income before income taxes 1,758,505 1,595,520 1,487,973 Provision for income taxes 39,116 55,726 50,901 Net income $1,719,389 $1,539,794 $1,437,072 Other comprehensive income (loss) Investments available-for-sale: Not-other-than-temporary-impaired investments 23,435 16,072 94,409 Other-than-temporary-impaired investments 53,901 13,721 21,759 Derivatives and hedging activity 6,362 (91,425) (43,028) Employee benefit plans activity (72,926) (98,935) (25,710) Total other comprehensive income (loss) 10,772 (160,567) 47,430 Comprehensive income $1,730,161 $1,379,227 $1,484,502 The accompanying notes are an integral part of these combined financial statements. 45
48 Combined Statements of Changes in Members' Equity (Dollars in thousands) AgriBank, FCB and Affiliated Associations Capital Accumulated Protected Stock and Other Total Borrower Participation Allocated Unallocated Comprehensive Noncontrolling Members' Equities Certificates Surplus Surplus Income (Loss) Interest Equity Balance at December 31, 2009 $3,391 $240,049 $229,864 $10,350,806 ($480,959) $ -- $10,343,151 Cumulative effect of the adoption of accounting principle 1,304 $1,304 Net income 1,437,072 1,437,072 Other comprehensive income 47,430 47,430 Patronage (176,221) (176,221) Surplus allocated under nonqualified patronage program 36,408 (36,408) -- Redemption of allocated surplus under nonqualified patronage program (1,262) (1,262) Capital stock/participation certificates issued 32,653 32,653 Capital stock/participation certificates retired (675) (25,508) (26,183) Balance at December 31, 2010 $2,716 $247,194 $265,010 $11,576,553 ($433,529) $ -- $11,657,944 Noncontrolling interest equity investment $6,259 $6,259 Net income 1,539,794 1,539,794 Other comprehensive loss (160,567) (160,567) Patronage (200,549) (200,549) Surplus allocated under nonqualified patronage program 40,015 (40,015) -- Redemption of allocated surplus under nonqualified patronage program (14,509) (14,509) Capital stock/participation certificates issued 24,698 24,698 Capital stock/participation certificates retired (660) (18,510) (19,170) Balance at December 31, 2011 $2,056 $253,382 $290,516 $12,875,783 ($594,096) $6,259 $12,833,900 Noncontrolling interest equity investment 15,823 15,823 Net income 1,719,389 1,719,389 Other comprehensive income 10,772 10,772 Patronage (215,412) (215,412) Surplus allocated under nonqualified patronage program 54,967 (54,967) -- Redemption of allocated surplus under nonqualified patronage program (42,694) (42,694) Capital stock/participation certificates issued 29,689 29,689 Capital stock/participation certificates retired (1,751) (21,253) (23,004) Balance at December 31, 2012 $305 $261,818 $302,789 $14,324,793 $(583,324) $22,082 $14,328,463 The accompanying notes are an integral part of these combined financial statements. 46
49 (Dollars in thousands) Combined Statements of Cash Flows AgriBank, FCB and Affiliated Associations For the year ended December 31, Cash flows from operating activities Net income $1,719,389 $1,539,794 $1,437,072 Adjustments to reconcile net income to cash flows from operating activities: Depreciation on premises and equipment 35,249 33,514 33,132 (Gain) loss on sales of premises and equipment (3,477) 51 (645) Depreciation on assets held for lease 81,607 68,917 66,547 Gain on disposal of assets held for lease (504) (1,820) (954) Provision for credit losses 33,907 23, ,913 Loss (gain) on other property owned 22,469 (6,201) 7,217 Gain on bonds held at fair value under fair value option (249) Loss on debt extinguishment ,619 Loss on derivative activities 4,884 5,139 1,684 Impairment of investment securities 25,485 23,286 15,985 Gain on sale of investment securities -- (323) (7,577) Amortization of premiums and discounts on loans and investments 42,617 38,667 45,026 Insurance refund related to FAC stock (5,546) -- (5,141) Changes in operating assets and liabilities: Accrued interest receivable 25,625 5,135 (4,338) Other assets 19,866 (14,623) (6,770) Accrued interest payable (46,400) (42,903) (41,994) Other liabilities 41,425 91,911 (39,905) Total adjustments 278, , ,550 Net cash provided by operating activities 1,997,427 1,764,493 1,699,622 Cash flows from investing activities Increase in loans, net (8,821,321) (3,494,590) (5,004,149) Increase in restricted cash ,506 Proceeds from sales of other property owned 38,842 46,736 34,149 Decrease in other earning assets, net 66,746 61,012 49,139 Increase in investment securities, net (1,300,897) (745,478) (1,240,621) Proceeds from the sale of investment securities ,351 15,056 Purchases of assets held for lease, net (144,641) (102,067) (56,123) Purchases of premises and equipment, net (61,217) (74,298) (50,833) Proceeds from insurance refund related to FAC stock 5, ,141 Net cash used in investing activities (10,216,942) (3,513,334) (6,227,235) Cash flows from financing activities Consolidated bonds and notes issued 254,777, ,723, ,527,172 Consolidated bonds and notes retired (245,832,880) (237,615,419) (377,141,455) Issuance of subordinated notes ,000 (Decrease) increase in cash collateral pledged by counterparties, net (80,800) (85,720) 18,643 Patronage distribution paid (204,830) (175,817) (93,383) Redemption of surplus allocated under nonqualifed patronage program (42,694) (14,509) (1,262) Capital stock/participation certificates issued, net 5,877 4,599 5,752 Increase in noncontrolling interest 15,823 6, Net cash provided by financing activities 8,637,978 1,842,971 4,415,467 Net increase (decrease) in cash and federal funds 418,463 94,130 (112,146) Cash and federal funds at beginning of year 886, , ,854 Cash and federal funds at end of year $1,305,301 $886,838 $792,708 Supplemental schedule of non-cash activities Decrease (increase) in derivative assets $70,189 $112,769 ($10,313) Increase (decrease) in derivative liabilities 879 8,748 (828) (Decrease) increase in bonds from derivative activity (72,546) (24,953) 55,552 Increase (decrease) in members' equity from cash flow derivatives 6,362 (91,425) (43,029) Increase in members' equity from investment securities 77,336 29, ,168 Decrease in members' equity from employee benefits (72,926) (98,935) (25,710) Loans transferred to other property owned 35,364 62,807 83,943 Patronage distributions payable to members 209, , ,957 Cumulative effect of the adoption of accounting principle ,304 Financed sales of other property owned (19,477) (3,503) (3,907) Stock patronage issued Supplemental Information Interest paid $978,224 $1,113,713 $1,198,083 Taxes paid 32,846 40,951 50,356 The accompanying notes are an integral part of these combined financial statements. 47
50 NOTE 1 Notes to Combined Financial Statements AgriBank, FCB and Affiliated Associations Organization and Operations Farm Credit System and District Organization and Operations AgriBank, FCB and affiliated Associations (the District) comprise one of the four Districts of the Farm Credit System, a nationwide system of cooperatively owned Banks and Associations, established by Congress and subject to the provisions of the Farm Credit Act of 1971, as amended. The Farm Credit System specializes in providing financing and related services to qualified borrowers for agricultural and rural purposes. At December 31, 2012, the Farm Credit System was comprised of three Farm Credit Banks, one Agricultural Credit Bank and 82 Associations across the nation. These entities have specific lending authorities within their chartered territories. We are chartered to provide agricultural financing in substantially all of Arkansas, Illinois, Indiana, Iowa, Kentucky, Michigan, Minnesota, Missouri, Nebraska, North Dakota, Ohio, South Dakota, Tennessee, Wisconsin and Wyoming. Our chartered territory is referred to as the District. At December 31, 2012, the District had 17 Agricultural Credit Association (ACA) parent Associations, each of which has wholly owned Federal Land Credit Association (FLCA) and Production Credit Association (PCA) subsidiaries and AgriBank, FCB (AgriBank). The 17 Associations, together with certain related entities and other financial institutions (OFIs), jointly own AgriBank. FLCAs are authorized to originate long-term real estate mortgage loans. PCAs are authorized to originate short-term and intermediate term loans. ACAs are authorized to originate long-term real estate mortgage loans and short-term and intermediate term loans either directly or through their FLCA and PCA subsidiaries. Affiliated Associations are also authorized to provide lease financing options for agricultural purposes and to purchase and hold certain types of investments. AgriBank is the primary funding source for all affiliated Associations. AgriBank raises funds principally through the sale of consolidated Systemwide bonds and notes to the public through the Federal Farm Credit Banks Funding Corporation. The Farm Credit Act sets forth the types of authorized lending activity, persons eligible to borrow and financial services that we can offer. We are authorized to provide, in participation with other lenders, credit and related services to eligible borrowers. Eligible borrowers include farmers, ranchers, producers or harvesters of aquatic products, rural residents and farm related service businesses. The Farm Credit Act, as amended, also allows us to participate with other lenders in loans to similar entities. Similar entities are parties that are not eligible for a loan from a Farm Credit System lending institution, but have operations that are functionally similar to the activities of eligible borrowers. We are also authorized to purchase and hold certain types of investments. We offer various risk management services, including credit life, term life, credit disability, crop hail and multiperil crop insurance to eligible borrowers as additional services. Certain Associations also offer farm records, fee appraisals, producer education, consulting, income tax planning and preparation services and retirement and succession planning. The Farm Credit Administration (FCA) is delegated authority by Congress to regulate the Farm Credit System Banks and Associations. The activities of the Farm Credit System Banks and Associations are examined by the FCA and certain actions by these entities require prior approval from the FCA. 48
51 The Farm Credit Act established the Farm Credit System Insurance Corporation (Insurance Corporation) to administer the Farm Credit Insurance Fund (Insurance Fund). The Insurance Fund is used: to insure the timely payment of principal and interest on Farm Credit Systemwide debt obligations; to insure the retirement of protected borrower capital at par or stated value; and for other specified purposes. At the discretion of the Insurance Corporation, the Insurance Fund is also available to provide assistance to certain troubled Farm Credit System institutions and for the operating expenses of the Insurance Corporation. Each Farm Credit System Bank has been required to pay premiums into the Insurance Fund until the assets in the Insurance Fund equal 2% of the aggregated insured obligations adjusted to reflect the reduced risk on loans or investments guaranteed by federal or state governments. The percentage of aggregate obligations can be changed by the Insurance Corporation, at its sole discretion, to a percentage it determines to be actuarially sound. When the amount in the Insurance Fund exceeds the secure base amount, the Insurance Corporation is required to reduce premiums and may return excess funds above the secure base amount to Farm Credit System institutions. The basis for assessing premiums is insured debt outstanding. Nonaccrual loans and impaired investments are assessed a surcharge while guaranteed loans and investments are deductions from the premium base. AgriBank, in turn, assesses premiums to the Associations each year based on similar factors. Service Organizations The Banks in the Farm Credit System jointly own several service organizations. These organizations were created to provide a variety of services for the Farm Credit System. We have ownership interests in the following service organizations: Federal Farm Credit Banks Funding Corporation provides for the issuance, marketing and processing of Systemwide debt securities using a network of investment dealers and dealer banks and financial management and reporting services; Farm Credit Services Building Association owns and leases premises and equipment to the Farm Credit System's regulator, the FCA; and Farm Credit System Association Captive Insurance Company provides corporate insurance coverage to member organizations. Farm Credit Foundations (FCF) provides benefits and payroll services to AgriBank and the Associations in our District as well as certain other Farm Credit System entities. FCF operated as a part of AgriBank prior to January 1, FCF was formed as a service corporation effective January 1, The Farm Credit System entities using FCF as their payroll and benefits provider contributed an investment into the service corporation in January Our District s share of this investment was $728 thousand. In addition, the Farm Credit Council acts as a full-service federated trade association that represents the Farm Credit System before Congress, the Executive Branch and others and provides support services to Farm Credit System institutions on a fee basis. 49
52 NOTE 2 Summary of Significant Accounting Policies Our accounting policies conform to accounting principles generally accepted in the United States of America (U.S.) and prevailing practices within the financial services industry. The preparation of financial statements in conformity with generally accepted accounting principles (GAAP) requires management to make estimates and assumptions that affect the reported amounts of assets and liabilities and disclosure of contingent assets and liabilities at the date of the financial statements and the reported amounts of revenues and expenses during the reporting period. Actual results could differ from those estimates. Certain amounts in prior years combined financial statements have been reclassified to conform to the current year s presentation. Principles of Combination: The accompanying combined financial statements include the accounts of AgriBank and the affiliated Associations and reflect the investments in service organizations in which we have partial ownership interests. Accounting for the investments in service organizations is on a cost plus allocated equities basis. No quoted market value is available for the investments in service organizations. All significant transactions and balances between AgriBank and the affiliated Associations have been eliminated in combination. Combined financial statements of the District are presented because of the financial and operational interdependence of AgriBank and the affiliated Associations. Loans: Long-term mortgage loan amortization terms range up to 40 years. Substantially all commercial loans are made for agricultural production or operating purposes and have maturities of 10 years or less. Loans are carried at their principal amount outstanding. Interest on loans is accrued and credited to interest income based upon the daily principal amount outstanding. Loan fees, net of related origination costs, are deferred and recognized over the life of the loan as a yield adjustment into net interest income. Loans are generally placed in nonaccrual status when principal or interest is delinquent for 90 days or more (unless well secured and in the process of collection) or circumstances indicate that full collection is not expected. When a loan is placed in nonaccrual status, unpaid interest accrued in the current year is reversed to the extent principal plus accrued interest before the transfer exceeds the net realizable value of the collateral and any unpaid interest accrued in a prior year is capitalized to the recorded investment of the loan. Cash received on nonaccrual loans is applied to reduce the recorded investment in the loan asset except in those cases where the collection of the recorded investment is fully expected and the loan has no unrecovered prior charge-offs. Nonaccrual loans may be returned to accrual status when principal and interest are current, prior charge-offs have been recovered, the ability of the borrower to fulfill the contractual repayment terms is fully expected and the loan is not classified doubtful or loss. In situations where, for economic or legal reasons related to the borrower s financial difficulties, we grant a concession for other than an insignificant period of time to the borrower that we would not otherwise consider, the related loan is classified as a troubled debt restructuring, also known as formally restructured. A concession is generally granted in order to minimize economic loss and avoid foreclosure. Concessions vary by program and borrower and may include interest rate reductions, term extensions, payment deferrals, or an acceptance of additional collateral in lieu of payments. In limited circumstances, principal may be forgiven. Loans classified as troubled debt restructurings are considered risk loans. 50
53 Loans that are sold as participations are transferred as entire financial assets, groups of entire financial assets, or participating interests in the loans. The transfers of such assets or participating interests are structured such that control over the transferred assets or participating interest have been surrendered and that all of the conditions have been met to be accounted for as a sale. Allowance for Loan Losses: The allowance for loan losses is maintained at a level considered adequate by management to provide for probable and estimable losses as of the date of the financial statements. The allowance is based on a periodic evaluation of the loan portfolio by management in which numerous factors are considered, including loan loss history, probability of default, estimated loss severity, portfolio quality and current economic and environmental conditions. The allowance for loan losses encompasses various judgments, evaluations and appraisals with respect to the loans and their underlying security that, by their nature, contain elements of uncertainty and imprecision. Changes in the agricultural economy, the U.S. economy and their impact on borrower repayment capacity will cause these various judgments, evaluations and appraisals to change over time. Accordingly, actual circumstances could vary significantly from the institutions expectations and predictions of those circumstances. Management considers the following factors in determining and supporting the levels of allowances for loan losses: the concentration of lending in agriculture, combined with uncertainties associated with farmland values, commodity prices, exports, government assistance programs, regional economic effects and weather-related influences. A loan is impaired when it is probable that all amounts due under the contractual terms of the loan agreement will not be collected. Loans in our portfolio that are considered impaired are analyzed individually to establish a specific allowance for impaired loans. Impairment is generally measured based on the net realizable value of the collateral. All risk loans are considered to be impaired loans. Risk loans include: nonaccrual loans; accruing restructured loans; and accruing loans 90 days or more past due. Specific allowances are recorded to reduce the carrying amount of the risk loan to the lower of book value or the net realizable value of collateral. When a loan is deemed to be uncollectible, the loan principal and prior year(s) accrued interest is charged-off against the allowance for loan losses. Subsequent recoveries, if any, are added to the allowance for loan losses. We determine the amount of allowance that is required by analyzing risk loans individually and all other loans by grouping them into loan segments sharing similar risk characteristics. For loans that were not individually evaluated for impairment we use a two-dimensional loan risk rating model that incorporates a 14-point rating scale to identify and track the probability of borrower default and a separate 6-point scale addressing the loss given default. An allowance is recorded for the loan segments evaluated collectively for probable and estimable credit losses as of the financial statement date based on loss probability and loss severity appropriate for its segment. These estimated losses may be adjusted for relevant current environmental factors. These factors may vary by the different segments reflecting the risk characteristics of each segment. As loss probability, loss severity and environmental factors change, earnings are impacted. Risk loans are analyzed individually to establish specific allowances. We record a specific allowance, if appropriate, to reduce the carrying amount of the risk loan to the lower of book value or the net realizable value of collateral. Changes in the allowance for loan losses consist of provision activity, recorded as Provision for credit losses in the Combined Statements of Comprehensive Income, charge-offs and recoveries. 51
54 The reserve for unfunded commitments and unfunded letters of credit is based on the best estimate of losses inherent in lending commitments and issued letters of credit made to customers but not yet disbursed. Factors such as the likelihood of disbursal and likelihood of losses given disbursement were utilized in determining this contingency. Changes in the reserve for unfunded commitments and unfunded letters of credit consist of provision activity, recorded as Provision for credit losses on the Combined Statements of Comprehensive Income. AgriBank Investment Securities and Federal Funds: The FCA regulations permit AgriBank to hold eligible investments for the purpose of maintaining a liquidity reserve, managing short-term surplus funds and managing interest rate risk. AgriBank s investments may not necessarily be held-to-maturity and accordingly, have been classified as available-for-sale. These investments are reported at fair value, and unrealized holding gains and losses on investments that are not other-than-temporarily impaired are netted and reported as a separate component of members equity (accumulated other comprehensive loss). Changes in the fair value of investments are reflected as direct charges or credits to other comprehensive income, unless the investment is deemed to be other-than-temporarily impaired. When other than temporary impairment exists and AgriBank does not intend to sell the impaired debt security nor is AgriBank more likely than not to be required to sell the security before recovery, the loss is separated into credit-related and non-credit-related components. If an investment is deemed to be other-than-temporarily impaired, the security is written down to fair value, the credit-related component is recognized through earnings and the non-credit-related component is recognized in other comprehensive income. Purchased premiums and discounts are amortized or accreted using the interest method over the terms of the respective investments. Realized gains and losses are determined using the specific identification method and are recognized in current operations. Affiliated Association Investment Securities: The FCA regulations authorize Associations to purchase and hold certain types of investments. As Associations have the positive intent and ability to hold these investments to maturity, they have been classified as held-to-maturity and are carried at cost adjusted for the amortization of premiums and accretion of discounts. If an investment is determined to be other-than-temporarily impaired, the carrying value of the security is written down to fair value. The impairment loss is separated into credit-related and non-credit-related components. The credit-related component is expensed through earnings in the period of impairment. The non-credit-related component is recognized in other comprehensive income and amortized over the remaining life of the security as an increase in the security s carrying amount. Cash: Cash, as included in the combined financial statements, represents cash on hand and deposits at banks. Premises and Equipment: Premises and equipment are carried at cost less accumulated depreciation. Depreciation is generally provided on the straight-line method over the estimated useful life of the asset. Gains or losses on disposition are reflected in current operations and are included in Miscellaneous income and other gains (losses), net on the Combined Statements of Comprehensive Income. Maintenance and repairs are charged to other operating expenses and improvements are capitalized. Internally developed software costs are capitalized and amortized over their estimated useful life. Other Property Owned: Other property owned, consisting of real and personal property acquired through foreclosure or deed in lieu of foreclosure, is recorded at fair value less estimated selling costs upon acquisition. Any initial reduction in the carrying amount of a loan to the fair value of the collateral received is charged to the allowance for loan losses. Revised estimates to the fair value less costs to sell are reported as adjustments to the carrying amount of the asset, provided that such adjusted value is not in excess of the carrying amount at acquisition. Related income and expenses from operations and carrying value adjustments are included in Miscellaneous income and other gains (losses), net on the Combined Statements of Comprehensive Income. 52
55 In connection with past foreclosure and sale proceedings, AgriBank has retained certain mineral interests and equity positions in land from which it receives income from lease bonuses, rentals and leasing and production royalties. These intangible assets have no recorded value on the Combined Statements of Condition. We receive income from mineral and royalty holdings. The Farm Credit Act requires that mineral rights acquired after 1985 through foreclosure be sold to the buyer of the surface rights in the land. All income received on these mineral rights is recognized in the period received and is included in Mineral income on the Combined Statements of Comprehensive Income. Leases: Certain District institutions have finance and operating leases. For finance leases, unearned finance lease income from lease contracts represents the excess of gross lease receivables plus residual receivables over the cost of leased equipment. Net unearned finance income is amortized to earnings using the interest method. The carrying amount of finance leases is presented in Loans on the Combined Statements of Condition and represents lease rent receivables net of the unearned income plus the estimated residual value. For operating leases, revenue is recognized as earned ratably over the term of the lease and depreciation and other expenses are charged against such revenue as incurred. The carrying amount of operating leases is presented as Assets held for lease, net on the Combined Statements of Condition and represents the asset cost net of accumulated depreciation. Post-Employment Benefit Plans: The AgriBank Farm Credit District has various post-employment benefit plans. The defined contribution plan allows eligible employees to save for their retirement either pre-tax/post-tax or both with an employer match on a percentage of the employee s contributions. All employees hired after December 31, 2006 only participate in the defined contribution plan. Benefits are provided under this plan in the form of a fixed percentage of salary contribution in addition to the employer match. Employer contributions are expensed when incurred. Certain employees also participate in the defined benefit retirement plan. The plan is comprised of two benefit formulas. Employees hired prior to October 1, 2001, were on the final average pay formula. These employees were given a one-time option to convert to the cash balance formula or to remain on a final average pay formula. Between October 1, 2001 and December 31, 2006, all new benefits-eligible employees participated in the cash balance formula. Effective January 1, 2007, the defined benefit retirement plan was closed to new employees. The District plan utilizes the "Projected Unit Credit" actuarial method for financial reporting purposes and the "Entry Age Normal Cost" method for funding purposes. Certain employees also participate in the non-qualified defined benefit pension restoration plan. This plan restores retirement benefits to certain highly compensated eligible employees that would have been provided under the qualified plan if such benefits were not above the Internal Revenue Code compensation or other limits. Certain health insurance benefits are provided to eligible retired employees according to the terms of those benefit plans. The anticipated cost of these benefits is accrued during the employees active service period. Income Taxes: AgriBank and the FLCAs are exempt from federal and other income taxes as provided in the Farm Credit Act. The PCAs and ACAs accrue federal and state income taxes where applicable. The ACAs and PCAs are exempt from certain state taxes. Deferred tax assets and liabilities are recognized for the expected future tax consequences of temporary differences between the carrying amounts and tax basis of assets and liabilities. Deferred tax assets are recorded if the deferred tax asset is more likely than not to be realized. If the realization test cannot be met, the deferred tax asset is reduced by a valuation allowance. 53
56 Certain Associations have patronage programs. Provisions for income taxes are made only on the earnings not distributed as qualified patronage distributions. Patronage Program: Certain District entities accrue patronage refunds when declared by their Boards of Directors. Entities with patronage programs accrue patronage refunds and pay the refunds in accordance with the declarations of their Boards of Directors, generally after year end. Noncontrolling Interest: Accounting guidance requires that noncontrolling interests be reported as a component of total equity. The noncontrolling interest represents the equity investments of Farm Credit entities outside the AgriBank District in the AgDirect program, which began in April 2011 and FCF which was formed January Under the AgDirect program, AgriBank purchases 100% loan participation interests in retail equipment financing loans from AgDirect LLP (LLP), a Limited Liability Partnership. An Association in the AgDirect program first purchases a participation interest in a retail installment sales contract originated by an equipment dealer at the point of sale. The Association sells a 100% participation interest to the LLP, which immediately sells a 100% participation interest to AgriBank. The LLP purchases an initial investment in AgriBank stock equal to 6% of the participation loan balance. The LLP does not hold any assets other than its investment in AgriBank which is eliminated in combination. The source of earnings for the LLP is from patronage paid by AgriBank, if any. Such patronage is paid at the sole discretion of the AgriBank Board of Directors. During 2012, AgriBank s Board declared $6.8 million of discretionary patronage. This patronage approximated the net earnings of the program less a specified return on our capital. No patronage was declared on our AgDirect program in Refer to Note 1 for further discussion of FCF. Combined Statements of Cash Flows: For purposes of reporting cash flows, cash includes cash and overnight federal funds. Cash flows on hedges are classified in the same category as the items being hedged. Derivative Instruments and Hedging Activity: AgriBank is party to derivative financial instruments, primarily interest rate swaps, interest rate caps, interest rate floors and swaptions, which are used to manage interest rate risk on assets, liabilities and anticipated transactions. In accordance with Financial Accounting Standards Board (FASB) guidance on Accounting for Derivative Instruments and Hedging Activities, derivatives are recorded on the Combined Statements of Condition as assets and liabilities, measured at fair value. In accordance with the FASB guidance, changes in the fair values of derivatives are accounted for as gains or losses through earnings or as a component of other comprehensive income, in the Combined Statements of Comprehensive Income depending on the use of the derivative and whether it is designated and qualifies for hedge accounting. For fair value hedge transactions in which AgriBank is hedging changes in the fair value of an asset or liability, changes in the fair value of the derivative instrument are offset in net income in the Combined Statements of Comprehensive Income by changes in the fair value of the hedged item. For cash flow hedge transactions hedging the variability of cash flows related to a variable-rate asset or liability, changes in the fair value of the derivative instrument are reported in other comprehensive income in the Combined Statements of Comprehensive Income. The gains and losses on the derivative instruments reported in other comprehensive income are reclassified as earnings in the periods in which earnings are impacted by the variability of the cash flows of the hedged item. The ineffective portion of all hedges is recognized in current period earnings. For derivatives not designated as a hedging instrument, the related change in fair value is recorded in current period earnings. 54
57 AgriBank documents all relationships between hedging instruments and hedged items, as well as our risk management objective and strategy for undertaking various hedge transactions. This process includes linking all derivatives that are designated as fair value or cash flow hedges to: specific assets or liabilities on the Combined Statements of Condition; firm commitments; or forecasted transactions. For hedging relationships, AgriBank assesses effectiveness of the hedging relationship according to the FASB guidance. This guidance requires that prospective effectiveness tests be performed at inception and retrospective tests be performed on an ongoing basis until the maturity or termination of the hedge. For prospective testing, we perform a shock test of interest rate movements. Additional tests may be performed if they appear to be reasonable relative to the hedge relationship that is being evaluated. For retrospective testing, our procedure is to perform correlation and regression tests of the value change of the hedge versus the value change of the hedged item using weekly data. If the hedge relationship does not pass the minimum levels established for effectiveness tests, hedge accounting will be discontinued. AgriBank discontinues hedge accounting prospectively when it is determined that: a derivative is no longer effective in offsetting changes in the fair value or cash flows of a hedged item; the derivative expires or is sold, terminated, exercised or de-designated as a hedge; it is no longer probable that the forecasted transaction will occur; a hedged firm commitment no longer meets the definition of a firm commitment; or management determines that designating the derivative as a hedging instrument is no longer appropriate. When AgriBank discontinues hedge accounting for cash flow hedges, any remaining accumulated other comprehensive income or loss is amortized into earnings over the remaining life of the original hedged item. When AgriBank discontinues hedge accounting for fair value hedges, changes in the fair value of the derivative will be recorded in current period earnings and the basis adjustment to the previously hedged item will be taken into earnings using the interest method over the remaining life of the hedged item. In all situations in which hedge accounting is discontinued and the derivative remains outstanding, we will carry the derivative at its fair value on the Combined Statements of Condition, recognizing changes in fair value in current period earnings. Refer to Note 18 for further discussion. Fair Value Measurements: The FASB guidance on Fair Value Measurements describes three levels of inputs that may be used to measure fair value. Level 1 Quoted prices in active markets for identical assets or liabilities that the reporting entity has the ability to access at the measurement date. Level 2 Observable inputs other than quoted prices included within Level 1 that are observable for the asset or liability either directly or indirectly. Level 2 inputs include the following: quoted prices for similar assets or liabilities in active markets; quoted prices for identical or similar assets or liabilities in markets that are not active so that they are traded less frequently than exchange-traded instruments, quoted prices that are not current or principal market information that is not released publicly; inputs that are observable such as interest rates and yield curves, prepayment speeds, credit risks and default rates; and 55
58 inputs derived principally from or corroborated by observable market data by correlation or other means. Level 3 Unobservable inputs that are supported by little or no market activity and that are significant to the fair value of the assets or liabilities. These unobservable inputs reflect the reporting entity s own assumptions about assumptions that market participants would use in pricing the asset or liability. Level 3 assets and liabilities include financial instruments whose value is determined using pricing models, discounted cash flow methodologies, or similar techniques, as well as instruments for which the determination of fair value requires significant management judgment or estimation. Recently Issued or Adopted Accounting Pronouncements: In December 2011, the FASB issued guidance entitled, Balance Sheet Disclosures about Offsetting Assets and Liabilities. In January 2013, the FASB issued clarifying guidance surrounding the scope of financial instruments covered under this guidance. The offsetting disclosures are only applied to derivatives, repurchase agreements and securities lending transactions. The guidance requires an entity to disclose information about offsetting and related arrangements to enable users of its financial statements to understand the effect of those arrangements on its financial position. This includes the effect or potential effect of rights of setoff associated with an entity s recognized assets and recognized liabilities. The requirements apply to in scope financial instruments that are offset in accordance with the rights of offset set forth in accounting guidance and for those financial instruments that are subject to an enforceable master netting arrangement or similar agreement, irrespective of whether they are offset or not. This guidance is to be applied retrospectively for all comparative periods and is effective for annual reporting periods beginning on or after January 1, 2013, and interim periods within those annual periods. The adoption of this guidance will not impact financial condition or results of operations, but will result in additional disclosures. In June 2011, the FASB issued guidance entitled Presentation of Comprehensive Income. This standard eliminated the current option to report other comprehensive income and its components in the statements of changes in equity. An entity can elect to present items of net income and other comprehensive income in one continuous statement referred to as the Combined Statements of Comprehensive Income or in two separate, but consecutive, statements. Each component of net income and each component of other comprehensive income, together with totals for comprehensive income and its two parts net income and other comprehensive income, would need to be displayed under either alternative. The statement(s) would need to be presented with equal prominence as the other primary financial statements. The guidance is intended to improve the comparability, consistency and transparency of financial reporting and to increase the prominence of items reported in other comprehensive income. This guidance is effective as of the beginning of a fiscal year that begins after December 15, The adoption of this guidance did not have an impact on our financial condition or results of operations, but did result in changes to our financial statement presentation. In December 2011, the FASB issued guidance to defer the new requirement to present components of reclassifications of other comprehensive income on the face of the statement. All other requirements in the guidance for comprehensive income are required to be adopted as set forth in the June 2011 guidance. The deferral is effective at the same time the new standard on comprehensive income is adopted. In May 2011, the FASB issued guidance entitled, Fair Value Measurement Amendments to Achieve Common Fair Value Measurements and Disclosure Requirements in U.S. GAAP and IFRS. The amendments clarify certain aspects of the fair value measurement and increases disclosure requirements. The amendments are applied prospectively. The amendments are effective during interim and annual periods beginning after December 15, The adoption of this guidance did not have an impact on our financial condition or results of operations, but resulted in additional disclosures. 56
59 In April 2011, the FASB issued guidance entitled, A Creditor's Determination of Whether a Restructuring Is a Troubled Debt Restructuring. The guidance provided additional clarification to creditors for evaluating whether a modification or restructuring of a receivable is a troubled debt restructuring. The guidance was effective for non-public entities for annual periods ending on or after December 15, 2012, including interim periods within those annual periods. The adoption of this guidance did not have a significant impact on our combined financial condition or combined results of operations. NOTE 3 Loans and Allowance for Loan Losses Loans consisted of the following: (in thousands) December 31, 2012 December 31, 2011 December 31, 2010 Amount % Amount % Amount % Real estate mortgage $43,808, % $38,276, % $35,619, % Production and intermediate term 21,293, % 19,448, % 18,344, % Agribusiness 6,402, % 5,668, % 6,536, % Rural residential real estate 2,501, % 2,316, % 2,202, % Other 3,082, % 2,639, % 2,332, % Total loans $77,089, % $68,349, % $65,035, % The other category is primarily comprised of communication and energy related loans as well as AgriBank s loans to other financial institutions (OFIs) and loans originated under our Mission Related Investment authority. 57
60 Participations We may purchase or sell participation interests with other parties in order to diversify risk, manage loan volume and comply with the FCA regulations or General Financing Agreement limitations. The following table presents information regarding participations purchased and/or sold: (in thousands) Other Farm Credit Institutions Non-Farm Credit Institutions Total Participations Participations Participations Participations Participations Participations As of December 31, 2012 Purchased Sold Purchased Sold Purchased Sold Real estate mortgage $830,665 $154,048 $2,033,790 $37,200 $2,864,455 $191,248 Production and intermediate term 565, ,183 3,080,414 43,839 3,645, ,022 Agribusiness 2,626, , , ,231 3,311, ,859 Rural residential real estate , , Other 1,497, ,082 18, ,515, ,082 Total loans $5,519,901 $967,949 $5,834,770 $380,318 $11,354,671 $1,348,267 (in thousands) Other Farm Credit Institutions Non-Farm Credit Institutions Total Participations Participations Participations Participations Participations Participations As of December 31, 2011 Purchased Sold Purchased Sold Purchased Sold Real estate mortgage $756,174 $114,972 $1,837,541 $54,063 $2,593,715 $169,035 Production and intermediate term 518, ,375 2,573,324 45,354 3,092, ,729 Agribusiness 2,195, ,317 1,254, ,226 3,450, ,543 Rural residential real estate , , Other 1,100,590 45,396 33, ,133,906 45,396 Total loans $4,571,119 $839,060 $5,719,305 $392,701 $10,290,424 $1,231,761 Information in the preceding chart excludes loans entered into under our Mission Related Investment and leasing authorities. Portfolio Diversification Loan concentrations exist when amounts loaned to multiple borrowers engaged in similar activities, or within close proximity, would cause them to be similarly affected by economic or other conditions. The charts below illustrate commodity and geographic distribution of our portfolio as of December 31, 2012: Poultry, 3% Food products, 3% Ethanol, 1% Investor real estate, 5% Residential real estate, 5% District Portfolio Commodity Distribution Timber, 3% Other, 10% Dairy, 8% Cattle, 9% Crops, 48% Pork, 5% District Portfolio State Distribution Iowa 12% Illinois 10% Minnesota 9% Nebraska 8% Indiana 6% Wisconsin 6% Michigan 6% Ohio 6% Tennessee 5% South Dakota 5% Missouri 5% Kentucky 4% North Dakota 4% Arkansas 3% Wyoming 1% Other states 10% 100% 58
61 The District may have multiple entities with loans to individual customers. The ten largest customers from a District perspective at December 31, 2012 totaled $1.7 billion, or 2.2%, of loans outstanding. None of these loans were in nonaccrual status at December 31, The recorded loan principal plus any unfunded commitments represent our maximum potential credit risk; however, a substantial portion of our lending activities are collateralized. Accordingly, the credit risk associated with lending activities is less than the recorded loan principal. The amount of collateral obtained, if deemed necessary upon extension of credit, is based on management s credit evaluation of the borrower. Collateral held varies, but typically includes farmland and income-producing property, such as crops and livestock, as well as receivables. Long-term real estate loans are secured by the first liens on the underlying real property. The FCA regulations state that long-term real estate loans are not to exceed 85% (97% if guaranteed by a government agency) of the property s appraised value at origination. However, a decline in a property s market value subsequent to loan origination or advances, or other actions necessary to protect the financial interest of the lender in the collateral, may result in loan-to-value ratios in excess of the regulatory maximum. The District has an internally maintained database which uses market data to estimate market values of collateral for a significant portion of our real estate mortgage portfolio. An estimate of our credit risk exposure is considered in our allowance for loan losses. Portfolio Performance One credit quality indicator we utilize is the FCA Uniform Loan Classification System that categorizes loans into five categories. The categories are defined as follows: Acceptable assets are non-criticized assets representing the highest quality. They are expected to be fully collectible. This category is further differentiated into various probabilities of default; Other Assets Especially Mentioned (Special Mention) are currently collectible but exhibit some potential weakness. These assets involve increased credit risk, but not to the point of justifying a substandard classification; Substandard assets exhibit some serious weakness in repayment capacity, equity and/or collateral pledged on the loan; Doubtful assets exhibit similar weaknesses as substandard assets. However, doubtful assets have additional weaknesses in existing factors, conditions and values that make collection in full highly questionable; and Loss assets are considered uncollectible. 59
62 The following table presents the credit quality of our loan portfolio under the FCA Uniform Loan Classification System by loan type (accruing loans include accrued interest receivable): (in thousands) As of December 31, 2012 Acceptable Special mention Substandard/Doubtful Total Real estate mortgage $42,612, % $533, % $1,107, % $44,253, % Production and intermediate term 20,760, % 260, % 532, % 21,552, % Agribusiness 5,900, % 289, % 239, % 6,429, % Rural residential real estate 2,389, % 22, % 102, % 2,513, % Other 3,013, % 9, % 65, % 3,087, % Total loans $74,675, % $1,114, % $2,046, % $77,836, % (in thousands) As of December 31, 2011 Acceptable Special mention Substandard/Doubtful Total Real estate mortgage $36,474, % $985, % $1,267, % $38,727, % Production and intermediate term 18,636, % 432, % 649, % 19,718, % Agribusiness 5,110, % 434, % 147, % 5,692, % Rural residential real estate 2,197, % 25, % 104, % 2,328, % Other 2,548, % 48, % 49, % 2,646, % Total loans $64,968, % $1,926, % $2,218, % $69,113, % (in thousands) As of December 31, 2010 Acceptable Special mention Substandard/Doubtful Total Real estate mortgage $ 33,319, % $1,241, % $1,498, % $36,060, % Production and intermediate term 17,085, % 538, % 979, % 18,604, % Agribusiness 5,656, % 548, % 365, % 6,571, % Rural residential real estate 2,077, % 35, % 99, % 2,212, % Other 2,280, % 27, % 30, % 2,337, % Total loans $ 60,420, % $2,391, % $2,973, % $65,785, % 60
63 The following table provides an age analysis of past due loans by loan type (accruing loans include accrued interest receivable): (in thousands) Not Past Due, Days Less than Days or More Total 30 Days Total As of December 31, 2012 Past Due Past Due Past Due Past Due Loans Accruing loans 90 days or more past Real estate mortgage $142,573 $135,844 $278,417 $43,974,876 $44,253,293 $11,928 Production and intermediate term 62,754 50, ,989 21,439,558 21,552,547 6,670 Agribusiness 30,507 14,395 44,902 6,384,115 6,429, Rural residential real estate 29,750 15,292 45,042 2,468,614 2,513, Other 14,077 14,305 28,382 3,059,452 3,087,834 1,212 Total loans $279,661 $230,071 $509,732 $77,326,615 $77,836,347 $20,501 (in thousands) Not Past Due, Days Less than Days or More Total 30 Days Total As of December 31, 2011 Past Due Past Due Past Due Past Due Loans Accruing loans 90 days or more past Real estate mortgage $147,278 $139,106 $286,384 $38,441,500 $38,727,884 $2,109 Production and intermediate term 69,127 70, ,310 19,579,317 19,718,627 1,078 Agribusiness 828 5,634 6,462 5,685,952 5,692, Rural residential real estate 34,525 20,338 54,863 2,273,297 2,328, Other 17,696 5,981 23,677 2,622,909 2,646,586 1,010 Total loans $269,454 $241,242 $510,696 $68,602,975 $69,113,671 $4,197 (in thousands) Not Past Due, Days Less than Days or More Total 30 Days Total As of December 31, 2010 Past Due Past Due Past Due Past Due Loans Accruing loans 90 days or more past Real estate mortgage $152,441 $181,415 $333,856 $35,726,162 $36,060,018 $3,043 Production and intermediate term 56, , ,991 18,424,247 18,604,238 3,445 Agribusiness 2,783 25,422 28,205 6,542,821 6,571, Rural residential real estate 36,766 20,601 57,367 2,155,305 2,212, Other 221, , ,306 1,771,328 2,337, Total loans $470,485 $695,240 $1,165,725 $64,619,863 $65,785,588 $7,595 61
64 Impaired Assets Risk loans are loans for which it is probable that all principal and interest will not be collected according to the contractual terms. Interest income recognized and cash payments received on nonaccrual risk loans are applied as described in Note 2. The following table presents risk loan (accruing loans include accrued interest receivable) information: (in thousands) As of December 31, Nonaccrual loans: Current as to principal and interest $428,573 $561,771 $532,364 Past due 272, , ,456 Total nonaccrual loans 700, , ,820 Accruing restructured loans 45,565 31,230 21,231 Accruing loans 90 days or more past due 20,501 4,197 7,595 Total risk loans $766,895 $920,369 $988,646 Volume with specific reserves $175,035 $321,671 $361,401 Volume without specific reserves 591, , ,245 Total risk loans $766,895 $920,369 $988,646 Specific reserves $60,235 $95,541 $114,877 For the year ended December 31, Income on accrual risk loans $2,638 $2,387 $2,492 Income on nonaccrual loans 36,503 40,288 33,471 Total income on risk loans $39,141 $42,675 $35,963 Average risk loans $859,555 $1,015,553 $1,184,636 62
65 Risk assets by loan type (accruing loans include accrued interest receivable) are as follows: (in thousands) As of December 31, Nonaccrual loans: Real estate mortgage $419,837 $492,938 $509,264 Production and intermediate term 172, , ,183 Agribusiness 38,817 71,370 78,510 Rural residential real estate 51,063 59,605 49,271 Other 19,003 11,627 15,592 Total nonaccrual loans $700,829 $884,942 $959,820 Accruing restructured loans: Real estate mortgage $33,099 $18,683 $18,009 Production and intermediate term 3,589 3,634 3,007 Agribusiness 4,398 4, Rural residential real estate Other 4,081 4, Total accruing restructured loans $45,565 $31,230 $21,231 Accruing loans 90 days or more past due: Real estate mortgage $11,928 $2,109 $3,043 Production and intermediate term 6,670 1,078 3,445 Agribusiness Rural residential real estate Other 1,212 1, Total accruing loans 90 days or more past due $20,501 $4,197 $7,595 Total risk loans $766,895 $920,369 $988,646 Other property owned $67,836 $113,260 $94,491 Total risk assets $834,731 $1,033,629 $1,083,137 The decrease in risk assets in 2012 was due primarily to decreases in nonaccrual loans related to repayments, net charge-offs and transfers of loans to accrual status partially offset by transfers to nonaccrual status. The decrease in other property owned was primarily due to the sale of a commercial dairy, a large tract of timber and a lumber concentration yard business at one affiliated Association. Nonaccrual loans represented 0.9% of total loans at December 31, At December 31, 2012, 61.2% of nonaccrual loans were current as to principal and interest. Total risk loans as a percentage of total loans remains within acceptable limits. The decrease in risk assets in 2011 was due primarily to decreases in nonaccrual loans related to a customer in accrual status purchasing the assets of a large dairy customer whose loans were previously in nonaccrual status. 63
66 All risk loans are considered to be impaired loans. The following table provides additional impaired loan information: (in thousands) As of December 31, 2012 For the year ended December 31, 2012 Unpaid Recorded Investment * Principal Balance ** Related Allowance Average Impaired Loans Interest Income Recognized Impaired loans with a related allowance for loan losses: Real estate mortgage $79,805 $108,370 $21,486 $82,255 $ -- Production and intermediate term 72, ,237 31,696 87, Agribusiness 3,862 7,550 1,468 19, Rural residential real estate 8,784 12,055 1,936 9, Other 9,606 10,062 3,649 6, Total $175,035 $257,274 $60,235 $205,660 $ -- Impaired loans with no related allowance for loan losses: Real estate mortgage $385,059 $481,570 $ -- $416,154 $16,350 Production and intermediate term 109, , ,463 11,200 Agribusiness 39,712 48, ,684 9,560 Rural residential real estate 43,009 54, ,245 1,735 Other 14,690 14, , Total $591,860 $805,813 $ -- $653,895 $39,141 Total impaired loans: Real estate mortgage $464,864 $589,940 $21,486 $498,409 $16,350 Production and intermediate term 182, ,752 31, ,215 11,200 Agribusiness 43,574 56,543 1,468 59,197 9,560 Rural residential real estate 51,793 66,183 1,936 55,672 1,735 Other 24,296 24,669 3,649 23, Total $766,895 $1,063,087 $60,235 $859,555 $39,141 (in thousands) As of December 31, 2011 For the year ended December 31, 2011 Unpaid Interest Income Recorded Principal Related Average Impaired Investment* Balance ** Recognized Allowance Loans Impaired loans with a related allowance for loan losses: Real estate mortgage $108,666 $132,607 $25,423 $94,984 $ -- Production and intermediate term 151, ,401 47, , Agribusiness 45,033 52,854 17, , Rural residential real estate 11,924 15,193 2,785 10, Other 4,716 9,218 1,955 2, Total $321,671 $419,273 $95,541 $381,221 $ -- Impaired loans with no related allowance for loan losses: Real estate mortgage $405,064 $499,468 $ -- $418,581 $17,828 Production and intermediate term 102, , ,222 12,084 Agribusiness 30,851 47, ,839 9,911 Rural residential real estate 47,729 58, ,021 2,077 Other 12,272 20, , Total $598,698 $806,341 $ -- $634,332 $42,675 Total impaired loans: Real estate mortgage $513,730 $632,075 $25,423 $513,565 $17,828 Production and intermediate term 254, ,400 47, ,925 12,084 Agribusiness 75, ,833 17, ,454 9,911 Rural residential real estate 59,653 73,865 2,785 55,357 2,077 Other 16,988 29,441 1,955 14, Total $920,369 $1,225,614 $95,541 $1,015,553 $42,675 64
67 (in thousands) As of December 31, 2010 For the As of December 31, 2010 Unpaid Interest Income Recorded Principal Related Average Impaired Investment* Balance ** Recognized Allowance Loans Impaired loans with a related allowance for loan losses: Real estate mortgage $112,291 $112,119 $30,647 $112,540 $ -- Production and intermediate term 184, ,502 54, , Agribusiness 49,497 49,497 25,394 33, Rural residential real estate 6,505 6,493 1,557 6, Other 8,312 8,053 2,819 1, Total $361,401 $360,664 $114,877 $368,833 $ -- Impaired loans with no related allowance for loan losses: Real estate mortgage $418,025 $364,534 $ -- $343,353 $10,447 Production and intermediate term 128,839 29, ,643 8,112 Agribusiness 29,039 21, ,089 15,185 Rural residential real estate 43,300 35, ,122 1,235 Other 8,042 6, , Total $627,245 $457,627 $ -- $815,803 $35,963 Total impaired loans: Real estate mortgage $530,316 $476,653 $30,647 $455,893 $10,447 Production and intermediate term 313, ,339 54, ,000 8,112 Agribusiness 78,536 70,996 25, ,458 15,185 Rural residential real estate 49,805 41,999 1,557 41,404 1,235 Other 16,354 14,304 2, , Total $988,646 $818,291 $114,877 $1,184,636 $35,963 * The recorded investment in the receivable is the face amount increased or decreased by applicable accrued interest and unamortized premium, discount, finance charges and acquisition costs and may also reflect a previous direct write-down of the investment. The recorded investment may be less than the unpaid principal balance as payments on non-cash basis nonaccrual loans reduce the recorded investment. ** Unpaid principal balance represents the contractual principal balance of the loan. Troubled Debt Restructurings The following table presents information regarding troubled debt restructurings that occurred during the following periods: (in thousands) Pre-modification Outstanding Post-modification Outstanding As of December 31, 2012 Recorded Investment* Recorded Investment* Troubled debt restructurings: Real estate mortgage $40,835 $40,839 Production and intermediate term 15,802 15,630 Rural residential real estate 1,863 1,745 Total loans $58,500 $58,214 (in thousands) Pre-modification Outstanding Post-modification Outstanding December 31, 2011 Recorded Investment* Recorded Investment* Troubled debt restructurings: Real estate mortgage $46,991 $47,432 Production and intermediate term 28,748 28,840 Agribusiness 99,035 99,035 Rural residential real estate 1,812 1,811 Other 1,914 1,914 Total loans $178,500 $179,032 * Pre-modification outstanding represents the recorded investment just prior to restructuring and post-modification outstanding represents the recorded investment immediately following the restructuring. The recorded investment is the face amount of the receivable increased or decreased by applicable accrued interest and unamortized 65
68 premium, discount, finance charges, or acquisition costs and may also reflect a previous direct write-down of the investment. A restructuring of a loan constitutes a troubled debt restructuring, also known as formally restructured, if the creditor for economic or legal reasons related to the debtor s financial difficulties grants a concession to the debtor that it would not otherwise consider. A concession is generally granted in order to minimize economic loss and avoid foreclosure. Concessions vary by program and are borrower-specific and may include interest rate reductions, term extensions, payment deferrals or the acceptance of additional collateral in lieu of payments. The post-modification outstanding recorded investment was higher than the pre-modification outstanding recorded investment, in certain segments, primarily due to the acceptance of additional collateral as well as capitalization of certain charges upon restructuring. As this table illustrates and as discussed above, Associations generally provide concessions which do not reduce the principal or interest to be collected. In limited circumstances, principal may be forgiven. When a restructured loan constitutes a troubled debt restructuring, these loans are included within our risk loans. All risk loans are analyzed within our allowance for loan losses. We record a specific allowance to reduce the carrying amount of the formally restructured loan to the lower of book value or net realizable value of collateral, if required. The following table presents information regarding troubled debt restructurings that occurred within the previous 12 months and for which there was a subsequent payment default during the year: (in thousands) Recorded Recorded Investment Investment As of December 31, Troubled debt restructurings that subsequently defaulted: Real estate mortgage $4,151 $18,949 Production and intermediate term 1,246 4,322 Agribusiness Rural residential real estate 508 1,224 Total $5,905 $24,577 At December 31, 2012, troubled debt restructurings outstanding at December 31, 2012 totaled $163.5 million, of which $117.9 million were in nonaccrual status. At December 31, 2011, troubled debt restructurings outstanding totaled $155.7 million of which $124.5 million were in nonaccrual status. Additional commitments to lend to borrowers whose loans have been modified in a troubled debt restructuring totaled $8.6 million and $2.9 million at December 31, 2012 and 2011, respectively. 66
69 Allowance for Loan Losses A summary of the allowance for loan losses follows: (in thousands) For the year ended December 31, Balance at beginning of year $300,508 $406,346 $386,002 Provision for loan losses 27,157 13, ,913 Charge-offs (82,951) (142,123) (189,920) Recoveries 18,216 22,648 20,351 Balance at end of period $262,930 $300,508 $406,346 AgriBank and affiliated Association management teams believe the allowances are adequate in relation to the probable losses in each portfolio as of December 31, The allowance for loan losses totaled $262.9 million at December 31, 2012 a decline from $300.5 million at December 31, The decline in the allowance for loan losses was primarily driven by net charge-offs of $64.7 million partially offset by provision expense of $27.1 million during The provision for credit losses reported in the Combined Statements of Comprehensive Income includes provision expense for unfunded commitments and unfunded letters of credit of $3.0 million and $3.8 million, respectively. The reserves for unfunded commitments and letters of credit are recorded as liabilities on the Combined Statements of Condition. 67
70 A summary of the changes in the allowance for loan losses and year end recorded investments of loans by loan type are as follows: (in thousands) Allowance for loan losses: Real estate mortgage Production and intermediate term Agribusiness Rural residential real estate Other Total Balance at December 31, 2011 $107,075 $124,448 $47,933 $12,789 $8,263 $300,508 Provision for (reversal of) loan losses 7,371 4,055 1,169 5,712 8,850 27,157 Charge-offs (28,538) (46,079) (1,036) (7,038) (260) (82,951) Recoveries 8,477 9, ,216 Balance at December 31, 2012 $94,385 $91,565 $48,434 $11,683 $16,863 $262,930 At December 31, 2012: Ending balance: individually evaluated for impairment $21,486 $31,696 $1,468 $1,936 $3,649 $60,235 Ending balance: collectively evaluated for impairment $72,899 $59,869 $46,966 $9,747 $13,214 $202,695 Recorded investments in loans outstanding: Ending balance at December 31, 2012 $44,253,293 $21,552,547 $6,429,017 $2,513,656 $3,087,834 $77,836,347 Ending balance for loans individually evaluated for impairment $464,864 $182,368 $43,574 $51,793 $24,296 $766,895 Ending balance for loans collectively evaluated for impairment $43,788,429 $21,370,179 $6,385,443 $2,461,863 $3,063,538 $77,069,452 (in thousands) Allowance for loan losses: Real estate mortgage Production and intermediate term Agribusiness Rural residential real estate Other Total Balance at December 31, 2010 $170,547 $145,748 $68,915 $12,999 $8,137 $406,346 Provision for (reversal of) loan losses (38,840) 85 30,320 5,485 16,587 13,637 Charge-offs (30,938) (33,922) (54,701) (6,044) (16,518) (142,123) Recoveries 6,306 12,537 3, ,648 Balance at December 31, 2011 $107,075 $124,448 $47,933 $12,789 $8,263 $300,508 At December 31, 2011: Ending balance: individually evaluated for impairment $25,423 $47,525 $17,853 $2,785 $1,955 $95,541 Ending balance: collectively evaluated for impairment $81,652 $76,923 $30,080 $10,004 $6,308 $204,967 Recorded investments in loans outstanding: Ending balance at December 31, 2011 $38,727,884 $19,718,627 $5,692,414 $2,328,160 $2,646,586 $69,113,671 Ending balance for loans individually evaluated for impairment $513,730 $254,114 $75,884 $59,653 $16,988 $920,369 Ending balance for loans collectively evaluated for impairment $38,214,154 $19,464,513 $5,616,530 $2,268,507 $2,629,598 $68,193,302 (in thousands) Allowance for loan losses: Real estate mortgage Production and intermediate term Agribusiness Rural residential real estate Other Total Balance at December 31, 2009 $115,249 $131,086 $123,054 $8,270 $8,343 $386,002 Provision for (reversal of) loan losses 112,718 89,290 (33,143) 13,304 7, ,913 Charge-offs (60,411) (84,104) (27,749) (8,798) (8,858) (189,920) Recoveries 2,991 9,476 6, ,351 Balance at December 31, 2010 $170,547 $145,748 $68,915 $12,999 $3,668 $406,346 At December 31, 2010: Ending balance: individually evaluated for impairment $30,647 $54,460 $25,394 $1,557 $2,819 $114,877 Ending balance: collectively evaluated for impairment $139,900 $91,288 $43,521 $11,442 $5,318 $291,469 Recorded investments in loans outstanding: Ending balance at December 31, 2010 $36,060,018 $18,604,238 $6,571,026 $2,212,672 $2,337,634 $65,785,588 Ending balance for loans individually evaluated for impairment $530,317 $313,636 $78,536 $49,805 $16,352 $988,646 Ending balance for loans collectively evaluated for impairment $35,529,701 $18,290,602 $6,492,490 $2,162,867 $2,321,282 $64,796,942 68
71 NOTE 4 Investment Securities and Federal Funds AgriBank Investment Securities and Federal Funds A summary of the amortized cost, unrealized gains and losses and fair value of investment securities and federal funds follows: (in thous ands) Weighted Amortized Unrealized Unrealized Fair Average As of December 31, 2012 Cost Gains Losses Value Yield Mortgage-backed securities $4,138,378 $47,366 $12,232 $4,173, % U.S. Treasury securities 3,186,053 4, ,190, % Commercial paper and other 2,856, ,856, % Federal funds 744, , % Asset-backed securities 559,342 5,398 23, , % U.S. Agencies 214,233 11, , % Total $11,698,895 $69,091 $36,125 $11,731, % (in thous ands) Weighted Amortized Unrealized Unrealized Fair Average As of December 31, 2011 Cost Gains Losses Value Yield Mortgage-backed securities $4,156,732 $33,316 $49,301 $4,140, % U.S. Treasury securities 2,924,353 8, ,933, % Commercial paper and other 2,123, ,123, % Federal funds 299, , % Asset-backed securities 284,500 3,633 58, , % U.S. Agencies 243,634 17, , % Total $10,032,918 $63,659 $108,030 $9,988, % (in thous ands) Weighted Amortized Unrealized Unrealized Fair Average As of December 31, 2010 Cost Gains Losses Value Yield Mortgage-backed securities $4,030,639 $31,651 $68,638 $3,993, % U.S. Treasury securities 3,093,539 4, ,097, % Commercial paper and other 2,324,050 1, ,325, % Federal funds 649, , % Asset-backed securities 286,563 1,808 63, , % U.S. Agencies 337,264 19, , % Total $10,721,271 $59,067 $133,230 $10,647, % Commercial paper and other is primarily corporate commercial paper, certificates of deposit and term federal funds. All securities are classified as available-for-sale. 69
72 A summary of the contractual maturity at fair value and weighted average yield by maturity of investment securities and federal funds follows: (in thousands) Year of Maturity One Year One to Five to More Than As of December 31, 2012 or Less Five Years Ten Years Ten Years Total Mortgage-backed securities $ -- $5,851 $155,934 $4,011,727 $4,173,512 U.S. Treasury securities 1,688,137 1,502, ,190,648 Commercial paper and other 2,856, ,856,563 Federal funds 744, ,548 Asset-backed securities ,535 4, , ,974 U.S. Agencies 115, , ,616 Total $5,404,639 $2,034,122 $160,660 $4,132,440 $11,731,861 Weighted average yield 0.6% 1.3% 0.8% 1.1% 0.9% Mortgage related securities totaling $120.7 million of housing related asset-backed securities and $4.0 billion of mortgage-backed securities have contractual maturities in excess of ten years at December 31, However, expected maturities differ from contractual maturities because borrowers may have the right to prepay these obligations. Proceeds from sales, realized gross gains and losses on sales and impairment losses on investment securities and federal funds are as follows: (in thousands) For the year ended December 31, Proceeds from sales $ -- $795,351 $15,056 Realized gross gains on sales ,577 Realized gross losses on sales Impairment losses 25,485 23,286 15,985 The proceeds from sales in 2011 are primarily related to the sale of certain U.S. Treasury securities maturing in the second half of AgriBank determined it was prudent to liquidate these securities during the resolution of the U.S. debt ceiling negotiations in In addition, in December 2011, AgriBank also sold investment securities, primarily certificates of deposit and commercial paper that had direct exposure to European financial institutions. The $7.6 million gain in 2010 resulted from the sale of previously impaired securities. AgriBank recorded $16.6 million of impairment expense in prior years on these securities. As of December 31, 2012, 2011 and 2010, AgriBank had not pledged any investment securities or federal funds as collateral. The ratings of the eligible investments held for maintaining a liquidity reserve, managing short-term surplus funds and managing interest rate risk must meet the applicable regulatory guidelines, which include requirements related to rating categories assigned by one or more Nationally Recognized Statistical Rating Organizations (NRSRO). These requirements vary by asset class but generally require at the time of purchase asset-backed and mortgage-backed securities to be rated the highest rating by one or more NRSRO and corporate debt and commercial paper to be rated at least the second highest rating by one or more NRSRO. To achieve the ratings, these securities generally have some or all of the following characteristics: a guarantee of timely payment of principal and interest; a credit enhancement achieved through over 70
73 collateralization; and the priority of payments of senior classes over junior classes. AgriBank performs analyses based on expected behavior of the loans, whereby these loan performance scenarios are applied against each security s credit-support structure to monitor credit-enhancement sufficiency to protect the investment. The model output includes projected cash flows, including any shortfalls in the capacity of the underlying collateral to fully return the original investment, plus accrued interest. Prior to January 1, 2013, if an investment security no longer met the credit rating criteria, the investment became ineligible. AgriBank was required to dispose of an investment that became ineligible within six months, unless the FCA approved, in writing, a plan that authorized AgriBank to divest over a longer period of time. At December 31, 2012, AgriBank had securities that, because the ratings were downgraded below AAA, were no longer eligible under the FCA regulations. The fair value of all ineligible investments totaled $321.1 million, including $189.1 million on which AgriBank has taken impairment charges. Of the securities ineligible under the FCA regulations, securities totaling $282.7 million have been approved by the FCA to hold beyond six months and are included in AgriBank s net collateral ratio. Securities with a fair value of $38.4 million were submitted to the FCA for approval in February Effective January 1, 2013, securities that become ineligible no longer require formal FCA approval to hold beyond six months and to include in the net collateral ratio, provided certain conditions are met, including the security having been eligible at the time it was purchased. 71
74 A summary of the investments in an unrealized loss position presented by the length of time that the investments have been in a continuous unrealized loss position follows: (in thousands) Less than 12 months More than 12 months Fair Unrealized Fair Unrealized As of December 31, 2012 Value Losses Value Losses Mortgage-backed securities $377,826 $1,096 $308,222 $11,136 U.S. Treasury securities 124, Commercial paper and other 665, Asset-backed securities 84, ,812 23,687 Total $1,253,213 $1,302 $428,034 $34,823 (in thousands) Less than 12 months More than 12 months Fair Unrealized Fair Unrealized As of December 31, 2011 Value Losses Value Losses Mortgage-backed securities $269,359 $381 $642,583 $48,920 U.S. Treasury securities 50, Commercial paper and other 1,272, Asset-backed securities 83, ,620 58,036 Total $1,676,493 $1,074 $783,203 $106,956 (in thousands) Less than 12 months More than 12 months Fair Unrealized Fair Unrealized As of December 31, 2010 Value Losses Value Losses Mortgage-backed securities $578,514 $5,635 $688,515 $63,003 U.S. Treasuries 353, Commercial paper and other 148, Asset-backed securities ,423 63,723 Total $1,080,551 $6,504 $907,938 $126,726 AgriBank evaluates its investment securities for other-than-temporary impairment (OTTI) on a quarterly basis. Factors considered in determining whether an impairment is other-than-temporary include: 1) the length of time and the extent to which the fair value is less than cost, 2) the financial condition and near-term prospects of the issuer and, if applicable, the financial condition of any financial guarantor, 3) the estimated cash flow projections compared to contractual cash flows and 4) AgriBank s intent to sell the impaired security and whether they are more likely than not to be required to sell the security before recovery. In addition, AgriBank qualitatively considers other available information when assessing whether impairment is other-than-temporary. Based on the results of these evaluations, if it is determined that the impairment is other-than-temporary, the loss is separated into credit-related and non-credit-related components. The credit-related component is recognized through earnings and the non-credit-related component is recognized in other comprehensive income or loss. The credit-related components of the other-than-temporary impairment losses were determined by projecting cash flows using cash flow models which require certain market assumptions. The significant inputs into the models include assumptions with regard to interest rates, prepayment speeds, default rates and loss severities. The assumptions are applied at the individual security and associated collateral pool level. Default rate assumptions are generally estimated using historical loss and performance information to estimate future defaults. Prepayment speed assumptions are based on historical prepayment rates. Loss severity assumptions are estimated based on underlying collateral type using research available from market research sources including broker/dealers and rating agencies as well as recent historical information. 72
75 The following are the assumptions used during the following periods: As of December 31, 2012: Assumptions Used Default rate by range 0.0% % 2.0% % Prepayment rate by range 0.8% % 2.0% % Loss severity by range 45.0% % 41.7% % As of December 31, 2011: Assumptions Used Default rate by range 0.0% % 0.0% % Prepayment rate by range 0.0% % 2.0% % Loss severity by range 45.0% % 44.5% % As of December 31, 2010: Assumptions Used Mortgagebacked Mortgagebacked Mortgagebacked Asset-backed securities Asset-backed securities Asset-backed securities Default rate by range 2.7% % 1.9% % Prepayment rate by range 0.0% % 2.0% % Loss severity by range 35.0% % 65.0% % The unrealized losses primarily reflect concerns about the creditworthiness and liquidity of home equity related asset-backed and non-agency mortgage-backed securities. AgriBank determined that securities with a fair value of $189.1 million at December 31, 2012 were in an other-than-temporary loss position compared to securities with a fair value of $162.2 million and $153.1 million at December 31, 2011 and 2010, respectively. As a result of its evaluations, AgriBank has recognized $25.5 million in net impairment losses during 2012, reflecting a gross impairment charge of $38.3 million, net of $12.8 million related to the non-credit component which was recognized in other comprehensive income. AgriBank has determined no other securities were in an other-thantemporary loss position at December 31, The following represents the activity related to the credit-loss component for investments that have been written down for other-than-temporary impairment that is recognized in earnings: (in thousands) For the the year ended December 31, Credit-loss component, beginning of year $103,680 $80,537 $72,129 Additions: Initial credit impairment 4,770 4,463 5,155 Subsequent credit impairments 20,715 18,823 10,830 Reductions: For securities sold ,577 For increases in expected cash flows Credit-loss component, end of year $129,162 $103,680 $80,537 73
76 Affiliated Association Investment Securities Investments held by certain affiliated Associations consisted of the following held-to-maturity investments: (in thousands) Weighted Amortized Unrealized Unrealized Fair Average As of December 31, 2012 Cost Gains Losses Value Yield Government guaranteed instruments $1,968,661 $21,922 $34,217 $1,956, % Farmer Mac mortgage-backed securities 302,650 5, , % ARC bonds % Venture capital equity investment 3,235 * * * * Total $2,275,266 $27,318 $34,329 $2,265, % (in thousands) Weighted Amortized Unrealized Unrealized Fair Average As of December 31, 2011 Cost Gains Losses Value Yield Government guaranteed instruments $1,915,583 $19,195 $36,578 $1,898, % Farmer Mac mortgage-backed securities 340,181 7, , % ARC bonds 1, , % Investment notes in a trust of equipment loans 3, , % Venture capital equity investment 1,885 * * * * Total $2,262,747 $26,591 $36,773 $2,250, % (in thousands) Weighted Amortized Unrealized Unrealized Fair Average As of December 31, 2010 Cost Gains Losses Value Yield Government guaranteed instruments $1,593,872 $19,721 $32,396 $1,581, % Farmer Mac mortgage-backed securities 386,935 7,136 1, , % Investment notes in a trust of equipment loans 13, , % ARC bonds 38,238 1, , % Venture capital equity investment 1,234 * * * * Total $2,033,809 $28,409 $34,487 $2,026, % * Not applicable due to the nature of the investment The investment portfolio is evaluated for other-than-temporary impairment. As a result of its evaluations, one affiliated Association has recognized $14 thousand and $570 thousand of impairment losses during 2012 and 2011, respectively. No securities were other-than-temporarily impaired in Other Earning Assets Other earning assets represent tobacco contracts receivable recorded by one affiliated Association and totaled $144.2 million, $210.9 million and $272.0 million at December 31, 2012, 2011 and 2010, respectively. As part of the Fair and Equitable Tobacco Reform Act of 2004, tobacco producers are to receive 10 years of equal payments under a contract with the Secretary of Agriculture. This affiliated Association entered into successorin-interest contracts with tobacco producers. Under these contracts, the affiliated Association paid the producer a lump sum and in return received the rights to the remaining contract payments. 74
77 NOTE 5 Premises and Equipment and Assets Held For Lease Premises and equipment consisted of the following: (in thousands) As of December 31, Land, buildings and improvements $392,479 $359,437 $316,070 Furniture, equipment and software 236, , ,580 Accumulated depreciation (268,493) (248,848) (231,364) Net premises and equipment $360,464 $331,019 $290,286 Certain affiliated Associations hold property for the purpose of agricultural leasing, primarily consisting of facilities and farm equipment. Net operating lease income was $18.2 million, $20.1 million and $19.9 million in 2012, 2011 and 2010, respectively. Assets held for lease, net totaled $505.0 million, $441.5 million and $406.5 million at December 31, 2012, 2011 and 2010, respectively. The following is a schedule of expected future minimum payments to be received on noncancelable operating leases as of December 31, 2012: (in thousands) For the year ending December 31, 2013 $103, , , , ,527 Subsequent years 22,466 Total minimum future rentals $362,759 NOTE 6 Other Assets A summary of other assets follows: (in thousands) As of December 31, Accounts receivable $50,048 $74,298 $63,933 Prepaid income taxes 23,230 21,270 19,721 Prepaid expenses 11,615 11,919 14,111 Other 23,911 24,365 24,810 Total other assets $108,804 $131,852 $122,575 75
78 NOTE 7 Bonds and Notes The Farm Credit System obtains funds for its lending operations primarily from the sale of Systemwide debt securities issued by the Farm Credit System Banks through the Federal Farm Credit Banks Funding Corporation. Systemwide bonds and discount notes are joint and several obligations of the Farm Credit System Banks (refer to Note 15). Our participation in bonds and notes follows: (in thousands) As of December 31, Systemwide obligations: Bonds $72,151,943 $65,148,797 $62,180,822 Discount notes 4,198,304 2,520,635 3,637,312 Member investment bonds 785, , ,316 Total $77,135,855 $68,262,968 $66,179,450 The maturities and weighted average interest rate of bonds and notes were as follows: (in thousands) Systemwide Obligations Member investment As of December 31, 2012 Bonds Discount notes bonds Total Year of maturity Amount Rate Amount Rate Amount Rate Amount Rate 2012 $19,434, % $4,198, % $785, % $24,418, % ,677, % ,677, % ,069, % ,069, % ,315, % ,315, % ,060, % ,060, % 2017 and thereafter 12,595, % ,595, % Total $72,151, % $4,198, % $785, % $77,135, % Discount notes are issued with maturities ranging from 1 to 365 days. The average maturity of discount notes at December 31, 2012 was 49 days. 76
79 Callable debt may be called on the first call date and generally is continuously callable thereafter. Systemwide bonds and notes with call options are as follows: (in millions) Maturing Callable As of December 31, 2012 Amount Amount Year of maturity / next call: 2013 $125 $25, , , , , , , Thereafter 8, Total $25,739 $25,739 Participation in Systemwide Debt Securities Certain conditions must be met before Farm Credit System Banks can participate in the issuance of Systemwide debt securities. As one condition of participation, Farm Credit System Banks are required by the Farm Credit Act and the FCA regulation to maintain specified eligible assets, at least equal in value to the total amount of debt securities outstanding for which they are primarily liable. This requirement does not provide holders of Systemwide debt securities or bank bonds with a security interest in any assets of the Farm Credit System Banks. However, Farm Credit System Banks and the Federal Farm Credit Banks Funding Corporation have entered into a Market Access Agreement, which established criteria and procedures for the Farm Credit System Banks to provide certain information to the Federal Farm Credit Banks Funding Corporation and, under certain circumstances, for restricting or prohibiting an individual Farm Credit System Bank s participation in Systemwide debt issuances. At December 31, 2012 AgriBank was, and as of the date of this report remains, in compliance with the conditions of participation in the issuance of Systemwide debt securities. As discussed in Note 15, only Farm Credit System Banks are statutorily liable for the payment of principal and interest on Systemwide bonds and notes. Refer to Note 21 for AgriBank-only financial data. Member Investment Bonds Member investment bonds are an alternative source of funding in which AgriBank sells bonds directly to District members and employees. Member investment bonds are specifically authorized by the Farm Credit Act and have been issued by Farm Credit System Banks from time to time for many years. Member investment bonds issued by AgriBank are offered primarily through the Farm Cash Management program, which links an Association members revolving line of credit with an AgriBank investment bond to optimize the member s use of their funds. Member investment bonds are an unsecured obligation of AgriBank and are not insured or guaranteed by any other entity. Insurance Fund The Farm Credit Insurance Fund (Insurance Fund) is available to insure the timely payment of principal and interest on consolidated bonds and notes of Farm Credit System Banks to the extent net assets are available in the Insurance Fund. At December 31, 2012, the assets of the Insurance Fund were $3.3 billion; however, due to the other authorized uses of the Insurance Fund, there is no assurance that the amounts in the Insurance Fund will be sufficient to fund the timely payment of principal, or interest on, insured debt securities in the event of default by any Farm Credit System Bank having primary liability for repayment of the debt. Each Farm Credit System Bank has been required to pay premiums into the Insurance Fund until the assets in the Insurance Fund equal 2% of the aggregated insured obligations adjusted to reflect the reduced risk on loans or 77
80 investments guaranteed by federal or state governments. When the Insurance Fund exceeds the required 2%, the Farm Credit System Insurance Corporation transfers excess funds to Allocated Insurance Reserve Accounts (AIRAs). In 2012 and 2010, we received $79.1 million and $71.2 million, respectively, as our share of distributions from AIRAs. Included in the $79.1 million and $71.2 million was $5.5 million and $5.1 million in 2012 and 2010, respectively, related to an interest in Farm Credit System Financial Assistance Corporation (FAC) stock. In prior years, AgriBank purchased all Farm Credit System FAC stock held by certain affiliated Associations. Legislation in 1987 had required certain Associations to purchase stock to capitalize the Farm Credit System FAC. There were no distributions in Debt Transfers During 2012, 2011 and 2010, AgriBank transferred $10.0 million, $15.0 million and $165.0 million, respectively, of debt to other Farm Credit System Banks to restructure liabilities. These transfers resulted in $0.8 million, $0.3 million and $10.6 million, respectively, of losses on debt extinguishment, and are reflected within the Noninterest expense section of the Combined Statements of Comprehensive Income. These transactions are for asset/liability rebalancing purposes reflecting the volume of all debt transfers occurring at fair value. These losses were more than offset by the prepayment and conversion fees collected. Short-term Borrowings We use short-term borrowings as a source of funds. The following reflects short-term borrowings by category: (in thousands) Weighted Weighted Weighted Average Average Average Amount Interest Rate Amount Interest Rate Amount Interest Rate Systemwide discount notes: Outstanding as of December 31 $4,198, % $2,520, % $3,637, % Average during year 3,445, % 2,812, % 2,759, % Maximum month-end balance during year 4,227,686 3,179,348 3,655,979 Systemwide bonds: (*) Outstanding as of December 31 3,938, % 916, % 3,145, % Average during year 1,961, % 2,295, % 4,053, % Maximum month-end balance during year 3,938,174 3,880,614 5,420,742 * Represents bonds issued with an original maturity of one year or less. NOTE 8 Subordinated Notes In March 2010, an affiliated Association issued $100 million of unsecured subordinated notes due in 15 years with a fixed rate of 9.0% per annum, payable semi-annually. At December 31, 2012, the ending balance was $100 million and the year-to-date average daily balance for 2012 was $100 million. The Association may redeem all or some of the notes at any time on or after a date 10 years from the closing date. These notes are unsecured and subordinate to all other categories of creditors, including general creditors, and senior to all classes of shareholders. These notes are included in the Association s permanent capital and total surplus regulatory capital ratios subject to limitations. In July 2009, AgriBank issued $500 million of 9.125% unsecured subordinated notes due At December 31, 2012, the ending balance was $500 million and the year-to-date average daily balance was $500 million. These 78
81 notes are unsecured and subordinate to all other categories of creditors, including general creditors, and senior to all classes of shareholders. Interest is payable semi-annually on January 15 and July 15 beginning on January 15, Interest is deferred if, as of the fifth business day prior to an interest payment date of the notes, any applicable minimum regulatory capital ratios are not satisfied. A deferral period may not last for more than five consecutive years or beyond the maturity date of the subordinated notes. During such a period, AgriBank may not declare or pay any dividends or patronage refunds, among certain other restrictions, until interest payments are resumed and all deferred interest has been paid. AgriBank has not deferred any interest since issuing subordinated notes. The subordinated notes are not Systemwide debt securities and are not obligations of any of the other Farm Credit System Banks. Payments on the subordinated notes are not insured by the Insurance Fund. The inclusion of subordinated notes in regulatory capital ratios is subject to certain limitations. The amount of subordinated notes eligible to be counted as permanent capital and total surplus may not exceed 50% of core surplus, and is reduced by 20% of the original amount at the beginning of each of the last five years of the term of the notes. Additionally, the amount of subordinated notes that may be counted in total surplus must not exceed the lower of 40% of permanent capital or 100% of core surplus. Subordinated notes that are not included in permanent capital and total surplus due to these limitations are required to be included as liabilities for the purpose of calculating AgriBank s net collateral ratio. Refer to Note 10 for further discussion. NOTE 9 Other Liabilities A summary of other liabilities follows: (in thousands) As of December 31, Escrow liability $54,612 $67,895 $56,552 Accrued salaries 48,025 39,994 40,028 Reserve for unfunded commitment 13,000 10, Other 114,058 90,536 53,794 Total other liabilities $229,695 $208,425 $150,374 NOTE 10 Members Equity Capitalization Requirements In accordance with the Farm Credit Act, each borrower is required to invest in capital stock (in the case of agricultural loans) or participation certificates (in the case of rural residence, farm related business or leases) of the respective Association as a condition of borrowing. The initial investment requirement varies by Association and ranges from the statutory minimum of 2.0% of the loan amount or one thousand dollars per borrower, whichever is less, to 5.0% of the loan amount. In addition, the Associations generally require the purchase of one participation certificate by each lease customer and non-stockholder customers who purchase financial services. Each Association s Board of Directors may increase, within the range outlined in their bylaws, the amount of initial investment, if necessary, to meet the Associations capital needs. 79
82 OFIs, as a condition of obtaining a loan from AgriBank, are required to hold Series A Participation Certificates in an amount determined by AgriBank s capital plan, currently equal to 2.5% of their loan commitment plus an additional 1.0% on increases in their commitments that exceeded a targeted rate. AgriBank s bylaws permit increasing the investment up to 4.0% with Board approval. A borrower normally acquires ownership of capital stock at the time a loan is made. Generally, the aggregate par value of the stock is added to the principal amount of the related loan transaction. A first lien is held on the stock or participation certificates owned by the borrowers. Protection Mechanisms Protection of certain borrower capital is provided under the Farm Credit Act which requires us to retire protected capital at par or stated value regardless of its book value. Protected borrower capital includes capital stock, participation certificates and allocated equities that were outstanding at January 6, 1988 or were issued or allocated before October 6, Borrower stock issued after October 5, 1988 is not subject to these protection provisions. If we are unable to retire protected borrower equity at par value or stated value, amounts required to retire this equity would be obtained from the Insurance Fund. Regulatory Capitalization Requirements and Restrictions The FCA s capital adequacy regulations require each institution to maintain certain minimum capital ratios. We are prohibited from reducing capital by retiring stock or making certain other distributions to shareholders unless prescribed capital standards are met. No such prohibitions were in effect as of December 31, 2012 and management does not foresee any events that would result in this prohibition during Under capital adequacy regulations, AgriBank and each Association are required to maintain a permanent capital ratio of at least 7.0%, a total surplus ratio of at least 7.0% and a core surplus ratio of at least 3.5%. These ratios are calculated in accordance with the FCA regulations and are discussed below: The permanent capital ratio, which is quarterly average permanent capital (generally members equity and subordinated notes subject to certain limitations) as a percentage of quarterly average riskadjusted assets. AgriBank s ratio was 21.1% at December 31, 2012; Association ratios ranged from 13.2% to 23.2%, with a weighted average of 15.3%. The total surplus ratio, which is quarterly average total surplus (generally unallocated surplus, subordinated notes subject to certain limitations, and allocated stock) as a percentage of quarterly average risk-adjusted assets. AgriBank s ratio was 17.4% at December 31, 2012; Association ratios ranged from 12.9% to 20.3%, with a weighted average of 14.9%. The core surplus ratio, which is quarterly average core surplus (generally unallocated surplus) as a percentage of quarterly average risk-adjusted assets. AgriBank s ratio was 10.4% at December 31, 2012; Association ratios ranged from 10.9% to 20.3%, with a weighted average of 14.7%. As noted above, the inclusion of subordinated notes in regulatory capital ratios is subject to certain limitations. The amount of subordinated notes eligible to be counted as permanent capital and total surplus may not exceed 50% of core surplus, and is reduced by 20% of the original amount at the beginning of each of the last five years of the term of the notes. Additionally, the amount of subordinated notes that may be counted in total surplus must not exceed the lower of 40% of permanent capital or 100% of core surplus. Subordinated notes that are not included in permanent capital and total surplus due to these limitations are required to be included as liabilities for the purpose of calculating our net collateral ratio. The FCA regulations require Associations and Farm Credit System Banks to agree upon a plan for allocating the Associations investments in Farm Credit System Banks for calculation of regulatory capital ratios. For the 80
83 calculation of regulatory capital ratios at December 31, 2012, AgriBank s agreement with the Associations is generally that each Association would count in its ratios any excess allocated investment over that required by AgriBank unless there is a specific agreement to count the investments differently. During 2010 and 2009, one Association had an agreement with AgriBank to count $61.0 million of otherwise required investment in their regulatory capital ratios. This agreement expired January 1, The FCA regulations also require AgriBank to maintain a net collateral ratio of at least 103.0%. However, AgriBank is required by the FCA to maintain a higher minimum of 104.0% during the period in which AgriBank has subordinated notes outstanding. The net collateral ratio is the value of collateral (generally net loans and investments) less an amount equal to that portion of the allocated investments of affiliated Associations that is not counted as permanent capital by AgriBank, divided by total liabilities as adjusted to exclude subordinated notes (subject to certain limitations) and the fair value of certain derivatives. At December 31, 2012, AgriBank s net collateral ratio was 106.0%. Description of Equities The following represents information regarding classes and number of shares of stock and participation certificates outstanding. All shares and participation certificates are $5.00 par value. As of December 31, (in whole numbers) Number Number Number of Shares of Shares of Shares Protected nonvoting common stock 2,335 15,599 19,383 Protected voting common stock 10, , ,647 At-risk voting common stock 42,898,899 42,841,581 40,676,123 At-risk nonvoting common stock 216, , ,731 Protected participation certificates 48,669 50,188 53,095 At-risk participation certificates 9,248,400 8,890, ,028 Substantially all District entities bylaws authorize additional classes of stock, including preferred stock; however, no such stock had been issued as of December 31, AgriBank has an authorized class of preferred stock which may be issued to investors within and outside the Farm Credit System in accordance with applicable rules of offering. This stock would be non-voting and may bear dividends. There are 800,000 shares authorized and none outstanding at December 31, In January 2013, AgriBank s Board approved the issuance of $400 million of preferred stock pending approval by affiliated Associations and OFIs, which was received in February AgriBank is awaiting approval from the FCA. This stock would have a par value of $100 per share and can only be transferred in allotments of not less than $25 thousand to other investors meeting the eligibility requirements. At-risk stock and participation certificates, which include all equities issued on or after October 6, 1988, may be retired only at the discretion of the Boards of Directors. Such equities are retired at the lower of book value or par value. The bylaws of the Associations generally permit stock and participation certificates to be retired at the discretion of the Board of Directors in accordance with the Associations' capitalization plan provided prescribed capital standards have been met. At December 31, 2012, all Associations exceeded these prescribed standards. Management at the Associations does not anticipate any significant changes in capital that would impact the normal retirement of stock. 81
84 Stock preference upon liquidation or impairment follows the respective entities bylaws; however, protected stock will be retired at par value regardless of impairment. Each holder of voting common stock is entitled to a single vote in matters affecting their respective Association. Holders of nonvoting common stock and participation certificates have no voting rights. Stock is transferable to other borrowers eligible to own such stock as long as allowed for in the bylaws of the District institutions, provided that the regulatory minimum capital requirements are met. Patronage Distributions and Dividends Payment of patronage and/or dividends is generally allowed under Association bylaws if the distribution is in accordance with applicable laws and regulations, including the FCA capital adequacy regulations. Affiliated Associations designated $208.6 million, $199.1 million and $174.8 million of earnings during 2012, 2011 and 2010, respectively. In response to adverse weather conditions and the impact on Wisconsin farm families, a special, one-time patronage distribution of $5.2 million was paid in cash in October 2012 by one affiliated Association. Additionally, one affiliated Association has a nonqualified patronage program that allocated surplus of $55.0 million, $40.0 million and $36.4 million in 2012, 2011 and 2010, respectively. Nonqualified patronage of $42.7 million, $14.5 million and $1.3 million was redeemed during 2012, 2011 and 2010, respectively. Certain affiliated Associations attribute to shareholders all income in excess of the qualified patronage program. It is communicated to shareholders that this amount will not be redeemed and as such, is not considered allocated surplus. AgriBank also pays patronage, substantially all of which was eliminated in combination except $1.6 million at December 31, 2012 and $1.4 million at December 31, 2011 and 2010, respectively, to OFIs. Noncontrolling Interest The noncontrolling interest represents the equity investment of Associations outside the AgriBank District in AgDirect LLP and FCF, as described more fully in Note 2. 82
85 NOTE 11 Income Taxes Provision for Income Taxes The provision for income taxes consisted of the following: (in thousands) For the year ended December 31, Current: Federal $13,970 $32,200 $31,674 State 4,836 6,907 4,939 Total current 18,806 39,107 36,613 Deferred: Federal 19,976 16,771 14,972 State 1, Decrease in valuation allowances (878) (1,080) (752) Total deferred 20,310 16,619 14,288 Total provision for income taxes $39,116 $55,726 $50,901 The following table quantifies the differences between the provision for income tax and income taxes at the federal statutory rate. (in thousands) For the year ended December 31, Federal tax at statutory rate $597,892 $542,477 $505,911 State tax, net 3,555 4,618 3,930 Effect of non-taxable entities (489,378) (431,243) (401,831) Patronage distributions (64,854) (55,022) (48,544) Decrease in valuation allowances (878) (1,080) (752) Other, net (7,221) (4,024) (7,813) Total provision for income taxes $39,116 $55,726 $50,901 The difference in the statutory tax rate and the effective tax rate was primarily due to the tax exemption of AgriBank and the FLCA subsidiary earnings and to a lesser extent patronage distributions. 83
86 Deferred Income Taxes Tax laws require certain items to be included in our tax returns at different times than the items are reflected on our Combined Statements of Other Comprehensive Income. Some of these items are temporary differences that will reverse over time. We record the tax effect of temporary differences as deferred tax assets and liabilities netted on our Combined Statements of Condition. Deferred tax assets and liabilities were composed of the following: (in thousands) As of December 31, Allowance for loan losses $39,584 $42,944 $49,967 Post-employment benefits accrual 5,840 5,992 5,751 Accrued pension asset (8,739) (8,771) (11,728) Leasing related, net (165,717) (150,509) (118,490) Accrued patronage income not received (4,702) (5,119) (8,772) AgriBank 2002 allocated stock (10,296) (10,254) (10,098) Depreciation (2,751) (2,635) (2,118) Valuation allowance (17,805) (18,683) (19,764) Net operating loss carryforwards 11,487 18,980 9,871 Other assets 21,359 16,659 10,227 Other liabilities (2,562) (2,596) (2,218) Net deferred tax liabilities ($134,302) ($113,992) ($97,372) Gross deferred: Tax assets $60,465 $66,495 $57,106 Tax liabilities (194,767) (180,487) (154,478) Deferred tax assets and liabilities are presented on the Combined Statements of Condition as $10.9 million of net deferred tax assets, representing the amount of deferred tax assets for affiliated Associations in a deferred tax asset position and $145.2 million of deferred tax liabilities, representing the amount of deferred tax liabilities for affiliated Associations in a deferred tax liability position at December 31, Deferred income taxes have not been provided by the PCAs and ACAs on approximately $525.3 million of patronage distributions allocated from AgriBank before January 1, Such allocations, distributed in the form of stock, are subject to income tax only upon conversion to cash. Associations management intent is to permanently maintain these investments in AgriBank. Additionally, deferred income taxes have not been provided by certain Associations on approximately $6.6 million of 2002 patronage allocations received from AgriBank. Those Associations Boards of Directors passed resolutions that, should this stock ever be converted to cash, creating a tax liability, an equal amount will be distributed to patrons at that time under the Associations patronage programs. Deferred income taxes have also not been provided on accumulated FLCA subsidiary earnings of $10.0 billion as it is the intention of the ACAs management to permanently maintain their investments in the FLCA subsidiaries or to distribute the earnings to members in a manner that results in no additional tax liability to the Associations. AgriBank has no plans to distribute unallocated AgriBank earnings and does not contemplate circumstances under which if distributions were made, additional income tax liabilities at the Association level would result. Therefore, deferred taxes have not been provided on AgriBank's post-1992 unallocated earnings. Our income tax returns are subject to review by various U.S. taxing authorities. We record accruals for items that we believe may be challenged by these taxing authorizes. However, we had no uncertain income tax positions at 84
87 December 31, In addition, we believe we are no longer subject to income tax examinations for years prior to Tax Related Matters At various times, Associations receive assessment letters from the IRS as a result of audits of prior year tax returns. There are no material assessments outstanding at December 31, NOTE 12 Employee Benefit Plans The Farm Credit Foundations Coordinating Committee and Trust Committees provide consideration and oversight of the benefit plans. The governance committees are either elected or appointed representatives (senior leadership and/or Board of Director members) from the participating organizations. The Coordinating Committee is responsible for decisions regarding benefits at the direction of the participating employers. The Trust Committee is responsible for fiduciary and plan administrative functions. Pension Benefit Plans Pension Plan: AgriBank and all affiliated Associations with the exception of one affiliated Association participate in the AgriBank District Retirement Plan, a District-wide multi-employer defined benefit retirement plan. The Department of Labor has determined the plan to be a governmental plan; therefore, the plan is not subject to the provisions of the Employee Retirement Income Security Act of 1974, as amended (ERISA). As the plan is not subject to ERISA, the plan s benefits are not insured by the Pension Benefit Guaranty Corporation. Accordingly, the amount of accumulated benefits that participants would receive in the event of the plan s termination is contingent on the sufficiency of the plan s net assets to provide benefits at that time. This Plan is noncontributory and covers eligible District employees. The assets, liabilities and costs of the plan are not segregated by participating entities. As such, plan assets are available for any of the participating employers retirees at any point in time. Additionally, if a participating employer stops contributing to the plan, the unfunded obligations of the plan may be borne by the remaining participating employers. Further, if a participating entity chooses to stop participating in the plan, the entity may be required to pay an amount based on the underfunded status of the plan, referred to as a withdrawal liability. Because of the multiemployer nature of the plan, any individual employer is not able to unilaterally change the provisions of the plan. If an employee moves to another employer within the same plan, the employee benefits under the plan transfer. Benefits are based on salary and years of service. There is no collective bargaining agreement in place as part of this plan. The defined benefit pension plan reflects a District-wide unfunded liability totaling $442.6 million at December 31, The pension benefits funding status reflects the net of the fair value of the plan assets and the projected benefit obligation at the date of these financial statements. The projected benefit obligation is the actuarial present value of all benefits attributed by the pension benefit formula to employee service rendered prior to the measurement date based on assumed future compensation levels. The projected benefit obligation of the District-wide plan was $1.1 billion, $934.8 million and $834.2 million at December 31, 2012, 2011 and 2010, respectively. The fair value of the plan assets was $640.1 million, $557.6 million and $573.0 million at December 31, 2012, 2011 and 2010, respectively. The amount of the pension benefits funding status is subject to many variables including performance of plan assets and interest rate levels. Therefore, changes in assumptions could significantly affect these estimates. 85
88 Costs are determined for each individual employer based on costs directly related to their current employees as well as an allocation of the remaining costs based proportionately on the estimated projected liability of the employer under this plan. Total plan expense for participating employers was $52.7 million, $44.0 million and $37.0 million for 2012, 2011 and 2010, respectively. Participating employers contributed $51.3 million, $27.9 million and $25.3 million to the plan in 2012, 2011 and 2010, respectively. While the plan is a governmental plan and is not subject to minimum funding requirements, the employers contribute amounts necessary on an actuarial basis to provide the plan with sufficient assets to meet the benefits to be paid to participants. The amount of the total District employer contributions expected to be paid into the pension plan during 2013 is $57.2 million. The amount ultimately to be contributed and the amount ultimately recognized as expense as well as the timing of those contributions and expenses, are subject to many variables including performance of plan assets and interest rate levels. These variables could result in actual contributions and expenses being greater than or less than the amounts reflected in the District financial statements. Nonqualified Retirement Plan: AgriBank and certain affiliated Associations participate in a District-wide nonqualified defined benefit Pension Restoration Plan. This plan restores retirement benefits to certain highly compensated eligible employees that would have been provided under the qualified plan if such benefits were not above the Internal Revenue Code compensation or other limits. Costs are determined for each individual employer based on costs directly related to their current employees. Pension Restoration plan expenses included in Salaries and employee benefits in the Combined Statements of Comprehensive Income were $2.4 million, $2.5 million and $1.7 million for 2012, 2011 and 2010, respectively. The Pension Restoration Plan is unfunded and participating employers make annual contributions to fund benefits paid to their retirees covered by the plan. Our cash contributions were $1.0 million for 2012 and $0.5 million each year for 2011 and 2010, respectively. Other Post-Employment Benefit Plans Retiree Medical Plans: District employers provide certain health insurance benefits to eligible retired employees according to the terms of those benefit plans. The anticipated costs of these benefits are accrued during the period of the employee s active status. Post-employment benefits included in Salaries and employee benefits in the Combined Statements of Comprehensive Income were $1.1 million for 2012 and $1.4 million and $1.5 million for 2011 and Retirement Savings Plan AgriBank and all affiliated Associations also participate in a retirement savings plan. For employees hired before January 1, 2007, employee contributions are matched dollar for dollar up to 2% and 50 cents on the dollar on the next 4% on both pre-tax and post-tax contributions. The maximum employer match is 4%. For employees hired after December 31, 2006, we contribute 3% of the employee s compensation and will match employee contributions dollar for dollar up to a maximum of 6% on both pre-tax and post-tax contributions. The maximum employer contribution is 9%. In addition, one affiliated Association has a profit sharing component as part of the retirement savings plan. Employer contributions and expenses are included in Salaries and employee benefits in the Combined Statements of Comprehensive Income under the plan and were $26.5 million, $23.4 million and $21.3 million in 2012, 2011 and 2010, respectively. These expenses are equal to our cash contributions for each year. 86
89 Obligations and Funded Status The funded status of the District s post-employment benefit plans follows: (in thousands) As of December 31, 2012 Pension Benefits Other Benefits Change in benefit obligation Benefit obligation at beginning of year $951,377 $849,537 $758,938 $30,618 $30,686 $28,926 Service cost 26,032 24,089 21, Interest cost 46,044 44,174 42,818 1,465 1,588 1,623 Plan amendments (221) -- Actuarial loss (gain) 129,370 75,624 57,534 2,294 (546) 1,052 Benefits paid (46,841) (42,047) (31,136) (1,493) (1,539) (1,530) Benefit obligation at end of year $1,106,122 $951,377 $849,537 $33,443 $30,618 $30,686 Change in plan assets Fair value of plan assets at beginning of year $557,600 $573,038 $519,102 $ -- $ -- $ -- Actual return on plan assets 76,926 (1,824) 59, Employer contributions 52,377 28,433 25,815 1,493 1,539 1,530 Benefits, premiums and expenses paid (46,841) (42,047) (31,136) (1,493) (1,539) (1,530) Fair value of plan assets at end of year $640,062 $557,600 $573,038 $ -- $ -- $ -- Funded status $(466,060) $(393,777) $(276,499) $(33,443) $(30,618) $(30,686) (in thousands) Pension Benefits Other Benefits As of December 31, Amounts recognized in the statement of condition consist of: Pension asset $ -- $ -- $ -- $ -- $ -- $ -- Pension liabilities 466, , ,499 33,443 30,618 30,686 Net amount recognized $(466,060) $(393,777) $(276,499) $(33,443) $(30,618) $(30,686) Amounts recognized in accumulated other comprehensive income consist of: Net loss (gain) $531,512 $463,262 $365,129 ($2,752) ($5,476) ($4,819) Prior service credit (7,059) (8,318) (9,373) (2,704) (3,397) (3,800) Total recognized in other comprehensive income $524,453 $454,944 $355,756 $(5,456) $(8,873) $(8,619) Weighted-average assumptions used to determine benefit obligations Discount rate 4.15% 4.95% 5.35% 4.15% 4.95% 5.35% Expected return on plan assets 8.00% 8.00% 8.25% n/a n/a n/a Rate of compensation increase 4.50% 4.50% 4.50% n/a n/a n/a The pension benefits funding status reflects the status based on the projected benefit obligation, which is the actuarial present value of all benefits attributed by the pension benefit formula to employee service rendered prior to the measurement date based on assumed future compensation levels. The accumulated benefit obligation, which is the actuarial present value of benefits attributed to employee service rendered before the measurement date and based on current employee service and compensation, exceeds pension plan assets. The accumulated benefit obligation for the pension plan was $925.7 million, $801.6 million and $724.1 million at December 31, 2012, 2011 and 2010, respectively. 87
90 Components of Net Periodic Benefit Cost District net periodic post-employment benefit costs included the following components: (in thousands) For the year ended December 31, Pension Benefits Other Benefits Net periodic benefit cost Service cost $26,032 $24,089 $21,383 $559 $650 $615 Interest cost 46,044 44,174 42,818 1,465 1,588 1,623 Expected return on plan assets (47,177) (47,718) (45,994) Amortization of prior service cost (1,119) (1,056) (1,036) (695) (624) (624) Recognized net actuarial loss (gain) 31,370 27,033 21,548 (222) (197) (135) Net periodic benefit cost $55,150 $46,522 $38,719 $1,107 $1,417 $1,479 Other changes in plan assets and benefit obligations recognized in other comprehensive income Net loss (gain) $99,621 $125,164 $44,272 $2,500 $(854) $1,191 Prior service credit on plan amendments (221) -- Amortization of prior service benefit 1,119 1,056 1, Amortization of net (gain) loss (31,370) (27,033) (21,548) Total recognized in other comprehensive income $69,510 $99,187 $23,760 $3,417 $(254) $1,950 Total recognized in net periodic benefit cost and other comprehensive income $124,660 $145,709 $62,479 $4,524 $1,163 $3,429 Weighted-average assumptions used to determine net costs Discount rate 4.95% 5.35% 5.80% 4.95% 5.35% 5.80% Expected return on plan assets 8.00% 8.25% 8.25% n/a n/a n/a Rate of compensation increase 4.50% 4.50% 4.50% n/a n/a n/a The estimated net loss and prior service credit for the Pension Benefits plans that will be amortized from District accumulated other comprehensive income into net periodic benefit cost over the next year is an expense of $42.1 million. The estimated net gain and prior service credit for the Other Benefits plan that will be amortized from District accumulated other comprehensive income into net periodic benefit cost over the next year is income of $695 thousand. Future Cash Flows The amount of total District employer contributions expected to be paid into the plans during 2013 is $58.7 million for pension benefits and $1.8 million for other post-employment benefits. 88
91 The following benefit payments are expected to be paid by the District plans and reflect expected future service, as appropriate: (in thousands) Pension Other As of December 31, 2012 Benefits Benefits Year: 2013 $46,030 $1, ,890 1, ,670 1, ,030 2, ,090 2, to ,820 11,008 Assumed Health Care Cost Trend Rates For measurement purposes, a 7.5% rate of increase in the per capita cost of covered health care benefits is assumed for The rate is assumed to decrease gradually to 5.0% by the year 2018 and remain at that level thereafter. Assumed health care cost trend rates have a significant effect on the amounts reported for the health care plans. A one-percentage-point change in assumed health care cost trend rates would have the following effects for the District: (in thousands) As of December 31, % Increase 1% Decrease Plan Assets Effect on total of service and interest cost components $22 ($20) Effect on accumulated postretirement benefit obligation 526 (476) The funding objective of the plans is to provide present and future retirement or survivor benefits for its members by achieving an attractive rate of return, as defined by the plans policy statements, without exposing the plan to undue risk. The Trust Committee supervises the investment assets of the plans on behalf of the employers. The Trustees adopt an asset allocation strategy for each plan that reflects return and risk objectives, plan liabilities and other factors. The Trustees employ a total return investment approach whereby a mix of equities, fixed income and real estate investments are used to maximize the long-term return of plan assets for a prudent level of risk. The intent of this strategy is to minimize plan expenses by outperforming plan liabilities over the long run. Risk tolerance is established through careful consideration of plan liabilities, plan funded status and the participating entities financial conditions. The investment portfolio contains a diversified blend of equity and fixed income investments. Furthermore, equity investments are diversified across U.S. and non-u.s. stocks as well as growth, value, small, mid and large capitalizations. Other investment strategies may be employed to gain certain market exposures, reduce portfolio risk and to further diversify portfolio assets. Investment risk is measured and monitored on an ongoing basis through annual liability measurements, periodic asset/liability studies and monthly and quarterly investment portfolio reviews. The Trustees have developed an asset allocation policy based on plan objectives, characteristics of pension liabilities, capital market expectations and asset-liability projections. The policy is long-term oriented and consistent with the risk exposure. The Trustees review the asset mixes periodically and regularly monitor the 89
92 portfolios to maintain compliance with pre-established strategic allocation ranges. The current asset allocation policy of the pension plan is a target of 70% of assets in equity securities, 25% in debt securities and 5% in real estate. The expected long-term rate of return assumption is determined by the Coordinating Committee with input from the Trust Committee. Historical return information is used to establish a best-estimate range for each asset class in which the plans are invested. The most appropriate rate is selected from the best-estimate range, taking into consideration the duration of plan benefit liabilities and Coordinating Committee investment policies. The fair values of the District s pension plan assets by asset category are as follows: (in thousands) Fair Value Measurements as of December 31, 2012 Level 1 Level 2 Level 3 Total Assets: Cash and cash equivalents $10,208 $ -- $ -- $10,208 Mutual funds: International funds 112, ,222 Bond funds , ,915 Real estate equity funds -- 29, ,107 Hedged equity funds ,087 14,087 Investment insurance contracts ,814 7,814 Trust funds: Domestic funds , ,871 Bond funds -- 52, ,047 Limited partnerships ,791 40,791 Total $122,430 $454,940 $62,692 $640,062 Hedged Equity Funds Fair Value Measurements using Level 3 Investment Insurance Contracts Limited Partnerships Total Beginning balance $13,796 $8,369 $37,973 $60,138 Actual return on plan assets: Still held at the reporting date ,818 3,319 Sales -- (765) -- (765) Transfers in (out) of Level Ending balance $14,087 $7,814 $40,791 $62,692 90
93 (in thousands) Fair Value Measurements as of December 31, 2011 Level 1 Level 2 Level 3 Total Assets: Cash and cash equivalents $22,650 $ -- $ -- $22,650 Mutual funds: International funds 84, ,325 Bond funds -- 79, ,765 Hedged equity funds ,796 13,796 Investment insurance contracts ,369 8,369 Trust funds: Domestic funds , ,358 Bond funds -- 80, ,364 Limited partnerships ,973 37,973 Total $106,975 $390,487 $60,138 $557,600 Hedged Equity Funds Fair Value Measurements using Level 3 Investment Insurance Contracts Limited Partnerships Total Beginning balance $13,552 $9,000 $39,661 $62,213 Actual return on plan assets: Still held at the reporting date (1,688) (1,219) Purchases Sales -- (858) -- (858) Transfers in (out) of Level Ending balance $13,796 $8,369 $37,973 $60,138 91
94 (in thousands) Fair Value Measurements as of December 31, 2010 Level 1 Level 2 Level 3 Total Assets: Cash and cash equivalents $6,453 $ -- $ -- $6,453 Mutual funds: Domestic funds , ,972 International funds -- 50, ,178 Bond funds -- 79, ,789 Hedged equity funds ,552 13,552 Investment insurance contracts ,000 9,000 Trust funds: Domestic funds , ,225 International funds -- 49, ,298 Bond funds -- 78, ,910 Limited partnerships ,661 39,661 Total $6,453 $504,372 $62,213 $573,038 Hedged Equity Funds Fair Value Measurements using Level 3 Investment Insurance Contracts Limited Partnerships Total Beginning balance $13,132 $9,618 $36,943 $59,693 Actual return on plan assets: Still held at the reporting date ,718 3,450 Sales -- (930) -- (930) Transfers in (out) of Level Ending balance $13,552 $9,000 $39,661 $62,213 Plan assets are diversified into various investment types as shown in the preceding table. An investment consultant is utilized to ensure the diversification of assets. The assets are spread among numerous fund managers. Diversification is also obtained by selecting fund managers whose funds are not concentrated in individual stocks and, for the case of international funds, individual countries. Valuation Techniques: Observable inputs that reflect quoted prices (unadjusted) for identical assets or liabilities in active markets would be classified as Level 1. Inputs other than quoted prices included in Level 1 that are observable for the asset or liability through corroboration with observable market data would be classified as Level 2. In addition, assets measured at Net Asset Value (NAV) per share and that we have the ability to redeem at NAV per share at the measurement date are classified as Level 2. Unobservable inputs (e.g., a company s own assumptions and data) and assets measured at NAV per share which we do not have the ability to redeem at NAV per share at the measurement date would be classified as Level 3. All assets are evaluated at the fund level. Refer to Note 17 for a complete description of Fair Value Measurements. NOTE 13 Related Party Transactions In the ordinary course of business, we enter into loan transactions with officers, directors, their immediate family members and other organizations with which such persons may be associated. Such loans are subject to special approval requirements contained in the FCA regulations and are made on the same terms, including 92
95 interest rates, amortization schedules and collateral, as those prevailing at the time for comparable transactions with unrelated borrowers. Total loans to such persons in the District amounted to $304.1 million at December 31, 2012, with $256.4 million of new loans made and $258.1 million of repayments during the year. In the opinion of management at the District entities, none of these loans outstanding at December 31, 2012 involved more than a normal risk of collectability. NOTE 14 Regulatory Enforcement Matters During 2012, the FCA completed a number of reviews of certain areas specific to AgriBank and affiliated Associations. There are no regulatory enforcement actions or matters which require disclosure. NOTE 15 Commitments and Contingencies District entities may, from time to time, be named as defendants in certain lawsuits or legal actions in the normal course of business. At the date of these financial statements, management was not aware of any such actions that would have a material impact on the entities financial condition. However, AgriBank and affiliated Association management cannot ensure that such actions or other contingencies will not arise in the future. We have various commitments outstanding and contingent liabilities as discussed elsewhere in these notes to the financial statements. While primarily liable for its portion of Systemwide bonds and notes, AgriBank is jointly and severally liable for the Systemwide bonds and notes of the other Farm Credit System Banks. The total bonds and notes of the Farm Credit System at December 31, 2012 were $198.0 billion. AgriBank, together with all Farm Credit System Banks and the Federal Farm Credit Banks Funding Corporation, have entered into the Contractual Interbank Performance Agreement (CIPA). This agreement establishes agreedupon standards of District financial condition and performance to achieve and maintain. AgriBank, and each of the other Farm Credit System Banks, exceeded the minimum performance measures at December 31, AgriBank, together with all Farm Credit System Banks and the Federal Farm Credit Banks Funding Corporation, have entered into the Market Access Agreement (MAA). This agreement establishes criteria and procedures for the Farm Credit System Banks to provide information and, under specific circumstances, restricting or prohibiting participation in issuances of Systemwide debt securities. The agreement is intended to identify and resolve individual Farm Credit System Bank financial problems in a timely manner. AgriBank, and each of the other Farm Credit System Banks, is in compliance with all aspects of the agreement at December 31, If a Farm Credit System Bank fails to meet the MAA performance criteria, it will be placed into one of three categories. Each category gives the other Farm Credit System Banks progressively more control over a Farm Credit System Bank that has declining financial performance under the MAA performance criteria. A Category I Bank is subject to additional monitoring and reporting requirements; a Category II Bank s ability to participate in 93
96 issuances of Systemwide debt securities may be limited to refinancing maturing debt obligations; and a Category III Bank may not be permitted to participate in issuances of Systemwide debt securities. NOTE 16 Financial Instruments with Off-Balance-Sheet Risk We participate in financial instruments in the form of commitments to extend credit and letters of credit to satisfy the financing needs of our borrowers. These instruments involve, to varying degrees, elements of credit risk in excess of the amount recognized in the financial statements. Commitments to extend credit are agreements to lend to a borrower as long as there is not a violation of any condition established in the loan contract. At December 31, 2012, we had commitments to extend credit of $21.4 billion. Standby letters of credit are agreements to pay a beneficiary upon event of default on a contractual arrangement. At December 31, 2012, we had issued standby letters of credit of $346.7 million of which $3.8 million was included in Other liabilities on the Combined Statements of Condition at December 31, Refer to Note 17 for further discussion regarding standby letters of credit included on the Combined Statements of Condition. Commercial letters of credit are agreements to pay a beneficiary under specific conditions. At December 31, 2012, one affiliated Association had commercial letters of credit of $209 thousand. Commitments to extend credit and letters of credit generally have fixed expiration dates or other termination clauses and we may require payment of a fee. Commitments to extend credit and letters of credit may have credit risk in excess of the amount recognized in the financial statements until they are fulfilled or expire. Since many of the commitments to extend credit and letters of credit are expected to expire without being fully drawn upon, the total commitments to extend credit and letters of credit do not necessarily represent future cash requirements. Certain letters of credit may have recourse provisions that would enable AgriBank and/or an Association, as a guarantor, to recover from third parties amounts paid under guarantees, thereby limiting its maximum potential exposures. The credit risk involved in issuing these financial instruments is essentially the same as that involved in extending loans to borrowers and the same credit policies are applied by management. The amount of collateral obtained, if deemed necessary upon extension of credit, is based on management's credit evaluation of the borrower. NOTE 17 Fair Value Measurements Accounting guidance defines fair value, establishes a framework for measuring fair value and requires disclosures for certain assets and liabilities measured at fair value on a recurring and non-recurring basis. These assets and liabilities consist of investments available-for-sale, federal funds, derivative assets and liabilities, impaired loans, other property owned, collateral liabilities and certain letters of credit. This guidance defines fair value as the price that would be received to sell an asset or paid to transfer a liability in an orderly transaction between market participants at the measurement date. This guidance establishes a fair value hierarchy for disclosure of fair value measurements to maximize the use of observable inputs. The valuation hierarchy is based upon the transparency of inputs to the valuation of an asset or liability as of the measurement date. A financial instrument s categorization within the valuation hierarchy is based upon the lowest level of input that is significant to the fair value measurement. Refer to Note 2 for a more complete description of these input levels. Accounting guidance also establishes a framework for measuring the fair value of other financial instruments that are not measured at fair value on the Combined Statements of 94
97 Condition. These assets and liabilities consist of cash, investments held-to-maturity, loans, other earning assets, bonds and notes, subordinated notes and commitments to extend credit and certain letters of credit. Recurring Measurements The following represents a summary of the valuation techniques and inputs used to measure fair value on a recurring basis: Federal Funds: The fair value of federal funds is generally their face value, plus accrued interest, as these instruments are highly liquid, readily convertible to cash and short-term in nature. Investments Available-for-Sale: The fair value of substantially all of these investment securities are determined from third-party valuation services that estimate current market prices. Level 2 inputs and assumptions related to third-party market valuation services are typically observable in the marketplace. Such services incorporate repayment assumptions and underlying mortgage-backed or asset-backed collateral information to generate cash flows that are discounted using appropriate benchmark interest rate curves and volatilities including LIBOR, Treasury and other Index benchmarks. Third-party valuations also incorporate information regarding broker/dealer quotes, available trade information, historical cash flows, credit ratings and other market information. Such valuations represent an estimated exit price, or price to be received by a seller in active markets to sell the investment securities to a willing participant. Level 3 inputs are based on the relatively illiquid marketplace for some investments and the lack of marketplace information available for significant inputs and assumptions to the valuation process. The fair value measurements of these assets are based on multiple factors including information obtained from third-party valuation services using both Level 2 and Level 3 inputs. These inputs include volatilities, market spreads, default probabilities, loss severities, prepayment speeds and dealer quotes. Significant increases (decreases) in any of those inputs in isolation would result in a significantly lower (higher) fair value measurement. Generally, a change in the assumption used for the probability of default is accompanied by a directionally similar change in the assumption used for the loss severity and a directionally opposite change in the assumption used for prepayment rates. FASB guidance requires us to provide quantitative information about significant unobservable inputs used in the fair value measurement for recurring and nonrecurring assets and liabilities within Level 3. However, a reporting entity is not required to create quantitative information if the unobservable inputs are not developed by the reporting entity. As the fair value is determined by third-party valuation services without adjustment by management, we have not reported this disclosure as these inputs are not reasonably available to us. The valuation process is described above. Derivative Assets and Liabilities: The fair value of our derivative financial instruments is the estimated amount to be received to sell a derivative asset or paid to transfer a derivative liability in active markets among willing participants at the reporting date. Estimated fair values are determined through internal market valuation models. These models incorporate LIBOR swap curves, market volatilities and other inputs which are observable directly or indirectly in the marketplace. We compare internally calculated derivative valuations to broker/dealer quotes to substantiate the results. Cash Collateral Pledged by Counterparties: The majority of derivative contracts are supported by bilateral collateral agreements with counterparties requiring the posting of cash or investment securities as collateral in the event certain dollar thresholds of credit exposure are reached. The market value of cash collateral pledged by counterparties is its face value as that approximates fair value. 95
98 Standby Letters of Credit: Estimating the fair value of letters of credit is determined by the inherent credit loss in such instruments. Assets and liabilities measured at fair value on a recurring basis are summarized below: (in thousands) Fair Value Measurement Using Total Fair As of December 31, 2012 Level 1 Level 2 Level 3 Value Assets: Federal funds $ -- $744,548 $ -- $744,548 Investments available-for-sale: Mortgage-backed securities -- 3,933, ,500 4,173,512 U.S. Treasury securities -- 3,190, ,190,648 Commercial paper and other -- 2,856, ,856,563 U.S. Agency securities , ,616 Asset-backed securities , , ,974 Total investments available-for-sale -- 10,621, ,939 10,987,313 Derivative assets -- 70, ,255 Total assets $ -- $11,436,177 $365,939 $11,802,116 Liabilities: Cash collateral pledged by counterparties $22,320 $ -- $ -- $22,320 Derivative liabilities -- 18, ,345 Standby letters of credit ,750 3,750 Total liabilities $22,320 $18,345 $3,750 $44,415 (in thousands) Fair Value Measurement Using Total Fair As of December 31, 2011 Level 1 Level 2 Level 3 Value Assets: Federal funds $ -- $299,976 $ -- $299,976 Investments available-for-sale: Mortgage-backed securities -- 3,887, ,741 4,140,747 U.S. Treasury securities -- 2,933, ,933,150 Commercial paper and other -- 2,123, ,123,383 U.S. Agency securities , ,418 Asset-backed securities -- 83, , ,873 Total investments available-for-sale -- 9,288, ,843 9,688,571 Derivative assets , ,444 Total assets $ -- $9,729,148 $399,843 $10,128,991 Liabilities: Cash collateral pledged by counterparties $103,120 $ -- $ -- $103,120 Derivative liabilities -- 17, ,466 Total liabilities $103,120 $17,466 $ -- $120,586 96
99 (in thousands) Fair Value Measurement Using Total Fair As of December 31, 2010 Level 1 Level 2 Level 3 Value Assets: Federal funds $ -- $649,216 $ -- $649,216 Investments available-for-sale: Mortgage-backed securities -- 3,679, ,357 3,993,652 U.S. Treasury securities -- 3,097, ,097,610 Commercial paper and other -- 2,325, ,325,067 U.S. Agency securities , ,915 Asset-backed securities , ,648 Total investments available-for-sale -- 9,458, ,005 9,997,892 Derivative assets , ,213 Total assets $ -- $10,361,316 $539,005 $10,900,321 Liabilities: Cash collateral pledged by counterparties $188,840 $ -- $ -- $188,840 Derivative liabilities -- 8, ,718 Total liabilities $188,840 $8,718 $ -- $197,558 The table below represents a reconciliation of all assets and liabilities measured at fair value on a recurring basis using significant unobservable inputs (Level 3). (in thousands) Level 3 Instruments Only Total Fair Value Measurement Investments Available-for-Sale Asset-backed Securities Mortgage-backed Securities Derivative Assets Standby Letters of Credit Balance at December 31, 2009 $371,891 $382,035 $325 $143 Total gains or losses realized/unrealized: Included in earnings 7,433 (15,841) (325) (143) Included in other comprehensive income 30,723 66, Settlements (185,399) (118,324) -- - Transfers in and/or out of Level Balance at December 31, 2010 $224,648 $314,357 $ -- $ -- Total gains or (losses) realized/unrealized: Included in earnings (12,292) (10,994) -- - Included in other comprehensive income 7,288 15, Purchases 84, Settlements (73,771) (65,009) Transfers in and/or out of Level 3 (83,771) Balance at December 31, 2011 $146,102 $253,741 $ -- $ -- Total gains or (losses) realized/unrealized: Included in earnings (14,290) (11,195) -- 3,750 Included in other comprehensive income 36,259 42, Purchases Settlements (42,632) (44,842) Transfers in and/or out of Level Balance at December 31, 2012 $125,439 $240,500 $ -- $3,750 97
100 We transferred $83.8 million of automobile asset-backed securities from Level 3 to Level 2 during 2011 due to adequate liquidity and sufficient observable marketplace data. We did not have any assets or liabilities transfer between levels during 2012 or Non-Recurring Measurements The following represents a summary of the valuation techniques and inputs used to measure fair value on a non-recurring basis: Loans: Certain collateral dependent loans are measured at fair value on a non-recurring basis when they are evaluated for impairment under FASB guidance in which fair values are based upon the underlying collateral. Costs to sell represent transaction costs and are not included as a component of the fair value. Since the value of the collateral, less estimated costs to sell, was less than the principal balance of the loan, specific reserves were established for these loans. If the process uses independent appraisals and other market-based information, they fall under Level 2. If the process requires significant input based on management s knowledge of and judgment about current market conditions, specific issues relating to the collateral and other matters, they fall under Level 3. Other Property Owned: Other property owned is measured at fair value on a non-recurring basis when the fair value for other property owned is based upon the collateral fair value. Costs to sell represent transaction costs and are not included as a component of the fair value. If the process uses independent appraisals and other market-based information, they fall under Level 2. If the process requires significant input based on management s knowledge of and judgment about current market conditions, specific issues relating to the collateral and other matters, they fall under Level 3. Assets measured at fair value on a non-recurring basis are summarized below: (in thousands) Fair Value Measurement Using Total Fair Total As of December 31, 2012 Level 1 Level 2 Level 3 Value Losses Assets: Loans $ -- $51,432 $71,739 $123,171 $(47,645) Other property owned ,549 70,549 (22,469) (in thousands) Fair Value Measurement Using Total Fair Total As of December 31, 2011 Level 1 Level 2 Level 3 Value Gain (Losses) Assets: Loans $ -- $99,755 $139,407 $239,162 $19,336 Other property owned , ,790 (6,201) (in thousands) Fair Value Measurement Using Total Fair Total As of December 31, 2010 Level 1 Level 2 Level 3 Value Gain (Losses) Assets: Loans $ -- $111,290 $150,993 $262,283 $51,644 Other property owned ,271 98,271 (6,315) 98
101 Other Financial Instrument Measurements A description of the methods and assumptions used to estimate the fair value of each class of our financial instruments, measured at carrying amounts and not measured at fair value on the Combined Statements of Condition, follows: Cash: The carrying value is a reasonable estimate of fair value. Investments held-to-maturity: Investment securities held-to-maturity are valued using a discounted cash flow model based on the appropriate interest rate yield curve, prepayment rates, contractual investment information and credit classification. Loans: Because no active market exists for our loans, fair value is estimated by discounting the expected future cash flows using current interest rates at which similar loans would be made or repriced to borrowers with similar credit risk. In addition, loans are valued using the Farm Credit interest rate yield curve, prepayment rates, contractual loan information, credit classification and collateral values. As the discount rates are based upon internal pricing mechanisms and other management estimates, management has no basis to determine whether the fair values presented would be indicative of the exit price negotiated in an actual sale. Furthermore, certain statutory or regulatory factors not considered in the valuation, such as the unique statutory rights of Farm Credit System borrowers, could render our portfolio less marketable outside the Farm Credit System. For purposes of determining fair value of loans that are not individually specifically impaired, the loan portfolio is segregated into pools of loans with approximately homogeneous characteristics. Expected future cash flows and interest rates reflecting appropriate credit risk are separately determined for each individual pool. Other Earning Assets: Other earning assets are valued using a discounted cash flow model based on the Farm Credit interest rate yield curve, prepayment rates, contractual investment information and credit classification. Bonds and notes: Systemwide debt securities are not all traded in the secondary market and those that are traded may not have readily available quoted market prices. Therefore, the fair value of the instruments is estimated by calculating the discounted value of the expected future cash flows. The discount rates used are based on the sum of quoted market yields for the Treasury yield curve and an estimated yield-spread relationship between Systemwide debt securities and Treasury securities. We estimate an appropriate yieldspread taking into consideration selling group member (banks and securities dealers) yield indications, observed new Government-sponsored enterprise debt security pricing and pricing levels in the related U.S. dollar interest rate swap market. Subordinated notes: The fair value of obligations held by an affiliated Association is based on a discounted cash flow model based on the Farm Credit interest rate yield curve. The fair value of obligations held by AgriBank is based on an estimated fair value using credit spreads, market trends, interest rate risks and comparisons to similar institutions which we receive from an independent investment dealer. Commitments to extend credit and letters of credit: Estimating the fair value of commitments and letters of credit is determined by the inherent credit loss in such instruments based on rate of funding and credit loss factors. 99
102 Financial assets and liabilities measured at carrying amounts and not measured at fair value on the Combined Statements of Condition are summarized as follows: (in thousands) December 31, 2012 December 31, 2011 December 31, 2010 Total Total Total Carrying Fair Value Measurement Using Total Fair Carrying Total Fair Carrying Total Fair Amount Level 1 Level 2 Level 3 Value Amount Value Amount Value Assets: Cash $560,753 $560,753 $ -- $ -- $560,753 $586,862 $586,862 $143,492 $143,492 Investments held-to-maturity 2,275, ,295 1,290,725 2,265,020 2,262,747 2,250,680 2,033,809 2,026,497 Net loans 76,703, ,984,790 77,984,790 67,809,895 69,165,185 64,366,452 65,136,909 Other earning assets 144, , , , , , ,670 Total assets: $79,683,251 $560,753 $974,295 $79,423,034 $80,958,082 $70,870,449 $72,222,713 $66,815,710 $67,579,568 Liabilities: Bonds and notes $77,135,855 $ -- $ -- $77,635,287 $77,635,287 $68,262,968 $69,004,618 $66,179,450 $66,524,162 Subordinated notes 600, , , , , , ,869 Total liabilities: $77,735,855 $ -- $ -- $78,406,140 $78,406,140 $68,862,968 $69,742,476 $66,779,450 $67,220,031 Unrecognized financial instruments: Commitments to extend credit and letters of credit $ -- $ -- ($23,907) ($23,907) $(24,815) $(21,359) NOTE 18 Derivative Instruments and Hedging Activities Use of Derivatives AgriBank maintains an overall interest rate risk management strategy that incorporates the use of derivative products to minimize significant unplanned fluctuations in earnings that are caused by interest rate volatility. AgriBank s goals are to manage interest rate sensitivity by modifying the repricing or maturity characteristics of certain balance sheet assets and liabilities so that movements in interest rates do not adversely affect the net interest margin. As a result of interest rate fluctuations, hedged fixed-rate liabilities will appreciate or depreciate in market value. The effect of this unrealized appreciation or depreciation is expected to be substantially offset by gains or losses on the derivative instruments that are linked to these hedged assets and liabilities. Another result of interest rate fluctuations is that the interest income and interest expense of hedged floating-rate liabilities will increase or decrease. The effect of this variability in earnings is expected to be substantially offset by gains and losses on the derivative instruments that are linked to these hedged assets and liabilities. AgriBank considers the use of derivatives to be a prudent method of managing interest rate sensitivity, as it prevents earnings from being exposed to undue risk posed by changes in interest rates. AgriBank enters into derivative transactions, particularly interest rate swaps, to lower funding costs, diversify sources of funding, alter interest rate exposures arising from mismatches between assets and liabilities, or better manage liquidity. AgriBank may also enter into derivatives with District Associations as a service to enable them to transfer, modify or reduce their exposure to retail interest rate risk. Interest rate swaps allow AgriBank to raise long-term borrowings at fixed rates and swap them into floating rates that are lower than those available to AgriBank if floating rate borrowings were made directly. Under interest rate swap arrangements, AgriBank agrees with other parties to exchange, at specified intervals, payment streams calculated on a specified notional principal amount, with at least one stream based on a specified floating rate index. AgriBank may purchase interest rate options, such as caps, in order to offset the impact of rising interest rates on AgriBank s floatingrate debt and floors, in order to offset the impact of falling interest rates on related floating-rate assets. 100
103 The primary types of derivative instruments used and the amount of activity during the period (in notional amount) are summarized in the following table: Pay-Fixed Floating-forand Floating and Amortizing Amortizing Receive- Pay-Fixed Floating-for- Other (in millions) Fixed Swaps Swaps Floating Derivatives Total Balance at December 31, 2009 $7,415 $675 $1,350 $469 $9,909 Additions ,650 Maturities/amortization (1,925) (18) (150) -- (2,093) Terminations (23) (23) Balance at December 31, 2010 $6,290 $757 $1,950 $446 $9,443 Additions Maturities/amortization (1,940) (78) -- (246) (2,264) Balance at December 31, 2011 $4,750 $972 $2,250 $200 $8,172 Additions Maturities/amortization (1,500) (46) (500) (100) (2,146) Balance at December 31, 2012 $3,500 $1,076 $1,750 $100 $6,426 Other derivatives consist primarily of forward starting swaps, interest rate caps and swaptions. By using derivative products, AgriBank exposes itself to credit and market risk. If a counterparty fails to fulfill its performance obligations under a derivative contract, AgriBank s credit risk will equal the fair value gain in a derivative. Generally, when the fair value of a derivative contract is positive, this indicates that the counterparty owes AgriBank, thus creating credit risk. When the fair value of the derivative contract is negative, AgriBank owes the counterparty and, therefore, AgriBank does not assume credit risk to that counterparty. To minimize the risk of credit losses, AgriBank only deals with non-customer counterparties that have an investment grade or better credit rating from a rating and AgriBank also monitors the credit standing and levels of exposure to individual counterparties. AgriBank does not anticipate nonperformance by any of these counterparties. AgriBank typically enters into master agreements that contain netting provisions. These provisions allow AgriBank to require the net settlement of covered contracts with the same counterparty in the event of default by the counterparty on one or more contracts. Substantially all derivative contracts are supported by bilateral collateral agreements with counterparties requiring the posting of collateral in the event certain dollar thresholds of exposure of one party to the other are reached. These thresholds vary depending on the counterparty s current credit rating. At December 31, 2012, AgriBank s exposure to counterparties, net of collateral, was $43.5 million. At December 31, 2012, AgriBank held cash collateral of $22.3 million and securities of $19.1 million from counterparties. AgriBank s derivative activities are monitored by its ALCO as part of the Committee s oversight of AgriBank s asset/liability and treasury functions. AgriBank s ALCO is responsible for approving hedging strategies that are developed within limits established by AgriBank s Board of Directors through analysis of data derived from financial simulation models and other internal and industry sources. The resulting hedging strategies are then incorporated into overall interest rate risk-management strategies. Accounting for Derivatives Fair Value Hedges: For derivative instruments that are designated and qualify as a fair value hedge, the gain or loss on the derivative as well as the offsetting gain or loss on the hedged item attributable to the hedged risk 101
104 are recognized in current earnings. AgriBank includes the gain or loss on the derivative in the same line item (interest expense) as the offsetting gain or loss on the related hedged item. Gains and losses on derivatives representing hedge components excluded from the assessment of effectiveness are recorded in current period earnings in Miscellaneous income and other gains (losses), net in the Combined Statements of Comprehensive Income. Cash Flow Hedges: For derivative instruments that are designated and qualify as a cash flow hedge, the effective portion of the gain or loss on the derivative is reported as a component of other comprehensive income and reclassified into earnings (interest expense) in the same period or periods during which the hedged transaction affects earnings. Gains and losses on derivatives representing hedge components excluded from the assessment of effectiveness are recorded in current period earnings in Miscellaneous income and other gains (losses), net in the Combined Statements of Comprehensive Income. Derivatives not Designated as Hedges: For derivatives not designated as a hedging instrument, the related change in fair value is recorded in current period earnings in Miscellaneous income and other gains (losses), net in the Combined Statements of Comprehensive Income. Financial Statement Impact of Derivatives The following table presents the gross fair value of derivative assets and derivative liabilities. The fair value of AgriBank s derivative contracts are presented as Derivative assets and Derivative liabilities in the Combined Statements of Condition, and are presented net on the Combined Statements of Condition for counterparties with master netting agreements. December 31, 2012 December 31, 2011 December 31, 2010 Fair Value Fair Value Fair Value Fair Value Fair Value Fair Value (in thousands) Assets: Liabilities: Assets: Liabilities: Assets: Liabilities: Derivatives designated as hedging instruments: Receive-fixed swaps $149,085 $ -- $227,736 $ -- $267,551 $7,844 Pay-fixed and amortizing pay-fixed swaps 1,055 87, ,428 31,190 39,115 Floating-for-floating and amortizing floating-for-floating swaps -- 11, ,829 1,606 7,121 Total derivatives designated as hedging instruments 150,140 98, , , ,347 54,080 Derivatives not designated as hedging instruments: Receive-fixed swaps Total derivatives not designated as hedging instruments Credit valuation adjustments (306) -- (1,446) -- Total derivatives $150,758 $98,848 $227,536 $104,558 $299,152 $54,657 The fair value of derivatives includes credit valuation adjustments (CVA). The CVA reflects credit risk of each derivative counterparty to which AgriBank has exposure, net of any collateral posted by the counterparty, and an adjustment for AgriBank s credit worthiness where the counterparty has exposure to AgriBank. The favorable CVA in 2012 is due to our counterparties exposure to AgriBank. The change in the CVA for the period is included in Miscellaneous income and other gains (losses), net on the Combined Statements of Comprehensive Income. Fair Value Hedges: AgriBank recorded a gain of $7.7 million in 2012 and losses of $7.0 million and $4.5 million in 2011 and 2010, respectively, related to receive-fixed swaps which are designated as fair value hedging instruments. The gains and losses on the derivative instruments are recognized in Interest expense on the Combined Statements of Comprehensive Income. Cash Flow Hedges: The following table presents the amount of Other Comprehensive Income (OCI) recognized on derivatives. The gain (loss) on derivatives designated as cash flow hedges reclassified from accumulated other comprehensive income (AOCI) into income is included in Interest expense on the Combined 102
105 Statements of Comprehensive Income. During the next twelve months, net losses in AOCI of approximately $18.3 million on derivative instruments that qualify as cash flow hedges are expected to be reclassified into earnings. These net losses classified into earnings are expected to reduce net interest income related to the respective hedged items. (in thousands) For the period ended December 31, 2012: Derivatives - Cash Flow Hedging Relationships Amount of Gain (Loss) Recognized in OCI on Derivatives (Effective Portion) Amount of Gain (Loss) Reclassified from AOCI into Income (Effective Portion) Amount of Gain (Loss) Recognized in Income on Derivatives (Ineffective Portion) and Amount Excluded from Effectiveness Testing Pay-fixed and amortizing pay-fixed swaps $5,905 $489 $22 Floating-for-floating and amortizing floating-for-floating swaps Other derivative products -- (393) -- Total $6,458 $96 $22 (in thousands) For the period ended December 31, 2011: Derivatives - Cash Flow Hedging Relationships Amount of Gain (Loss) Recognized in OCI on Derivatives (Effective Portion) Amount of Gain (Loss) Reclassified from AOCI into Income (Effective Portion) Amount of Gain (Loss) Recognized in Income on Derivatives (Ineffective Portion) and Amount Excluded from Effectiveness Testing Pay-fixed and amortizing pay-fixed swaps $(84,865) $634 $85 Floating-for-floating and amortizing floating-for-floating swaps (5,931) 1, Other derivative products -- (1,534) -- Total $(90,796) $629 $85 (in thousands) For the period ended December 31, 2010: Derivatives - Cash Flow Hedging Relationships Amount of Gain (Loss) Recognized in OCI on Derivatives (Effective Portion) Amount of Gain (Loss) Reclassified from AOCI into Income (Effective Portion) Amount of Gain (Loss) Recognized in Income on Derivatives (Ineffective Portion) and Amount Excluded from Effectiveness Testing Pay-fixed and amortizing pay-fixed swaps $(34,623) $1,385 $96 Floating-for-floating and amortizing floating-for-floating swaps (4,083) 4, Other derivative products -- (1,486) -- Total $(38,706) $4,322 $96 Derivatives not Designated as Hedges: The following table presents the effect of derivative instruments not designated as hedges on the Combined Statements of Comprehensive Income. The gain (loss) on derivatives not designated as hedges are included in Miscellaneous income and other gains (losses), net on the Combined Statements of Comprehensive Income: (in thousands) For the year ended December 31, Derivatives not Designated as Hedges Loss Recognized Gain Recognized Loss Recognized Receive-fixed swaps $(13,589) $25 $(584) Interest rate caps (5) Other derivative products (595) Total $(13,589) $25 $(1,184) The losses during 2012 primarily represent swaps AgriBank purchased from another Farm Credit System Bank in October 2008 that became ineffective in March 2012 requiring that the market value of the swaps be recognized on a mark-to-market basis. These losses are partially offset by gains of $8.2 million recognized in Interest expense on the Combined Statements of Comprehensive Income representing the amortization of the fair value adjustment recorded on hedged debt for the period the hedge was deemed effective. With the 103
106 discontinuance of hedge accounting the fair value adjustment was amortized to income over the remaining life of the hedged item using the effective interest method. This swap expired during the last quarter of NOTE 19 Accumulated Other Comprehensive Income (Loss) Cumulative component balances: Not-other-than- Other-thantemporarily-impaired temporarily-impaired and Hedging Benefit Plans Derivatives Employee (in thousands) Investments Investments Activity Activity Total Balance at December 31, 2009 $(119,870) $(70,462) $30,800 $(321,427) $(480,959) Other comprehensive income (loss) 94,409 21,759 (43,028) (25,710) 47,430 Balance at December 31, 2010 (25,461) (48,703) (12,228) (347,137) (433,529) Other comprehensive income (loss) 16,072 13,721 (91,425) (98,935) (160,567) Balance at December 31, 2011 (9,389) (34,982) (103,653) (446,072) (594,096) Other comprehensive income (loss) 23,435 53,901 6,362 (72,926) 10,772 Balance at December 31, 2012 $14,046 $18,919 $(97,291) $(518,998) $(583,324) Changes in components of other comprehensive income (loss): (in thousands) For the year ended December 31, Other comprehensive income (loss) and reclassification amounts: Unrealized gains for the period $18,665 $11,931 $89,254 Reclassification adjustment for losses included in net income 4,770 4,141 5,155 Not-other-than-temporary-impaired investments 23,435 16,072 94,409 Unrealized gains (losses) for the period 33,186 (5,102) 18,506 Reclassification adjustment for losses included in net income 20,715 18,823 3,253 Other-than-temporary-impaired investments 53,901 13,721 21,759 Unrealized gains (losses) on derivatives for the period 6,458 (90,796) (38,706) Reclassification adjustment for gains included in net income (96) (629) (4,322) Derivatives and hedging activities 6,362 (91,425) (43,028) Unrealized losses for the period (102,260) (124,091) (45,463) Reclassification adjustment for losses included in net income 29,334 25,156 19,753 Employee benefit plans activity (72,926) (98,935) (25,710) Total other comprehensive income (loss) $10,772 $(160,567) $47,
107 NOTE 20 Subsequent Events We have evaluated subsequent events through March 15, 2013, which is the date the financial statements were available to be issued. There have been no material subsequent events that would require recognition in our 2012 Combined Financial Statements or disclosure in the Notes to those Combined Financial Statements. NOTE 21 AgriBank Only Financial Data Condensed financial information of AgriBank follows: (in thousands) As of December 31, Loans $69,698,631 $62,043,002 $59,517,357 Allowance for loan losses 13,275 9,208 12,956 Net loans 69,685,356 62,033,794 59,504,401 Cash, federal funds and investment securities 12,071,431 10,417,633 10,698,431 Accrued interest receivable 358, , ,995 Other assets 184, , ,539 Total assets $82,299,203 $73,110,012 $70,996,366 Bonds and notes $77,135,503 $68,262,550 $66,178,290 Subordinated notes 500, , ,000 Other liabilities 407, , ,932 Total liabilities 78,043,422 69,303,825 67,401,222 Total members' equity 4,255,781 3,806,187 3,595,144 Total liabilities and members' equity $82,299,203 $73,110,012 $70,996,366 For the year ended December 31, Interest income $1,406,600 $1,519,010 $1,654,321 Interest expense 922,693 1,061,340 1,148,091 Net interest income 483, , ,230 Provision for loan losses 7,400 8,551 1,660 Net interest income after provision for loan losses 476, , ,570 Net other expense (income) (37,700) (15,799) (76,351) Net income $514,207 $464,918 $580,921 Payment of patronage and/or dividends is allowed under AgriBank bylaws if the distribution is in accordance with applicable laws and regulations, including the FCA capital adequacy regulations. AgriBank s patronage distributions totaled $313.2 million, $289.8 million and $350.9 million for 2012, 2011 and 2010, respectively. No dividends were made during 2012, 2011 or
108 NOTE 22 Condensed Average Balance Sheets (Unaudited) Condensed balance sheets on an average daily balance basis for the District follow: (in thousands) As of December 31, Net loans $70,579,638 $65,201,738 $60,502,742 Cash, federal funds, investment securities and other earning assets 13,927,081 13,228,300 12,450,359 Accrued interest receivable 838, , ,565 Other assets 1,334,752 1,420,820 1,483,681 Total assets $86,679,742 $80,695,628 $75,280,347 Bonds and notes $71,161,098 $66,534,352 $62,427,794 Subordinated notes 600, , ,904 Other liabilities 1,233,810 1,212,124 1,199,909 Total liabilities 72,994,908 68,346,476 64,206,607 Members' equity 13,684,834 12,349,152 11,073,740 Total liabilities and members' equity $86,679,742 $80,695,628 $75,280,
109 NOTE 23 Quarterly Financial Information (Unaudited) The following represents selected quarterly financial information for the District: (in thousands) 2012 First Second Third Fourth Total Interest income $798,959 $801,106 $819,738 $823,475 $3,243,278 Interest expense 252, , , , ,824 Net interest income 546, , , ,815 2,311,454 (Reversal of) provision for credit losses (16,561) (2,132) 40,737 11,863 33,907 Net other expenses 165,094 83, , , ,158 Net income $398,081 $483,466 $397,223 $440,619 $1,719, First Second Third Fourth Total Interest income $808,416 $811,248 $813,854 $809,629 $3,243,147 Interest expense 281, , , ,998 $1,070,810 Net interest income 526, , , ,631 $2,172,337 Provision for (reversal of) credit losses 25,022 13,136 17,118 (31,639) $23,637 Net other expenses 157, , , ,846 $608,906 Net income $344,142 $366,145 $397,083 $432,424 $1,539, First Second Third Fourth Total Interest income $790,976 $802,432 $806,262 $808,573 $3,208,243 Interest expense 296, , , ,183 1,156,108 Net interest income 494, , , ,390 2,052,135 Provision for credit losses 76,284 42,147 3,022 68, ,913 Net other expenses 83, ,703 91, , ,150 Net income $335,249 $355,783 $425,261 $320,779 $1,437,
110 Disclosure Information Required by Regulations AgriBank, FCB and Affiliated Associations (Unaudited) (In whole dollars unless otherwise noted) Description of Business General information regarding the business is incorporated herein by reference from Note 1 to the combined financial statements included in this Annual Report. The description of significant business developments, if any, is incorporated herein by reference from the "Management's Discussion and Analysis" section included in this Annual Report. Description of Property Affiliated Associations own and lease various facilities across the District. These are described in the individual Association annual shareholder reports. AgriBank's headquarters is located in St. Paul, Minnesota and is leased. Legal Proceedings Information regarding legal proceedings is incorporated herein by reference from Note 15 to the combined financial statements included in this Annual Report. Description of Capital Structure Information regarding capital structure is incorporated herein by reference from Note 10 to the combined financial statements included in this Annual Report. Description of Liabilities Information regarding liabilities is incorporated herein by reference from Notes 7, 8, 9, 11, 12, 15, 16, 17 and 18 to the combined financial statements included in this Annual Report. Selected Financial Data "Combined Five-Year Summary of Selected Financial Data," included in this Annual Report, is incorporated herein by reference. Management's Discussion and Analysis "Management's Discussion and Analysis," included in this Annual Report, is incorporated herein by reference. 108
111 Board of Directors of AgriBank, FCB The Board of Directors is organized into the following committees to carry out Board responsibilities: The Audit Committee oversees financial reporting, the adequacy of our internal control systems, the scope of AgriBank s internal audit program, the independence of the outside auditors, the processes for monitoring compliance with laws and regulations and the code of ethics. The Audit Committee also oversees the adequacy of management s action with respect to recommendations arising from auditing activities; The Finance Committee monitors AgriBank s financial and capital planning, asset/liability management and funding and investment activities. Committee members serve as a resource to the Board by maintaining a more in-depth knowledge of AgriBank s financial activities; The Governance Committee addresses issues of Board governance and the Board s continuing efforts to strengthen and renew the Board, administers a process for maintaining and periodically reviewing board policies and administers a planning process focused upon achieving AgriBank s mission and maintaining a viable, competitive institution; The Human Resources Committee oversees and provides overall direction and/or recommendations for compensation, benefits and human resource performance management programs; and The Risk Management Committee oversees the integration of risk management activities throughout AgriBank s organization. Committee members review ongoing risk assessments of current and emerging risks to ensure adequate planning and resources are directed at managing the identified risks. The Committee also establishes and promotes an effective risk culture throughout AgriBank s organization. Information regarding AgriBank directors who served as of December 31, 2012, including business experience for the last five years, is presented below: Richard Davidson, Chairman, is a self-employed grain and livestock farmer in Washington Court House, Ohio. His current term began in 2009 and expires in Mr. Davidson serves on the Risk Management Committee and also serves on the Finance Committee. Mr. Davidson serves on the board of the Federal Agricultural Mortgage Corporation (Farmer Mac). Thomas Wilkie, III, Vice Chairman, is a self-employed grain farmer and owner of a drainage supply company in Forrest City, Arkansas. His current term began in 2010 and expires in Mr. Wilkie serves on the Audit Committee and also serves as the Chairman of the Risk Management Committee. He also is a director of St. Francis County Farmers Association, Palestine, Arkansas. Mr. Wilkie also serves on the AgriBank District Farm Credit Council Board and is on the Board of the National Farm Credit Council, Washington, D.C. Ed Breuer is a self-employed grain and livestock farmer in Mandan, North Dakota. His current term began in 2011 and expires in Mr. Breuer serves as the Vice Chairman of the Governance Committee. He serves on the AgriBank District Farm Credit Council Board and is also a director of Farm Credit Services of Mandan, ACA, Mandan, North Dakota. Timothy Clayton, appointed director, Plymouth, Minnesota, is a Principal of the management consulting firm Emerging Capital, LLC and serves as the CFO of Tile Shop Holdings, Inc., which is a retail ceramic and stone tile business. His current term began in 2009 and expires in Mr. Clayton serves as the Chairman of the Audit Committee. 109
112 Ernie Diggs is a self-employed crop farmer in Paris, Tennessee. His current term began in 2012 and expires in Mr. Diggs serves on the Human Resources Committee. Douglas Felton is a self-employed grain farmer in Northfield, Minnesota. His current term began in 2012 and expires in Mr. Felton serves on the Governance Committee. He is also a director of D&T Enterprise of Minnesota, Inc., Randolph, Minnesota, which is engaged in custom harvesting and is a director of Great Western Industrial Park, LLC, Cannon Falls, Minnesota, which is an industrial development company. He also serves on the AgriBank District Farm Credit Council Board, National Farm Credit Council Board, Washington, D.C., and is also the Chairman of the Farm Credit System s Coordinating Committee. Thomas Klahn is a self-employed grain farmer in Lodi, Wisconsin. His current term began in 2009 and expires in Mr. Klahn serves on the Human Resources Committee. He serves on the AgriBank District Farm Credit Council Board and National Farm Credit Council Board, Washington, D.C. Lyndon Limberg is a self-employed farmer in Gary, South Dakota. His current term began in 2011 and expires in Mr. Limberg serves on the Governance Committee and AgriBank District Farm Credit Council Board. Mr. Limberg also serves on the Board of the Antelope Valley Reformed Church in Gary, South Dakota. James McElroy is a self-employed grain farmer in Waverly, Kentucky. His current term began in 2010 and expires in Mr. McElroy serves on the Audit and Risk Management Committees. He also serves on the board of the Federal Agricultural Mortgage Corporation (Farmer Mac). Mr. McElroy is also a director of Union County Soil and Conservation District in Morganfield, Kentucky, a natural resource conservation organization. Brian Peterson is a self-employed dairy and crop farmer in Trenton, Missouri. His current term began in 2012 and expires in Mr. Peterson serves on the Audit Committee. Mr. Peterson also serves on the Rural Dale Cemetery Association Board. Tim Rowe is a self-employed grain farmer in Elwood, Nebraska. His current term began in 2010 and expires in Mr. Rowe serves on the Finance Committee. He is also a director of All Point Cooperative in Gothenburg, Nebraska. John Schable is a self-employed grain farmer in Tuscola, Illinois. His current term began in 2009 and expires in Mr. Schable serves as the Chairman of the Governance Committee and serves on the Risk Management Committee. John Schmitt is a self-employed grain and beef cattle farmer in Quincy, Illinois. His current term began in 2011 and expires in Mr. Schmitt serves on the Finance Committee. He is also a director of 1 st Farm Credit Services, ACA, Normal, Illinois and Adams County Illinois Farm Bureau. William Stutzman is a self-employed crop farmer in Blissfield, Michigan and President of Ogden Communications, Inc. His current term began in 2010 and expires in Mr. Stutzman serves as Vice Chairman of the Audit Committee. He is also a director of GreenStone Farm Credit Services, ACA, Lansing, Michigan, where he serves on its Audit Committee. He also serves on the Farm Credit Foundations Board, Farm Credit Foundations Plan Sponsor Committee, and as Vice Chairman of the Farm Credit Foundations Coordinating Committee. Roy Tiarks is a self-employed grain and livestock farmer in Council Bluffs, Iowa. His current term began in 2009 and expires in Mr. Tiarks serves as Chairman of the Finance Committee and serves on the Risk 110
113 Management Committee. He is also a director of the Federal Farm Credit Banks Funding Corporation in Jersey City, New Jersey. Keri Votruba is a self-employed grain and livestock farmer in Hemingford, Nebraska. His current term began in 2012 and expires in Mr. Votruba serves as the Chairman of the Human Resources Committee. He also serves on the AgriBank District Farm Credit Council Board. Matt Walther is a self-employed crop and cow/calf herd and finished cattle farmer in Centerville, Indiana. His current term began in 2011 and expires in Mr. Walther serves as Vice Chairman of the Finance Committee. Leon Westbrock, appointed director, Alexandria, Minnesota, recently retired from CHS Inc., a U.S.-based diversified energy, grains and foods company owned by farmers, ranchers and cooperatives headquartered in Inver Grove Heights, Minnesota. His term began in 2011 and expires in Mr. Westbrock serves as the Vice Chairman of the Human Resources and the Risk Management Committees. Information regarding days served and compensation paid during 2012 for each AgriBank director follows: Days Served Board Other Compensation Meetings Activities Paid in 2012 Richard Davidson $54,468 Thomas Wilkie, III ,468 Ed Breuer ,468 Timothy Clayton ,468 Ernie Diggs* ,851 Douglas Felton ,468 Meredith Kapp** ,617 Thomas Klahn ,468 Lyndon Limberg ,468 James McElroy ,468 Brian Peterson* ,851 Tim Rowe ,468 John Schable ,468 John Schmitt ,468 William Stutzman ,468 Roy Tiarks ,468 Keri Votruba ,468 Matt Walther ,468 Sue Welch** ,617 Leon Westbrock ,468 Total $980,424 * Elected to Board in 2012 ** Term expired in 2012 Days served in the above chart represent actual days at AgriBank board meetings and activities. Board members also spend additional time in preparation for meetings and in travel to and from meetings. The AgriBank Board members receive an annual retainer which is paid quarterly for attendance at meetings and other official activities. Directors are also reimbursed for reasonable expenses incurred. 111
114 Senior Officers of AgriBank, FCB The senior officers of AgriBank, FCB at December 31, 2012 included: L. William York, Chief Executive Officer Ruth L. Anderson, Vice President, Business Services Pat G. Jones, Vice President, Human Resources and Administration Jeffrey L. Moore, Senior Vice President, Finance Brian J. O Keane, Executive Vice President, Banking and Finance and Chief Financial Officer Jeffrey R. Swanhorst, Executive Vice President, Credit and Chief Credit Officer William J. Thone, Vice President and General Counsel Mr. York became Chief Executive Officer in January Mr. York serves as a Director of the National Council of Farmer Cooperatives and serves on the Board of the Federal Farm Credit Banks Funding Corporation. Ms. Anderson became Vice President, Business Services in March Prior to this she served as Director, Information Services for AgriBank beginning Ms. Jones became Vice President, Human Resources and Administration in April Prior to joining AgriBank she served as Head, HR NAFTA Technology for Syngenta. Prior to this she served as Vice President Human Resources for Agriliance, a joint venture of Land O Lakes, Inc. and CHS, Inc. Mr. Moore became Senior Vice President, Finance in August Prior to this he served as Vice President and Controller for AgriBank beginning in Mr. O Keane joined AgriBank in September 2007 as Senior Vice President and Chief Financial Officer. Mr. O Keane became Executive Vice President, Banking and Finance and Chief Financial Officer in January Prior to joining AgriBank, Mr. O Keane served as Global Treasurer of CNH Capital. Mr. Swanhorst became Executive Vice President, Credit and Chief Credit Officer in August Prior to joining AgriBank he served as Senior Vice President of Credit for CoBank, ACB. Mr. Thone became Vice President and General Counsel in September
115 A summary of compensation paid to AgriBank s senior officers follows: (in thous a nds) Short-term Long-term Incentive Incentive Perquisites/ Name of Individual Year Salary Compensation Compensation Deferred Other Total CEO: L. William York 2012 $580 $520 $296 $8 $ -- $1,404 L. William York ,108 L. William York ,052 Aggregate Number of Senior Officers (Count and compensation does not include CEO): $1,750 $1,043 $401 $56 $ -- $3,250 7 * , , , ,362 * Compensation includes amounts for our former Chief Credit Officer who retired in December The amount included in other in the preceding table represents a sign-on bonus and service awards. The Farm Credit Administration (FCA) regulations require the disclosure of the compensation paid during 2012 to each of the individuals included in the above table to AgriBank shareholders and shareholders of related institutions upon request. In accordance with FCA regulations, an advisory vote on CEO and/or senior officer compensation is required when five percent of the voting stockholders petition for such vote. Although the advisory votes are non-binding, AgriBank s Board of Directors will take into consideration the outcome of the vote when making future CEO and senior officer compensation decisions. Senior officer short-term incentive compensation is paid annually based upon performance criteria established by the Board of Directors. The criterion are based on AgriBank performance and includes: employee measures of employee learning and engagement; customer measures of customer satisfaction and performance; process improvement value creation; and financial measures of net operating rate, adverse credit quality ratio and return on equity ratio. Additionally, incentives are based upon personal objectives and performance ratings. The incentive compensation amounts are calculated after the end of the plan year (calendar year) and are paid out in a lump sum within 90 days of year end. The senior officers did not receive any noncash compensation during For 2013, the performance scorecard measure components have been adjusted to eliminate the employee measures and process improvement value creation measure. The customer measures remain as well as the financial measures. Beginning in 2010, certain senior officers also receive long-term incentive compensation. The long-term incentive compensation amounts are paid annually based upon three year performance criterion established by the Board of Directors. The criterion are based on AgriBank performance and include cumulative net income, average return on assets and CIPA asset quality at the end of the three year period. The long-term incentive compensation amounts are calculated annually and paid in a lump sum within 90 days of the final three year plan year. Additional long-term incentive compensation is provided on a phase in basis during the initial three years of participation in the long-term incentive program. Long-term incentive amounts presented in the preceding chart reflect long-term incentives earned in the applicable years. Prior year amounts were previously reported as earned and paid within 90 days of year-end and have been adjusted to reflect an estimate of longterm incentive compensation earned in the respective reporting periods but to be paid in future periods. 113
116 Senior officers have an option to defer payments under both the short-term and long-term incentive programs in accordance with applicable laws and regulations. Travel, Subsistence and Other Related Expenses Directors and senior officers are reimbursed for reasonable travel, subsistence and other related expenses associated with AgriBank and the District s business functions. AgriBank Directors were reimbursed for expenses in the amount of $210,173, $233,923 and $246,480 in 2012, 2011 and 2010, respectively. A copy of AgriBank s policy for reimbursing these costs is available by contacting AgriBank at the address provided in the Financial Statements section below. Transactions with Senior Officers and Directors Information regarding related party transactions is incorporated herein by reference from Note 13 to the combined financial statements included in this Annual Report. Involvement in Certain Legal Proceedings There were no events during the past five years that are material to evaluating the ability or integrity of any person who served as a director or senior officer of AgriBank on January 1, 2013 or at any time during Shareholder Privacy Shareholders nonpublic personal financial information is protected by the FCA Regulations. AgriBank and the Associations directors and employees are restricted from disclosing information not normally contained in published reports or press releases about AgriBank, the Associations or their shareholders. Relationship with Qualified Public Accountant There were no changes in independent auditors since the last Annual Report to members and we are in agreement with the opinion expressed by the independent auditors. The total financial statement audit service fees paid during 2012 were $1.5 million. Financial Statements The "Report of Management," Independent Auditor s Report," Combined Financial Statements and "Notes to Combined Financial Statements," included in this Annual Report, are incorporated herein by reference. Copies of the annual and quarterly reports are available free of charge upon request to AgriBank, FCB, 30 East 7 th Street, Suite 1600, St. Paul, MN , (651) or via to agribankmn@agribank.com. The reports are also available through AgriBank s website at The quarterly reports are available approximately 40 days following the end of each calendar quarter and the Annual Report is available approximately 75 days following the end of the year. 114
117 Equal Employment Opportunity AgriBank and the Affiliated Associations are an equal opportunity employer. It is our policy to provide equal employment opportunity to all persons regardless of race, color, religion, national origin, sex, age, disability, veteran status, genetic information, sexual orientation, creed, marital status, status with regard to public assistance, membership or activity involving a local human rights commission, or any other characteristic protected by law. We comply with all state and local equal employment opportunity regulations. We conduct all personnel decisions and processes relating to our employees and job applicants in an environment free of discrimination and harassment. 115
118 Young, Beginning and Small Farmers And Ranchers As part of the Farm Credit System s commitment to rural America, our affiliated Associations have specific programs in place to serve the credit and related needs of young, beginning and small farmers and ranchers in their territories. The definitions of young, beginning and small farmers and ranchers follow: Young: A farmer, rancher, or producer or harvester of aquatic products who is age 35 or younger as of the loan transaction date. Beginning: A farmer, rancher, or producer or harvester of aquatic products who has 10 years or less farming or ranching experience as of the loan transaction date. Small: A farmer, rancher, or producer or harvester of aquatic products who normally generates less than $250 thousand in annual gross sales of agricultural or aquatic products. It is important to note that a farmer/rancher may be included in multiple categories based on meeting specific definitions. A more detailed discussion of affiliated Association s programs for young, beginning and small farmers can be found in their respective Annual Reports. Information regarding loans to young and beginning farmers and ranchers follows: (volume in thousands) Actual Number of As of December 31, 2012 Loans Volume Total District loans and commitments 603,522 $95,776,266 Loans and commitments to young farmers and ranchers 116,879 $13,545,367 % of loans and commitments to young farmers and ranchers 19.4% 14.1% Loans and commitments to beginning farmers and ranchers 148,377 $16,467,800 % of loans and commitments to beginning farmers and ranchers 24.6% 17.2% Information regarding new loans made to young and beginning farmers and ranchers follows: (volume in thousands) Actual Number of For the year ended December 31, 2012 New Loans Volume Total District new loans and commitments 234,309 $36,900,360 New loans and commitments to young farmers and ranchers 39,489 $5,295,979 % of new loans and commitments to young farmers and ranchers 16.9% 14.4% New loans and commitments to beginning farmers and ranchers 44,076 $5,937,044 % of new loans and commitments to beginning farmers and ranchers 18.8% 16.1% Information regarding loans to small farmers and ranchers follows: (volume in thousands) Annual Gross Sales $50 thousand $50 to $100 $100 to 250 Over $250 As of December 31, 2012 or less thousand thousand thousand Total Total District actual number of loans and commitments 305, , ,589 72, ,522 Actual number of loans and commitments to small farmers and ranchers 172,004 57,212 54,166 16, ,918 % of loans and commitments to small farmers and ranchers 56.3% 53.1% 46.1% 22.7% 49.7% Total District loans and commitments $5,915,113 $7,909,830 $18,720,923 $63,230,400 $95,776,266 Loans and commitments to small farmers and ranchers $3,260,076 $4,178,556 $8,341,053 $7,911,676 $23,691,361 % of loan and commitment volume to small farmers and ranchers 55.1% 52.8% 44.6% 12.5% 24.7% 116
119 Information regarding new loans made to small farmers and ranchers follows: (volume in thousands) Annual Gross Sales $50 thousand $50 to $100 $100 to 250 Over $250 For the year ended December 31, 2012 or less thousand thousand thousand Total Total District actual number of new loans and commitments 118,124 33,826 39,078 43, ,309 Actual number of new loans and commitments to small farmers and ranchers 60,108 15,593 13,591 4,733 94,025 % of new loans and commitments to small farmers and ranchers 50.9% 46.1% 34.8% 10.9% 40.1% Total District new loans and commitments $2,116,950 $2,520,316 $6,277,161 $25,985,933 $36,900,360 Total new loans and commitments to small farmers and ranchers $1,055,866 $1,140,045 $2,120,607 $2,584,872 $6,901,390 % of loans and commitments to small farmers and ranchers 49.9% 45.2% 33.8% 9.9% 18.7% 117
120 Risk Factors AgriBank, FCB and Affiliated Associations The following discussion summarizes some of the more important risk factors that we face. This discussion is not exhaustive and there may be other risk factors that we face that are not described below. The risk factors described below, if realized, could negatively or positively affect our business, financial condition and future results of operations. AgriBank, FCB and the other Banks in the Farm Credit System (the System) are liable for the debt of the Farm Credit System. AgriBank, FCB (AgriBank), and each of the other Banks in the Farm Credit System obtain funds for its lending activities and operations primarily from the sale by the Federal Farm Credit Banks Funding Corporation (the Funding Corporation) of Systemwide Debt Securities. The Systemwide Debt Securities are not obligations of and are not guaranteed by the United States of America (U.S.) or any agency or instrumentality thereof, other than the Farm Credit System Banks. Under the Farm Credit Act, each Bank is primarily liable for the portion of the Systemwide Debt Securities issued on its behalf. AgriBank is primarily liable for Systemwide Debt Securities AgriBank has issued. The Banks are also jointly and severally liable for interest payments on certain other debt securities issued individually by other Banks pursuant to Section 4.4(a)(1) of the Farm Credit Act (12 U.S.C. 2155(a)(1)) (the Co-Liability Statute). However, the holders of outstanding subordinated debt that is subject to the Co-Liability Statute waived any right they may have pursuant to the Co-Liability Statute or otherwise to hold other Banks liable for interest payments on such subordinated debt. Additionally, each Bank is jointly and severally liable for the Systemwide Debt Securities issued on behalf of a Bank that is in default on its portion of the Systemwide Debt Securities and where the Farm Credit Insurance Fund (Insurance Fund) of Farm Credit System Insurance Corporation (FCSIC) is insufficient to cure the default. Although the Banks have established a system of mutual covenants and measures that are monitored on a quarterly basis, there is no assurance that these would be sufficient to protect a Bank from liability, should another Bank default and the Insurance Fund be insufficient to cure the default. The Insurance Fund is available from the FCSIC to ensure the timely payment by each Bank of its primary obligations on the Systemwide Debt Securities, and can also be used by the FCSIC for its operating expenses and for other mandatory and permissive purposes. Under the Farm Credit Act, before joint and several liability can be invoked, available amounts in the Insurance Fund would be utilized to make the payment on such obligations. There is no assurance, however, that the Insurance Fund will have sufficient resources to fund a Bank s defaulted payment of principal and interest on its portion of the Systemwide Debt Securities. If the Insurance Fund is insufficient, then the non-defaulting Banks must pay the default amount in proportion to their respective available collateral positions. Available collateral is collateral in excess of the aggregate of each Bank s collateralized obligations and is approximately equal to AgriBank s capital. The FCSIC does not insure any payments on the Series A Preferred Stock or any class of our common stock, preferred stock or subordinated debt. To the extent AgriBank must fund its allocated portion of another Bank s portion of the Systemwide Debt Securities as a result of its default on those securities, its earnings and capital would be reduced, possibly materially. We are subject to regulation under the Farm Credit Act. AgriBank, along with the ACAs, FLCAs, PCAs, FCBs and related service organizations in the System, are subject to regulatory oversight and examination by the Farm Credit Administration (FCA) under the Farm Credit Act. A number of rules and regulations are imposed on the operations of the Banks under the Farm Credit Act. These 118
121 rules and regulations currently include requirements to maintain regulatory capital at or above minimum levels for our permanent capital ratio, total surplus ratio, core surplus ratio and net collateral ratio. Although we currently meet these standards, if we were to fall below the prescribed standards, we would be precluded under the Farm Credit Act and the FCA Regulations from paying patronage refunds or distributions or dividends on our preferred stock. The FCA has broad discretionary authority to bring enforcement actions whenever we fall below these prescribed standards or when the FCA otherwise determines that our capital is insufficient, including, without limitation, the power to issue a capital directive or a cease and desist order. Our funding costs would increase if the Farm Credit System lost its status as a Government Sponsored Entity (GSE). The Farm Credit System is a GSE and, as a member of the System, we benefit from favorable debt-funding costs. Additionally, AgriBank s individual credit ratings are positively impacted by the GSE status of the System. The two largest housing GSEs, Federal National Mortgage Association and Federal Home Loan Mortgage Corporation, have been under increased public and Congressional scrutiny as a result of their significant operating losses and U.S. government efforts to strengthen their capital and provide liquidity for securities they issue. Congressional deliberations over structural reform related to these housing GSEs began in 2011 and are likely to continue for a number of years. The Farm Credit System has not been the subject of specific Congressional scrutiny, nor is it subject to the jurisdiction of the same Congressional committees as the housing GSEs. However, AgriBank believes there is at least some risk that further efforts to regulate GSEs could impact the Farm Credit System s status or erode some of the GSE-related benefits that it currently enjoys, including favorable funding costs and increased funding flexibility. Our funding costs could be negatively impacted by downgrades of the long-term U.S. sovereign credit rating and the Farm Credit System s long-term debt rating. As a member of the System, we have historically benefited from the favorable funding costs and funding flexibility associated with the debt securities issued through the Funding Corporation. AgriBank (as well as the other System Banks) is not legally authorized to accept deposits and therefore cannot use deposits as a funding source. Instead, AgriBank raises funds for its operations primarily through Systemwide Debt Securities issued on AgriBank s behalf by the Funding Corporation. In August 2011, S&P downgraded the long-term sovereign credit rating of the United States from AAA to AA+ with a negative outlook. The credit ratings of GSEs, including the System, are influenced by the sovereign credit rating of the United States. As a result, S&P also lowered its long-term debt rating of the Farm Credit System from AAA to AA+. The ratings of individual System Banks rated by S&P, including AgriBank s, were not affected. The other two major rating agencies, Moody s Investors Service (Moody s) and Fitch Ratings (Fitch), have affirmed the AAA sovereign credit rating of the United States and the AAA rating of the System. However, both Moody s and Fitch have assigned a negative outlook to the U.S. and System ratings. Notwithstanding these actions, to date AgriBank has continued to be able to access the funding necessary to support its lending and business operations. However, such actions and any future downgrades could negatively impact funding costs, earnings and funding flexibility for us and other System institutions. Our funding is dependent upon the Farm Credit System s ability to access the capital markets. The Farm Credit System s primary source of liquidity is the ability to issue Systemwide Debt Securities. This access has provided the Farm Credit System with a dependable source of low cost debt. The Farm Credit System s ability to continue to issue Systemwide Debt Securities depends, in part, on the conditions in the capital markets at that time, which is outside the Farm Credit System s control. As a result, the Farm Credit System cannot make any assurances that it will be able to issue low cost debt or issue any debt at all. If the Farm Credit System cannot issue low cost debt or cannot access the capital markets, the Farm Credit System s 119
122 ability to access funding would be negatively impacted, which would have a negative effect on its financial condition and results of operations, which could be material. We are exposed to credit risk. In the course of our lending and investment activities, we are exposed to credit risk. Credit risk arises from changes in a borrower s or counterparty s ability or willingness to repay funds borrowed or meet agreed-to obligations, changes in collateral values and changes in prevailing economic environments. Some factors that can influence our credit risk exposure include, but are not limited to: a general slowdown in the global economy and the relationship of demand for, and supply of, U.S. agricultural commodities in a global marketplace; political or regulatory changes that disrupt or modify an established market; major international events, including a downturn in the world economy, military conflicts, political disruptions or trade agreements, which can affect, among other things, the price of commodities or products used or sold by our borrowers or their access to markets; continued weakness in the U.S. financial, housing and mortgage markets that may impact the carrying value of certain of our mortgage-related investment securities and the ability of our derivative counterparties to perform under the terms of their contracts; extreme seasonal or weather conditions (such as the current U.S. drought) or market-related risks that significantly affect agricultural production and commodity prices; the deteriorating credit quality or bankruptcy of market participants; changes in technology, regulations or shifts in demographics; changes in financial and credit markets, which could affect our ability to buy and sell loan exposures or issue debt; an outbreak of a wide spread disease in human or livestock/poultry populations; federal subsidies for agriculture that may be reduced or eliminated, including the federal crop insurance program; and environmental conditions or laws impacting our lending activities. We believe we maintain consistent and well-developed underwriting standards and industry-specific lending guidelines which assist in managing credit risk. We also believe we maintain adequate allowance for credit losses inherent in the loan portfolio. Additionally, we are regulated by and believe we comply with standards set by the FCA. We minimize credit risk in our liquidity investment portfolio by investing primarily in securities issued or guaranteed by the U.S. government or one of its agencies. We employ many tools to manage credit risk exposures. While we believe these standards and tools are appropriate to manage our credit risk, there is no assurance that significant deterioration in credit quality will not occur, which would reduce our earnings, possibly materially. We are exposed to interest rate and counterparty risk. In the course of our lending and investment activities, we are subject to interest rate risk, which is defined as the risk of changes to future earnings or long-term market value of equity due to changes in interest rates. Interest rate risk arises from differences in timing between the contractual maturity, repricing characteristics and prepayments of its assets and the contractual maturity and repricing characteristics of the financing obtained to fund these assets. The risk can also arise from differences between the interest rate indices used to price our assets and the indices used to fund those assets. While AgriBank has asset/liability management policies, including risk limits, and strategies to actively manage the District s interest rate risk, including an Asset and Liability Management Committee composed of a cross-functional group of senior leaders, there can 120
123 be no assurance that our interest rate risk management procedures will be effective or that changes in interest rates will not adversely impact our earnings and capital. We fund real estate mortgage loans and purchase mortgage-backed and asset-backed securities that are impacted by interest rates. Changes in interest rates can significantly impact the prepayment patterns of these assets and thus affect its earnings. AgriBank strives to manage or reduce this risk by match-funding debt securities issued to the maturities of its loans and investments and entering into interest-rate derivative transactions, and through the rebalancing of cash-flow mismatches of assets and liabilities. AgriBank s inability to match-fund debt securities to longer term assets may increase the prepayment risks. AgriBank s overall interest rate risk management strategy incorporates the use of derivative financial instruments to enhance liquidity of its funding and to minimize significant unplanned fluctuations in earnings that are caused by interest rate volatility arising from maturity, repricing, prepayment and embedded option mismatches between AgriBank s assets and liabilities. By using derivative instruments, AgriBank is exposed to counterparty credit risk in the event of the failure by a counterparty to fulfill its performance obligations under a derivative contract. To minimize the risk of credit losses, AgriBank has developed credit risk management policies and procedures as well as counterparty credit requirements. AgriBank deals with dealer counterparties that have an investment grade or better credit rating from a major credit rating agency, and AgriBank closely monitors the credit standing and levels of exposure to individual counterparties. In addition, all derivative transactions are governed by master swap agreements, which include netting agreements. AgriBank s master agreements mitigate credit risk by requiring the net settlement of covered contracts with the same counterparty in the event of default by the other party. The net mark-to-market exposure represents the netting of the positive and negative exposures with that counterparty. The credit risk is further mitigated by setting threshold limits on the amount of uncollateralized net exposure to each respective counterparty determined by their credit rating. Collateral is normally exchanged on a weekly basis, but may be exchanged daily if needed. Even though we have a rigorous credit evaluation process and maintain collateral support annexes with AgriBank s derivative counterparties, the failure of a counterparty to perform on its obligations could reduce AgriBank s earnings. Furthermore, although AgriBank s credit evaluations take into account the possibility of default by a counterparty, AgriBank s ultimate exposure to a default by a counterparty could be greater than AgriBank s credit evaluation predicts. We are exposed to risks associated with the agricultural industry. We are chartered to make loans as provided in the Farm Credit Act. Due to these statutory provisions, we have a significant concentration of lending to agricultural concerns. Earnings, loan growth and the credit quality of our lending portfolio can be impacted significantly by the general state of the agricultural economy. Regional agricultural economies within our territory can be impacted by weather, domestic and international demand for food and other agricultural products and other factors. Extreme seasonal conditions can substantially impact grain harvests and commodity prices and, ultimately, impact the credit quality of agricultural borrowers. The current severe drought conditions encompassing much of the U.S. may significantly impact grain harvests resulting in lower stock levels and higher, more volatile commodity prices, all of which may negatively impact the credit quality of our borrowers as well as our participations as their earnings are pressured or reduced. Although a substantial portion of the crop losses resulting from the drought conditions are expected to be covered by crop insurance, to the extent weather adversely impacts the agricultural sector, the risk of loss in our loan portfolio may increase, which could reduce our earnings. Furthermore, the U.S. agricultural sector receives significant financial support from the U.S. government through payments authorized under federal legislation. While U.S. government support for agriculture has historically remained consistent, there is no assurance that such financial support will remain at current levels. 121
124 The significant reduction or elimination of such support programs would have a negative impact on the credit quality of certain borrowers. As a result, our earnings could be reduced, possibly materially. Due to volatile domestic and international demand for corn, wheat and soybeans, adverse weather events and a number of other factors, prices for these commodities and the volatility of those prices have remained higher than historic norms. Higher prices for grain commodities will positively impact the profitability of farmers engaged in the production of these commodities. Additionally, sustained increases in grain and oilseeds prices result in higher feed costs, which negatively impact our customers in the livestock sector (poultry, pork and beef). Continued high prices for feed and the inability to pass these cost increases along to consumers could increase credit risk, which could result in a higher level of nonaccrual loans and charge-offs, and our earnings could be reduced, possibly materially. Finally, sustained increases in corn prices result in higher input costs for the ethanol industry. To the extent that these increases are not followed by increases in the prices received for this gasoline additive, the profitability of our customers engaged in this industry would be reduced. In addition, withdrawal of government support for the ethanol industry in the form of mandates may decrease demand for ethanol. Both of these factors could increase credit risk, which may result in a higher level of nonaccrual loans and chargeoffs, and our earnings could be reduced, possibly materially. We may lend only to qualified borrowers in the agricultural and rural sectors and certain related entities and are subject to geographic lending restrictions. Unlike commercial banks and other financial institutions that lend to both the agricultural sector and other sectors of the economy, we are restricted solely to making loans and providing financial services to qualified, eligible borrowers in the agricultural and rural sectors and to certain related entities. In addition, we are subject to certain geographic lending restrictions. As a result, we do not have as much flexibility in attempting to diversify our loan portfolios as compared to commercial banks and other financial institutions. This concentration may limit our ability to offset adverse performance in one sector against positive performance in another sector like most diversified financial institutions. AgriBank is exposed to risks associated with its investments. AgriBank maintains a liquidity plan covering certain contingencies in the event AgriBank s access to normal funding mechanisms is not available. AgriBank purchases only high credit quality investments to best position its investment portfolio to be readily marketable and available to serve as a source of funding in the event of disruption of AgriBank s normal funding mechanisms. AgriBank s liquidity investment portfolio can also be used as collateral to borrow funds to meet obligations. A substantial portion of AgriBank s investments were rated AAA or its equivalent by the major credit rating agencies. The majority of AgriBank s investment portfolio consists of securities issued or guaranteed by GSEs or the U.S. government, which remain liquid. The remainder of AgriBank s investment portfolio represents investments in commercial paper, Federal funds, certificates of deposit, asset-backed securities, and nonagency mortgage-backed securities. In further support of AgriBank s liquidity, AgriBank has cash on deposit at the Federal Reserve Bank. In the past few years, the mortgage-backed securities and asset-backed securities markets have experienced considerable stress and reduced liquidity. Although this reduced liquidity has resulted primarily from investor concerns arising from increased delinquencies and foreclosures on subprime mortgage loans and the failure of several subprime and Alt-A mortgage lenders, it has not been limited solely to securities backed by those types of mortgage loans. Accordingly, if the markets for AgriBank s investments become less liquid, it may make it difficult for us to sell such investments if the need arises. In addition, because of the inherent uncertainty of 122
125 determining the fair value of investments that do not have a readily available market value, the fair value of AgriBank s investments may differ significantly from the values that would have been used had a liquid market existed for the investments. We are subject to legal proceedings and legal compliance risks. We are subject to a variety of legal proceedings and legal compliance risks. We are at times reviewed by the FCA and other governmental authorities, which could lead to enforcement actions, fines and penalties or the assertion of private litigation claims and damages. While we believe that we have adopted appropriate risk management and compliance programs, legal and compliance risks will continue to exist and additional legal proceedings and other contingencies, the outcome of which cannot be predicted with certainty, will arise from time to time. We are subject to reputational risk. Reputation risk is the risk to earnings and capital arising from negative public opinion. Such risk encompasses the loss of confidence, trust and esteem among customers, investors, partners, policymakers, shareholders and other key stakeholders. Like all businesses, we are subject to a wide variety of reputation risks both within and outside our control, including credit difficulties with individual customers or industries, business disputes, lawsuits, credit market disruptions, regulatory events and public allegations of misconduct against associates. As a member of the System, we could also be indirectly impacted by events that damage the reputation of another System entity. The Board of Directors and our management regard our reputation as a critical asset and have implemented a number of policies, procedures and programs to ensure it is well protected. If market interest rates move contrary to our interest rate risk position, our earnings and the net present value of our interest-sensitive assets and liabilities will be adversely affected. We realize income primarily from the spread between interest earned on our loans and investments and the interest paid on borrowings. Also, it is expected that we will from time to time incur interest rate risk in the form of gaps in the interest rate sensitivities of our assets and liabilities, meaning that either our interestbearing liabilities will be more sensitive to changes in market interest rates than our interest earning assets, or vice versa. In either event, if market interest rates should move contrary to our position, the gap will adversely affect earnings and the net present value of our interest-sensitive assets and liabilities. We face intense competition from competitors, many of whom are substantially larger and have more capital and other resources than AgriBank and its affiliated Associations. We face intense competition, primarily from mortgage banking companies, commercial banks, thrift institutions, insurance companies and finance companies. Many of these competitors in the financial services business are substantially larger and have more capital and other resources than AgriBank and its affiliated Associations. Our future results may become increasingly sensitive to fluctuations in the volume and cost of their retail lending activities resulting from competition from other lenders and purchasers of loans. There can be no assurance that we will be able to continue to compete successfully in the markets served. 123
126 An unfavorable change in U.S. tax laws or an adverse interpretation of existing tax laws could negatively impact our financial results. AgriBank and FLCAs are statutorily exempt from Federal taxes. Certain Associations affiliates operate as nonexempt cooperatives. As such, they are eligible, under Subchapter T of the Internal Revenue Code (the Code), to deduct or exclude from taxable income amounts determined to be qualified patronage dividends. A change in U.S. tax law or an adverse interpretation of existing tax laws in a manner that reduces or eliminates these tax benefits or that is different from our application of such laws would negatively impact our results of operations. If the FCA promulgates reforms for System institutions that are similar to those provided for other financial institutions in the Dodd-Frank Act or promulgates a capital tier framework similar to the capital tiers and related requirements set forth in the Basel Accord or Basel III or regulations of other U.S. banking regulators, such actions could adversely impact System Banks and Associations, including AgriBank and affiliated Associations. The Dodd-Frank Wall Street Reform and Consumer Protection Act (the Dodd-Frank Act) was signed into law on July 21, Under the Dodd-Frank Act, the federal banking agencies, the SEC, the Commodity Futures Trading Commission and a variety of other regulatory agencies are required to adopt a broad range of new rules and regulations that will significantly reform the supervision and regulation of the financial services industry. These federal agencies have been given significant discretion in drafting and implementing rules and regulations which are still being finalized, and consequently, much of the impact of the Dodd-Frank Act may not be known for many months or perhaps years. The Dodd-Frank Act largely preserves the authority of the FCA as the Farm Credit System s regulator by excluding System institutions from certain of the law s provisions. Although the Farm Credit System appears to be largely unaffected by the Dodd-Frank Act, it is possible that the FCA might choose to adopt by regulation some reforms for System institutions that are similar to those provided for other financial institutions in the Dodd-Frank Act. Should the FCA adopt similar reforms, it is not clear to what extent, if any, such reforms would impact System Banks (such as AgriBank) and their stockholders. Additionally, the Basel Committee on Banking Supervision (the Basel Committee) released consultative proposals in December 2009 aimed at strengthening global capital and liquidity regulations. The Basel Committee adopted revised versions of the consultative proposals as definitive frameworks in December 2010, and made further revisions in June 2011 and January This framework is often referred to as Basel III. In June 2012, the U.S. banking agencies released notices of proposed rulemakings that would substantially amend their regulatory capital requirements to, among other things, implement Basel III in the United States. On July 8, 2010, the FCA published an Advance Notice of Proposed Rulemaking (ANPR) in the Federal Register, requesting comments as to whether the FCA should replace the existing regulatory capital requirements with a capital tier framework similar to the capital tiers and related requirements set forth in the Basel Accord (Basel I) that other federal financial regulatory agencies have adopted. In the ANPR, the FCA stated that it was important for the agency to consider the Basel III framework because the other federal financial regulatory agencies were members of the Basel Committee and had encouraged the public to review and comment on the Basel III proposal. The FCA asked commenters on the ANPR to review and consider the Basel III proposal. The FCA has not published a Notice of Proposed Rulemaking or engaged in further rulemaking since publishing the ANPR. 124
127 AgriBank Affiliated Associations as of January 1, st Farm Credit Services, ACA 2000 Jacobssen Drive Normal, IL (309) Hwww.1stfarmcredit.com AgCountry Farm Credit Services, ACA th Street South Fargo, ND (701) Hwww.agcountry.com AgHeritage Farm Credit Services, ACA 119 East Third Street, Suite 200 Little Rock, AR (800) Hwww.agheritagefcs.com AgStar Financial Services, ACA 1921 Premier Drive Mankato, MN (507) Hwww.agstar.com Badgerland Financial, ACA 1430 North Ridge Drive Prairie du Sac, WI (800) Hwww.badgerlandfcs.com Delta Agricultural Credit Association 118 E. Speedway Dermott, AR (870) Farm Credit Midsouth, ACA 3000 Prosperity Drive Jonesboro, AR (870) Hwww.farmcreditmidsouth.com Farm Credit Services of America, ACA 5015 South 118 th Street Omaha, NE (402) Hwww.fcsamerica.com Farm Credit Services of Mandan, ACA 1600 Old Red Trail Mandan, ND (701) Hwww.farmcreditmandan.com Farm Credit Mid-America, ACA 1601 UPS Drive Louisville, KY (502) Hwww.e-farmcredit.com Farm Credit Services of North Dakota, ACA th Street SW Minot, ND (701) Hwww.farmcreditnd.com Farm Credit Services of Western Arkansas, ACA 3115 W. 2 nd Court Russellville, AR (479) Hwww.myaglender.com FCS Financial, ACA 1934 East Miller Street Jefferson City, MO (573) Hwww.farmcreditofmissouri.com GreenStone Farm Credit Services, ACA 3515 West Road East Lansing, MI (800) Hwww.greenstonefcs.com Progressive Farm Credit Services, ACA 1116 N. Main Street Sikeston, MO (573) Hwww.progressivefcs.com United FCS, ACA 4401 Highway 71 South Willmar, MN (320) Farm Credit Services of Illinois, ACA 1100 Farm Credit Drive Mahomet, IL (217) Federal Farm Credit Banks Funding Corporation 10 Exchange Place, Suite 1401 Jersey City, New Jersey (201) Hwww.farmcredit-ffcb.com
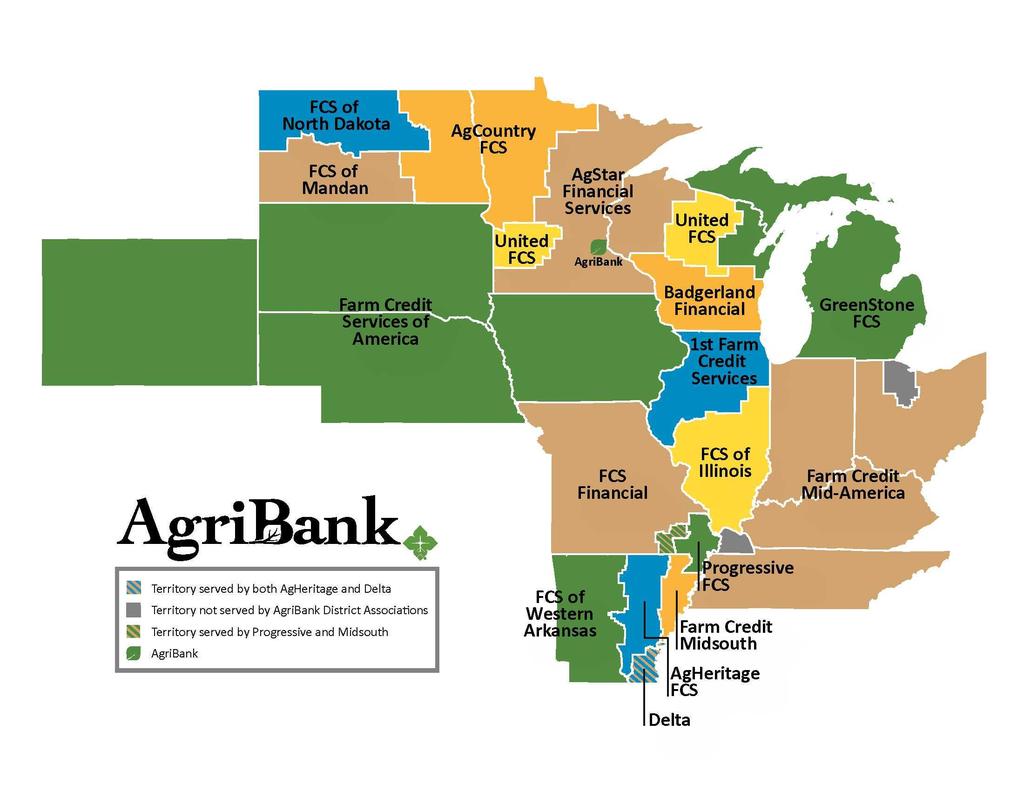
128
129 Notes
130 Notes
131 Notes


132 AgriBank, FCB and Affiliated Associations 30 E. 7 th Street, Suite 1600 St. Paul, MN
District Connected District Annual Report AgriBank, FCB and Affiliated Associations
 District Connected 2013 District Annual Report AgriBank, FCB and Affiliated Associations TABLE OF CONTENTS AgriBank, FCB and Affiliated Associations Combined Five-Year Summary of Selected Financial Data...
Increase (Decrease) in For the nine months ended September 30, Net Income
 in For the nine months ended September 30, Net Income") Copies of quarterly and annual reports are available upon request by contacting AgriBank, FCB, 30 E. 7th Street, Suite 1600, St. Paul, MN 55101 or by calling (651) 282-8800. Reports are also available
Copies of quarterly and annual reports are available upon request by contacting AgriBank, FCB, 30 E. 7th Street, Suite 1600, St. Paul, MN 55101 or by calling (651) 282-8800. Reports are also available
Increase (decrease) in For the six months ended June 30, net income
 in For the six months ended June 30, net income") Copies of quarterly and annual reports are available upon request by contacting AgriBank, FCB, 30 E. 7th Street, Suite 1600, St. Paul, MN 55101 or by calling (651) 282-8800. Reports are also available
Copies of quarterly and annual reports are available upon request by contacting AgriBank, FCB, 30 E. 7th Street, Suite 1600, St. Paul, MN 55101 or by calling (651) 282-8800. Reports are also available
Harnessing Our Strengths. Redefining Tomorrow. SEPTEMBER 30, 2012 QUARTERLY REPORT
 Harnessing Our Strengths. Redefining Tomorrow. SEPTEMBER 30, 2012 QUARTERLY REPORT Copies of quarterly and annual reports are available upon request by contacting AgriBank, FCB, 30 E. 7th Street, Suite
FOCUS ON FUNDAMENTALS. Strength and Stability for Farm Credit Associations
 FOCUS ON FUNDAMENTALS Strength and Stability for Farm Credit Associations AGRIBANK DISTRICT 2018 QUARTERLY REPORT JUNE 30, 2018 AGRIBANK, FCB AND DISTRICT ASSOCIATIONS FA R M C R E D I T B A N K Copies
MISSION POSSIBLE. Supporting Farm Credit Associations that serve rural communities and agriculture.
 MISSION POSSIBLE Supporting Farm Credit Associations that serve rural communities and agriculture. AGRIBANK DISTRICT 2017 QUARTERLY REPORT SEPTEMBER 30, 2017 AGRIBANK, FCB AND DISTRICT ASSOCIATIONS FA
FOCUS ON FUNDAMENTALS. Strength and Stability for Farm Credit Associations
 FOCUS ON FUNDAMENTALS Strength and Stability for Farm Credit Associations AGRIBANK 2018 QUARTERLY REPORT MARCH 31, 2018 FA R M C R E D I T B A N K Copies of Quarterly and Annual Reports are available upon
FOCUS ON FUNDAMENTALS. Strength and Stability for Farm Credit Associations
 FOCUS ON FUNDAMENTALS Strength and Stability for Farm Credit Associations AGRIBANK 2018 QUARTERLY REPORT SEPTEMBER 30, 2018 FA R M C R E D I T B A N K Copies of Quarterly and Annual Reports are available
2018 Annual Report Delta Agricultural Credit Association
 2018 Annual Report Delta Agricultural Credit Association TABLE OF CONTENTS Delta Agricultural Credit Association CONSOLIDATED FIVE-YEAR SUMMARY OF SELECTED FINANCIAL DATA... 1 MANAGEMENT S DISCUSSION AND
FOCUS ON FUNDAMENTALS. Strength and Stability for Farm Credit Associations
 FOCUS ON FUNDAMENTALS Strength and Stability for Farm Credit Associations AGRIBANK DISTRICT 2018 QUARTERLY REPORT SEPTEMBER 30, 2018 AGRIBANK, FCB AND DISTRICT ASSOCIATIONS FA R M C R E D I T B A N K Copies
AgriBank, FCB and Affiliated Associations
 Quarterly Report June 30, 2007 Copies of quarterly and annual reports are available upon request by contacting AgriBank, FCB, 375 Jackson Street, St. Paul, Minnesota 55101-1810 or by calling (651) 282-8800.
Q UA R T E R LY R E P O R T MARCH
 QUARTERLY REPORT MARCH 31, 2010 Copies of quarterly and annual reports are available upon request by contacting AgriBank, FCB, 375 Jackson Street, St. Paul, Minnesota 55101-1810 or by calling (651) 282-8800.
AgriBank, FCB and Affiliated Associations
 Quarterly Report June 30, 2005 Copies of quarterly and annual reports are available upon request by contacting AgriBank, FCB, 375 Jackson Street, St. Paul, Minnesota 55101-1810 or by calling (651) 282-8800.
AgCountry Farm Credit Services, ACA
 Quarterly Report March 31, 2016 MANAGEMENT'S DISCUSSION AND ANALYSIS The following commentary reviews the consolidated financial condition and consolidated results of operations of (the parent) and AgCountry
We Understand. annual report
 We Understand annual report TABLE OF CONTENTS Farm Credit Services of Illinois, ACA Message from the Chairperson of the Board and Chief Executive Officer 1 Consolidated Five-Year Summary of Selected Financial
AgriBank, FCB. Quarterly Report September 30, 2007 MANAGEMENT'S DISCUSSION AND ANALYSIS
 Quarterly Report September 30, 2007 Copies of quarterly and annual reports are available upon request by contacting, 375 Jackson Street, St. Paul, Minnesota 55101-1810 or by calling (651) 282-8800. Reports
2017 Annual Report. Farm Credit Services of North Dakota, ACA
 2017 Annual Report Farm Credit Services of North Dakota, ACA TABLE OF CONTENTS Farm Credit Services of North Dakota, ACA MESSAGE FROM THE CHIEF EXECUTIVE OFFICER... 1 CONSOLIDATED FIVE-YEAR SUMMARY OF
Farm Credit Services of Mandan, ACA
 Quarterly Report June 30, 2016 MANAGEMENT'S DISCUSSION AND ANALYSIS The following commentary reviews the consolidated financial condition and consolidated results of operations of (the parent) and Farm
Farm Credit Services of Mandan, ACA
 Quarterly Report June 30, 2018 MANAGEMENT'S DISCUSSION AND ANALYSIS The following commentary reviews the consolidated financial condition and consolidated results of operations of and its subsidiaries
AGFIRST FARM CREDIT BANK & DISTRICT ASSOCIATIONS
 AGFIRST FARM CREDIT BANK & DISTRICT ASSOCIATIONS 2018 FINANCIAL INFORMATION 2018 Financial Information INTRODUCTION AND DISTRICT OVERVIEW The following commentary reviews the Combined Financial Statements
CENTURY. Over a. of Support
 2016 ANNUAL REPORT Over a CENTURY of Support In 2016, Farm Credit celebrated 100 years of supporting rural communities and agriculture with reliable, consistent credit and financial services. We ve been
Message from the Chairman of the Board and the Chief Executive Officer
 Message from the Chairman of the Board and the Chief Executive Officer Colonial Farm Credit continued its mission of supporting rural communities and agriculture with reliable, consistent credit and financial
Farm Credit Services of Western Arkansas, ACA
 Quarterly Report September 30, 2017 MANAGEMENT'S DISCUSSION AND ANALYSIS The following commentary reviews the consolidated financial condition and consolidated results of operations of Farm Credit Services
Farm Credit Services of Mandan, ACA
 Quarterly Report March 31, 2018 MANAGEMENT'S DISCUSSION AND ANALYSIS The following commentary reviews the consolidated financial condition and consolidated results of operations of and its subsidiaries
CoBank District 2016 Financial Information
 CoBank District 2016 Financial Information Introduction and District Overview CoBank, ACB (CoBank, the Bank, we, our, or us) is one of the four banks of the Farm Credit System (System) and provides loans,
Farm Credit Services of Mandan, ACA
 Quarterly Report September 30, 2018 MANAGEMENT'S DISCUSSION AND ANALYSIS The following commentary reviews the consolidated financial condition and consolidated results of operations of and its subsidiaries
2013 ANNUAL REPORT FARM CREDIT OF WESTERN OKLAHOMA, ACA
 2013 ANNUAL REPORT FARM CREDIT OF WESTERN OKLAHOMA, ACA Five-Year Summary of Selected Consolidated Financial Data (Dollars in Thousands) December 31 2013 2012 2011 2010 2009 Statement of Condition Data
2015 ANNUAL REPORT FARM CREDIT OF WESTERN OKLAHOMA, ACA
 2015 ANNUAL REPORT FARM CREDIT OF WESTERN OKLAHOMA, ACA Five-Year Summary of Selected Consolidated Financial Data (Dollars in Thousands) December 31 2015 2014 2013 2012 2011 Statement of Condition Data
Quarterly Report September 30, 2018
 Quarterly Report September 30, 2018 MANAGEMENT'S DISCUSSION AND ANALYSIS The following commentary reviews the consolidated financial condition and consolidated results of operations of and its subsidiaries
2018 SECOND QUARTER REPORT
 2018 SECOND QUARTER REPORT SECOND QUARTER 2018 Table of Contents Report on Internal Control Over Financial Reporting... 2 Management s Discussion and Analysis of Financial Condition and Results of Operations...
2nd QUARTER REPORT
 2nd QUARTER REPORT 2018 1 MANAGEMENT S DISCUSSION AND ANALYSIS OF FINANCIAL CONDITION AND RESULTS OF OPERATIONS (Dollars in Thousands, Except as Noted) (Unaudited) The following discussion summarizes the
Farm Credit Services of Western Arkansas, ACA
 Quarterly Report March 31, 2018 MANAGEMENT'S DISCUSSION AND ANALYSIS The following commentary reviews the consolidated financial condition and consolidated results of operations of Farm Credit Services
Farm Credit Southeast Missouri, ACA
 Quarterly Report June 30, 2018 MANAGEMENT'S DISCUSSION AND ANALYSIS The following commentary reviews the consolidated financial condition and consolidated results of operations of and its subsidiaries
Farm Credit Services of Mandan, ACA
 Farm Credit Services of Mandan, ACA 2017 ANNUAL REPORT TABLE OF CONTENTS Farm Credit Services of Mandan, ACA MESSAGE FROM THE CHIEF EXECUTIVE OFFICER... 1 CONSOLIDATED FIVE-YEAR SUMMARY OF SELECTED FINANCIAL
Delta Agricultural Credit Association
 Quarterly Report June 30, 2018 MANAGEMENT'S DISCUSSION AND ANALYSIS The following commentary reviews the consolidated financial condition and consolidated results of operations of and its subsidiaries,
Quarterly Report June 30, 2018
 Quarterly Report June 30, 2018 MANAGEMENT'S DISCUSSION AND ANALYSIS The following commentary reviews the consolidated financial condition and consolidated results of operations of and its subsidiaries
2016 ANNUAL REPORT. Here to Help you Grow. Farm Credit Services of Mandan, ACA
 2016 ANNUAL REPORT Here to Help you Grow Farm Credit Services of Mandan, ACA www.farmcreditmandan.com TABLE OF CONTENTS Farm Credit Services of Mandan, ACA MESSAGE FROM THE CHIEF EXECUTIVE OFFICER... 1
Farm Credit Southeast Missouri, ACA
 Quarterly Report September 30, 2018 MANAGEMENT'S DISCUSSION AND ANALYSIS The following commentary reviews the consolidated financial condition and consolidated results of operations of and its subsidiaries
Colonial Farm Credit, ACA FIRST QUARTER Paul B. Franklin, Sr. Chief Executive Officer. Diane S. Fowlkes Chief Financial Officer
 Colonial Farm Credit, ACA FIRST QUARTER 2018 TABLE OF CONTENTS Report on Internal Control Over Financial Reporting... 2 Management s Discussion and Analysis of Financial Condition and Results of Operations...
Progressive Farm Credit Services, ACA
 Quarterly Report September 30, 2016 MANAGEMENT'S DISCUSSION AND ANALYSIS The following commentary reviews the consolidated financial condition and consolidated results of operations of (the parent) and
2018 THIRD QUARTER REPORT
 2018 THIRD QUARTER REPORT THIRD QUARTER 2018 Table of Contents Report on Internal Control Over Financial Reporting... 2 Management s Discussion and Analysis of Financial Condition and Results of Operations...
Farm Credit Midsouth, ACA 3000 Prosperity Drive Jonesboro, Arkansas Visit us at
 2013 Annual Report TABLE OF CONTENTS Farm Credit Midsouth, ACA MESSAGE FROM THE CHIEF EXECUTIVE OFFICER... 1 CONSOLIDATED FIVE-YEAR SUMMARY OF SELECTED FINANCIAL DATA... 2 MANAGEMENT S DISCUSSION AND ANALYSIS...
Farm Credit Midsouth, ACA
 Quarterly Report March 31, 2014 MANAGEMENT'S DISCUSSION AND ANALYSIS The following commentary reviews the consolidated financial condition and consolidated results of operations of (the parent) and Farm
Quarterly Report March 31, 2017
 Quarterly Report March 31, 2017 MANAGEMENT'S DISCUSSION AND ANALYSIS The following commentary reviews the consolidated financial condition and consolidated results of operations of Farm Credit Mid-America,
Progressive Farm Credit Services, ACA
 Quarterly Report June 30, 2017 MANAGEMENT'S DISCUSSION AND ANALYSIS The following commentary reviews the consolidated financial condition and consolidated results of operations of and its subsidiaries
TABLE OF CONTENTS Progressive Farm Credit Services, ACA
 TABLE OF CONTENTS Progressive Farm Credit Services, ACA MESSAGE FROM THE CHIEF EXECUTIVE OFFICER... 1 CONSOLIDATED FIVE-YEAR SUMMARY OF SELECTED FINANCIAL DATA... 2 MANAGEMENT S DISCUSSION AND ANALYSIS...
AgriBank, FCB. Amended Quarterly Report September 30, 2009 MANAGEMENT'S DISCUSSION AND ANALYSIS
 AgriBank, FCB Amended Quarterly Report September 30, 2009 Copies of quarterly and annual reports are available upon request by contacting AgriBank, FCB, 375 Jackson Street, St. Paul, Minnesota 55101-1810
Quarterly Report June 30, 2017
 Quarterly Report June 30, 2017 MANAGEMENT'S DISCUSSION AND ANALYSIS The following commentary reviews the consolidated financial condition and consolidated results of operations of Farm Credit Mid-America,
Quarterly Report March 31, 2018
 Quarterly Report March 31, 2018 MANAGEMENT'S DISCUSSION AND ANALYSIS The following commentary reviews the consolidated financial condition and consolidated results of operations of and its subsidiaries
2018 THIRD QUARTER STOCKHOLDERS REPORT
 2018 THIRD QUARTER STOCKHOLDERS REPORT MANAGEMENT S DISCUSSION AND ANALYSIS OF FINANCIAL CONDITION AND RESULTS OF OPERATIONS (Unaudited) The following discussion summarizes the financial position and results
Farm Credit. Partners. Opportunity. Setting the standard. Annual Report for rural community support. Western Oklahoma.
 Farm Credit Western Oklahoma Setting the standard for rural community support Annual Report - 2017 www.farmcreditloans.com Partners Opportunity Five-Year Summary of Selected Consolidated Financial Data
QUARTERLY REPORT TO STOCKHOLDERS
 QUARTERLY REPORT TO STOCKHOLDERS As of September 30, 2017 Page 1 of 17 American AgCredit, ACA The shareholders investment in American AgCredit, ACA is materially affected by the financial condition and
ANNUAL REPORT LENDING SUPPORT FOR GENERATIONS
 2015 ANNUAL REPORT LENDING SUPPORT FOR GENERATIONS RIVER VALLEY AGCREDIT, ACA 2015 ANNUAL REPORT Contents Message from the President... 2 Report of Management... 3 Report on Internal Control Over Financial
FARM CREDIT SERVICES SOUTHWEST
 FARM CREDIT SERVICES SOUTHWEST 2014 Annual Report Table of Contents Chairman and President s Letter 1 Five Year Summary of Selected Financial Data 3 Management s Discussion and Analysis of Financial Condition
NOTICE. Oklahoma AgCredit, ACA 601 East Kenosha St. Broken Arrow, Oklahoma
 Stea NOTICE The shareholders investment in Oklahoma AgCredit, ACA is materially affected by the financial condition and results of operations of CoBank, ACB, (CoBank). The 2017 CoBank Annual Report to
QUARTERLY REPORT TO STOCKHOLDERS
 QUARTERLY REPORT TO STOCKHOLDERS AS OF JUNE 30, 2018 The shareholders investment in American AgCredit, ACA is materially affected by the financial condition and results of operations of CoBank. The CoBank
Value through. InnovatioN. AgFirst Farm Credit Bank. Third Quarter 2015 Quarterly Report
 Value through InnovatioN AgFirst Farm Credit Bank Third Quarter 2015 Quarterly Report THIRD QUARTER 2015 Table of Contents Report on Internal Control Over Financial Reporting... 2 Management s Discussion
Farm Credit of Western Oklahoma, ACA
 Farm Credit of Western Oklahoma, ACA Quarterly Report June 30, 2018 The shareholders investment in Farm Credit of Western Oklahoma, ACA is materially affected by the financial condition and results of
Quarterly Report September 30, 2017
 Quarterly Report September 30, 2017 MANAGEMENT'S DISCUSSION AND ANALYSIS The following commentary reviews the consolidated financial condition and consolidated results of operations of Farm Credit Mid-America,
Farm Credit Services of North Dakota, ACA
 Quarterly Report March 31, 2018 MANAGEMENT'S DISCUSSION AND ANALYSIS The following commentary reviews the consolidated financial condition and consolidated results of operations of and its subsidiaries
QUARTERLY REPORT TO STOCKHOLDERS
 QUARTERLY REPORT TO STOCKHOLDERS As of March 31, 2017 Page 1 of 15 American AgCredit, ACA The shareholders investment in American AgCredit, ACA is materially affected by the financial condition and results
AGFIRST FARM CREDIT BANK & DISTRICT ASSOCIATIONS
 AGFIRST FARM CREDIT BANK & DISTRICT ASSOCIATIONS 2018 THIRD QUARTER REPORT THIRD QUARTER 2018 Table of Contents Report on Internal Control Over Financial Reporting... 2 Management s Discussion and Analysis
TABLE OF CONTENTS. Progressive Farm Credit Services, ACA
 TABLE OF CONTENTS Progressive Farm Credit Services, ACA MESSAGE FROM CHIEF EXECUTIVE OFFICER... 3 CONSOLIDATED FIVE-YEAR SUMMARY OF SELECTED FINANCIAL DATA... 4 MANAGEMENT S DISCUSSION AND ANALYSIS...
Third Quarter 2016 Report to Shareholders Farm Credit West
 Third Quarter 2016 Report to Shareholders Farm Credit West 1478 Stone Point Drive, Suite 450 Roseville, CA 95661 Voice: 916-780-1166 Fax: 916-780-1820 Website: www.farmcreditwest.com Management s Discussion
Second Quarter 2016 Report to Shareholders Farm Credit West
 Second Quarter 2016 Report to Shareholders Farm Credit West 1478 Stone Point Drive, Suite 450 Roseville, CA 95661 Voice: 916-780-1166 Fax: 916-780-1820 Website: www.farmcreditwest.com Management s Discussion
Farm Credit of Southern Colorado Second Quarter Report to Shareholders. As of June 30, 2018 (unaudited)
") 20 18 Farm Credit of Southern Colorado Second Quarter Report to Shareholders As of June 30, 2018 (unaudited) NOTICE TO STOCKHOLDERS The shareholders investment in Farm Credit of Southern Colorado, ACA
20 18 Farm Credit of Southern Colorado Second Quarter Report to Shareholders As of June 30, 2018 (unaudited) NOTICE TO STOCKHOLDERS The shareholders investment in Farm Credit of Southern Colorado, ACA
QUARTERLY REPORT TO STOCKHOLDERS
 QUARTERLY REPORT TO STOCKHOLDERS As of March 31, 2018 Page 1 of 16 American AgCredit, ACA The shareholders investment in American AgCredit, ACA is materially affected by the financial condition and results
AgCountry Farm Credit Services, ACA
 AgCountry Farm Credit Services, ACA Quarterly Report September 30, 2017 MANAGEMENT'S DISCUSSION AND ANALYSIS The following commentary reviews the consolidated financial condition and consolidated results
ANNUAL REPORT. Any way you slice it, your cooperative is Enriching rural life.
 2017 ANNUAL REPORT Any way you slice it, your cooperative is Enriching rural life. OUR PORTFOLIO FARM CREDIT of WESTERN ARKANSAS YOUR FINANCIAL POULTRY & EGGS 31.0% COOPERATIVE BEEF CATTLE 17.6% PART-TIME
SRC Annual Summary of Agricultural Conditions
 SRC Annual Summary of Agricultural Conditions The Division of Supervision, Regulation, and Credit at the Federal Reserve Bank of Minneapolis conducts an annual survey of Ninth District state member banks
FIRST SOUTH FARM CREDIT, ACA 2017 ANNUAL REPORT
 FIRST SOUTH FARM CREDIT, ACA 2017 ANNUAL REPORT Contents Message from the Chief Executive Officer... 2-3 Report of Management... 4 Report on Internal Control Over Financial Reporting... 5 Consolidated
The Farm Credit System
 The Farm Credit System REGINA GILL VP INVESTOR RELATIONS FEDERAL FARM CREDIT BANKS FUNDING CORPORATION DECEMBER 2017 12/01/17 OVERVIEW OF THE SYSTEM Created by an Act of Congress (1916) Government Sponsored
Macroeconomic Outlook for U.S. Agriculture
 Macroeconomic Outlook for U.S. Agriculture Nathan Kauffman Omaha Branch Executive and Economist Federal Reserve Bank of Kansas City May 18, 216 The views expressed are those of the author and do not necessarily
2007 ANNUAL REPORT FIRST SOUTH FARM CREDIT, ACA
 FIRST SOUTH FARM CREDIT, ACA 2007 ANNUAL REPORT Contents Message from the Chief Executive Officer...3 Report of Management...4 Consolidated Five-Year Summary of Selected Financial Data...5 Management s
2017 Quarterly Report SEPTEMBER 30, 2017
 2017 Quarterly Report SEPTEMBER 30, 2017 Dear CoBank Customer-Owner: We re pleased to report that CoBank recorded solid financial performance in the third quarter of 2017. Though quarterly net income declined
DETERMINING THE APPROPRIATE CAPITAL LEVEL FOR FARM CREDIT MID- AMERICA NATHAN W. PERRY. B.S., University of Tennessee, 2004 A THESIS
 DETERMINING THE APPROPRIATE CAPITAL LEVEL FOR FARM CREDIT MID- AMERICA by NATHAN W. PERRY B.S., University of Tennessee, 2004 A THESIS Submitted in partial fulfillment of the requirements for the degree
Farm Finance Update. Nate Kauffman Omaha Branch Executive and Economist Federal Reserve Bank of Kansas City. March 17, 2017
 Farm Finance Update March 17, 2017 Nate Kauffman Omaha Branch Executive and Economist Federal Reserve Bank of Kansas City The views expressed are those of the author and do not necessarily reflect the
2017 Annual Report AgCountry Farm Credit Services, ACA
 2017 Annual Report AgCountry Farm Credit Services, ACA AgCountry Farm Credit Services Board of Directors Back Row Standing: (left to right) William Muhs, Michael Zenker, Greg Nelson, Leif Aakre (Chairman),
2014 ANNUAL REPORT COLONIAL FARM CREDIT, ACA
 Board of Directors Colonial Farm Credit board members gather around a tree planted in memory of former board member Fred Richardson. Front Row (from the left) Forrest C. Nuckols, L. Wayne Kirby, John N.
Agricultural FINANCE Monitor
 Agricultural FINANCE Monitor agricultural credit conditions in the Eighth Federal Reserve District 2014 Fourth Quarter The eleventh quarterly survey of agricultural credit conditions was conducted by the
Click to edit Master title style. Credit Analysis. Assessing the Risk Profile of a. Pork Production Company
 Credit Analysis Assessing the Risk Profile of a Pork Production Company By: Lee Fuchs FCS Financial 2009 Pork Management Conference May 2009 * * 1 ACB Farm Credit System Structure Farm Credit System Insurance
2012 Annual Report December 31, 2012
 2012 Annual Report December 31, 2012 Part of the Farm Credit System Dear Legacy Stockholders: Letter from the Chairman and the President/CEO As yet another year passes, let us pause to reflect on the achievements
Indicators of the Kansas Economy
 Governor s Council of Economic Advisors Indicators of the Kansas Economy A Review of Economic Trends and the Kansas Economy 1000 S.W. Jackson St. Suite 100 Topeka, KS 66612-1354 Phone: (785) 296-0967 Fax:
Here For You. Here For Good.
 Here For You. Here For Good. Through good times and bad, we ve been your trusted partner for 100 years. Third Quarter Report to Shareholders As of September 30, 2016 (unaudited) NOTICE TO STOCKHOLDERS
Jason Henderson Vice President and Branch Executive Federal Reserve Bank of Kansas City Omaha Branch January 27, 2010
 Jason Henderson Vice President and Branch Executive www.kansascityfed.org/omaha January 27, 2010 The views expressed are those of the author and do not necessarily reflect the opinions of the Federal Reserve
AgChoice Farm Credit, ACA SECOND QUARTER 2018
 AgChoice Farm Credit, ACA SECOND QUARTER 2018 TABLE OF CONTENTS Report on Internal Control Over Financial Reporting... 2 Management s Discussion and Analysis of Financial Condition and Results of Operations...
FARM CREDIT OF SOUTHWEST KANSAS, ACA QUARTERLY REPORT TO STOCKHOLDERS
 FARM CREDIT OF SOUTHWEST KANSAS, ACA QUARTERLY REPORT TO STOCKHOLDERS AS OF JUNE 30, 2016 Farm Credit of Southwest Kansas, ACA DISCLOSURE OF IMPACT OF BANK OPERATIONS ON SHAREHOLDERS' INVESTMENT IN THE
Agricultural Economic Update
 Agricultural Economic Update March 2, 217 Nate Kauffman Omaha Branch Executive and Economist Federal Reserve Bank of Kansas City The views expressed are those of the author and do not necessarily reflect
AGRICULTURAL Finance Monitor
 n Second Quarter AGRICULTURAL Finance Monitor Selected Quotes from Banker Respondents Across the Eighth Federal Reserve District While commodity prices were down, farmers held their grain in storage. Now
Farm Credit of Northwest Florida, ACA THIRD QUARTER 2018
 Farm Credit of Northwest Florida, ACA THIRD QUARTER 2018 TABLE OF CONTENTS Report on Internal Control Over Financial Reporting... 2 Management s Discussion and Analysis of Financial Condition and Results
Friendship BanCorp. Independent Auditor s Report and Consolidated Financial Statements. December 31, 2016 and 2015
 Independent Auditor s Report and Consolidated Financial Statements Contents Independent Auditor s Report... 1 Consolidated Financial Statements Balance Sheets... 3 Statements of Income... 4 Statements
Leverage of U.S. Farmers: A Deeper Perspective
 1 st Quarter 2016 Leverage of U.S. Farmers: A Deeper Perspective Paul Ellinger, Allen Featherstone, and Michael Boehlje JEL Classifications: G21, Q10, Q14, Q18 Keywords: Farm Finance, Financial Stress,
AgCarolina Farm Credit, ACA THIRD QUARTER 2018
 AgCarolina Farm Credit, ACA THIRD QUARTER 2018 TABLE OF CONTENTS Report on Internal Control Over Financial Reporting... 2 Management s Discussion and Analysis of Financial Condition and Results of Operations...
First South Farm Credit, ACA SECOND QUARTER 2018
 First South Farm Credit, ACA SECOND QUARTER 2018 TABLE OF CONTENTS Report on Internal Control Over Financial Reporting... 2 Management s Discussion and Analysis of Financial Condition and Results of Operations...
AGRICULTURAL LENDER SURVEY RESULTS
 Summer 2017 AGRICULTURAL LENDER SURVEY RESULTS Summer 2017 / Agricultural Lender Survey Results / 1 Contents Key Takeaways... 3 Introduction... 4 Agricultural Economy... 5 Farm Profitability and Economic
AgChoice Farm Credit, ACA THIRD QUARTER 2018
 AgChoice Farm Credit, ACA THIRD QUARTER 2018 TABLE OF CONTENTS Report on Internal Control Over Financial Reporting... 2 Management s Discussion and Analysis of Financial Condition and Results of Operations...
CRS Report for Congress
 Order Code RS21278 Updated November 23, 2005 CRS Report for Congress Received through the CRS Web Summary Farm Credit System Jim Monke Analyst in Agricultural Policy Resources, Science, and Industry Division
2006 ANNUAL REPORT FIRST SOUTH FARM CREDIT, ACA
 FIRST SOUTH FARM CREDIT, ACA 2006 ANNUAL REPORT Contents Message from the Chief Executive Officer...3 Report of Management...4 Consolidated Five-Year Summary of Selected Financial Data...5 Management s
Puerto Rico Farm Credit, ACA
 PUERTO RICO FARM CREDIT, ACA 2012 ANNUAL REPORT Contents Message from the Chief Executive Officer... 3 Report of Management... 4 Report on Internal Control over Financial Reporting... 5 Consolidated Five-Year
Structure and Function of the Federal Reserve System
 1/17/17 Economic Outlook Cortney Cowley Economist Federal Reserve Bank of Kansas City Omaha Branch October, 17 The views expressed are those of the author and do not necessarily reflect the opinions of