SUNCORP BANK APS330 SEPTEMBER 2012 QUARTER UPDATE. Key Points
|
|
|
- Cameron Heath
- 5 years ago
- Views:
Transcription

1 ASX announcement 12 November 2012 SUNCORP BANK SEPTEMBER 2012 QUARTER UPDATE Key Points Core Bank total lending increased 2.1% over the quarter to $44.3 billion Core Bank non-performing loans reduced 4.5% to $510 million Core Bank impairment losses of $16 million for the quarter Non-core portfolio reduced $0.5 billion to $4.0 billion and now comprises only 8% of the total Suncorp Bank lending assets Non-core non-performing loans stable at under $1.9 billion Non-core impairment losses of $66 million for the quarter Suncorp Bank today provided an update on assets, credit quality and capital as at 30 September 2012 as required under Australian Prudential Standard 330. Despite subdued economic conditions, Suncorp Bank s overall credit quality improved and the Core Bank continued to deliver above system growth. Suncorp Bank CEO David Foster said Suncorp Bank continued to record above system lending growth due to both strong branch distribution in Queensland, Western Australia and New South Wales and improved servicing of the broker channel. Consumers are taking advantage of the lower interest rate environment to actively pay down debt at a faster rate than required and this trend is weighing on the overall banking system. Suncorp Bank continues to grow, offering consumers a simple and attractive product suite as they look for alternatives to the major banks, he said. Core Bank impairment losses of $16 million for the quarter were within the Bank s medium term expectation. Impaired assets reduced to $235 million, or 0.53% of lending assets, and past due loans reduced to $275 million. The overall reduction in non-performing loans of 4.5% to $510 million reflects the conservative nature of the Core Bank. The target market for housing loans primarily comprises owner-occupiers with an average home loan size of less than $300,000. The Core Bank has limited exposure to low doc loans. The non-core portfolio run-off continued into the September quarter with the overall balance decreasing by $0.5 billion to just under $4 billion. A pipeline of opportunities to divest both performing and non-performing loans means that the Group is on track to ensure the total non-core portfolio is below $3 billion at 30 June Impairment losses for the Non-core Bank of $66 million were primarily due to two new impaired exposures. The run-off of previously impaired exposures has ensured that impaired assets and non performing loans remain stable at $1.8 billion and $1.9 billion respectively. Ends For more information Media: Amy McDonald (07) Analysts/investors: Mark Ley (07) Suncorp Group Limited - ABN GPO Box 1453, Brisbane QLD


2 Suncorp Group Limited ABN Suncorp Bank the quarter ended 30 September 2012 Release date: 12 November 2012
3 Basis of preparation This document has been prepared by the Suncorp Bank to meet the disclosure obligations set down under the Australian Prudential Regulation Authority (APRA) Australian Prudential Standard (APS) 330 Capital Adequacy: Public Disclosure of Prudential Information. Suncorp Bank is represented by Suncorp-Metway Ltd and its subsidiaries. Suncorp-Metway Ltd is an authorised deposit-taking institution and a wholly owned subsidiary of Suncorp Group Limited. Suncorp Group is represented by Suncorp Group Limited and its subsidiaries. In addition to presenting consolidated information on the Suncorp Bank, this document is disaggregated into Core and Non-core Banks to allow separate analysis given their unique lending profiles. The Core and Non-core Bank tables represent an indicative view of relative performance and are presented separately in this document, with consolidated tables available in the appendices. Other than statutory information required by a regulator (including APRA), all financial information is measured in accordance with Australian Accounting Standards. All figures have been quoted in Australian dollars and have been rounded to the nearest million. This document has not been audited nor reviewed in accordance with Australian Auditing Standards. It should be read in conjunction with the Suncorp Group s consolidated annual and interim financial reports which have been either audited or reviewed in accordance with Australian Auditing Standards. This disclosure was prepared as at 30 September 2012 and should be read in conjunction with the definitions in Appendix 3 and other information concerning Suncorp Group filed with the Australian Securities Exchange. Disclaimer This report contains general information which is current as at 12 November It is information given in summary form and does not purport to be complete. It is not a recommendation or advice in relation to the Suncorp Group and Suncorp Bank or any product or service offered by its entities. It is not intended to be relied upon as advice to investors or potential investors, and does not take into account the investment objectives, financial situation or needs of any particular investor. These should be considered, with or without professional advice, when deciding if an investment is appropriate. The information in this report is for general information only. To the extent that the information may constitute forward-looking statements, the information reflects Suncorp Group s intent, belief or current expectations with respect to our business and operations, market conditions, results of operations and financial condition, capital adequacy, specific provisions and risk management practices at the date of this report. Such forward-looking statements are not guarantees of future performance and involve known and unknown risks and uncertainties, many of which are beyond Suncorp Group s control, which may cause actual results to differ materially from those expressed or implied. Suncorp Group and Suncorp Bank undertakes no obligation to update any forward-looking statement to reflect events or circumstances after the date of this report (subject to stock exchange disclosure requirements). Registered Office Investor Relations Level 18, 36 Wickham Terrace Mark Ley Brisbane Queensland 4000 EM Investor Relations Telephone: (07) Telephone: (07) mark.ley@suncorp.com.au 2
4 Table of contents Basis of Preparation... 2 Core Bank... 4 Loans, advances and other receivables... 4 Overview... 4 Impairment losses on loans and advances... 5 Impaired and past due asset balances... 6 Provision for impairment... 7 Non-core Bank... 8 Loans, advances and other receivables... 8 Overview... 8 Impairment losses on loans and advances Impaired and past due asset balances Provision for impairment Appendix 1 Consolidated Bank Appendix 2 tables Appendix 3 Definitions Appendix 4 Suncorp Bank updated Slide Information
5 Core Bank Core Bank Loans, advances and other receivables SEP-12 SEP-12 SEP-12 JUN-12 SEP-11 vs JUN-12 vs SEP-11 $M $M $M % % Housing loans 27,826 27,639 27, Securitised housing loans 6,976 6,316 3, Total housing loans 34,802 33,955 31, Consumer loans (3.7) (12.0) Retail loans 35,266 34,437 31, Commercial (SME) 5,058 5,063 4,528 (0.1) 11.7 Agribusiness 3,944 3,856 3, Business loans (1) 9,002 8,919 8, Total lending 44,268 43,356 39, Other receivables (2) (53.7) (54.6) Gross banking loans, advances and other receivables 44,312 43,451 39, Provision for impairment (128) (129) (121) (0.8) 5.8 Loans, advances and other receivables 44,184 43,322 39, Credit risk weighted assets 22,731 22,606 21, (1) (2) Business loan balances have been adjusted to reflect interest not brought to account. Other receivables are primarily collateral deposits provided to derivative counterparties. Overview The Core Bank delivered positive lending growth in the first quarter despite the continued challenges in the Australian economy. Home lending growth was 2.5%. Business lending grew 0.9%, driven by growth in Agribusiness as the Bank continues to rebuild its brand presence in regional Australia. Demand for credit growth remains restrained and, as recent RBA data shows, consumers are continuing to save and pay down existing debt at a faster rate than contractually required. The Core Bank has maintained its focus on offering a simple and attractive product proposition across its chosen markets. Lending growth in the quarter was delivered in the Bank s home state of Queensland and through expanded operations in Western Australia and New South Wales. The Bank has also leveraged opportunities to grow in the Intermediated channel. The Core Bank s impaired assets and past due loans both reduced during the quarter and remain low as a percentage of gross lending. This reflects Suncorp s conservative portfolio which comprises a high proportion of owner occupiers with an average home loan size of less than $300,000. New lending is focused on the sub-$500,000 segment. The Bank has limited exposure to low doc mortgages. The Core Bank s lending growth is underpinned by the Bank s access to a range of stable retail and wholesale funding markets. Over 95% of the Core lending portfolio is funded by customer deposits and long term wholesale instruments. In delivering this outcome, the Bank has maintained momentum in growing the number of transaction accounts and increasing complete customer penetration. 4
6 Core Bank Personal Lending Personal lending receivables including securitised assets increased to $35.3 billion, up 2.4% in the quarter. The home lending portfolio has maintained above system growth for the last 12 months. The loan growth is attributable to an attractive product proposition, and access to both the Direct and Intermediary channels. Performance in the Core Bank s indirect channel continued to see the benefit of the recent commission restructure which emphasises customer retention over the medium term. There was a small reduction in the consumer portfolio, comprising personal loans and margin lending, as consumers remain cautious in accumulating discretionary debt given continuing economic uncertainty. Business Lending Commercial (SME) Suncorp Bank s commercial (SME) lending of $5.1 billion, remained flat over the quarter. The current commercial market is challenging and characterised by strong competition for customers choosing to refinance their debt. Suncorp has been able to acquire customers through an improved service offering, a strong brand presence and an attractive pricing and product proposition. The Bank continues to balance its appetite for growth against the need to maintain sound credit quality across the portfolio. Agribusiness The Agribusiness portfolio grew to $3.9 billion, up 2.3% over the quarter. Agribusiness delivered strong growth following favourable seasonal conditions in the Bank s target market. The pipeline remains steady on the back of ongoing efforts to replace settled leads with new quality opportunities, leveraging efforts to rebuild the Bank s brand presence in selected markets. Impairment losses on loans and advances SEP-12 SEP-12 SEP-12 JUN-12 MAR-12 vs JUN-12 vs MAR-12 $M $M $M % % Collective provision for impairment (75.0) (75.0) Specific provision for impairment Actual net write-offs (15.8) 23.1 Impairment losses to credit risk weighted assets (annualised) 0.28% 0.34% 0.24% Impairment losses of 28 basis points (annualised) of credit risk weighted assets remained within the Bank s normal operating range and in line with the impairment loss for six months to 30 June The $16 million charge was driven by specific provisions related to a small number of single name business related exposures. Quarter-on-quarter impairment losses have declined slightly. The core portfolio of housing, Agribusiness and SME continues to show no systemic issues and credit quality remains stable. 5
7 Core Bank Impaired and past due asset balances Gross balances of individually impaired loans SEP-12 SEP-12 SEP-12 JUN-12 MAR-12 vs JUN-12 vs MAR-12 $M $M $M % % with specific provisions set aside (4.7) (1.1) without specific provisions set aside Gross impaired assets (2.5) 6.8 Specific provision for impairment (44) (46) (49) (4.3) (10.2) Net impaired assets (2.1) 11.7 Size of gross impaired assets Less than one million Greater than one million but less than ten million (9.3) Greater than ten million (7.8) (2.5) 6.8 Past due loans not shown as impaired assets (6.1) (17.7) Gross non-performing loans (4.5) (7.9) Analysis of movements in gross impaired assets Balance at the beginning of the period Recognition of new impaired assets (25.0) (62.1) Increases in previously recognised impaired assets 1-1 n/a - Impaired assets written off/sold during the period (12) (14) (2) (14.3) Impaired assets which have been reclassed as performing assets or repaid (28) (9) (7) Balance at the end of the period (2.5) 6.8 Impaired assets Core gross impaired assets recorded a modest improvement of $6m during the quarter. The home lending portfolio recorded a small decline offset by a small number of business related impairments. Past due (not shown as impaired) Core past due loans improved by 6% in the quarter with improvement evident in the home lending portfolio which is in line with seasonal expectations. Home lending past due performance in Queensland continues to trend favourably to the portfolio average. The Core Bank s past due loans remain low as a percentage of gross lending and have returned to pre- January 2011 Brisbane flood levels. This low level of arrears reflects Suncorp s conservative target market of owner occupiers with an average home loan size of less than $300,000. Low doc mortgages represents less than 6% of the home lending portfolio. 6
8 Core Bank Provision for impairment SEP-12 SEP-12 SEP-12 JUN-12 MAR-12 vs JUN-12 vs MAR-12 $M $M $M % % Collective provision Balance at the beginning of the period Charge against contribution to profit (75.0) (75.0) Balance at the end of the period Specific provision Balance at the beginning of the period (6.1) 2.2 Charge against impairment losses Write-off of impaired assets (12) (12) (1) - 1,100.0 Unwind of interest (2) (3) (2) (33.3) - Balance at the end of the period (4.3) (10.2) Total provision for impairment - Core Banking activities (0.8) - Equity reserve for credit loss Balance at the beginning of the period (4.7) Transfer (to)/from retained earnings 2 - (5) n/a (140.0) Balance at the end of the period Pre-tax equivalent coverage Total provision for impairment and equity reserve for credit loss coverage - Core Banking activities Provision for impairment expressed as a percentage of gross impaired assets are as follows: % % % Collective provision Specific provision Total provision Equity reserve for credit loss coverage Total provision and equity reserve for credit loss coverage The Core Bank continues to be well provisioned with total provision and Equity Reserve for Credit Losses (ERCL) coverage remaining above 100%. The small improvement in the coverage ratio was due to the reduction in the impaired balances. 7
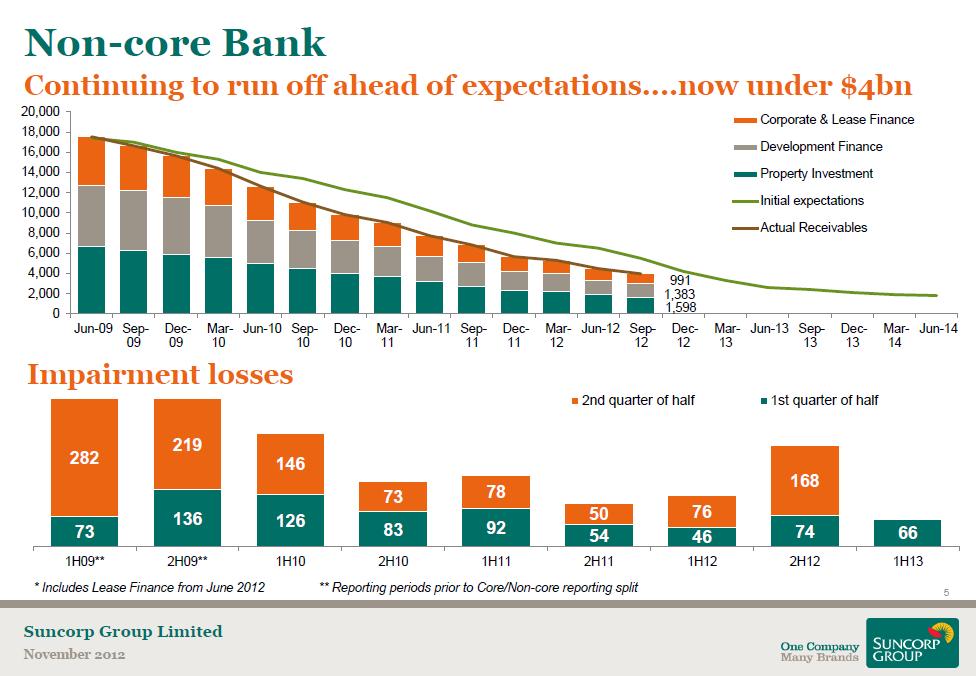
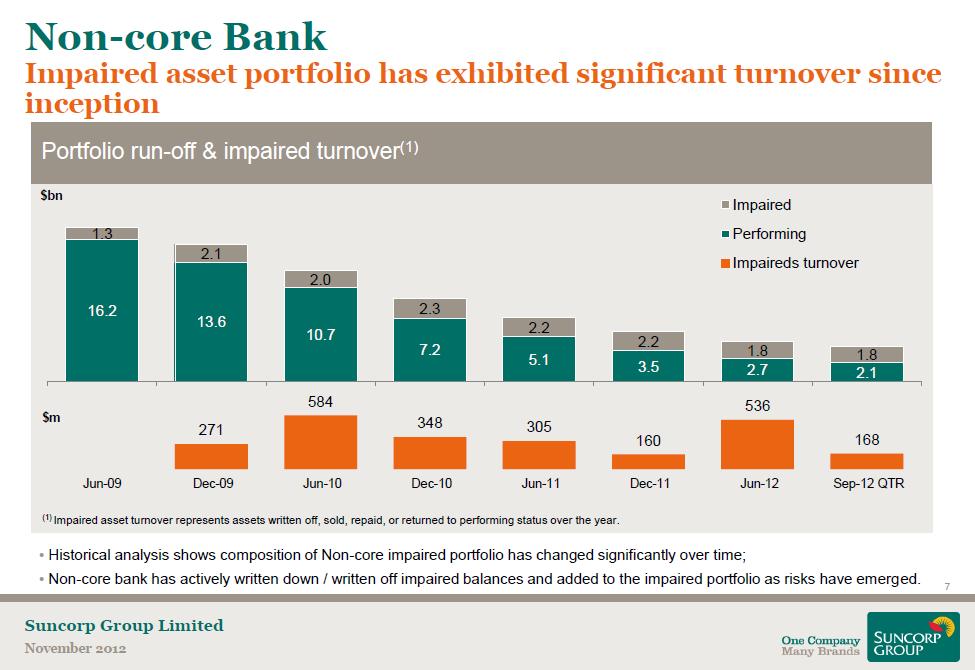
9 Non-core Bank Non-core Bank Loans, advances and other receivables SEP-12 SEP-12 SEP-12 JUN-12 SEP-11 vs JUN-12 vs SEP-11 $M $M $M % % Corporate & Lease Finance 991 1,132 1,695 (12.5) (41.5) Development finance 1,383 1,473 1,995 (6.1) (30.7) Property investment 1,598 1,868 2,644 (14.5) (39.6) Non-core portfolio (1) 3,972 4,473 6,334 (11.2) (37.3) Other receivables (2) 1,203 1,823 1,707 (34.0) (29.5) Gross banking loans, advances and other receivables 5,175 6,296 8,041 (17.8) (35.6) Provision for impairment (377) (408) (420) (7.6) (10.2) Loans, advances and other receivables 4,798 5,888 7,621 (18.5) (37.0) Credit risk weighted assets 4,732 5,396 7,750 (12.3) (38.9) (1) (2) The September 2011 comparison has been adjusted to reflect interest not brought to account. Other receivables are primarily collateral deposits provided to derivative counterparties. Overview The Non-core portfolio reduced by $0.5 billion in the quarter, with an outstanding balance of $3.972 billion at 30 September There are now 31 loans with balances above $50 million, down from 34 at 30 June. The September quarter run off included $0.2 billion related to loan disposals. The pace of run off continues to track ahead of original expectations, with the portfolio approximately 22% of its original size and now representing just 8% of the Bank's total assets. The Bank expects the Noncore portfolio to reduce to below $3 billion by June The Bank's strategy continues to be to manage its Non-core exposures in a manner designed to maximise the amount of capital that can be returned to the Group and ultimately to shareholders. The significant capital and liquidity buffers provide the opportunity to assess the full range of run down options available for each individual exposure without needing to accelerate sales on unfavourable terms. Gross non performing loans, which include both impaired and past due balances, remained stable at $1.9 billion. The disposal of a large single name exposure was offset by the impairment of two medium sized Property Investment exposures. While the market for distressed assets remains cautious the Bank is confident the balance of impaired assets will be below $1.5 billion by June
10 Non-core Bank Business Portfolios Development finance The Development finance portfolio continues to decline, reducing by a further $0.1 billion since June 2012 to $1.4 billion. Performing exposures have now matured through their construction risk phase. Conditions in the development finance property markets remain difficult with excess supply in some areas, particularly for higher-end product and vacant land. Sale opportunities are available for completed projects. The portfolio includes $1.1 billion of impaired assets across a combination of asset classes, including vacant land and a small number of assets which carry continuing development risk. Approximately half of the impaired portfolio is secured against assets in Queensland. Corporate and Leasing finance The Corporate and Leasing portfolio continued to run off over the September quarter, reducing a further $0.1 billion to $0.9 billion. The portfolio includes a $0.1 billion impaired asset, with the Bank in advanced negotiations on the sale of this exposure. Refinance markets are generally robust in this segment of the portfolio, although appetite remains exposure-specific. Many customers have favourable pricing terms and this has discouraged refinancing. Property investment Property investment includes assets such as shopping centres, commercial offices, and industrial warehouses and excludes construction projects. The property investment portfolio has reduced by $0.3 billion to $1.6 billion. The reduction included the sale of two large exposures, demonstrating the Bank s ability to execute on the full range of run-down options available. The portfolio includes $0.6 billion of impaired assets. With vacancy rates remaining at relatively low levels, appetite has slowly improved for investors and financiers in this segment, however, loan to valuation ratios following property price depreciation does constrain refinance activity. Purchasers are showing interest in acquiring quality properties in proven locations. 9
11 Non-core Bank Impairment losses on loans and advances SEP-12 SEP-12 SEP-12 JUN-12 MAR-12 vs JUN-12 vs MAR-12 $M $M $M % % Collective provision for impairment (11) (10) (19) 10.0 (42.1) Specific provision for impairment (56.4) (13.8) Actual net write-offs (66.7) (66.7) (60.7) (10.8) Impairment losses to credit risk weighted assets (annualised) 5.53% 12.52% 4.78% Impairment losses were lower in the September quarter, with the specific provision charge of $75 million comprising of: a $39 million specific provision charge relating to two sizable newly impaired exposures; a further $23 million of specific provision charges relating to a number of existing impaired exposures across the Development Finance and Property Investment portfolios; IFRS expenses due to work out date extensions of $13 million. Work out periods by their nature will continue to fluctuate given the individual circumstances of each exposure, as well as broader market conditions; 10
12 Non-core Bank Impaired and past due asset balances SEP-12 SEP-12 SEP-12 JUN-12 MAR-12 vs JUN-12 vs MAR-12 $M $M $M % % Gross balances of individually impaired loans with specific provisions set aside 1,822 1,823 2,116 (0.1) (13.9) without specific provisions set aside (19.2) (22.2) Gross impaired assets 1,843 1,849 2,143 (0.3) (14.0) Specific provision for impairment (326) (346) (362) (5.8) (9.9) Net impaired assets 1,517 1,503 1, (14.8) Size of gross impaired assets Less than one million (14.3) Greater than one million but less than ten million (24.4) Greater than ten million 1,688 1,700 1,939 (0.7) (12.9) 1,843 1,849 2,143 (0.3) (14.0) Past due loans not shown as impaired assets (43.3) Gross non-performing loans 1,877 1,876 2, (14.8) Analysis of movements in gross individually impaired assets Balance at the beginning of the period 1,849 2,143 2,163 (13.7) (14.5) Recognition of new impaired assets (27.8) Increases in previously recognised impaired assets Impaired assets written off/sold during the period (63) (193) (28) (67.4) Impaired assets which have been reclassed as performing assets or repaid (105) (133) (199) (21.1) (47.2) Balance at the end of the period 1,843 1,849 2,143 (0.3) (14.0) Gross non-performing loans Gross non-performing loans, which includes both impaired and past due balances, remained stable at under $1.9 billion. Impaired assets The Non-core Bank s impaired assets remained stable with the disposal of a large single name exposure offset by the impairment of two medium sized Property Investment exposures. The market for distressed assets remains cautious and is some way from a full recovery. These conditions are expected to continue, adding uncertainty to the workout periods for impaired accounts. Past due (not shown as impaired) Past due loans increased marginally by $7 million in the first quarter to $34 million. 11
13 Non-core Bank Provision for impairment SEP-12 SEP-12 SEP-12 JUN-12 MAR-12 vs JUN-12 vs MAR-12 $M $M $M % % Collective provision Balance at the beginning of the period (13.9) (31.9) Charge against contribution to profit (11) (10) (19) 10.0 (42.1) Balance at the end of the period (17.7) (29.2) Specific provision Balance at the beginning of the period (4.4) 1.2 Charge against impairment losses (56.4) (13.8) Write-off of impaired assets (63) (157) (35) (59.9) 80.0 Unwind of interest (32) (31) (32) Balance at the end of the period (5.8) (9.9) Total provision for impairment - Non-Core Banking activities (7.6) (13.1) Equity reserve for credit loss Balance at the beginning of the period (16.7) (34.8) Transfer (to)/from retained earnings (10) (9) (15) 11.1 (33.3) Balance at the end of the period (22.2) (35.2) Pre-tax equivalent coverage (21.9) (35.1) Total provision for impairment and equity reserve for credit loss coverage - Non-core Banking activities (9.5) (16.4) Provision for impairment expressed as a percentage of gross impaired assets are as follows: % % % Collective provision Specific provision Total provision Equity reserve for credit loss coverage Total provision and equity reserve for credit loss coverage Non-core Bank provision coverage decreased by 2% in the September quarter. The reduction in provision coverage is due to previously raised specific provisions being written off as part of the workout of existing impaired exposures. Over the life of the portfolio, the Non-core Bank has partially written down exposures where recovery is extremely unlikely. The Non-core Bank s coverage ratio would have been over 8 percentage points higher had these partial write-downs not reduced both impaired and provision balances. The Non-core Bank will continue to subject underlying security valuations and work out periods to regular review and assessment in order to ensure the portfolio remains appropriately provisioned for an orderly run-off in challenging domestic and global economic conditions. 12
14 Appendix 1 Consolidated Bank Loans, advances and other receivables CORE NON-CORE TOTAL TOTAL TOTAL SEP-12 SEP-12 SEP-12 SEP-12 SEP-12 JUN-12 SEP-11 vs JUN-12 vs SEP-11 $M $M $M $M $M % % Housing loans 27,826-27,826 27,639 27, Securitised housing loans 6,976-6,976 6,316 3, Total housing loans 34,802-34,802 33,955 31, Consumer loans (3.7) (12.0) Retail loans 35,266-35,266 34,437 31, Commercial (SME) 5,058-5,058 5,063 4,528 (0.1) 11.7 Corporate & Lease Finance ,132 1,695 (12.5) (41.5) Development finance - 1,383 1,383 1,473 1,995 (6.1) (30.7) Property investment - 1,598 1,598 1,868 2,644 (14.5) (39.6) Agribusiness 3,944-3,944 3,856 3, Business loans (1) 9,002 3,972 12,974 13,392 14,384 (3.1) (9.8) Total lending 44,268 3,972 48,240 47,829 46, Other receivables (2) 44 1,203 1,247 1,918 1,804 (35.0) (30.9) Gross banking loans, advances and other receivables 44,312 5,175 49,487 49,747 47,838 (0.5) 3.4 Provision for impairment (128) (377) (505) (537) (541) (6.0) (6.7) Loans, advances and other receivables 44,184 4,798 48,982 49,210 47,297 (0.5) 3.6 Credit risk weighted assets 22,731 4,732 27,463 28,002 29,128 (1.9) (5.7) Geographical breakdown - Total lending Queensland 26,955 1,909 28,864 28,711 28, New South Wales 9,510 1,373 10,883 10,698 9, Victoria 3, ,311 4,377 4,437 (1.5) (2.8) Western Australia 2, ,906 2,807 2, South Australia and other 1, ,276 1,236 1, Outside of Queensland loans 17,313 2,063 19,376 19,118 17, Total lending 44,268 3,972 48,240 47,829 46, (1) (2) Business loan balances have been adjusted to reflect interest not brought to account. Other receivables are primarily collateral deposits provided to derivative counterparties. 13
15 Impairment losses on loans and advances CORE NON-CORE TOTAL CORE NON-CORE TOTAL CORE NON-CORE TOTAL SEP-12 SEP-12 SEP-12 JUN-12 JUN-12 JUN-12 MAR-12 MAR-12 MAR-12 $M $M $M $M $M $M $M $M $M Collective provision for impairment 1 (11) (10) 4 (10) (6) 4 (19) (15) Specific provision for impairment Actual net write-offs Impairment losses to risk weighted assets (annualised) 0.28% 5.53% 1.18% 0.34% 12.52% 2.69% 0.24% 4.78% 1.24% Impaired asset balances Gross balances of individually impaired loans CORE NON-CORE TOTAL CORE NON-CORE TOTAL CORE NON-CORE TOTAL SEP-12 SEP-12 SEP-12 JUN-12 JUN-12 JUN-12 MAR-12 MAR-12 MAR-12 $M $M $M $M $M $M $M $M $M with specific provisions set aside 183 1,822 2, ,823 2, ,116 2,301 without specific provisions set aside Gross impaired assets 235 1,843 2, ,849 2, ,143 2,363 Specific provision for impairment (44) (326) (370) (46) (346) (392) (49) (362) (411) Net impaired assets 191 1,517 1, ,503 1, ,781 1,952 Size of gross individually impaired assets Less than one million Greater than one million but less than ten million Greater than ten million 95 1,688 1, ,700 1, ,939 2, ,843 2, ,849 2, ,143 2,363 Past due loans not shown as impaired assets Gross non-performing loans 510 1,877 2, ,876 2, ,203 2,757 Analysis of movements in gross individually impaired assets Balance at the beginning of the period 241 1,849 2, ,143 2, ,163 2,304 Recognition of new impaired assets Increases in previously recognised impaired assets Impaired assets written off/sold during the period (12) (63) (75) (16) (221) (237) (2) (28) (30) Impaired assets which have been reclassed as performing assets or repaid (28) (105) (133) (18) (114) (132) (7) (199) (206) Balance at the end of the period 235 1,843 2, ,849 2, ,143 2,363 14
16 Provision for impairment CORE NON-CORE TOTAL CORE NON-CORE TOTAL CORE NON-CORE TOTAL SEP-12 SEP-12 SEP-12 JUN-12 JUN-12 JUN-12 MAR-12 MAR-12 MAR-12 $M $M $M $M $M $M $M $M $M Collective provision Balance at the beginning of the period Charge against contribution to profit 1 (11) (10) 4 (10) (6) 4 (19) (15) Balance at the end of the period Specific provision Balance at the beginning of the period Charge against impairment losses Write-off of impaired assets (12) (63) (75) (12) (157) (169) (1) (35) (36) Unwind of interest (2) (32) (34) (3) (31) (34) (2) (32) (34) Balance at the end of the period Total provision for impairment - Banking activities Equity reserve for credit loss Balance at the beginning of the period Transfer to retained earnings 2 (10) (8) - (9) (9) (5) (15) (20) Balance at the end of the period Pre-tax equivalent coverage Total provision for impairment and equity reserve for credit loss - Banking activities Provision for impairment expressed as a percentage of gross impaired assets are as follows: % % % % % % % % % Collective provision Specific provision Total provision Equity reserve for credit loss coverage Total provision and equity reserve for credit loss coverage
17 Appendix 2 tables Table 16 On balance sheet assets CARRY VALUE AVG Risk Weight Risk Weighted Assets SEP-12 JUN-12 SEP-12 SEP-12 JUN-12 $M $M % $M $M On balance sheet assets Cash Items Claims on Australian and foreign Governments 1,221 1, agencies, regional development banks, ADIs and overseas banks 5,201 5, ,041 1,191 Claims on securitisation exposures 1,404 1, Claims secured against eligible residential mortgages 32,270 32, ,903 12,900 Past due claims 2,198 2, ,928 3,041 Other retail assets Corporate 9,275 9, ,259 9,584 Other assets and claims Total on balance sheet assets 52,966 54, ,463 28,002 Off balance sheet positions Notional Amount Credit Equivalent AVG Risk Weight Risk Weighted Assets SEP-12 SEP-12 SEP-12 SEP-12 JUN-12 $M $M % $M $M Off balance sheet positions Guarantees entered into the normal course of business Commitments to provide loans and receivables 6,531 1, Capital commitments Foreign exchange contracts 8, Interest rate contracts 55, Securitisation exposures 3, Total off balance sheet positions 74,903 2, ,549 1,252 Market Risk Capital Charge Operational Risk Capital Charge 3,334 3,334 Total on balance sheet risk weighted assets 27,463 28,002 Total assessed risk 32,865 33,050 Risk weighted capital ratios % % Tier Tier Total risk weighted capital ratios $M $M Core Equity Tier 1 capital 2,409 2,409 % % Core Equity Tier 1 ratio
18 Table 17A Credit risk by gross credit exposure outstanding as at 30 September 2012 R EC EI VA B LES D U E FR OM OTH ER B A N K S TR A D I N G S EC U R I TI ES I N VES TM EN T S EC U R I TI ES LOA N S, A D VA N C ES A N D OTH ER R EC EI VA B LES C R ED I T C OM M I TM EN TS D ER I VA TI VE I N S TR U M EN TS TOTA L C R ED I T R I S K I M P A I R ED A S S ETS P A S T D U E N OT I M P A I R ED > 9 0 D A YS TOTA L N OT P A S T D U E OR I M P A I R ED S P EC I FI C P R OVI S I ON S $M $M $M $M $M $M $M $M $M $M $M Agribusiness , , , Construction & development , ,381 1, , Financial services 174 4,690 4,280 1, , ,632 - Hospitality , , ,050 5 Manufacturing Professional services Property investment , , , Real estate - Mortgage ,580 1,306-32, ,655 5 Personal Government/public authorities Other commercial & industrial , , , Total gross credit 174 4,690 4,280 46,386 2, ,043 2, , risk Securitisation - - 1,404 3, , ,782 - Exposures (1) Total including 174 4,690 5,684 49,715 2, ,825 2, , Securitisation Exposures Impairment provision (505) (370) (36) (99) - TOTAL 62,320 1, , (1) (2) Securitisation exposures included in Loans, advances and other receivables qualify for regulatory capital relief and therefore does not contribute to the Bank's Total credit risk. Total loans, advances and other receivables includes receivables due from related parties of $228 million. 17
19 Table 17A Credit risk by gross credit exposure outstanding as at 30 June 2012 R EC EI VA B LES D U E FR OM OTH ER B A N K S TR A D I N G S EC U R I TI ES I N VES TM EN T S EC U R I TI ES LOA N S, A D VA N C ES A N D OTH ER R EC EI VA B LES C R ED I T C OM M I TM EN TS D ER I VA TI VE I N S TR U M EN TS TOTA L C R ED I T R I S K I M P A I R ED A S S ETS P A S T D U E N OT I M P A I R ED > 9 0 D A YS TOTA L N OT P A S T D U E OR I M P A I R ED S P EC I FI C P R OVI S I ON S $M $M $M $M $M $M $M $M $M $M $M Agribusiness , , , Construction & development , ,422 1, , Financial services 154 4,787 4,903 2, , ,846 - Hospitality , , ,007 4 Manufacturing Professional services Property investment , , , Real estate - Mortgage ,544 1,053-32, ,338 6 Personal Government/public authorities Other commercial & industrial , , ,061 6 Total gross credit 154 4,787 4,903 47,463 1, ,301 2, , risk Securitisation - - 1,391 2, , ,912 - Exposures (1) Total including 154 4,787 6,294 49,948 1, ,213 2, , Securitisation Exposures Impairment provision (537) (392) (39) (106) - TOTAL 62,676 1, , (1) (2) Securitisation exposures included in Loans, advances and other receivables qualify for regulatory capital relief and therefore does not contribute to the Bank's Total credit risk. Total loans, advances and other receivables includes receivables due from related parties of $201 million. 18
20 Table 17A Credit risk by gross credit exposure average gross exposure over period 1 July to 30 September 2012 R EC EI VA B LES D U E FR OM OTH ER B A N K S TR A D I N G S EC U R I TI ES I N VES TM EN T S EC U R I TI ES LOA N S, A D VA N C ES A N D OTH ER R EC EI VA B LES C R ED I T C OM M I TM EN TS D ER I VA TI VE I N S TR U M EN TS TOTA L C R ED I T R I S K I M P A I R ED A S S ETS P A S T D U E N OT I M P A I R ED > 9 0 D A YS TOTA L N OT P A S T D U E OR I M P A I R ED S P EC I FI C P R OVI S I ON S $M $M $M $M $M $M $M $M $M $M $M Agribusiness , , , Construction & development , ,402 1, , Financial services 164 4,738 4,592 2, , ,239 - Hospitality , , ,028 5 Manufacturing Professional services Property investment , , , Real estate - Mortgage ,562 1,180-32, ,496 6 Personal Government/public authorities Other commercial & industrial , , , Total gross credit 164 4,738 4,592 46,927 1, ,677 2, , risk Securitisation - - 1,398 2, , ,347 - Exposures (1) Total including 164 4,738 5,990 49,834 1, ,024 2, , Securitisation Exposures Impairment provision (522) (381) (38) (103) - TOTAL 62,502 1, , (1) Securitisation exposures included in Loans, advances and other receivables qualify for regulatory capital relief and therefore does not contribute to the Bank's Total credit risk. 19
21 Table 17A Credit risk by gross credit exposure average gross exposure over period 1 April to 30 June 2012 R EC EI VA B LES D U E FR OM OTH ER B A N K S TR A D I N G S EC U R I TI ES I N VES TM EN T S EC U R I TI ES LOA N S, A D VA N C ES A N D OTH ER R EC EI VA B LES C R ED I T C OM M I TM EN TS D ER I VA TI VE I N S TR U M EN TS TOTA L C R ED I T R I S K I M P A I R ED A S S ETS P A S T D U E N OT I M P A I R ED > 9 0 D A YS TOTA L N OT P A S T D U E OR I M P A I R ED S P EC I FI C P R OVI S I ON S $M $M $M $M $M $M $M $M $M $M $M Agribusiness , , , Construction & development , ,617 1, , Financial services 120 4,669 4,913 2, , ,731 - Hospitality , , ,026 3 Manufacturing Professional services Property investment , , , Real estate - Mortgage ,970 1,124-32, ,815 7 Personal Government/public authorities Other commercial & industrial , , ,030 5 Total gross credit 120 4,669 4,913 47,104 1, ,949 2, , risk Securitisation - - 1,464 2, , ,056 - Exposures (1) Total including 120 4,669 6,377 49,661 1, ,005 2, , Securitisation Exposures Impairment provision (550) (402) (36) (112) - TOTAL 62,455 1, , (1) Securitisation exposures included in Loans, advances and other receivables qualify for regulatory capital relief and therefore does not contribute to the Bank's Total credit risk. 20
22 Table 17B Credit risk by portfolio 30 September 2012 GROSS CREDIT RISK EXPOSURE AVERAGE GROSS EXPOSURE IMPAIRED ASSETS PAST DUE NOT IMPAIRED > 90 DAYS SPECIFIC PROVISIONS CHARGES FOR SPECIFIC PROVISIONS & WRITE OFFS $M $M $M $M $M $M Claims secured against eligible residential mortgages 32,886 32, Other retail Financial services 11,632 12, Government and public authorities Corporate and other claims 13,127 13,296 2, Total 58,043 58,677 2, Credit risk by portfolio 30 June 2012 GROSS CREDIT RISK EXPOSURE AVERAGE GROSS EXPOSURE IMPAIRED ASSETS PAST DUE NOT IMPAIRED > 90 DAYS SPECIFIC PROVISIONS CHARGES FOR SPECIFIC PROVISIONS & WRITE OFFS $M $M $M $M $M $M Claims secured against eligible residential mortgages 32,597 32, Other retail Financial services 12,846 12, Government and public authorities Corporate and other claims 13,457 13,716 2, Total 59,301 58,949 2,
23 Table 17C General reserves for credit losses Collective provision for impairment Ineligible Collective Provisions on Past Due not Impaired Eligible Collective Provisions FITB relating to eligible collective provision Equity Reserve for credit losses General Reserve for Credit losses SEP-12 JUN-12 $M $M (36) (39) (30) (32)
24 Table 18A: Summary of securitisation activity for the period Exposures securitised Recognised gain (or loss) on sale SEP-12 JUN-12 SEP-12 JUN-12 $m $m $m $m Residential mortgages Total exposures securitised during the period Table 18B(i): Aggregate of on-balance sheet securitisation exposures by exposure type Exposure Exposure SEP-12 JUN-12 Exposure type $m $m Debt securities 1,404 1,391 Total on-balance sheet securitisation exposures 1,404 1,391 Table 18B(ii): Aggregate of off-balance sheet securitisation exposures by exposure type Notional Exposure SEP-12 Notional Exposure JUN-12 Exposure type $m $m Liquidity facilities Derivative exposures 3,345 2,494 Total off-balance sheet securitisation exposures 3,415 2,552 23
25 Appendix 3 Definitions Capital adequacy ratio Core equity tier 1 Core equity tier 1 ratio Deposit to loan ratio Equity reserve for credit losses Gross non-performing loans Impairment losses to gross loans and advances Impairment losses to risk weighted assets Past due Risk weighted assets Total assessed risk Capital base divided by total assessed risk, as defined by APRA Core equity tier 1 includes ordinary shareholder equity and retained profits less tier 1 and tier 2 regulatory deductions Core equity tier 1 divided by total assessed risk Total retail deposits divided by total loans and advances, excluding other receivables The equity reserve for credit losses represents the difference between the collective provisions for impairment and the estimate of credit losses across the credit cycle based on guidance provided by APRA Gross impaired assets plus past due loans Impairment losses on loans and advances divided by gross banking loans, advances and other receivables Impairment losses on loans and advances divided by risk weighted assets Loans outstanding for more than 90 days Total of the carrying value of each asset class multiplied by their assigned risk weighting, as defined by APRA Risk weighted assets, off balance sheet positions and market risk capital charge and operational risk charge, as defined by APRA 24


26 Appendix 4 Suncorp Bank updated slide information 25

27 26

28 27


29 28
Suncorp Group Limited ABN Suncorp Bank APS330 for the quarter ended 30 September 2014
 Suncorp Group Limited ABN 66 145 290 124 Suncorp Bank APS330 for the quarter ended 30 September 2014 Release date: 10 November 2014 Suncorp Bank APS330 Basis of preparation This document has been prepared
Suncorp Bank APS330 Update
 ASX announcement APS330 Update 3 May 2016 today provided its quarterly update on Bank assets, credit quality and capital as at 31 March 2016, as required under Australian Prudential Standard 330. s lending
Suncorp-Metway Limited. Recent Developments
 May 3, 2016 Suncorp-Metway Limited Recent Developments The information set forth below is not complete and should be read in conjunction with the information contained on the US Rule 144A Programme Investors
SUNCORP GROUP LIMITED ABN SUNCORP BANK APS 330. for the quarter ended 31 MARCH 2018
 SUNCORP GROUP LIMITED ABN 66 145 290 124 SUNCORP BANK APS 330 for the quarter ended 31 MARCH 2018 RELEASE DATE: 1 MAY 2018 Basis of preparation This document has been prepared by Suncorp Bank to meet the
SUNCORP GROUP LIMITED ABN SUNCORP BANK APS330. as at 31 DECEMBER 2017
 GROUP LIMITED ABN 66 145 290 124 SUNCORP BANK APS330 as at 31 DECEMBER 2017 RELEASE DATE: 15 FEBRUARY 2018 APS 330 Basis of preparation This document has been prepared by Suncorp Bank to meet the disclosure
Suncorp Bank APS330 as at 30 June 2014
 Suncorp Group Limited ABN 66 145 290 124 Suncorp Bank APS330 Release date: 13 August 2014 Basis of preparation APS330 This document has been prepared by the Suncorp Bank to meet the disclosure obligations
Suncorp Group Limited ABN Suncorp Bank APS330 as at 31 December 2015
 Suncorp Group Limited ABN 66 145 290 124 Release date: 11 February 2016 Basis of preparation This document has been prepared by to meet the disclosure obligations under the Australian Prudential Regulation
SUNCORP BANK APS 330 SUNCORP GROUP LIMITED FOR THE QUARTER ENDED 30 SEPTEMBER 2018 RELEASE DATE: 7 NOVEMBER 2018
 SUNCORP GROUP LIMITED SUNCORP BANK APS 330 FOR THE QUARTER ENDED 30 SEPTEMBER 2018 RELEASE DATE: 7 NOVEMBER 2018 Suncorp Group Limited ABN 66 145 290 124 BASIS OF PREPARATION This document has been prepared
Total capital base 4,058 4,179
 Table 15 Capital Structure DEC-12 JUN-12 $M $M Tier 1 Ordinary share capital 2,189 2,189 Retained profits 529 517 Preference shares 818 765 Less goodwill, brands (27) (27) Less software assets - (3) Less
SUNCORP BANK APS 330 SUNCORP GROUP LIMITED FOR THE QUARTER ENDED 31 DECEMBER 2018 RELEASE DATE: 14 FEBRUARY 2019
 SUNCORP GROUP LIMITED SUNCORP BANK APS 330 FOR THE QUARTER ENDED 31 DECEMBER 2018 RELEASE DATE: 14 FEBRUARY 2019 Suncorp Group Limited ABN 66 145 290 124 BASIS OF PREPARATION This document has been prepared
Suncorp Group Limited ABN
 Suncorp Group Limited ABN 66 145 290 124 Financial results for the full year ended 30 June 2013 Basis of preparation Suncorp Group ( Group, the Group or Suncorp ) is represented by Suncorp Group Limited
Suncorp-Metway Limited and subsidiaries
 SUNCORP-METWAY LIMITED CONSOLIDATED FINANCIAL REPORT 44 Suncorp-Metway Limited and subsidiaries ABN 66 010 831 722 Financial Report FOR THE FINANCIAL YEAR ENDED 30 JUNE 2015 CONSOLIDATED FINANCIAL REPORT
For personal use only. Suncorp Group Limited ABN Analyst Pack
 Suncorp Group Limited ABN 66 145 290 124 Analyst Pack for the full year ended 30 June 2014 Basis of preparation Suncorp Group ( Group, the Group or Suncorp ) is represented by Suncorp Group Limited (SGL)
Consolidated interim financial report
 Suncorp Group Limited and subsidiaries ABN 66 145 290 124 interim financial report Contents Page Directors report... 1 Lead auditor s independence declaration... 6 interim statement of comprehensive income...
Happy Banking an initiative from Bankwest. Capital Adequacy and Risk Disclosures. Basel II Pillar 3. Quarterly Update as at 30 June 2012
 Basel II Pillar 3 Capital Adequacy and Risk Disclosures Happy Banking an initiative from Bankwest Quarterly Update as at 30 June 2012 Bank of Western Australia Ltd ACN 050 494 454 BWE-1084 200411 Basel
For personal use only Genworth Mortgage Insurance Australia
 Genworth Mortgage Insurance Australia 3Q 2016 Financial Results Presentation 4 November 2016 2016 Genworth Mortgage Insurance Australia Limited. All rights reserved. Disclaimer This presentation contains
Genworth Mortgage Insurance Australia
 Genworth Mortgage Insurance Australia 1Q 2016 Financial results presentation 29 April 2016 2016 Genworth Mortgage Insurance Australia Limited. All rights reserved. Disclaimer This presentation contains
Basel II Pillar 3 - Capital Adequacy and Risk Disclosures
 Bank of Western Australia Ltd ACN 050 494 454 Basel II Pillar 3 - Capital Adequacy and Risk Disclosures Quarterly Update as at 30 June 2010 Background The Bank of Western Australia Ltd (the Bank) is an
Investor presentation
 FY17 INVESTOR PRESENTATION 1 18 August 2017 Investor presentation FY17 Agenda FY17 INVESTOR PRESENTATION 1. Overview & strategic landscape Melos Sulicich CEO & Managing Director 2. Financial results David
Pillar 3 Capital Adequacy and Risk Disclosures
 Pillar 3 Capital Adequacy and Risk Disclosures Quarterly Update as at 30 June 2018 Introduction Rabobank Australia Limited ( the Bank ) is an Authorised Deposit-taking Institution ( ADI ) subject to regulation
Commonwealth Bank of Australia. Recent Developments
 May 15, 2017 Commonwealth Bank of Australia Recent Developments The information set forth below is not complete and should be read in conjunction with the information contained on the US Investors Supplemental
SUNCORP-METWAY LIMITED AND SUBSIDIARIES ABN
 SUNCORP-METWAY LIMITED CONSOLIDATED INTERIM FINANCIAL REPORT SUNCORP-METWAY LIMITED AND SUBSIDIARIES ABN 66 010 831 722 Consolidated interim financial report for the half-year ended 31 December 2015 Contents
G R O W I N G TO G E T H E R
 2 MAY 2018 1Q18 FINANCIAL RESULTS PRESENTATION G R O W I N G TO G E T H E R 2018 Genworth Mortgage Insurance Australia Limited. All rights reserved. Disclaimer This presentation contains general information
Commonwealth Bank of Australia Recent Developments
 November 24, 2014 Commonwealth Bank of Australia Recent Developments The information set forth below is not complete and should be read in conjunction with the information contained on the Supplementary
APRA BASEL III PILLAR 3 DISCLOSURES
 APRA BASEL III PILLAR 3 DISCLOSURES QUARTER ENDED 31 MAY 2017 1 26 July 2017 This report has been prepared by Bank of Queensland Limited (Bank or BOQ) to meet its disclosure requirements under the Australian
Pillar 3 Capital Adequacy & Risk Disclosure
 Pillar 3 Capital Adequacy & Risk Disclosure Contents Capital adequacy 2 Credit risk 3 Securitisation 6 Liquidity coverage ratio 7 1 ING Bank (Australia) Limited, trading as ING, is an Authorised Deposit-taking
It is therefore pleasing to report that this evolution of BOQ has continued throughout this financial year.
 1 2 Good morning everyone. I will start with the highlights of the results. The strategy we have been implementing in the past few years has transformed BOQ into a resilient, multi-channel business that
Pillar 3 Capital Adequacy and Risk Disclosures Quarterly Update
 Pillar 3 Capital Adequacy and Risk Disclosures Quarterly Update Rabobank Australia Limited ABN 50 001 621 129 AFSL 234 700 www.rabobank.com.au Quarterly Update as at 30 September 2017 Introduction Rabobank
PILLAR 3 DISCLOSURE APS 330: PUBLIC DISCLOSURE
 2017 BASEL III PILLAR 3 DISCLOSURE AS AT 31 DECEMBER 2017 APS 330: PUBLIC DISCLOSURE Important notice This document has been prepared by Australia and New Zealand Banking Group Limited (ANZ) to meet its
Pillar 3 Capital Adequacy and Risk Disclosures
 Pillar 3 Capital Adequacy and Risk Disclosures Quarterly Update as at 30 September 2018 Introduction Rabobank Australia Limited ( the Bank ) is an Authorised Deposit-taking Institution ( ADI ) subject
APRA Basel III Pillar 3 Disclosures
 APRA Basel III Pillar 3 Disclosures Quarter ended 31 May 2018 24 July 2018 This report has been prepared by Bank of Queensland Limited (Bank or BOQ) to meet its disclosure requirements under the Australian
Suncorp Group Limited Subordinated Notes Offer
 Suncorp Group Limited Subordinated Notes Offer 10 April 2013 1 Important Notice This presentation has been prepared and authorised by Suncorp Group Limited (ABN 66 145 290 124) ( Suncorp ) in relation
FOR THE HALF-YEAR ENDED 28 FEBRUARY Bank of Queensland Limited ABN AFSL No
 FOR THE HALF-YEAR ENDED 28 FEBRUARY 2017 Bank of Queensland Limited ABN 32 009 656 740. AFSL No 244616. JON SUTTON Managing Director & CEO ANTHONY ROSE Chief Financial Officer JON SUTTON Managing Director
Basel II Pillar 3. Capital Adequacy and Risk Disclosures. Quarterly Update as at 30 June Bank of Western Australia Ltd ACN
 Basel II Pillar 3 Capital Adequacy and Risk Disclosures Quarterly Update as at 30 June 2011 Bank of Western Australia Ltd ACN 050 494 454. BWE-1084 300611 Bank of Western Australia Ltd ACN 050 494 454
Incorporating the requirements of APS 330 Half Year Update as at 31 March 2018
 Incorporating the requirements of APS 330 Half Year Update as at 31 March "My patients weren't liking the shoes out there. That's when I decided to design my own range." Caroline McCulloch FRANKiE4 Footwear
Happy Banking an initiative from Bankwest. Capital Adequacy and Risk Disclosures. Basel II Pillar 3. Quarterly Update as at 31 March 2012
 Basel II Pillar 3 Capital Adequacy and Risk Disclosures Happy Banking an initiative from Bankwest Quarterly Update as at 31 March 2012 Bank of Western Australia Ltd ACN 050 494 454 BWE-1084 200411 Basel
Happy Banking an initiative from Bankwest. Capital Adequacy and Risk Disclosures. Basel II Pillar 3. Quarterly Update as at 31 December 2011
 Basel II Pillar 3 Capital Adequacy and Risk Disclosures Happy Banking an initiative from Bankwest Quarterly Update as at 31 December 2011 Bank of Western Australia Ltd ACN 050 494 454 BWE-1084 200411 Bank
Basel II Pillar 3 - Capital Adequacy and Risk Disclosures
 Bank of Western Australia Ltd ACN 050 494 454 Basel II Pillar 3 - Capital Adequacy and Risk Disclosures Quarterly Update as at 31 December 2009 Background The Bank of Western Australia Ltd (the Bank) is
2011 Risk & Capital. Incorporating the requirements of APS 330
 Risk & Capital Report Incorporating the requirements of APS 330 Half Year Update 31 March This page has been left blank intentionally Contents Contents 1. Introduction 3 1.1 The Group s Basel II Methodologies
Commonwealth Bank of Australia ACN
 Commonwealth of Australia Basel II Pillar 3 - Capital Adequacy and Risk Disclosures Quarterly update as at 3 March 00. Scope of application The Commonwealth of Australia (the Group) is an Authorised Deposit-taking
1H19 RESULTS PRESENTATION
 1H19 RESULTS PRESENTATION 11 APRIL 2019 Half year ended 28 February 2019 Anthony Rose Interim CEO Matt Baxby Chief Financial Officer Anthony Rose Interim CEO 2 Niche growth, asset quality and capital remain
Basel II Pillar 3 Capital Adequacy and Risk Disclosures. Determined to be better than we ve ever been. as at 31 December 2009
 Determined to be better than we ve ever been. Basel II Pillar 3 Capital Adequacy and Risk Disclosures as at 3 December 2009 Commonwealth Bank of Australia Table of Contents Introduction... 2 Scope of
Basel III Pillar 3. Capital adequacy and risk disclosures Quarterly Update as at 31 March 2013
 Basel III Pillar 3 Capital adequacy and risk disclosures Quarterly Update as at 31 March 2013 COMMONWEALTH BANK OF AUSTRALIA ACN 123 123 124 15 May 2013 Basel III Pillar 3 Capital Adequacy and Risk Disclosures
PILLAR III DISCLOSURES
 Citigroup Pty Limited PILLAR III DISCLOSURES Citigroup Pty Limited Consolidated Group Capital Adequacy and Risk disclosures 31 December 2017 Incorporating the implementation of Basel III and the requirements
Pillar 3 Capital adequacy & risk disclosure
 Pillar 3 Capital adequacy & risk disclosure 31 March 2018 Table of contents Table 3 Capital adequacy Table 4 Credit risk 3 4 Table 5 Securitisation 5 2 ING Bank (Australia) Limited, trading as ING, is
Happy Banking an initiative from Bankwest. Capital Adequacy and Risk Disclosures. Basel II Pillar 3. Quarterly Update as at 30 September 2011
 Basel II Pillar 3 Capital Adequacy and Risk Disclosures Happy Banking an initiative from Bankwest Quarterly Update as at 30 September 2011 Bank of Western Australia Ltd ACN 050 494 454 BWE-1084 200411
APRA Basel III Pillar III Disclosures
 APRA Basel III Pillar III Disclosures Quarter ended 31 August 2017 12 October 2017 This report has been prepared by Bank of Queensland Limited (Bank or BOQ) to meet its disclosure requirements under the
Basel II Pillar 3. Capital Adequacy and Risk Disclosures as at 31 December Determined to be better than we ve ever been.
 Determined to be better than we ve ever been. Basel II Pillar 3 Capital Adequacy and Risk Disclosures as at 31 December 2010 Commonwealth bank of Australia ACN 123 123 124 Table of Contents 1 Introduction
Pillar 3 report. Table of Contents. Introduction 1. Scope of Application 2. Capital 3. Credit Risk Exposures 4. Credit Provision and Losses 6
 Pillar 3 report Table of Contents Section 1 Introduction 1 Section 2 Scope of Application 2 Section 3 Capital 3 Section 4 Credit Risk Exposures 4 Section 5 Credit Provision and Losses 6 Section 6 Securitisation
2014 Pillar 3 Report. Incorporating the requirements of APS 330 Half Year Update as at 31 March 2014
 Pillar 3 Report Incorporating the requirements of APS 330 Half Year Update as at 31 March This page has been left blank intentionally Contents Contents 1. Introduction 4 1.1 The NAB Group s Capital Adequacy
David Carter CEO Banking & Wealth. Create a better today MACQUARIE CONFERENCE 1 MAY 2018
 David Carter CEO Banking & Wealth Create a better today MACQUARIE CONFERENCE 1 MAY 2018 1 Highlights 1. Banking industry is evolving 2. Suncorp continues to focus on customers and simplification 3. Disciplined
Genworth Mortgage Insurance Australia
 Genworth Mortgage Insurance Australia 1Q 2017 Financial Results Presentation 3 May 2017 2017 Genworth Mortgage Insurance Australia Limited. All rights reserved. Disclaimer This presentation contains general
Profit Announcement (U.S Version) Half Year ended 31 December Commonwealth Bank of Australia ABN
 Half Year ended 31 December Commonwealth Bank of Australia ABN") Profit Announcement (U.S Version) Half Year ended 31 December 2007 Commonwealth Bank of Australia ABN 48 123 123 124 ASX Appendix 4D Results for announcement to the market (1) Report for the half year
Profit Announcement (U.S Version) Half Year ended 31 December 2007 Commonwealth Bank of Australia ABN 48 123 123 124 ASX Appendix 4D Results for announcement to the market (1) Report for the half year
For personal use only
 AUSTRALIAN FINANCE GROUP LIMITED ABN 11 066 385 822 Appendix 4E Preliminary Final Report for the year ended 30 June 2015 Contents Page Results for announcement to market 2 Discussion and analysis of the
Morgan s Queensland Investor Conference Presentation
 ASX announcement 21 Presentation Attached is a copy of the presentation made at the Morgan s 2015 Queensland Investor Conference today. Darren Solomon Company Secretary attch. Suncorp Group Ltd- ABN 66
SUNCORP GROUP LIMITED AND SUBSIDIARIES ABN
 SUNCORP GROUP LIMITED CONSOLIDATED INTERIM FINANCIAL REPORT SUNCORP GROUP LIMITED AND SUBSIDIARIES ABN 66 145 290 124 Consolidated interim financial report for the half-year ended 31 December 2015 Contents
BASEL III PILLAR 3 DISCLOSURE
 BASEL III PILLAR 3 DISCLOSURE AS AT 30 JUNE 20 JUNE 20 PILLAR 3 / 20 THIRD QUARTER CHART PACK AUSTRALIA AND NEW Z EALAND BANKING GROUP LIMITED 14 AUGUST 20 To be read in conjunction with ANZ 20 Basel III
2013 Risk & Capital Report
 Risk & Capital Report Incorporating the requirements of APS 330 Half Year Update as at 31 March This page has been left blank intentionally Contents Contents 1. Introduction 4 1.1 The Group s Capital Adequacy
Bank of Queensland. Half-Year Results 29 February FY08 Half-Year Results
 Bank of Queensland Half-Year Results 29 February 2008 1 Agenda Result highlights Financial result in detail BOQ Portfolio Strategy and outlook David Liddy Managing Director & CEO Ram Kangatharan Group
Genworth Mortgage Insurance Australia
 Genworth Mortgage Insurance Australia 3Q 2017 Financial Results Presentation 3 November 2017 2017 Genworth Mortgage Insurance Australia Limited. All rights reserved. Disclaimer This presentation contains
Basel II Pillar 3. Capital Adequacy and Risk Disclosures. QUARTERLY UPDATE AS AT 30 September 2011
 Determined to be better than we ve ever been. Basel II Pillar 3 Capital Adequacy and Risk Disclosures QUARTERLY UPDATE AS AT 30 September 2011 Commonwealth bank of Australia ACN 123 123 124 Commonwealth
Basel II Pillar 3. Capital Adequacy and Risk Disclosures QUARTERLY UPDATE As at 31 March 2011
 Determined to be better than we ve ever been. Basel II Pillar 3 Capital Adequacy and Risk Disclosures QUARTERLY UPDATE As at 31 March 2011 Commonwealth bank of Australia ACN 123 123 124 Commonwealth Bank
Genworth Mortgage Insurance Australia
 Genworth Mortgage Insurance Australia Full Year 2015 Financial Results Presentation 5 February 2016 2016 Genworth Mortgage Insurance Australia Limited. All rights reserved. Disclaimer This presentation
2016 PILLAR 3 REPORT. Incorporating the requirements of APS 330 Third Quarter Update as at 30 June 2016
 PILLAR 3 REPORT Incorporating the requirements of APS 330 Third Quarter Update as at 30 June This page has been left blank intentionally third quarter pillar 3 report 1. Introduction third quarter pillar
INVESTOR PRESENTATION
 INVESTOR PRESENTATION FULL YEAR FY2018 17 August 2018 AGENDA FY18 INVESTOR PRESENTATION 1. Highlights & strategy Melos Sulicich Managing Director & CEO 2. Financial results David Harradine Chief Financial
Basel II Pillar years of banking on Australia s future. Capital Adequacy and risk disclosures Quarterly update as at 31 MARCH 2012
 100 years of banking on Australia s future Basel II Pillar 3 Capital Adequacy and risk disclosures Quarterly update as at 31 MARCH 2012 Commonwealth bank of Australia ACN 123 123 124 Commonwealth Bank
For personal use only
 CBA 3Q18 Trading Update For the quarter ended 31 March 2018 1. Reported 9 May 2018. All comparisons are to the average of the two quarters of the first half of FY18 unless noted otherwise. Summary Unaudited
For personal use only
 National Australia Bank Limited ABN 12 004 044 937 800 Bourke Street Docklands Victoria 3008 AUSTRALIA www.nabgroup.com ASX ANNOUNCEMENT Tuesday, 14 February National Australia Bank Limited First Quarter
Westpac Banking Corporation
 Westpac Banking Corporation David Morgan Chief Executive Officer March 2007 Westpac Banking Corporation at a glance Australia s first bank est. 1817 Top 50 bank globally 1 Consistent earnings growth Strong
Bank of Queensland Full year results 31 August Bank of Queensland Limited ABN AFSL No
 Bank of Queensland Full year results 31 August 2013 Bank of Queensland Limited ABN 32 009 656 740. AFSL No 244616. Agenda Result overview Stuart Grimshaw Managing Director and CEO Financial detail Anthony
APRA BASEL III PILLAR 3 DISCLOSURES
 APRA BASEL III PILLAR 3 DISCLOSURES Quarter ended 31 August 2018 4 October 2018 This report has been prepared by Bank of Queensland Limited (Bank or BOQ) to meet its disclosure requirements under the Australian
PILLAR 3 DISCLOSURE APS 330: PUBLIC DISCLOSURE
 2017 BASEL III PILLAR 3 DISCLOSURE AS AT 30 JUNE 2017 APS 330: PUBLIC DISCLOSURE Important notice This document has been prepared by Australia and New Zealand Banking Group Limited (ANZ) to meet its disclosure
Pillar 3 report. Table of Contents. Introduction 1. Scope of Application 2. Capital 3. Credit Risk Exposures 4. Credit Provision and Losses 6
 Pillar 3 report Table of Contents Section 1 Introduction 1 Section 2 Scope of Application 2 Section 3 Capital 3 Section 4 Credit Risk Exposures 4 Section 5 Credit Provision and Losses 6 Section 6 Securitisation
BANK OF QUEENSLAND LIMITED AND ITS CONTROLLED ENTITIES INTERIM FINANCIAL REPORT 2014 CONSOLIDATED INTERIM FINANCIAL REPORT
 CONSOLIDATED INTERIM FINANCIAL REPORT HALF-YEAR ENDED 28 FEBRUARY 2014 BANK OF QUEENSLAND LIMITED AND ITS CONTROLLED ENTITIES A.B.N. 32 009 656 740 TABLE OF CONTENTS Directors Report 3 Lead auditor s independence
BOQ INVESTOR INFORMATION INCORPORATING THE REQUIREMENTS OF APPENDIX 4E
 BOQ INVESTOR INFORMATION 2016 INCORPORATING THE REQUIREMENTS OF APPENDIX 4E ASX APPENDIX 4E For the year ended 31 August 2016 Results for announcement to the market (1) Revenues from ordinary activities
FY2015 Annual Results August Brett McKeon - CEO David Bailey - CFO
 FY2015 Annual Results August 27 2015 Brett McKeon - CEO David Bailey - CFO FY2015 Financial Results Highlights Delivery on FY15 Prospectus forecasts Pro forma NPAT $19.3 million up 8.4% against IPO forecast
APRA Basel III Pillar 3 Disclosures
 APRA Basel III Pillar 3 Disclosures Quarter ended 28 February 2018 17 April 2018 This report has been prepared by Bank of Queensland Limited (Bank or BOQ) to meet its disclosure requirements under the
2018 BASEL III PILLAR 3 DISCLOSURE
 2018 BASEL III PILLAR 3 DISCLOSURE AS AT 30 JUNE 2018 APS 330: PUBLIC DISCLOSURE Important notice This document has been prepared by Australia and New Zealand Banking Group Limited (ANZ) to meet its disclosure
Suncorp Group Limited
 An introduction 1 Suncorp Group Leading financial services brands in Australia and New Zealand Top 20 ASX listed company $14.4 billion market capitalisation at 15 Feb 2013 $93.5 billion in group assets
Risk & Capital Report Incorporating the requirements of APS 330
 2009 Risk & Capital Report Incorporating the requirements of APS 330 Quarterly Update 31 December 2008 National Australia Bank Limited ABN 12 004 044 937 (the Company ) This page has been left blank intentionally
Basel III Pillar 3. Capital Adequacy and Risks Disclosures as at 31 December 2016
 Basel III Pillar 3 Capital Adequacy and Risks Disclosures as at 31 December 2016 COMMONWEALTH BANK OF AUSTRALIA ACN 123 123 124 15 FEBRUARY 2017 This page has been intentionally left blank Table of Contents
For personal use only APRA BASEL III. Capital Structure 2. Table 3: Capital Adequacy 3. Table 4: Credit Risk 4. Table 5: Securitisation Exposures 6
 APRA BASEL III Pillar 3 Disclosures QUARTER ENDED 31 AUGUST 2016 6 October 2016 This report has been prepared by Bank of Queensland Limited (Bank or BOQ) to meet it s disclosure requirements under the
Profit Announcement For the full year ended 30 June 2013
 Profit Announcement For the full year ended 30 June 2013 COMMONWEALTH BANK OF AUSTRALIA ACN 123 123 124 14 AUGUST 2013 FIND OUT MORE VIA OUR APP ASX Appendix 4E Results for announcement to the market (1)
2018 Genworth Mortgage Insurance Australia Limited. All rights reserved.
 2018 Genworth Mortgage Insurance Australia Limited. All rights reserved. Disclaimer This presentation contains general information in summary form which is current as at 31 December 2017. It may present
ANZ BANK NEW ZEALAND LIMITED INTERIM FINANCIAL STATEMENTS
 ANZ BANK NEW ZEALAND LIMITED INTERIM FINANCIAL STATEMENTS FOR THE THREE MONTHS ENDED 31 DECEMBER 2018 ANZ BANK NEW ZEALAND LIMITED INTERIM FINANCIAL STATEMENTS FOR THE THREE MONTHS ENDED 31 DECEMBER 2018
Incorporating the requirements of APS 330 Third Quarter Update as at 30 June 2018
 Incorporating the requirements of APS 330 Third Quarter Update as at 30 June "My patients weren't liking the shoes out there. That's when I decided to design my own range." caroline McCulloch FRANKiE4
BASEL III PILLAR 3 DISCLOSURE
 BASEL III PILLAR 3 DISCLOSURE AS AT 31 DECEMBER 20 DECEMBER 20 PILLAR 3 / 2018 FIRST QUARTER CHART PACK AUSTRALIA AND NEW Z EALAND BANKING GROUP LIMITED 20 FEBRUARY 2018 To be read in conjunction with
Presentation of Full Year Results 22 August
 Presentation of Full Year Results 22 August 2001 www.commbank.com.au Disclaimer The material that follows is a presentation of general background information about the Bank s activities current at the
Basel III Pillar 3. Capital Adequacy and Risks Disclosures as at 30 September 2017
 Basel III Pillar 3 Capital Adequacy and Risks Disclosures as at 30 September 2017 Commonwealth Bank of Australia ACN 123 123 124 8 November 2017 This page has been intentionally left blank Table of Contents
ASX Release MONDAY 18 FEBRUARY 2019 WESTPAC 1Q19 UPDATE AND PILLAR 3 REPORT
 ASX Release MONDAY 18 FEBRUARY 2019 WESTPAC 1Q19 UPDATE AND PILLAR 3 REPORT Westpac Banking Corporation has today released its Pillar 3 report for December 2018, along with slides providing further detail
Basel III Pillar 3. Capital Adequacy and Risks Disclosures as at 31 December 2017
 Basel III Pillar 3 Capital Adequacy and Risks Disclosures as at 31 December 2017 Commonwealth Bank of Australia ACN 123 123 124 7 February 2018 Images Mastercard is a registered trademark and the circles
For personal use only
 17 February 2017 The Manager Company Announcements Australian Securities Exchange 20 Bridge Street Sydney NSW 2000 MyState Limited Correction to Investor Presentation Please be advised that an amendment
Bank of Queensland. Half year results 28 February 2010
 Bank of Queensland Half year results 28 February 2010 Agenda Result highlights David Liddy Managing Director & CEO Financial result in detail Ram Kangatharan Chief Operating Officer BOQ portfolio Strategy
Suncorp Group Limited Capital Notes Offer. 27 March 2017
 Suncorp Group Limited Capital Notes Offer 27 March 2017 1 Important Notice This presentation has been prepared and authorised by Suncorp Group Limited (ABN 66 145 290 124) ( Suncorp ) in relation to the
Basel III Pillar 3 Risk Disclosure
 Basel III Pillar 3 Risk Disclosure As at 31 Table of Contents Capital Adequacy Ratios... 3 Capital Position... 3 Risk Weighted Assets... 3 Credit Risk Exposure... 4 General Reserve for Credit Losses...
Public Disclosure of Prudential Information in accordance with APRA Prudential Standard APS 330
 AUSTRALIAN CENTRAL CREDIT UNION LTD (TRADING AS PEOPLE'S CHOICE CREDIT UNION) ABN 11 087 651 125 AFSL 244310 Public Disclosure of Prudential Information in accordance with APRA Prudential Standard APS
Genworth Mortgage Insurance Australia
 Genworth Mortgage Insurance Australia 1Q 2015 Financial results presentation 29 April 2015 2015 Genworth Mortgage Insurance Australia Limited. All rights reserved. Disclaimer This presentation contains
Profit Announcement. For the full year ended 30 June 2017
 Profit Announcement For the full year ended 30 June 2017 Commonwealth Bank of Australia ACN 123 123 124 9 August 2017 ASX Appendix 4E Results for announcement to the market (1) Report for the year ended
2012 Risk & Capital Report Incorporating the requirements of APS 330
 Risk & Capital Report Incorporating the requirements of APS 330 Third Quarter Update as at 30 June This page has been left blank intentionally 1. Introduction The Group, as defined in Section 2. Scope
Pillar 3 report Table of contents
 December Table of contents Structure of Executive summary 3 Introduction 5 Group structure 6 Capital overview 8 Leverage ratio 11 Credit risk exposures 12 Securitisation 16 Liquidity coverage ratio 19