FIDIA GROUP INTERIM REPORT AT 31 MARCH 2018
|
|
|
- Corey Parks
- 5 years ago
- Views:
Transcription
1 FIDIA GROUP INTERIM REPORT AT 31 MARCH 2018 Fidia S.p.A. Registered office in San Mauro Torinese, Corso Lombardia, 11 Paid-in share capital 5,123,000 Turin Register of Companies Taxpayer's Code Website: info@fidia.it 1
2 TABLE OF CONTENTS 3 Board of Directors and Auditors 5 Fidia Group structure 6 Fidia Group Reclassified Financial Statements 9 Fidia Group - Analysis of operating and finance performance of the Group Profit and loss 12 Fidia Group - Analysis of the financial data 14 Reconciliation of the Parent Company s shareholders equity and net income or loss with those of the Group 14 Fidia Group - Segment reporting 16 Summary of performance, significant events and business outlook 17 Fidia Group - Consolidated Financial Statements and Notes 23 Fidia Group - Notes to the Financial Statements Board of Directors 15 May
3 BOARDS OF DIRECTORS AND AUDITORS Board of Directors Chairman and Chief Executive Officer Giuseppe Morfino (a) Deputy Chairman Carlos Maidagan (b) Directors Luigino Azzolin (c) (1) Anna Ferrero (c) (1) (2) Guido Giovando (c) (2) Paola Savarino (c) (1) Laura Morgagni (d) (2) (a) Appointed Chairman at the Shareholders Meeting on 28 April 2017 until the approval of the financial statements for FY2019; appointed Managing Director by the Board of Directors on 28 April 2017 and General Manager by the Board of Directors on 14 July (b) Appointed at the Shareholders Meeting on 28 April 2017 until the approval of the financial statements for FY2019; appointed Deputy Chairman by the Board of Directors on 28 April (c) Appointed at the Shareholders Meeting on 28 April 2017 until the approval of the financial statements for FY2019. (d) Appointed at the Shareholders' Meeting on 27 April 2018 up to the approval of the 2019 Financial Statements. (1) Member of the Internal Control and Risk Committee (2) Member of the Remuneration Committee. Board of Statutory Auditors (*) Statutory Auditors Maurizio Ferrero Chairman Marcello Rabbia Marina Scandurra Alternate Auditors Andrea Giammello Chiara Olliveri Siccardi Roberto Panero (*) Appointed at the Shareholders Meeting on 28 April 2017 until the approval of the financial statements for FY2019. Independent Auditors (**) EY S.p.A. (**) Appointed at the Shareholders Meeting on 27 April 2012 for the nine-year period
4 POWERS OF THE CHAIRMAN, DEPUTY CHAIRMAN AND CEO Chairman of the Board of Directors and Chief Executive Officer: Mr. Giuseppe Morfino He is the legal representative of the company with regard to third parties and courts of law, with separate signature, to exercise any and all, and the amplest powers of ordinary and extraordinary administration; he is entitled to appoint and revoke special attorneys for specific transactions, with the sole exclusion of the powers and rights expressly reserved to the Board of Directors, under the law or the company By-laws. The Board of the Directors retains the following powers: purchase, disposal and conferment of equity investments; disposal, conferment and/or lease of the company or any units thereof; purchase of companies or units of companies; purchase and/or disposal of real estate and/or tangible rights and/or rights of way thereto; registration of mortgages on corporate property; definition of company strategies relating to the purchase and sale of equity interests, company branches and real estate. Deputy Chairman of the Board of Directors: Carlos Maidagan. 4
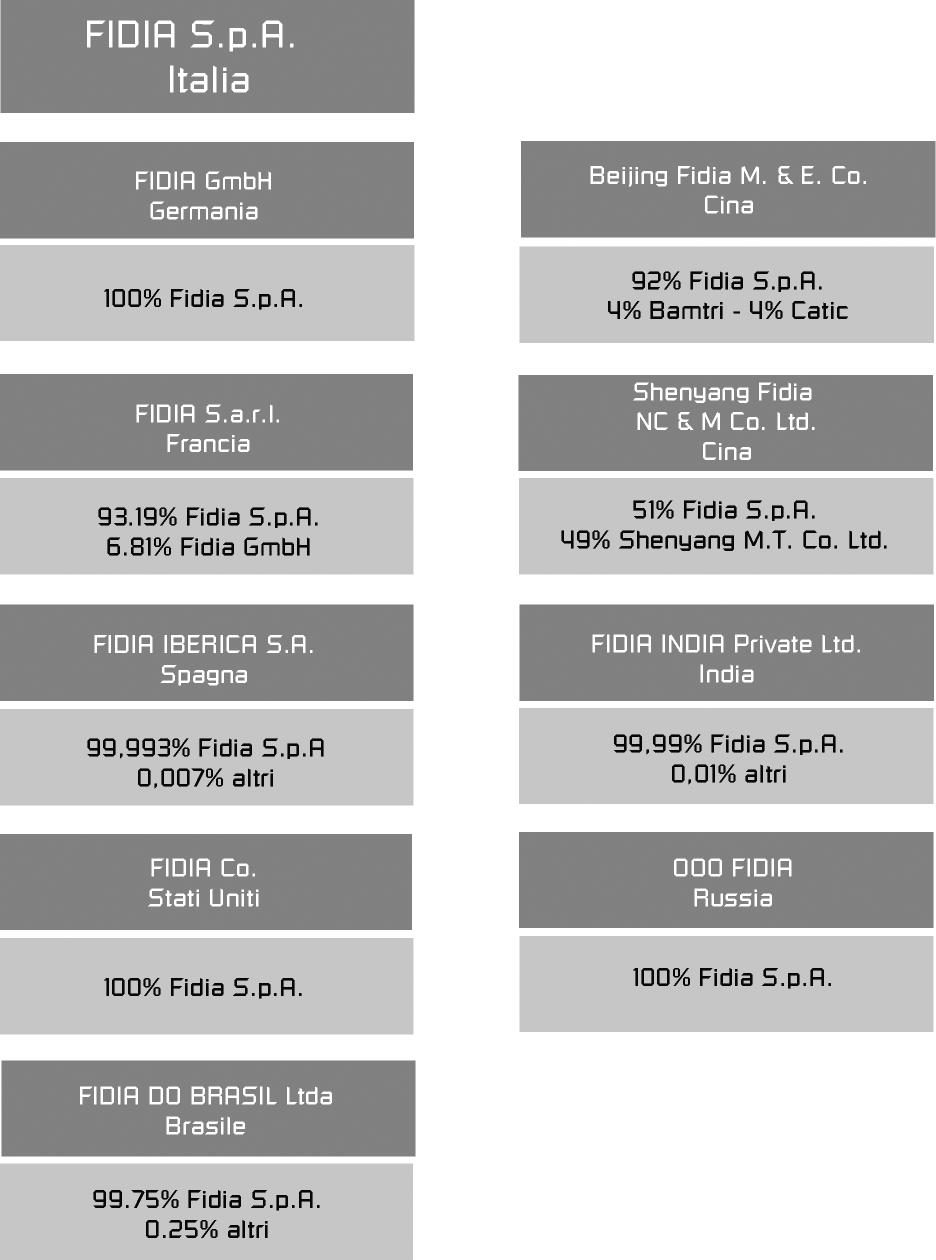
5 Organization of the FIDIA GROUP 5
6 FIDIA GROUP RECLASSIFIED FINANCIAL STATEMENTS AT 31 MARCH
7 Reclassified consolidated income statement ( thousand) Q % Q % Net revenue 7, % 7, % Changes in inventories of finished goods and W.I.P. 2, % 2, % Other revenues and income % % Value of production 10, % 10, % Raw materials and consumables (4,972) -45.8% (3,813) -37.4% Commissions (99) -0.9% (193) -1.9% Transport (367) -3.4% (228) -2.2% Contractors (556) -5.1% (629) -6.2% Other services and operating costs (2,256) -20.8% (2,353) -23.1% Added value 2, % 2, % Personnel costs (4,474) -41.2% (4,549) -44.7% EBITDA (1,856) -17.1% (1,579) -15.5% Bad debts provision (80) -0.7% (28) -0.3% Depreciation and amortization (278) -2.6% (202) -2.0% EBIT (2,215) -20.4% (1,810) -17.8% Net finance income and costs (139) -1.3% (27) -0.3% Profit/(Loss) on exchange rates (17) -0.2% (10) -0.1% Earnings before tax (EBT) (2,371) -21.8% (1,847) -18.1% Income taxes (current, paid and deferred) (64) -0.6% (121) -1.2% Net profit (loss) for the period (2,435) -22.4% (1,968) -19.3% - (Profit)/Loss of non-controlling interests (41) -0.4% (13) -0.1% - Profit/(Loss) of Group (2,395) -22.0% (1,955) -19.2% 7
8 Consolidated statement of financial position ( thousand) 31/03/ /12/ /03/2017 Net tangible assets 11,181 11,267 11,260 Intangible fixed assets 1,911 1,758 1,403 Non-current financial assets Deferred tax assets Other non-current assets Capital assets (A) 14,643 14,538 14,464 Net trade receivables from customers 11,860 14,339 8,575 Closing inventories 21,629 17,846 21,575 Other current assets 1,643 1,263 2,304 Short-term (current) assets (B) 35,131 33,448 32,454 Trade payables to suppliers (11,482) (9,928) (9,005) Other current liabilities (16,084) (15,801) (11,911) Short-term (current) liabilities (C) (27,566) (25,729) (20,916) Net working capital (D) = (B+C) 7,565 7,719 11,538 Termination benefits (E) (2,246) (2,292) (2,359) Other long-term liabilities (F) (428) (470) (161) Net invested capital (G) = (A+D+E+F) 19,533 19,494 23,482 Financial position Available-for-sale financial assets Cash on hand, bank deposits (8,548) (11,520) (10,137) Short-term loans 5,805 6,329 5,204 Assets/liabilities for current derivatives Other current financial payables Short-term financial position (2,743) (5,191) (4,851) Long-term loans, net of current portion 11,436 11,294 12,510 Assets/liabilities for long-term derivatives Net financial position (receivable)/payable (H) 8,745 6,169 7,672 Share capital 5,123 5,123 5,123 Provisions 6,183 9,362 10,595 Net earnings pertaining to Group (2,395) (3,066) (1,955) Total shareholders equity of Group 8,911 11,419 13,763 Total equity of non-controlling interests 1,876 1,905 2,047 Total shareholders equity (I) 10,787 13,324 15,810 Shareholders equity and net financial position (L) = (H+I) 19,533 19,494 23,482 8
9 OPERATING AND FINANCE PERFORMANCE Profit and loss Revenues In the first quarter of 2018, the Group recorded revenues of 7,693 thousand, compared to 7,504 thousand in the same period of 2017, an increase of 2.5%. This performance is the result of different trends in the three business lines in which the Group operates. In the electronics sector - CNC - the decrease in revenues compared to 2017 is rather strong (-34.7%); the high-speed milling systems sector - HSM - closed the period with an increase (+6.9%), as did the after-sales service sector - Service - (+11.8%). The revenues trend per business line is summarised in the table below: ( thousand) Q % Q % % Chg Numerical controls, drives and software % 1, % -36.2% High-speed milling systems 4, % 3, % 6.8% After-sales service 2, % 2, % 11.8% Grand total 7, % 7, % 2.5% The revenues by geographical region is illustrated in the following tables: ( thousand) GEOGRAPHICAL TOTAL REVENUES TOTAL REVENUES % Chg AREA Q Q ITALY 1, % % 57.2% EUROPE 2, % 2, % -7.1% ASIA 2, % 1, % 42.0% NORTH and SOUTH AMERICA 1, % 2, % -46.6% REST OF THE WORLD % 0 0.0% - TOTAL 7, % 7, % 2.5% 9
10 Sales and marketing activity The following tables show the trend in the backlog orders and new orders. TOTAL TOTAL % Chg ( thousand) Q Q Order backlog at 1/1 31,367 14, % New orders 18,357 11, % Revenues (4,869) (4,980) -2.2% Order backlog at 31/3 44,855 20, % The order backlog was up sharply compared to the first quarter of 2017 (+114.9). This is the result of the good performance of new orders in the first quarter, which was significantly higher YOY, and of sales that were unchanged in the period. Other revenues and income The other revenues of the first quarter 2018 amounted to 469 thousand ( 430 thousand in the same period of 2017). This figure includes the other revenues from ordinary activity, but that cannot be included in the typical sale of goods and services. This item includes: research grants from the EU and Italian Ministry of Education, University and Research (MIUR) as part of the funded research activity carried out by the parent company Fidia S.p.A. ( 105 thousand, 86 thousand at 31 March 2017); release of the warranty, bad debts and/or any accruals in excess of the risk to be covered ( 67 thousand; 168 thousand at 31 March 2017); internal construction of tangible assets and the capitalization of product development costs ( 210 thousand; 121 thousand at 31 March 2017); contingent assets, recovery of costs, income on disposal of property, plant and equipment and other sundry incomes ( 86 thousand; 56 thousand in the same period of last year). Value of production The value of production, equal to 10,868 thousand, increased compared to the first quarter of 2017 (683 thousand); this is due to the combined effect of the increase in revenues from sales (+ 189 thousand YOY), a greater positive change in inventories of finished products and work in progress (+ 455 thousand and other revenues (+ 39 thousand YOY). Other services and operating costs This figure amounted in the first quarter of 2018 to 2,256 thousand, down compared to 2,353 thousand in the same period of
11 Added value Added value amounted to 2,617 thousand, down from 2,970 thousand in the same period of Personnel The following tables illustrate the trends in staffing and labor costs. Q Q Abs. change % Chg Executives % Clerks and cadres % Workers % Total employees % Total average number of employees in the quarter % Q Q Abs. change % Chg Labor cost ( thousand) 4,474 4, % Cost of labour decreased by 75 thousand, corresponding to approximately 1.65% YOY; this trend was due mainly to a decrease in staff. EBITDA EBITDA was negative by 1,856 thousand, which was worse than the negative result of 1,579 thousand in the same period of last year. EBIT EBIT recorded a loss of 2,215 thousand, which was worse than the loss of 1,810 thousand reported in the same period of last year. Earnings before tax (EBT) Overall, financial management made a negative contribution to net financial income and expenses of 139 thousand at 31 March Exchange rate differences, whether realised or not, amounted to - 17 thousand, as a summary of the contributions of the various branches. In light of the contribution from financial management, the earning before tax is a loss of 2,371 thousand, versus a loss of 1,847 thousand YOY. Consolidated net result The net consolidated result was a loss of 2,435 thousand ( 2,395 thousand attributable to the Group) compared to a loss of 1,968 thousand (of which 1,955 thousand attributable to the Group) in the first quarter of
12 Analysis of the financial data Net financial position ( thousand) 31/03/ /12/ /03/2017 Available-for-sale financial assets Cash on hand, bank deposits 8,548 11,520 10,137 Overdrawn bank accounts and short-term advances (459) (247) (493) Short-term loans (5,346) (6,082) (4,711) Assets/liabilities for current derivatives - - (82) Other current financial payables Short-term financial position 2,743 5,191 4,851 Long-term loans, net of current portion (11,436) (11,294) (12,510) Assets/liabilities for long-term derivatives (52) (66) (14) Net financial position (8,745) (6,169) (7,672) The detailed credit items of the net financial position are illustrated below. ( thousand) 31/03/ /12/ /03/2017 AVAILABLE-FOR-SALE FINANCIAL ASSETS CASH ON HAND, BANK DEPOSITS Fidia S.p.A. 4,032 7,140 4,634 Fidia Co. 1,284 1, Fidia GmbH Fidia Iberica S.A Fidia S.a.r.l Beijing Fidia Machinery & Electronics Co.,Ltd ,166 Fidia do Brasil Ltda Shenyang Fidia NC & M Co., Ltd TOTAL 8,548 11,520 10,137 12
13 ( thousand) 31/03/ /12/ /03/2017 Short-term loans and advances Fidia S.p.A. (5,736) (6,258) (5,134) Fidia GmbH (50) (59) (55) Fidia Iberica S.A. (19) (12) (14) TOTAL (5,805) (6,329) (5,204) (Assets)/liabilities for current derivatives Fidia S.p.A. - (82) Other current financial payables TOTAL - - (82) Fidia S.p.A Long-term loans, net of current portion Fidia S.p.A. (11,373) (11,238) (12,460) Fidia GmbH (35) (45) (30) Fidia Iberica S.A. (28) (11) (20) TOTAL (11,436) (11,294) (12,510) (Assets)/liabilities for long-term derivatives Fidia S.p.A. (52) (66) (14) (52) (66) (14) Total financial payables (17,293) (17,689) (17,810) At 31 March 2018 the net financial position was negative at 8,745 thousand; the change from 31 December 2017 was affected negatively mainly by the loss in the period, while the effect of working capital was null. The trend in the net financial position is illustrated below: SHORT CONSOLIDATED CASH FLOW STATEMENT ( thousand) Q Year 2017 Q A) Cash and cash equivalents at beginning of period 11,273 8,440 8,440 B) Cash from/(used in) operating activities during the period (2,133) 5,973 1,973 C) Cash from/(used in) investing activities (377) (2,398) (1,096) D) Cash from/(used in) financing activities (584) Currency translation differences (91) (1,111) (111) E) Net change in cash and cash equivalents (3,184) 2,833 1,204 F) Cash and cash equivalents at end of period 8,089 11,273 9,644 Breakdown of cash and cash equivalents: Cash and cash equivalents 8,548 11,520 10,137 Overdrawn bank accounts (459) (247) (493) 8,089 11,273 9,644 13
14 Reconciliation between equity and net profit of the Parent Company and the Group Pursuant to the Consob Communication of 28 July 2006, the reconciliation between the result for 2018 and the Group's shareholders' equity at 31 March 2018 (a share attributable to the Group) and the corresponding values of the parent company Fidia S.p.A. (values in thousands of euro) is shown below: Shareholders' Changes Profit/(loss) Shareholders' Equity S.E Equity Financial Statements of Fidia S.p.A. 8, (2,102) 6,656 Consolidation adjustments * Elimination of book value of investments 2,760 (124) (275) 2,360 * Transactions between consolidated companies (87) (18) (105) * Exchange rate differences on intra-group transactions (1) Consolidated Financial Statements (attributable to the Group) 11,419 (112) (2,395) 8,911 SEGMENT REPORTING Economic performance by business sector The following table shows the consolidated results broken down into the three traditional sectors in which the Group operates (Numerical Controls - CNC -, High Speed Milling Systems - HSM -, and Service). The last columns show those items that cannot be classified; these items are mainly general and administrative costs and costs for advertising, promotion and exhibitions for the companies operating in all business lines. Cross-sector revenues consist of numerical controls, switchboards and components and electromechanical systems transferred by the electronics sector to the milling systems sector and of the milling heads manufactured by the milling systems sector and transferred to the electronics sector for sale. 14
15 CONSOLIDATED INCOME STATEMENT by business sector Below follow the consolidated economic results broken down by sector at 31 March 2018 and 31 March Progressive data at March CNC HSM SERVICE N/A TOTAL ( thousand) 2018 % 2018 % 2018 % Revenues ,2% ,0% ,0% Cross-sector revenues ,8% - 0,0% - 0,0% - Total reclassified revenues ,0% ,0% ,0% - Changes in inventories of finished goods and W.I.P. (2) -0,2% ,8% 153 5,4% Raw materials and consumables (301) - 129,7% (4.100) -97,6% (530) -18,8% (41) (4.972) Cross-sector expenses ,4% (553) -13,2% 209 7,4% 10 - Commissions (3) -1,3% (97) -2,3% - 0,0% - (99) Transport (13) -5,8% (223) -5,3% (128) #DIV/0! (2) (367) Contractors (102) -11,4% (452) -10,8% (2) -0,1% - (556) Sales margin ,5% ,7% ,4% (33) Other operating revenue ,0% 147 3,5% 64 2,3% Other operating costs (98) -10,9% (568) -13,5% (456) -16,2% (1.133) (2.256) Personnel costs (688) -76,5% (1.416) -33,7% (1.464) -51,8% (905) (4.474) Depreciation, amortization and writedowns (38) -4,2% (153) -3,6% (69) -2,5% (98) (358) Operating profit/(loss) (45) -5,0% (660) -15,7% ,3% (2.109) (2.215) 15
16 Progressive data at March CNC HSM SERVICE N/A TOTAL ( thousand) 2017 % 2017 % 2017 % Revenues ,7% ,7% ,0% Cross-sector revenues ,3% 94 2,3% - 0,0% - Total reclassified revenues ,0% ,0% ,0% - Changes in inventories of finished goods and W.I.P ,8% ,7% (55) -2,2% Raw materials and consumables (191) -82,3% (3.402) -84,5% (184) -7,3% (36) (3.813) Cross-sector expenses 20 1,5% (657) -16,3% ,5% (4) - Commissions (7) -3,0% (184) -4,6% (2) -0,1% 0 (193) Transport (6) -2,6% (128) -3,2% (87) 158,2% (7) (228) Contractors (138) -10,4% (490) -12,2% (1) 0,0% (629) Sales margin ,5% ,0% ,4% (47) Other operating revenue 131 9,8% 177 4,4% 82 3,2% Other operating costs (113) -8,5% (477) -11,9% (542) -21,5% (1.221) (2.353) Personnel costs (709) -53,3% (1.481) -36,8% (1.390) -55,0% (969) (4.549) Depreciation, amortization and writedowns (32) -2,4% (61) -1,5% (44) -1,7% (93) (230) Operating profit/(loss) ,2% (515) -12,8% ,4% (2.290) (1.810) 16
17 SUMMARY OF THE GROUP PERFORMANCE, SIGNIFICANT EVENTS AND BUSINESS OUTLOOK The first quarter of 2018 was characterised by a modest increase in the value of production (6.7%), negatively affected by the postponement of the installation of two projects, both Italian, due to internal problems of the end customers; The characteristic of the company's cost structure, which is mainly fixed, and the sales mix in the first quarter unfortunately worsened profitability compared to the same period of Total Group new orders increased significantly compared to 2017 (+64.1%), amounting to 18,456 thousand compared to 11,245, and the order backlog amounted to 44,855 thousand ( 20,873 thousand in the same period of 2017). Taking into account the historical cyclical nature of revenues and in the presence of an order backlog that covers the entire financial year abundantly, the management expects a positive trend in the economic results for the remaining quarters of the financial year. On behalf of the Board of Directors The Chairman and Managing Director Mr. Giuseppe Morfino 17
18 FIDIA GROUP Condensed consolidated financial statements Consolidated accounting schedules and Notes at 31 March
19 CONSOLIDATED INCOME STATEMENT ( thousand) Notes 1st Quarter st Quarter Net sales Other operating revenue Total revenue Changes in inventories of finished goods and W.I.P Raw materials and consumables 3 (4.972) (3.813) - Personnel costs 4 (4.474) (4.549) - Other operating costs 5 (3.279) (3.403) - Depreciation, amortization and writedowns 6 (358) (230) Operating profit/(loss) (2.215) (1.810) - Non-recurring income/(expenses) Operating profit/(loss) (2.215) (1.810) - Financial income/(expenses) 8 (157) (37) Profit/(loss) before tax (2.371) (1.847) - Income tax 9 (64) (121) Profit/(loss) for continuing operations (2.435) (1.968) Profit/(loss) for discontinued operations - - Profit (loss) for the period (2.435) (1.968) Profit/(loss) attributable to: - Shareholders of parent company (2.395) (1.955) - Non-controlling interests (41) (13) (EUR) Earning per share 10 (0,47) (0,38) Diluted earnings per ordinary share 10 (0,47) (0,38) 19
20 CONSOLIDATED STATEMENT OF COMPREHENSIVE INCOME ( thousand) 1st Quarter st Quarter 2017 Profit (loss) for the period (A) (2.435) (1.968) Other comprehensive profit/(loss) that may subsequently be reclassified in profit or loss: Profit/(loss) on cash flow hedges Profit(loss) on translation of financial statements of foreign companies (112) (145) Tax effect pertaining to Other comprehensive profit/(loss) that may be reclassified in profit or loss (3) (3) Total Other comprehensive profit/(loss) that may subsequently be reclassified in profit or loss, net of tax effect (B1) (101) (138) Other comprehensive profit/(loss) that may not subsequently be reclassified in profit or loss: Net actuarial gains/(losses) on defined benefit plans - - Tax effect pertaining to Other comprehensive profit/(loss) that may not be reclassified in profit or loss - - Total Other comprehensive profit/(loss) that may not subsequently be reclassified in profit or loss, net of tax effect (B2) 0 0 Total Other comprehensive profit/(loss), net of tax effect (B)=(B1)+(B2) (101) (138) Total comprehensive profit/(loss) for the period (A)+(B) (2.536) (2.106) Total comprehensive profit/(loss) due to: Shareholders of the parent company (2.507) (2.082) Non-controlling interests (29) (24) 20
21 CONSOLIDATED STATEMENT OF FINANCIAL POSITION ( thousand) Notes March 2018 December 2017 ASSETS NON-CURRENT ASSETS - Property, plant and equipment Intangible assets Investments Other non-current receivables and assets Pre-paid tax assets TOTAL NON-CURRENT ASSETS CURRENT ASSETS - Inventory Trade receivables Current tax receivables Other current receivables and assets Other current financial receivables Cash and cash equivalents TOTAL CURRENT ASSETS TOTAL ASSETS LIABILITIES SHAREHOLDERS EQUITY - Share capital and reserves attributable to shareholders of parent company Non-controlling interests TOTAL CONSOLIDATED EQUITY NON-CURRENT LIABILITIES - Other non-current payables and liabilities Termination benefits Deferred tax liabilities Provisions for risks and expenses Other non-current financial liabilities Non-current financial liabilities TOTAL NON-CURRENT LIABILITIES CURRENT LIABILITIES - Current financial liabilities Other current financial liabilities Trade payables Current tax payables Other current payables and liabilities: Provisions for risks and expenses TOTAL CURRENT LIABILITIES TOTAL LIABILITIES
22 22
23 CONSOLIDATED STATEMENT OF CASH FLOWS ( thousand) 1st Quarter st Quarter 2017 A) Cash and cash equivalents at beginning of period B) Cash from/(used in) operating activities during the period: - Result of Group and non-controlling interests (2.435) (1.968) - Amortisation Net loss (gain) on disposal of tangible assets (3) 0 - Net change in provision for employee severance pay (46) 29 - Net change in provisions for risks and charges (76) (132) - Net change (assets) liabilities for (pre-paid) deferred taxes (22) 6 - Net change in working capital: - receivables inventory (3.782) (2.199) - payables ** (2.133) C) Cash from/(used in) investing activities - Investments in property, plant and equipment (171) (979) intangible fixed assets (208) (117) - Proceeds from the sale of: property, plant and equipment 3 - non-current financial assets - (377) (1.096) D) Cash from/(used in) financing activities - Change in loans *** (593) Distribution of dividends - (1.023) - Change in capital and reserves 23 (4) - Net change in other current and non-current financial assets and liabilities (14) (125) (584) 438 Currency translation differences (90) (111) E) Net change in cash and cash equivalents (3.184) F) Cash and cash equivalents at reporting date Breakdown of cash and cash equivalents: Cash and cash equivalents Overdrawn bank accounts (459) (493) (**) of which 45 thousand in taxes paid (***) of which 68 thousand in interest paid 23
24 STATEMENT OF CHANGES IN CONSOLIDATED SHAREHOLDERS EQUITY ( thousand) Share capital Own shares Capital reserves Retained earnings Cash flow hedge reserve Translation reserve Reserve for actuarial profit/loss Other reserves Profit/(loss) for the year Total Group Shareholders Equity Other noncontrolling interests Total Shareholder s Equity Balance at 31 December (45) (15) (94) Allocation of profit (2.462) Distribution of dividends (1.023) (1.023) (1.023) Total comprehensive profit/(loss) 7 (134) (1.955) (2.083) (24) (2.107) Other changes Balance at 31 March (45) (8) (94) 213 (2.978) Balance at 31 December (45) (46) (127) 213 (3.066) Allocation of profit (3.066) Distribution of dividends Total comprehensive profit/(loss) 11 (124) (2.395) (2.508) (29) (2.537) Other changes Balance at 31 March (45) (35) (127) 213 (2.395)
25 Notes MAIN BUSINESS Fidia S.p.A. is a company under Italian law. Fidia S.p.A. and its subsidiaries ( Group ) are active in over 30 countries. The Group is engaged in the manufacturing and sale of numerical controls and software, highspeed milling systems and after-sales service. The Group headquarters are located in San Mauro Torinese (Turin), Italy. The Consolidated Financial Statements of the Fidia Group are presented in euro, i.e., the accounting currency of the Parent Company and main economies in which the Group has operations. Unless otherwise specified, the amounts are expressed in thousands of euros. SIGNIFICANT ACCOUNTING STANDARDS Principles for the presentation of the Interim Report This Quarterly Report at 31 March 2018 has been prepared in accordance with the International Financial Reporting Standards ( IFRS ) issued by the International Accounting Standards Board ( IASB ) and adopted by the European Union. The designation IFRS also includes all currently valid International Accounting Standards ( IAS ), as well as all interpretations of the International Accounting Reporting Interpretations Committee ( IFRIC ), formerly the Standing Interpretations Committee ( SIC ). These Quarterly Consolidated Financial Statements have been prepared in accordance with IAS 34 Interim Financial Reporting, applying two new accounting standards compared to those used in the preparation of the Consolidated Financial Statements at 31 December 2017; IFRS 15_ The new accounting standard "IFRS 15 - Revenues from contracts with customers" came into force on 1 January The Group has applied the new standard using the modified retrospective method. This method consisted in accounting for the cumulative effect of the initial application of the new standard on opening equity, without restating comparative data. The Group completed its assessment of the effects of IFRS 15, identifying the main effects related to the adoption of the new standard in the treatment of obligations for warranties. In fact, in its contracts with customers, the Group generally provides warranties for repairs of a general nature and also provides extended warranties. Accordingly, warranties required by law are regarded in the application of IFRS 15 as insurancetype warranties that continue to be accounted for in accordance with IAS 37 Provisions, Contingent Liabilities and Contingent Assets, consistently with the current practice. Extended warranties, which provide customers with an additional service to insurance-type warranties, should be considered, with the introduction of the new IFRS 15, as separate services to which a portion of the transaction price should be allocated. 25
26 IFRS 9_From 1 January 2018, the new accounting standard "IFRS 9 - Financial Instruments", which replaces "IAS 39 Financial Instruments: Recognition and Measurement and all previous versions of IFRS 9. IFRS 9 brings together all three aspects relating to the project on the accounting of financial instruments: classification and valuation, impairment and hedge accounting. The Group has adopted the new standard from the date of its entry into force and has not restated comparative information. The main impacts are shown below: a) Classification and measurement The Group did not record significant impacts on its financial statements and shareholders' equity as a result of the application of the classification and measurement requirements set out in IFRS 9. Trade receivables are held for the purpose of collecting the cash flows relating to the collection of principal and interest at contractual due dates. The Group has analysed the characteristics of the contractual cash flows of these instruments and concluded that they comply with the criteria for valuation at amortised cost in accordance with IFRS 9. Therefore, there was no need to reclassify these financial instruments. b) Impairment IFRS 9 requires the Group to record losses on expected receivables on all its portfolio bonds, loans and trade receivables, with reference to either a 12-month period or the entire contractual term of the instrument ("lifetime expected loss"). The Group has applied the simplified approach and therefore recorded expected losses on all trade receivables based on their remaining contractual life. c) Hedge accounting The Group has established that all existing hedging relationships that are currently designated as effective hedges continue to qualify for hedge accounting in accordance with IFRS 9. Since IFRS 9 does not change the general principle according to which an entity accounts for effective hedging relationships, the application of the requirements of IFRS 9 for the purpose of defining hedges has not had significant impacts on the Group's financial statements. The preparation of the interim financial statements requires management to make estimates and assumptions that affect the reported amounts of revenues, expenses, assets, liabilities and the disclosure of contingent assets and liabilities at the date of the interim financial statements. In the future, should such estimates and assumptions, which are based on management s best judgment, deviate from the actual circumstances, the original estimates and assumptions will be modified as appropriate in the period in which the circumstances change. It should also be noted that certain valuation processes, in particular the more complex ones, such as the determination of any impairment losses on non-current assets, are generally carried out in full only when the annual financial statements are drawn up, when all the information that may be necessary is available, except in cases where there are indications of impairment that require an immediate assessment of any impairment losses. The actuarial valuations needed to determine the provisions for employee benefits are also normally made only when the half-yearly financial report and the annual financial statements are prepared. The Group carries out activities that on the whole present significant cyclical variations in total sales during the year. 26
27 Taxes have been determined on the basis of the best estimate of the average tax rate estimate expected for the whole financial year for each company included in the scope of consolidation. Scope of consolidation There was no change in the consolidation area compared to the consolidated financial statements at 31 March The companies included in the scope of consolidation, compared with those resulting at the end of 2017 and at the end of the same period of last year, are listed below: Name / Registered office Curren cy Share capital Equity ownership at 31/3/2018 Equity ownership at 31/12/2017 Equity ownership at 31/3/2017 Fidia Gmbh, Dreiech - Germany EUR 520, % 100% 100% Fidia Co, Rochester Hills (USA) USD 400, % 100% 100% Fidia Sarl, Emerainville France EUR 300, % 93.19% 93.19% Fidia Iberica S.A., Zamudio - Spain EUR 180, % % % Fidia do Brasil Ltda, Sao Paulo Brazil Reals 400, % 99.75% 99.75% Beijing Fidia M&E Co Ltd., Beijing - China Rmb 1,500,000 96% 96% 96% Shenyang Fidia NC & Machine Company Ltd., Shenyang China Rmb 42,517,648 51% 51% 51% OOO Fidia, Mosca Russian Federation Rouble 3,599, % 100% 100% 27
28 COMPOSITION AND MAIN CHANGES INCOME STATEMENT 1. NET SALES Turnover by line of business (net of intragroup items) is indicated more in detail in the following table: ( thousand) 1st Quarter 2018 % 1st Quarter 2017 % Numerical controls, drives and software 668 8,7% ,0% High-speed milling systems ,6% ,4% After-sales service ,7% ,7% Total revenues ,0% ,0% Group revenues increased as a whole by 2.5% YOY. The drop in the numerical controls area is offset by an increase in milling systems of around 7% and in service of around 12%. 2. OTHER REVENUES AND INCOME The other revenues of the first quarter 2018 amounted to 469 thousand ( 430 thousand in the same period of 2017). This figure includes the other revenues from ordinary activity, but that cannot be included in the typical sale of goods and services. This item includes: research grants from the EU and Italian Ministry of Education, University and Research (MIUR) as part of the funded research activity carried out by the parent company Fidia S.p.A. ( 105 thousand, 86 thousand at 31 March 2017); release of the warranty, bad debts and/or any accruals in excess of the risk to be covered ( 67 thousand; 168 thousand at 31 March 2017); internal construction of tangible assets and the capitalization of product development costs ( 210 thousand; 121 thousand at 31 March 2017); contingent assets, recovery of costs, income on disposal of property, plant and equipment and other sundry incomes ( 86 thousand; 56 thousand in the same period of last year). 28
29 3. RAW MATERIALS AND CONSUMABLES In the first quarter of 2017, consumption of raw materials and consumables amounted to 4,972, up from 3,813 thousand in the first quarter of 2017 due to higher value of production and a different product mix. 4. PERSONNEL COSTS Personnel costs amount to 4,474 thousand compared to 4,549 thousand in the same period of 2017 and are therefore down by 75 thousand, or about 1.60%, compared to the same period of the previous year; 5. OTHER SERVICES AND OPERATING COSTS Other services and operating costs amounted to 3,279 thousand, down 3,403 thousand YOY; In detail, these costs can be broken down as follows: cost for services related to the revenues (subcontractors, transport, duties and commissions), 1,023 thousand versus 1,050 thousand in the same period of 2017 (- 27 thousand); production costs and expenses for miscellaneous technical service, 761 thousand at 31 March 2018, versus 783 thousand YOY (- 22 thousand); expenses incurred for trade fairs, entertainment expenses, travel expenses and commercial services, 165 thousand at 31 March 2018, versus 195 thousand at 31 March 2017 (- 30 thousand); R&D costs and related refund of expenses, 144 thousand at 31 March 2018, versus 107 thousand at 37 March 2017 (- 37 thousand); overheads, technical and administrative consulting, utilities, rent, legal expenses, contingent liabilities and other expenses, 1,186 thousand at 31 March 2018, versus 1,267 thousand at 31 March 2017 (- 81 thousand). 6. DEPRECIATION, AMORTIZATION AND WRITEDOWNS ( thousand) 1st Quarter st Quarter 2017 Amortization of intangible fixed assets Amortization of property, plant and equipment Bad debts Total
30 7. NON-RECURRING REVENUE In the first three months of 2018, there were no non-recurring revenue or expenses. 8. FINANCE REVENUE (EXPENSES) Financial revenue (expenses) consisted of: ( thousand) 1st Quarter st Quarter 2017 Finance revenue Borrowing costs (149) (60) Net profit (loss) on derivatives - 21 Profit (loss) from foreign currency transactions (17) (10) Total (156) (37) Finance revenue consists of: ( thousand) 1st Quarter st Quarter 2017 Interests received from banks 1 2 Interests and commercial discounts - - Other interests received 9 10 Total Finance expenses consist of: ( thousand) 1st Quarter st Quarter 2017 Interests paid on short-term borrowings from banks (9) (4) Interest expense on M/L-term loans from banks (48) (42) Interests paid on payables to leasing companies (76) 0 Borrowing costs on termination benefits - - Other borrowing costs (17) (14) Total (149) (60) Net profit (loss) on derivatives consist of: ( thousand) 1st Quarter st Quarter 2017 Expenses on derivatives due to fair value adjustment - (1 ) Gains on derivatives due to fair value adjustment - 22 Total - 21 Expenses and income from derivative instruments include the fair value measurement of five interest rate swaps entered into by the parent company Fidia S.p.A. to hedge the risk of interest rate fluctuations on five medium/long-term loans. 30
31 Profit (loss) on foreign currency transactions consists of: ( thousand) 1st Quarter st Quarter 2017 Exchange rate gain Revenue from exchange rate adjustment 42 7 Profit on currency forward contract 0 24 Exchange rate loss (98) (75) Expenses from exchange rate adjustment (33) (4) Loss on currency forward contract - - Total (17) (10) 9. INCOME TAX Taxes recognised in the consolidated income statement amounted to - 64 thousand (- 121 thousand at 31 March 2017) including deferred tax assets and liabilities. The following table shows the balance of deferred tax assets and liabilities at 31 March 2018: ( thousand) March 2018 December 2017 Deferred tax assets Deferred tax liabilities (44) (46) Total EARNING PER SHARE The calculation of the earnings per share is based on the following data: 1st Quarter st Quarter 2017 Net earnings pertaining to Group thousand (2.395) (1.955) Profit/(loss) of ordinary shares thousand (2.395) (1.955) Number of circulating ordinary shares number Earning per share EUR (0,47) (0,38) Diluted earnings per ordinary share EUR (0,47) (0,38) There was no difference between the earnings per share and diluted earnings per share, as Fidia S.p.A. does not have circulating financial instruments that can affect the earnings by share. 31
32 STATEMENT OF FINANCIAL POSITION 11. PROPERTY, PLANT AND EQUIPMENT ( thousand) Buildings Total plant, machinery and equipment Other assets Assets under development and advances Total Net carrying amount at 31/12/ Additions Net value of divestments Depreciation (113) (48) (62) - (223) Currency gain/(loss) (29) (1) (4) - (34) Net carrying amount at 31/3/ INTANGIBLE FIXED ASSETS Development costs Licenses Software Assets under development and advances ( thousand) Total Net carrying amount at 31/12/ Increases Decreases/transfers Depreciation (32) (7) (17) (55) Currency gain/(loss) 0 0 Closing net carrying amount at 31/3/ EQUITY INVESTMENTS This item, amounting to 16 thousand and unchanged compared to 31 December 2017, is made up of investments in associated companies valued at equity and investments in other companies valued at cost. 32
33 14. OTHER NON-CURRENT RECEIVABLES AND ASSETS The other non current receivables and assets are detailed below: Balance Balance ( thousand) March 2018 December 2017 Receivables for EU research grants Security deposits Non-recurring trade receivables Receivables for foreign VAT 16 7 Withholding tax on foreign income Multi-year pre-paid expenses 3 3 Sundry receivables 1 1 Total INVENTORY Balance Balance ( thousand) March 2018 December 2017 Raw materials Provisions for raw materials depreciation (2.091) (2.032) Semi-finished products and work in progress Finished products and goods for resale Provisions for depreciation finished products (481) (492) Advances Net value Inventory in the first quarter of the year increased by 3,783 thousand; the increase affected job orders in progress and finished products due to the level of production sustained. 33
34 16. TRADE RECEIVABLES Balance Balance ( thousand) March 2018 December 2017 Trade receivables from others Provision for bad debts (688) (651) Receivables from associates - - Total Trade receivables decreased compared to 31 December 2016, showing a change of - 2,479 thousand. 34
35 17. TAX RECEIVABLES AND OTHER CURRENT RECEIVABLES AND ASSETS Balance Balance ( thousand) March 2018 December 2017 Receivables from tax authorities for VAT 29 8 Tax receivables for income tax and IRAP Receivables for short-term foreign VAT Other tax receivables 16 9 Total current tax receivables Research grants 41 - Sundry prepayments Pre-paid expenses Receivables from employees Advances from suppliers Other current receivables Total other current receivables Total OTHER CURRENT FINANCIAL ASSETS This item had a zero balance at 31 March CASH AND CASH EQUIVALENTS The overall amount of cash of the Group amounted to 8,548 thousand ( 11,520 thousand at 31 December 2017) and consisted mainly of temporary cash in bank deposits. These amounts are not subject to a significant risk of change in value. Credit risk correlated with cash and cash equivalents is limited because the counterparts are leading Italian and international banks. 35
36 20. SHAREHOLDERS EQUITY Consolidated shareholders' equity decreased by 2,537 thousand compared to 31 December 2017, from 13,324 thousand to 10,787 thousand. The decrease is due to the loss for the period (- 2,435 thousand), to the negative change of the translation reserve (- 124 thousand), and to the positive change of the cash flow edge reserve (+ 11 thousand, net of the theoretical tax effect) other minor changes (+ 12 thousand). At 31 March 2018, the fully paid share capital is unchanged compared to 31 December 2017 and is represented by 5,123,000 ordinary shares with a nominal value of 1 each. 21. OTHER NON-CURRENT PAYABLES AND LIABILITIES This item, which amounts to 365 thousand ( 402 thousand at 31 December 2017), mainly medium/long-term payables to the European Union for advances on grants. 22. EMPLOYEE SEVERANCE INDEMNITIES Employee severance indemnities amounted to 2,246 thousand ( 2,292 thousand at 31 December 2017) and reflect the indemnity accrued at the end of the period by employees of the parent company Fidia S.p.A. 23. OTHER NON-CURRENT FINANCIAL LIABILITIES This item amounts to 52 thousand ( 66 thousand at 31 December 2017) and consists of the fair value of five interest rate swaps signed in order to cover the risk on interest rate change on five medium/long-term loans. 36
37 24. CURRENT AND NON-CURRENT FINANCIAL LIABILITIES This figure amounts to 17,241 thousand as detailed below. Balance Balance ( thousand) March 2018 December 2017 Overdrawn bank accounts and short-term advances Financial accruals and deferrals Bank loans Finance leases Lease financing Total There are no financial payables with a residual duration of more than 5 years, with the exception of the property lease. 25. OTHER CURRENT FINANCIAL LIABILITIES This item is unchanged compared to 31 December 2017 and equal to TRADE PAYABLES Balance Balance ( thousand) March 2018 December 2017 Payables to other suppliers Payables to subsidiaries 2 2 Total trade payables Trade payables, amounting to 11,482 thousand at 31 March 2018, are up compared to the end of the previous year. 37
38 27. TAX LIABILITIES AND OTHER CURRENT PAYABLES AND LIABILITIES Balance Balance ( thousand) March 2018 December 2017 Payables to employees Social security payables Advance from customers Advances for EU grants - - Payables for emoluments Payables to State Fund and other funds Payables for dividends to be distributed Sundry accruals and deferred income Sundry payables to the SMTCL company Miscellaneous payables Total other payables Withholding tax Tax payables for income tax and IRAP Tax payables for VAT Other short-term tax payables Total tax payables Total Advances from customers consist both of advance receipts from customers and by the value of machines already delivered and still pending acceptance. 38
39 28. PROVISIONS FOR RISKS AND CHARGES Provisions for risks and charges amounted to 1,045 thousand ( 1,120 thousand at 31 December 2017). This item refers to 995 thousand for the warranty provision, which represents the best estimate of the commitments undertaken by the Group by contract, by law or custom, in relation to charges related to the warranty on its products for a certain period starting from their sale to the end customer; 50 thousand to a provision set aside by the subsidiary Fidia Co for legal risks. 29. COLLATERAL GUARANTEES, OBLIGATIONS AND OTHER CONTINGENT LIABILITIES The total guarantees granted in the name of the Group to third parties amounted to 3,491 thousand ( 1,018 thousand at 31 March 2017). This item consists primarily of performance bonds for commercial transactions with foreign customers ( 3,433 thousand) and of guarantees covering real estate leases ( 58 thousand). Contingent liabilities At 31 March 2018, Fidia Group, although it is exposed to various risks (product liability, legal and fiscal risks), is not aware of circumstances that might generate foreseeable contingent liabilities or contingent liabilities the amount of which may be estimated and therefore does not believe it necessary to make any further allocations. From a fiscal perspective, it should be noted that on 8 March 2018, the company was the subject of a tax audit, covering the years from 2013 to Given that this is still a very early pre-audit phase, the information available does not allow risk assessments or provision estimates to be made for the tax audit findings. 39
40 30. SEGMENT REPORTING Income statement by business sector Below follow the consolidated economic results by sector at 31 March 2018 and 31 March Progressive data at March CNC HSM SERVICE N/A TOTAL ( thousand) 2018 % 2018 % 2018 % Revenues ,2% ,0% ,0% Cross-sector revenues ,8% - 0,0% - 0,0% - Total reclassified revenues ,0% ,0% ,0% - Changes in inventories of finished goods and W.I.P. (2) -0,2% ,8% 153 5,4% Raw materials and consumables (301) -33,4% (4.100) -97,6% (530) -18,8% (41) (4.972) Cross-sector expenses ,4% (553) -13,2% 209 7,4% 10 - Commissions (3) -0,3% (97) -2,3% - 0,0% - (99) Transport (13) -1,5% (223) -5,3% (128) -4,5% (2) (367) Contractors (102) -11,4% (452) -10,8% (2) -0,1% - (556) Sales margin ,5% ,7% ,4% (33) Other operating revenue ,0% 147 3,5% 64 2,3% Other operating costs (98) -10,9% (568) -13,5% (456) -16,2% (1.133) (2.256) Personnel costs (688) -76,5% (1.416) -33,7% (1.464) -51,8% (905) (4.474) Depreciation, amortization and writedowns (38) -4,2% (153) -3,6% (69) -2,5% (98) (358) Operating profit/(loss) (45) -5,0% (660) -15,7% ,3% (2.109) (2.215) 40
41 Progressive data at March CNC HSM SERVICE N/A TOTAL ( thousand) 2017 % 2017 % 2017 % Revenues ,7% ,7% ,0% Cross-sector revenues ,3% 94 2,3% - 0,0% - Total reclassified revenues ,0% ,0% ,0% - Changes in inventories of finished goods and W.I.P ,8% ,7% (55) -2,2% Raw materials and consumables (191) -14,4% (3.402) -84,5% (184) -7,3% (36) (3.813) Cross-sector expenses 20 1,5% (657) -16,3% ,5% (4) - Commissions (7) -0,5% (184) -4,6% (2) -0,1% (193) Transport (6) -0,5% (128) -3,2% (87) 158,2% (7) (228) Contractors (138) -10,4% (490) -12,2% (1) 0,0% (629) Sales margin ,5% ,0% ,4% (47) Other operating revenue 131 9,8% 177 4,4% 82 3,2% Other operating costs (113) -8,5% (477) -11,9% (542) -21,5% (1.221) (2.353) Personnel costs (709) -53,3% (1.481) -36,8% (1.390) -55,0% (969) (4.549) Depreciation, amortization and writedowns (32) -2,4% (61) -1,5% (44) -1,7% (93) (230) Operating profit/(loss) ,2% (515) -12,8% ,4% (2.290) (1.810) Below follow the consolidated statements of financial position by business sector at 31 March 2018 and 31 December Assets and liabilities by line of business were measured using the same accounting standards adopted for the presentation of the Group Consolidated Financial Statements. 41
42 At 31 March 2018 CNC HSM SERVICE Non allocable Total ( thousand) Property, plant and equipment Intangible fixed assets Equity investments Other non-current receivables and assets Deferred tax assets Total non-current assets Inventory Trade receivables and other receivables Current taxes receivable Other current financial assets Cash and cash equivalents Total current assets Total assets Other non-current payables and liabilities Long-term provisions Employee severance indemnities Deferred tax liabilities Other non-current financial liabilities Non-current financial liabilities Total non-current liabilities Current financial liabilities Other current financial liabilities Trade payables and other current payables Current taxes payable Short-term provisions Total current liabilities Total liabilities Shareholders equity Total liabilities
FIDIA GROUP CONSOLIDATED QUARTERLY REPORT AT 31 MARCH 2017
 FIDIA GROUP CONSOLIDATED QUARTERLY REPORT AT 31 MARCH 2017 Fidia S.p.A. Registered office in San Mauro Torinese, Corso Lombardia, 11 Capital paid in 5,123,000 Turin Register of Companies Taxpayer's Code
FIDIA GROUP CONSOLIDATED QUARTERLY REPORT AT 31 MARCH 2016
 FIDIA GROUP CONSOLIDATED QUARTERLY REPORT AT 31 MARCH 2016 Fidia S.p.A. Registered office in San Mauro Torinese, corso Lombardia, 11 Paid-in share capital 5,123,000 Turin Companies Register TIN 05787820017
Half-yearly Financial Report. As at 30 June 2013
 Half-yearly Financial Report As at 30 June 2013 Fidia Group (Translation from the Italian that is the original report. This translation has to be intended solely for the convenience of international readers)
Fidia S.p.A.: the BoD approves the Half Yearly Report as at June 30, 2017
 Press release Fidia S.p.A.: the BoD approves the Half Yearly Report as at June 30, 2017 Order back-log: 29,3 million euros, doubled vs December 31, 2016 Order entry: 26 million euros (16,7 million euros
Fidia S.p.A.: the BoD approves the Quarterly Report as at September 30, 2017
 Press release Fidia S.p.A.: the BoD approves the Quarterly Report as at September 30, 2017 Main consolidated figures as at September 30, 2017 Net revenues: 28,8 million euros (37,1 million euros as at
ACCORDING TO INTERNATIONAL FINANCIAL REPORTING STANDARDS (IFRS)
") INTERIM FINANCIAL REPORT FOR THE PERIOD ENDED 30 September 2018 (based on the Article 5 of L.3556/2007) ACCORDING TO INTERNATIONAL FINANCIAL REPORTING STANDARDS (IFRS) CONTENTS INTERIM FINANCIAL STATEMENTS...
INTERIM FINANCIAL REPORT FOR THE PERIOD ENDED 30 September 2018 (based on the Article 5 of L.3556/2007) ACCORDING TO INTERNATIONAL FINANCIAL REPORTING STANDARDS (IFRS) CONTENTS INTERIM FINANCIAL STATEMENTS...
Consolidated financial statements. December 31, 2017
 Consolidated financial statements December 31, 2017 Table of contents 1.Consolidated statement of income... 2 Other comprehensive income... 3 2. Consolidated statement of cash flows... 4 3. Consolidated
PAO TMK Unaudited Interim Condensed Consolidated Financial Statements Three-month period ended March 31, 2018
 Unaudited Interim Condensed Consolidated Financial Statements Unaudited Interim Condensed Consolidated Financial Statements Contents Report on Review of Interim Financial Information...3 Unaudited Interim
ACCORDING TO INTERNATIONAL FINANCIAL REPORTING STANDARDS (IFRS)
") INTERIM FINANCIAL REPORT FOR THE PERIOD ENDED 31 March 2018 (based on the Article 5 of L.3556/2007) ACCORDING TO INTERNATIONAL FINANCIAL REPORTING STANDARDS (IFRS) CONTENTS INTERIM FINANCIAL STATEMENTS...
INTERIM FINANCIAL REPORT FOR THE PERIOD ENDED 31 March 2018 (based on the Article 5 of L.3556/2007) ACCORDING TO INTERNATIONAL FINANCIAL REPORTING STANDARDS (IFRS) CONTENTS INTERIM FINANCIAL STATEMENTS...
CONSOLIDATED INCOME STATEMENT (in thousands of Euro)
") CONSOLIDATED INCOME STATEMENT (in thousands of Euro) Note Amount % Amount % Sales revenues 23 1,574,091 100.0 1,499,050 100.0 Variable cost of sales 24 1,120,218 71.2 1,079,129 72.0 CONTRIBUTION MARGIN
CONSOLIDATED INCOME STATEMENT (in thousands of Euro) Note Amount % Amount % Sales revenues 23 1,574,091 100.0 1,499,050 100.0 Variable cost of sales 24 1,120,218 71.2 1,079,129 72.0 CONTRIBUTION MARGIN
Quarterly report containing interim financial statements of the Capital Group for Q3 of the financial year of
 Quarterly report containing interim financial statements of the Capital Group for Q3 of the financial year of 2013-2014 covering the period from 01-01-2014 to 31-03-2014 Publication date: 15 May 2014 TABLE
Consolidated financial statements
 growth value innovation sustainability 2014 Consolidated financial statements Contents 0.1 Consolidated financial statements 4 Balance sheet 6 Income statement 7 Consolidated statement of comprehensive
ACERINOX, S.A. AND SUBSIDIARIES. 31 December 2015
 ACERINOX, S.A. AND SUBSIDIARIES Annual Accounts of the Consolidated Group 31 December 2015 (Free translation from the original in Spanish. In the event of discrepancy, the Spanishlanguage version prevails.)
Accounting principles and notes
 Accounting principles and notes 25 Accounting principles and notes 1. Group profile Saes Getters S.p.A., the parent company, and its subsidiaries operate both in Italy and abroad in the development, production
2015 CONSOLIDATED FINANCIAL STATEMENTS
 2015 CONSOLIDATED FINANCIAL STATEMENTS S.A. CORPORATE INFORMATION TABLE OF CONTENTS Definitions, abbreviations and key... 3 Corporate Information... 4 Consolidated income statement... 6 Consolidated statement
SENAO NETWORKS, INC. AND SUBSIDIARIES
 SENAO NETWORKS, INC. AND SUBSIDIARIES CONSOLIDATED FINANCIAL STATEMENTS AND REVIEW REPORT OF INDEPENDENT ACCOUNTANTS SEPTEMBER 30, 2015 AND 2014 ------------------------------------------------------------------------------------------------------------------------------------
INTERPOLIMERI S.P.A. Structure and contents of the financial statements
 INTERPOLIMERI S.P.A. Headquarters in Limena (PD), via Guido Negri no. 11 Share capital Euro 10.000.000,00, fully paid Tax code and Padua companies register registration: 01830880280 Administrative Economic
PAO TMK Unaudited Interim Condensed Consolidated Financial Statements Three-month period ended March 31, 2017
 Unaudited Interim Condensed Consolidated Financial Statements Unaudited Interim Condensed Consolidated Financial Statements Contents Report on Review of Interim Financial Information...3 Unaudited Interim
Consolidated financial statements. December 31, 2018
 Consolidated financial statements December 31, 2018 Table of contents 1.Consolidated statement of income... 2 2. Consolidated statement of cash flows... 4 3. Consolidated balance sheet... 5 4. Consolidated
Consolidated. Separate Financial Statements. thereto at 31 December of Astaldi S.p.A Shareholders Call 28. Corporate Bodies 30
 annual report Separate Consolidated Financial annual Statements and report Notes thereto at 31 December 2013 Shareholders Call 28 Corporate Bodies 30 Management Report 32 Statement pursuant to Article
Consolidated financial stetements 2016
 Consolidated financial stetements 2016 Contents 0.1 Consolidated financial statements 4 Consolidated balance sheet 6 Detail of the Balance Sheet highlighting the first-time consolidation effect of 2016
CONSOLIDATED FINANCIAL STATEMENTS
 CONSOLIDATED FINANCIAL STATEMENTS FOR THE YEAR ENDED 31 DECEMBER ENDESA, S.A. AND SUBSIDIARIES CONSOLIDATED STATEMENTS OF FINANCIAL POSITION AT 31 DECEMBER AND 31 DECEMBER ASSETS 31 December 31 December
PAO TMK Consolidated Financial Statements Year ended December 31, 2017
 Consolidated Financial Statements Consolidated Financial Statements Contents Independent auditor s report...3 Consolidated Income Statement...8 Consolidated Statement of Comprehensive Income...9 Consolidated
2006 Financial Statements. Consolidated Financial Statements of the Nestlé Group Annual Report of Nestlé S.A.
 2006 Financial Statements Consolidated Financial Statements of the Nestlé Group Annual Report of Nestlé S.A. Consolidated Financial Statements of the Nestlé Group Principal exchange rates...2 Consolidated
DECLARATION BY RESPONSIBLE PERSONS
 DECLARATION BY RESPONSIBLE PERSONS The undersigned Chairman of the Management Committee and Chief Executive Officer Chris Peeters and Chief Financial Officer Catherine Vandenborre declare that to the best
Financial Report 2017
 Financial Report 017 Table of contents I. Consolidated financial statements a...............................................................................................................................
Performance 81. Group structure 101
 CONTENTS CONSOLIDATED FINANCIAL STATEMENTS Consolidated income statement 74 Consolidated balance sheet 75 Consolidated statement of shareholders equity 76 Consolidated cash flow statement 77 Notes General
Selecta Group B.V. and its subsidiaries, Amsterdam (The Netherlands)
") Selecta Group B.V. and its subsidiaries, Amsterdam (The Netherlands) Consolidated financial statements for the year ended 30 September and report of the independent auditor Table of Contents Consolidated
Selecta Group B.V. and its subsidiaries, Amsterdam (The Netherlands) Consolidated financial statements for the year ended 30 September and report of the independent auditor Table of Contents Consolidated
TECO IMAGE SYSTEMS CO., LTD. AND SUBSIDIARIES CONSOLIDATED FINANCIAL STATEMENTS AND REVIEW REPORT OF INDEPENDENT ACCOUNTANTS JUNE 30, 2016 AND 2015
 TECO IMAGE SYSTEMS CO., LTD. AND SUBSIDIARIES CONSOLIDATED FINANCIAL STATEMENTS AND REVIEW REPORT OF INDEPENDENT ACCOUNTANTS JUNE 30, 2016 AND 2015 -----------------------------------------------------------------------------------------------------------------------------
PAO TMK Consolidated Financial Statements Year ended December 31, 2016
 Consolidated Financial Statements Consolidated Financial Statements Contents Independent auditor s report...3 Consolidated Income Statement...8 Consolidated Statement of Comprehensive Income...9 Consolidated
Financials. Mike Powell Group Chief Financial Officer
 Financials 98 Group income statement 99 Group statement of comprehensive income 99 Group statement of changes in equity 100 Group balance sheet 101 Group cash flow statement 102 Notes to the consolidated
CONSOLIDATED FINANCIAL STATEMENTS
 CONSOLIDATED FINANCIAL STATEMENTS FOR THE SIX MONTHS ENDED 30 JUNE 2017 ENDESA, S.A. AND SUBSIDIARIES CONSOLIDATED STATEMENTS OF FINANCIAL POSITION AT 30 JUNE 2017 AND 31 DECEMBER 2016 (*) Unaudited ASSETS
Belimo Annual Report 2016
 Financial Report Consolidated 44 Notes to the Consolidated 48 of BELIMO Holding AG 83 Information for Investors 92 Five-Year Summary 94 43 Consolidated Consolidated Income Statement in CHF 1 000 Note 2016
INTERIM REPORT FOR THE THREE MONTHS ENDED 31 MARCH 2018
 INTERIM REPORT FOR THE THREE MONTHS ENDED 31 MARCH 2018 Registered office in Via della Valle dei Fontanili 29/37 00168 Rome, Italy Share capital: 1,084,200.00 fully paid-in Rome Companies Register, Tax
IFRS-compliant accounting principles
 IFRS-compliant accounting principles Since 1 January 2005, Uponor Corporation has prepared its consolidated financial statements in compliance with the following accounting principles: Main functions Uponor
Annual Report 2015 dis
 dis Annual Report Index Business review of the full year 2015 3 Report of the Board of Directors 8 p. 2/93 Business Review of the Full Year 2015 Highlights Turnover increased 1% year on year. Turnover
2005 Financial Statements. Consolidated Financial Statements of the Nestlé Group Annual Report of Nestlé S.A.
 2005 Financial Statements Consolidated Financial Statements of the Nestlé Group Annual Report of Nestlé S.A. Consolidated Financial Statements of the Nestlé Group 3 Consolidated income statement for the
Apolus Holding AB is owned by Apolus Holdco S.a.r.l., Luxemburg (B ) and the principal owner is Triton Fund II LP (reg.nr LP701), Jersey.
 and the principal owner is Triton Fund II LP (reg.nr LP701), Jersey.") The Board of Directors Apolus Holding AB Org nr 556714-1725 hereby submits the Annual accounts and consolidated accounts for the financial year 1 January - 31 December 2011 Administration report 3 (33)
The Board of Directors Apolus Holding AB Org nr 556714-1725 hereby submits the Annual accounts and consolidated accounts for the financial year 1 January - 31 December 2011 Administration report 3 (33)
QUARTERLY- REPORT FEBRUARY OCTOBER
 QUARTERLY- REPORT FEBRUARY OCTOBER 2018 CONTENT 2 THE FIRST NINE MONTHS AT A GLANCE 3 INTERIM GROUP MANAGEMENT REPORT 3 Business and economic environment 6 Risks and opportunities 6 Forecast 7 INTERIM
CONSOLIDATED INCOME STATEMENT (in thousands of Euro)
") CONSOLIDATED INCOME STATEMENT (in thousands of Euro) Note 2011 2010 Amount % Amount % Sales revenues 23 1,158,385 100.0 924,713 100.0 Variable cost of sales 24 805,898 69.6 622,963 67.4 CONTRIBUTION MARGIN
CONSOLIDATED INCOME STATEMENT (in thousands of Euro) Note 2011 2010 Amount % Amount % Sales revenues 23 1,158,385 100.0 924,713 100.0 Variable cost of sales 24 805,898 69.6 622,963 67.4 CONTRIBUTION MARGIN
Balsan / Carpet tiles
 Balsan / Carpet tiles Financial report I. Definitions 47 II. Financial statements 48 III. Notes to the consolidated financial statements for the year ended 30 November 2005 54 IV. Statutory auditor s report
CONSOLIDATED INTERIM FINANCIAL INFORMATION FOR THE SIX MONTHS ENDED JUNE 30, 2017
 GVS SPA GROUP CONSOLIDATED INTERIM FINANCIAL INFORMATION FOR THE SIX MONTHS ENDED JUNE 30, 2017 (un-audited) GVS SpA Headquarter in Via Roma, 50-40069 Zola Predosa (Bologna) - Italy Share capital Euro
PRESS RELEASE. The Board of Directors approves the Consolidated Interim Financial Report for the first half of 2016.
 PRESS RELEASE B&C Speakers S.p.A. The Board of Directors approves the Consolidated Interim Financial Report for the first half of 2016. Consolidated revenues of Euro 18.67 million (+0.9% compared with
Interim Financial Report as at 30 June 2018
 Interim Financial Report as at 30 June 2018 Interim Report as at 30 June 2018 TRANSLATION FROM THE ORIGINAL ITALIAN TEXT INDEX PREFACE... 4 INTERIM MANAGEMENT REPORT AS AT 30 JUNE 2018... 5 CHANGES TO
RIBER S.A. GROUP. 31 rue Casimir Perier BEZONS, FRANCE R.C.S. Pontoise
 RIBER S.A. GROUP 31 rue Casimir Perier 95 873 BEZONS, FRANCE R.C.S. Pontoise 343 006 151 CONSOLIDATED FINANCIAL STATEMENTS AT DECEMBER 31, 2007 Page 2 of 24 CONTENTS Pages CONSOLIDATED BALANCE SHEET 3-4
ICAP plc Annual Report 2016 FINANCIAL STATEMENTS. Strategic report. Page number
 FINANCIAL STATEMENTS ICAP plc Annual Report 77 Strategic report Page number Consolidated income statement 78 Consolidated statement of comprehensive income 80 Consolidated and Company balance sheet 81
GEFRAN GROUP INTERIM REPORT AS AT 30 SEPTEMBER 2013
 1 GEFRAN GROUP INTERIM REPORT AS AT 30 SEPTEMBER 2013 2 Gefran Group Interim Report as at 30 September 2013 3 Contents GEFRAN GROUP INTERIM REPORT AS AT 30 SEPTEMBER 2013 1. GEFRAN GROUP S CORPORATE BOARDS...
2007 Financial Statements. Consolidated Financial Statements of the Nestlé Group Financial Statements of Nestlé S.A.
 2007 Financial Statements Consolidated Financial Statements of the Nestlé Group Financial Statements of Nestlé S.A. Consolidated Financial Statements of the Nestlé Group Principal exchange rates...2 Consolidated
ING GROUP. Condensed consolidated interim financial information for the period ended 30 September 2014
 ING GROUP Condensed consolidated interim financial information for the period ended Contents Condensed consolidated interim accounts Condensed consolidated balance sheet 3 Condensed consolidated profit
O Key Group S.A. Condensed Consolidated Interim Financial Statements for the six months ended 30 June 2014
 Condensed Consolidated Interim Financial Statements for the six months ended 30 June 2014 Contents Condensed Consolidated Interim Statement of Financial Position 3 Condensed Consolidated Interim Statement
Interim Financial Report as at 30 September 2018
 Interim Financial Report as at 30 September 2018 Interim Report as at 30 September 2018 TRANSLATION FROM THE ORIGINAL ITALIAN TEXT INDEX PREFACE... 4 INTERIM MANAGEMENT REPORT AS AT 30 SEPTEMBER 2018...
ATTACHMENTS TO THE PRESS RELEASE
 ATTACHMENTS TO THE PRESS RELEASE ALTERNATIVE PERFORMANCE MEASURES... 2 TIM GROUP - SEPARATE CONSOLIDATED INCOME STATEMENTS... 4 TIM GROUP - CONSOLIDATED STATEMENTS OF COMPREHENSIVE INCOME... 5 TIM GROUP
Annual Report Financial Statements Corporate Governance. Schindler
 Annual Report 2004 Financial Statements Corporate Governance Schindler Contents 4 6 7 8 9 10 49 Financial Statements Consolidated balance sheet Consolidated profit and loss statement Conclusion of the
GEFRAN GROUP INTERIM FINANCIAL STATEMENTS AT 31 MARCH 2018
 1 GEFRAN GROUP INTERIM FINANCIAL STATEMENTS AT 31 MARCH 2018 2 3 SUMMARY 1. CORPORATE BODIES... 5 2. ALTERNATIVE PERFORMANCE INDICATORS... 6 3. STRUCTURE OF THE GEFRAN GROUP... 7 4. KEY CONSOLIDATED INCOME
9. Share-Based Payments Jointly Controlled Entities Other Operating Income Other Operating Expense 130
 92 Financial Report Detailed contents: Consolidated financial statements Consolidated Income Statement for the year ended 31 December Consolidated Statement of Comprehensive Income for the year ended 31
Consolidated financial statements 2017
 2017 CONSOLIDATED FINANCIAL STATEMENTS Consolidated financial statements 2017 CONTENT 04 2017 Key figures 08 Consolidated balance sheet 10 Consolidated income statement 11 Consolidated comprehensive income
YIOULA GLASSWORKS S.A. AND SUBSIDIARIES NOTES TO THE CONSOLIDATED FINANCIAL STATEMENTS JUNE 30, 2011
 1. CORPORATE INFORMATION: Yioula Glassworks S.A., a corporation formed under the laws of the Hellenic Republic (also known as Greece), οn August 5, 1959, by Messrs Kyriacos and Ioannis Voulgarakis is the
Financial section. rec tic el // a n n u a l r e po rt
 04 // Financial section 79 04 rec tic el // a n n u a l r e po rt 2 0 0 8 // Table of contents I. // DEFINITIons 81 II. // FINANCIAL STATEMENTS 82 II.1. Consolidated income statement 82 II.2. Consolidated
Acerinox, S.A. and Subsidiaries
 Acerinox, S.A. and Subsidiaries Consolidated Annual Accounts 31 December 2016 Consolidated Directors' Report 2016 (With Auditors Report Thereon) (Free translation from the original in Spanish. In the event
Notes to the consolidated financial statements A. General basis of presentation
 86 Notes to the consolidated financial statements A. General basis of presentation Accounting principles The consolidated financial statements of Franz Haniel & Cie. GmbH, Duisburg, for the year ended
YIOULA GLASSWORKS S.A. AND SUBSIDIARIES NOTES TO THE CONSOLIDATED FINANCIAL STATEMENTS SEPTEMBER 30, 2012
 1. CORPORATE INFORMATION: Yioula Glassworks S.A., a corporation formed under the laws of the Hellenic Republic (also known as Greece), οn August 5, 1959, by Messrs Kyriacos and Ioannis Voulgarakis is the
Creating end-to-end solutions FINANCIAL REPORT 2017
 Creating end-to-end solutions FINANCIAL REPORT 2017 Financial Report 2017 Consolidated Financial Statement panalpina.com 2 Consolidated financial statements CONTENTS Consolidated income statement 3 Consolidated
GRUPA LOTOS S.A. FINANCIAL HIGHLIGHTS
 FINANCIAL HIGHLIGHTS PLN 000 EUR 000 Dec 31 2015 Dec 31 2014 Dec 31 2015 Dec 31 2014 Revenue 20,482,298 26,243,106 4,894,451 6,264,318 Operating profit/(loss) 183,757 (1,294,183) 43,911 (308,926) Pre-tax
CONSOLIDATED FINANCIAL STATEMENTS. (Unaudited figures)
") 06.30.2014 CONSOLIDATED FINANCIAL STATEMENTS (Unaudited figures) CONTENTS Consolidated financial statements Consolidated balance sheet 1 Consolidated income statement 3 Statement of net income and unrealised
06.30.2014 CONSOLIDATED FINANCIAL STATEMENTS (Unaudited figures) CONTENTS Consolidated financial statements Consolidated balance sheet 1 Consolidated income statement 3 Statement of net income and unrealised
TRANSITION TO INTERNATIONAL ACCOUNTING STANDARDS STATUTORY FINANCIAL STATEMENTS. ENGINEERING INGEGNERIA INFORMATICA SpA
 TRANSITION TO INTERNATIONAL ACCOUNTING STANDARDS STATUTORY FINANCIAL STATEMENTS ENGINEERING INGEGNERIA INFORMATICA SpA Index Introduction... 2 Changes in accounting policies, errors, and changes in estimates...
BORSA ITALIANA - STAR segment PRESS RELEASE
 BORSA ITALIANA - STAR segment PRESS RELEASE INTERIM REPORT AS AT MARCH 31 st 2018 (in brackets results as at 31/03/2017) GROWTH OF REVENUES AND ORDER ACQUISITION PROFITABILITY IMPROVEMENT CONTINUES Consolidated
Cosmo Pharmaceuticals S.A. Statutory Financial Statements
 Cosmo Pharmaceuticals S.A. Statutory Financial Statements Cosmo Pharmaceuticals S.A. 19, Rue de Bitbourg L-1273 Luxembourg Share capital EUR 3,748,935.58 Registre de Commerce et des Sociétés Luxembourg
CONSOLIDATED FINANCIAL STATEMENTS. Year ended 31 December 2018
 CONSOLIDATED FINANCIAL STATEMENTS Year ended 31 December 2018 CONTENTS CONSOLIDATED FINANCIAL STATEMENTS 4 PROFIT AND LOSS ACCOUNT FOR THE YEAR ENDED 31 DECEMBER 2018 4 STATEMENT OF NET INCOME AND CHANGES
Cembre SpA. Report on the Quarter ended December 31, Consolidated Income Statement
 Cembre SpA Registered Office: Via Serenissima 9, Brescia, Italy Share Capital: Euro 8.840.000 (fully paid-up) Registration no: FC 00541390175 (Commercial Register of Brescia) Report on the Quarter ended
C o s t r u z i o n i E l e t t r o m e c c a n i c h e B r e s c i a n e INTERIM 2017 THIRD QUARTER
 C o s t r u z i o n i E l e t t r o m e c c a n i c h e B r e s c i a n e INTERIM R E P O R T THIRD QUARTER Cembre S.p.A. Head Office: Via Serenissima 9, Brescia, Italy Share Capital: EUR 8,840,000 (fully
ATTACHMENTS TO THE PRESS RELEASE
 ATTACHMENTS TO THE PRESS RELEASE ALTERNATIVE PERFORMANCE MEASURES In this press release in addition to the conventional financial performance measures established by IFRS, certain alternative performance
Annual Report at December 31, Financial Statements
 Annual Report at December 31, 2017 Financial Statements 1 CONTENTS Accounting prospects Balance Sheet Assets 3 Balance Sheet Liabilities 4 Income Statement 5 Statement of Changes in Equity 6 Cash Flow
Annual Report at December 31, Financial Statements
 Annual Report at December 31, 2016 Financial Statements 1 CONTENTS Accounting prospects Balance Sheet Assets 3 Balance Sheet Liabilities 4 Income Statement 5 Statement of Changes in Equity 6 Cash Flow
Lenta Limited and subsidiaries. Unaudited interim condensed consolidated financial statements. For the six months ended 30 June 2018
 Unaudited interim condensed consolidated financial statements For the six months ended 30 June Contents Statement of management s responsibilities for the preparation and approval of the interim condensed
SPIE Group Consolidated financial statements as at December 31, 2015
 SPIE Group Consolidated financial statements as at December 31, 2015 CONTENTS 1. CONSOLIDATED INCOME STATEMENT... 5 2. CONSOLIDATED STATEMENT OF COMPREHENSIVE INCOME... 5 3. CONSOLIDATED STATEMENT OF FINANCIAL
GEFRAN GROUP HALF YEARLY REPORT AT 30 JUNE 2014
 1 GEFRAN GROUP HALF YEARLY REPORT AT 30 JUNE 2014 2 GEFRAN GROUP HALF YEARLY REPORT AT 30 JUNE 2014 3 CONTENTS 1. CORPORATE BODIES... 7 2. STRUCTURE OF THE GEFRAN GROUP... 8 3. ALTERNATIVE PERFORMANCE
TECO IMAGE SYSTEMS CO., LTD. AND SUBSIDIARIES CONSOLIDATED FINANCIAL STATEMENTS AND REVIEW REPORT OF INDEPENDENT ACCOUNTANTS JUNE 30, 2017 AND 2016
 TECO IMAGE SYSTEMS CO., LTD. AND SUBSIDIARIES CONSOLIDATED FINANCIAL STATEMENTS AND REVIEW REPORT OF INDEPENDENT ACCOUNTANTS JUNE 30, 2017 AND 2016 -----------------------------------------------------------------------------------------------------------------------------
Contents. 3 Consolidated Financial Statements 70 Financial Statements of Schindler Holding Ltd. 84 Compensation Report 104 Corporate Governance
 Shaping cities Financial Statements 2018 Contents 3 Consolidated Financial Statements 70 Financial Statements of Schindler Holding Ltd. 84 Compensation Report 104 Corporate Governance The Group Review
FINANCIAL STATEMENTS 31 DECEMBER 2017
 CARRARO S.p.A. Registered office in Campodarsego, Padua (Italy) Via Olmo 37 Share Capital 41,452,543.60 Euros, fully paid-up Tax Code/VAT Registration Number and In the Padua Companies Register 00202040283
86 MARKS AND SPENCER GROUP PLC FINANCIAL STATEMENTS CONSOLIDATED INCOME STATEMENT
 86 CONSOLIDATED INCOME STATEMENT Notes Underlying 53 weeks ended 2 April 52 weeks ended 28 March Non-underlying Underlying Non-underlying Revenue 2, 3 10,555.4 10,555.4 10,311.4 10,311.4 Operating profit
FINAL RESULTS ANNOUNCEMENT FOR THE YEAR ENDED 31 MARCH 2010 FINANCIAL HIGHLIGHTS. Own stores number reached 764, increased by 11.
 Hong Kong Exchanges and Clearing Limited and The Stock Exchange of Hong Kong Limited take no responsibility for the contents of this announcement, make no representation as to its accuracy or completeness
For personal use only
 PRELIMINARY FINAL REPORT RULE 4.3A APPENDIX 4E APN News & Media Limited ABN 95 008 637 643 Preliminary final report Full year ended 31 December Results for Announcement to the Market As reported Revenue
5N PLUS INC. Condensed Interim Consolidated Financial Statements (Unaudited) For the three month periods ended March 31, 2018 and 2017 (in thousands
 For the three month periods ended March 31, 2018 and 2017 (in thousands") Condensed Interim Consolidated Financial Statements (Unaudited), 2018 and 2017 (in thousands of United States dollars) CONDENSED INTERIM CONSOLIDATED STATEMENTS OF FINANCIAL POSITION (in thousands of
Condensed Interim Consolidated Financial Statements (Unaudited), 2018 and 2017 (in thousands of United States dollars) CONDENSED INTERIM CONSOLIDATED STATEMENTS OF FINANCIAL POSITION (in thousands of
(Continued) ~3~ March 31, 2017 December 31, 2016 March 31, 2016 Assets Notes AMOUNT % AMOUNT % AMOUNT % Current assets
 ~3~ March 31, 2017 December 31, 2016 March 31, 2016 Assets Notes AMOUNT % AMOUNT % AMOUNT % Current assets") Current assets DAVICOM SEMICONDUCTOR, INC. AND SUBSIDIARIES CONSOLIDATED BALANCE SHEETS (Expressed in thousands of New Taiwan dollars) (The consolidated balance sheets as of March 31,2017 and 2016 are
Current assets DAVICOM SEMICONDUCTOR, INC. AND SUBSIDIARIES CONSOLIDATED BALANCE SHEETS (Expressed in thousands of New Taiwan dollars) (The consolidated balance sheets as of March 31,2017 and 2016 are
Consolidated financial statements 2016
 CONSOLIDATED FINANCIAL STATEMENTS 2016 Consolidated financial statements 2016 CONTENT 04 2016 Key figures 08 Consolidated balance sheet 10 Consolidated income statement 11 Consolidated comprehensive income
Consolidated Accounts of the Nestlé Group. 138th Annual Report of Nestlé S.A.
 Consolidated Accounts of the Nestlé Group 3 Consolidated income statement for the year ended 31 December 2004 4 Consolidated balance sheet as at 31 December 2004 6 Consolidated cash flow statement for
INTERIM FINANCIAL REPORT AS AT MARCH 31, 2018
 INTERIM FINANCIAL REPORT AS AT MARCH 31, 2018 (Translation into English of the original Italian version) JOINT-STOCK COMPANY - SHARE CAPITAL EURO 62,461,355.84 MANTOVA COMPANY REGISTER AND TAX CODE 00607460201
RECTICEL CONDENSED FINANCIAL STATEMENTS PER 30 JUNE 2018
 RECTICEL CONDENSED FINANCIAL STATEMENTS PER 30 JUNE 2018 TABLE OF CONTENTS I. INTERIM CONDENSED CONSOLIDATED FINANCIAL STATEMENTS I.1. CONSOLIDATED INCOME STATEMENT I.2. EARNINGS PER SHARE I.3. CONSOLIDATED
Albéa Beauty Holdings S.A.
 Condensed unaudited interim consolidated financial statements for the periods ended September 30, 2015 and September 30, 2014 CONSOLIDATED INCOME STATEMENTS Third quarter Nine Month Period Continuing operations:
Interim Report January-June 2018
 Interim Report January-June The second quarter of the year had a strong sales development and Bong has continued to move its position forward on the European envelope market. The sales of light packaging
Bolzoni SpA Financial Statements for year ended 31 December 2013
 BALANCE SHEET as at 31 December 2013 BALANCE SHEET Notes 31/12/2013 31/12/2012 (euros) *restated ASSETS Non-current assets Property, plant and equipment 3 11,110,420 12,151,263 Intangible fixed assets
Financial review Refresco Financial review 2017
 Financial review 2017 Financial review 2017 Financial review 2017 1 69 Consolidated income statement For the year ended December 31, 2017 (x 1 million euro) Note December 31, 2017 December 31, 2016 Revenue
ANNEX I GENERAL HALF-YEARLY INTERIM FINANCIAL REPORT FOR /06/2013 I. IDENTIFICATION DETAILS JOSE ORTEGA Y GASSET, 29 A
 ANNEX I GENERAL 1H HALF-YEARLY INTERIM FINANCIAL REPORT FOR 2013 CLOSE DATE I. IDENTIFICATION DETAILS Company name: Registered offices: Company Tax Code JOSE ORTEGA Y GASSET, 29 A-83941237 II. ADDITIONAL
Regulated information
 Regulated information JENSEN-GROUP Half-Year Results 2015 1 Consolidated, non-audited key figures Income Statement 30/06/2015-30/06/2014 Non-audited, consolidated key figures June 30, 2015 June 30, 2014
* * * * * FINANCIAL STATEMENTS FOR THE YEAR ENDED 31 DECEMBER 2017 GENERAL MEETING OF 18 APRIL 2018
 NPL SECURITISATION EUROPE SPV S.r.l. single-member limited liability company Registered Office: Milan, Via A. Pestalozza, no. 12/14 Capital: Euro 10,000 fully paid up Milan Company Register Number 09686010969
Rhodia. Consolidated financial statements. Year ended December 31, 2009
 Rhodia Consolidated financial statements Year ended December 31, 2009 Rhodia Notes to the Consolidated Financial Statements for the Year ended December 31, 2009 1 / 82 CONTENTS A. CONSOLIDATED INCOME STATEMENTS...
Notes to the consolidated financial statements
 Notes to the consolidated financial statements Basic information on the company Elisa Corporation ( Elisa or the Group ) engages in telecommunications activities, providing data communications services
Jacob Holm & Sons AG Annual Report for 2015
 Jacob Holm & Sons AG Annual Report for 2015 Contents Page Auditor s Report Independent Auditor s Report on Consolidated Financial Statements 2 Consolidated Financial Statements Consolidated Income Statement
ANNUAL FINANCIAL REPORT AS OF 31 MARCH 2012
 ANNUAL FINANCIAL REPORT AS OF 31 MARCH 2012 T A B L E O F C O N T E N T S Page Consolidated Financial Statements as of 31 March 2012 1 Group Management Report 2011/12 62 Auditor s Report on the Consolidated
Interim Financial Report as at 31 March 2018
 Interim Financial Report as at 31 March 2018 Interim Report as at 31 March 2018 TRANSLATION FROM THE ORIGINAL ITALIAN TEXT INDEX PREFACE... 4 INTERIM MANAGEMENT REPORT AS AT 31 MARCH 2018... 5 CHANGES