KONE Result presentation 2017 JANUARY 25, 2018 HENRIK EHRNROOTH, PRESIDENT & CEO ILKKA HARA, CFO
|
|
|
- Charity Brown
- 6 years ago
- Views:
Transcription

1 KONE Result presentation 2017 JANUARY 25, 2018 HENRIK EHRNROOTH, PRESIDENT & CEO ILKKA HARA, CFO


2 Q Highlights Orders received grew in all regions and their margin stabilized in the fourth quarter Profitability burdened by several headwinds. Actions to counter the headwinds starting to show results Roll-out of new services gained momentum Dividend proposal EUR 1.65 per class B share
3 Q Key figures ORDERS RECEIVED AND SALES GREW IN ALL REGIONS AND IN ALL BUSINESSES - EBIT MARGIN DECLINED Q4/2017 Q4/2016 Change Comparable change Orders received MEUR 1, , % 5.3% Order book MEUR 8, , % 3.1% Sales MEUR 2, , % 6.8% Operating income (EBIT) MEUR % Operating income margin (EBIT %) % Adjusted EBIT MEUR % Adjusted EBIT margin % Cash flow from operations (before financing items and taxes) MEUR Basic earnings per share EUR
4 1 12/2017 Key figures ORDERS RETURNED TO GROWTH - SEVERAL HEADWINDS IMPACTED THE RESULT 1 12/ /2016 Change Comparable change Orders received MEUR 7, , % 1.7% Order book MEUR 8, , % 3.1% Sales MEUR 8, , % 4.2% Operating income (EBIT) MEUR 1, , % Operating income margin (EBIT %) % Adjusted EBIT MEUR 1, , % Adjusted EBIT margin % Cash flow from operations (before financing items and taxes) MEUR 1, ,509.5 Basic earnings per share EUR
5 1 12/2017 Sales split SHARE OF SERVICES AND THE AMERICAS AND EMEA REGIONS CONTINUED TO GROW BY BUSINESS BY AREA 14% (14%) 20% (19%) 32% (31%) 53% (55%) 39% (41%) 41% (40%) New equipment Maintenance Modernization Asia-Pacific EMEA (Europe, Middle East and Africa) Americas /2016 figures in brackets. Figures in charts are rounded and at historical exchange rates.
6 Business highlights in 2017 Actions to offset the margin headwinds started to show positive results Solid development in the service business with continued strong growth in China We invested more than ever in innovation and new technologies We revolutionized elevator maintenance with the flexible KONE Care and 24/7 Connected services Our Winning with Customers strategy is resonating positively with both employees and customers Accelerate program progressing, the aim is to speed up the execution of the strategy NEW EQUIPMENT Orders received (units): ~158,000 (2016: ~158,000) Units delivered: ~141,000 (2016: ~136,000) MAINTENANCE BASE millions of units >1.1 >6% >
7 Dividend proposal: EUR 1.65 per class B share Split-adjusted dividend per class B share, EUR, Dividend payout in 2017: 87% of earnings per share 0.75 CAGR +19 % Effective dividend yield in 2017: 3.7% * Adjusted for share splits in 2008 (1:2) and 2013 (1:2). *Board s proposal Ordinary dividend Extraordinary dividend 7
8 Market development
9 New equipment market development in Q4 GLOBAL NEW EQUIPMENT MARKET GREW SLIGHTLY IN UNITS ORDERED EMEA market North American market Asia-Pacific market Q4 development (in units) + + Stable Share of global market (in units) ~20% <5% >2/3 Central and North European market stable on a high level Slight growth in South Europe and the Middle East Slight growth in the United States with positive development in both residential and commercial segments Pricing environment continued to be favorable Stable market in China both in units and monetary value. Pricing environment remained tough Indian market started to recover after several reforms Southeast Asian market grew but situation varied from country to country 9
10 Chinese property market Government measures cooling down the housing market Housing inventories Housing sales and prices E&E market Inventories relatively low in higher-tier cities but still somewhat elevated in lowertier cities Government s restrictive measures have cooled down the housing market Property sales still growing at a good rate in lower-tier cities Growth in real estate investment has slowed down slightly Consolidation among property developers continues E&E demand relatively stable in /2017: /2017: Q4 2017: Q Q Q Q Sources: China NBS, E-house, CREIS, KONE estimates Newly built area for sale / monthly sales 3-m MVA Tier-1 Tier-2 sample of lower tier cities Q Tier Q Tier Q Housing prices, change Y-o-Y 2017 Q % 5% 1% sample of lower tier cities Q REI Y-o-Y Q Q Q E&E market Y-o-Y in units 4% Stable
11 Service market development in Q4 GROWTH CONTINUED ACROSS REGIONS Maintenance Q4 development EMEA market North American market Asia-Pacific market Share of global market (in units) <50% <10% ~35% Pricing environment remained tough, especially in South Europe Price competition remained rather intense Continued good growth across the region Modernization Q4 development Share of global market (in monetary value) ~1/3 ~25% ~15% Slight growth across the region Pricing environment favorable Strong market growth 11
12 Q4 and 2017 financials
13 Orders received ORDERS RECEIVED GREW IN ALL REGIONS AT COMPARABLE EXCHANGE RATES IN Q MEUR The margin of orders stabilized in Q ,500 2, % 1, % 2, % 1, % 1, % 87 1,500 1,839 1,846 1,000 + Growth in all regions Q2 Q3 Q4 At historical exchange rates Q Growth at comp. FX FX Q
14 Sales SALES GREW IN ALL BUSINESSES AND IN ALL REGIONS IN Q At comparable exchange rates: +6.8% MEUR 3,000 2,500 2, % 1, % 2, % 2, % 2,657 2, % +5.0% +9.1% 106 2,657 1,500 1, EMEA: +3.6% Americas: +17.1% Asia-Pacific: +5.0% Q2 Q3 Q4 At historical exchange rates Q New equipment Maintenance Modernization FX Q
15 EBIT EBIT MARGIN STILL BURDENED BY SEVERAL HEADWINDS IN Q ADJUSTED EBIT*, MEUR Restructuring costs related to the Accelerate program were EUR 10 million in Q % -1.7% -6.4% % Growth in all businesses + Productivity improvements - Raw materials, margin pressure in China - R&D and IT * Adjusted EBIT was introduced in September Adjusted EBIT excludes restructuring costs related to the Accelerate program. Q2 Q3 Q4 At historical exchange rates Q Growth Profitability FX Q4 2017* 15
16 2017 EBIT bridge SEVERAL FACTORS BURDENED THE PROFITABILITY IN Productivity improvements + Focused pricing actions 1,293 ~40 + Share of Maintenance increasing - Price pressure in China Sales grew in all businesses Biggest impact from EUR strengthening against CNY and USD R&D and IT s share of sales increased by around 40bps >50 - Share of China decreasing 1, EBIT Growth FX Increase in R&D and IT spend Rising raw material prices Other factors impacting EBIT-% 2017 adjusted EBIT 16
17 Cash flow 2017 CASH FLOW WAS SOLID BUT BELOW THE STRONG LEVEL OF RECENT YEARS CASH FLOW FROM OPERATIONS* MEUR -16% 1,600 1,263 1,200 1, Advances received / inventories stable at 145% (2016: 144%) 110 1,263 7 Working capital contributed positively to cash flow in Receivables somewhat higher than in the end of *before financing items and taxes 2017 Cash flow from operations, 2016 Change in EBIT, 2017 Change in working capital, 2017 Working capital s contribution in 2016 Other Cash flow from operations, 2017

18 Market and business outlook for 2018

19 Market outlook for 2018 NEW EQUIPMENT MARKETS Asia-Pacific: The market in China is expected to decline slightly or to be stable in units ordered and competition to remain intense. In the rest of Asia-Pacific, the market is expected to grow. Europe, Middle East and Africa: The market is expected to grow slightly North America: The market is expected to grow slightly MAINTENANCE MARKETS The maintenance market is expected to see the strongest growth rate in Asia-Pacific, and to grow slightly in other regions MODERNIZATION MARKETS The modernization market is expected to grow slightly in the Europe, Middle East and Africa region and in North America and to develop strongly in Asia-Pacific. 19
20 Business outlook for 2018 Sales In 2018, KONE s sales is estimated to grow at around a similar rate as in 2017 at comparable exchange rates. Adjusted EBIT margin The adjusted EBIT margin is expected to continue to decline in 2018 as witnessed in However, the margin pressure is expected to start to ease towards the end of 2018 as a result of pricing and productivity actions that have been taken. Boosting our performance Solid order book Services business growth Continued performance improvements Burdening our result Margin pressure in earlier orders received from intense competition in China and higher raw material prices Foreign exchange rates (approx. MEUR -40) 20
21 21
22 Our strategy is delivering results and we are accelerating the execution of the strategy TO GET FULL BENEFITS WE NEED TO ACCELERATE THE PROGRESS 22


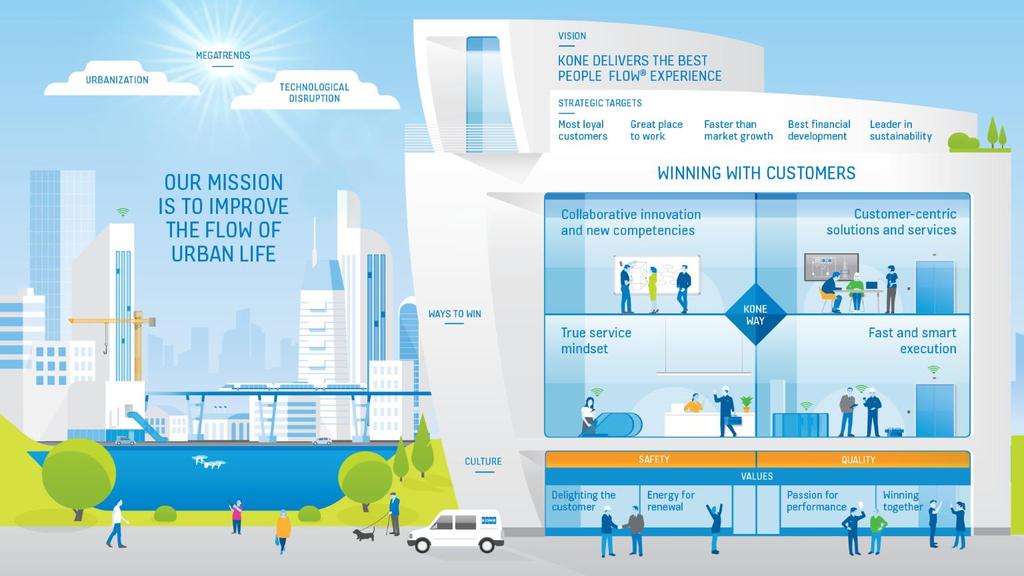
23 Winning with Customers BRINGING OUR NEW STRATEGY ALIVE TOGETHER WITH OUR CUSTOMERS We don t just transport people within buildings we want to give them the best experience We help our customers differentiate and improve their businesses 23

24 Summary Sales growth continues The actions to counter the margin headwinds are already showing positive results Our latest solutions and services resonate well with customers strengthened differentiation
25
26 APPENDIX
27 KONE in China NEW EQUIPMENT MARKET New equipment orders received in units vs. market development CHINA S SHARE OF KONE S ORDERS AND SALES In monetary value >35% KONE Market The China market was stable in units <35% >30% ~30% >25% <20% KONE s orders were stable in units and grew clearly in monetary value <5% stable stable stable stable CAGR ~-5% 2015 ~-5% declined slightly Q2 Q3 Q4 Share of orders received Share of sales 27
28 Currencies SALES BY CURRENCY 1 12/2017 CURRENCY IMPACT MAIN CURRENCIES USD Others (MEUR) Q4/ / average 2016 average Dec 31, 2017 spot Sales EUR / RMB 7,5828 7,3199 7,8534 EBIT EUR / USD 1,1151 1,1021 1,1806 RMB EUR / GBP 0,8719 0,8159 0,8818 Orders received EUR / AUD 1,4592 1,4807 1,5075 EUR 28
29 Q Balance sheet assets employed MEUR Dec 31, 2017 Dec 31, 2016 Assets employed Goodwill 1, ,371.8 Other intangible assets Tangible assets Investments Net working capital ,054.8 Assets employed total 1, ,108.0 Financed by Equity 2, ,795.6 Net debt -1, ,687.6 Equity and net debt total 1, ,
30 Q Net working capital MEUR Dec 31, 2017 Dec 31, 2016 Net working capital Inventories 1, ,373.5 Advance payments received -1, ,976.9 Accounts receivable 1, ,573.7 Other non-interest-bearing assets Other non-interest-bearing liabilities -1, ,692.5 Provisions Accounts payable Net deferred tax assets / liabilities Net working capital total ,
31 Q Consolidated cash flow MEUR 10-12/ / / /2016 Operating income , ,293.3 Change in working capital before financing items and taxes Depreciation and amortization Cash flow from operations before financing items and taxes , ,509.5 Financing items and taxes Cash flow from operating activities ,178.4 Investing activities Purchase of own shares Increase in equity (option rights) Profit distribution Changes in non-controlling interest Free cash flow
KONE Q OCTOBER 26, 2017 HENRIK EHRNROOTH, PRESIDENT & CEO ILKKA HARA, CFO
 KONE Q3 2017 OCTOBER 26, 2017 HENRIK EHRNROOTH, PRESIDENT & CEO ILKKA HARA, CFO Q3 2017 highlights Orders received returned to growth in China with positive contribution from focused pricing actions Roll-out
KONE Q JULY 19, 2017 HENRIK EHRNROOTH, PRESIDENT & CEO ILKKA HARA, CFO
 KONE Q2 2017 JULY 19, 2017 HENRIK EHRNROOTH, PRESIDENT & CEO ILKKA HARA, CFO Q2 2017 highlights Good overall execution Profitability burdened by several headwinds Stabilization in China Good improvement
KONE Result presentation 2018 JANUARY 24, 2019 HENRIK EHRNROOTH, PRESIDENT & CEO ILKKA HARA, CFO
 KONE Result presentation 2018 JANUARY 24, 2019 HENRIK EHRNROOTH, PRESIDENT & CEO ILKKA HARA, CFO Q4 2018 Highlights Orders received and sales grew in all regions and all businesses Adjusted EBIT returned
KONE Q APRIL 25, 2018 HENRIK EHRNROOTH, PRESIDENT & CEO ILKKA HARA, CFO
 KONE 2018 APRIL 25, 2018 HENRIK EHRNROOTH, PRESIDENT & CEO ILKKA HARA, CFO 2018 Highlights Solid growth in orders received with stabilizing margins Profitability continued to be burdened Good progress
KONE s interim report for January June 2016 JULY 19, 2016 HENRIK EHRNROOTH, PRESIDENT & CEO
 KONE s interim report for January June 2016 JULY 19, 2016 HENRIK EHRNROOTH, PRESIDENT & CEO Figures Key figures for for January June 2016 Q2 2016 Key figures STRONG EXECUTION AND PROFITABLE SALES GROWTH
KONE s Interim Report for January September 2014
 KONE s Interim Report for January September 2014 Henrik Ehrnrooth, President & CEO HANNOVER, GERMANY Continuously improving customer experience To ensure excellent service, we gather constant customer
Our path towards the financial targets
 KONE CMD 2018 Our path towards the financial targets ILKKA HARA, CFO SEPTEMBER 25, 2018 FINANCIAL OVERVIEW TOWARDS OUR FINANCIAL TARGETS Financial overview 3 Orders received have returned to growth Growth
Driving shareholder value
 KONE CMD 2017 Driving shareholder value ILKKA HARA, CFO SEPTEMBER 29, 2017 AGENDA FINANCIAL OVERVIEW BUILDING ON THE STRONG BUSINESS MODEL INVESTING FOR THE FUTURE LOOKING AHEAD Financial overview 3 Sales
Going forward in a determined way. March 5, 2012 Matti Alahuhta, President & CEO
 Going forward in a determined way March 5, 2012 Matti Alahuhta, President & CEO Agenda Business development in 2011 Market development in 2011 Highlights of 2011 Market and business outlook 2012 2 KONE
KONE s Interim Report for January June 2013
 New KONE UltraRope technology raises tall buildings to new heights. KONE s Interim Report for January June 2013 The innovative KONE UltraRope will revolutionize the way tall buildings are designed and
KONE Financial Statements 2007 January 25, 2008 President & CEO Matti Alahuhta. KONE Corporation
 KONE Financial Statements 2007 January 25, 2008 President & CEO Matti Alahuhta 1 KONE Corporation Q4 High growth in orders received and operating income continued 10-12/2007 10-12/2006 Historical change
KONE Q Financial Statement Bulletin
 KONE Q4 2017 Financial Statement Bulletin 2 KONE s January December 2017 review: Orders back to growth, EBIT margin declined October December 2017 Orders received grew by 0.4% to EUR 1,846 (10 12/2016:
Eng US. 14 July 2017
 Eng US 14 July 2017 Presentation 2017 Eng US Disclaimer This presentation has been prepared by Duni AB (the Company ) solely for use at this investor presentation and is furnished to you solely for your
Interim Report January March 2018
 Interim Report January March 218 President and CEO Kjell Forsén April 25, 218 Vaisala First quarter 218 highlights Orders received EUR 87.1 (81.5) million, +7% With comparable rates +13% Order book EUR
ASSA ABLOY S INCREASED GROWTH DRIVEN BY GLOBAL TECHNOLOGIES
 17 August 2005 No 10/05 ASSA ABLOY S INCREASED GROWTH DRIVEN BY GLOBAL TECHNOLOGIES Sales for the second quarter of 2005 increased organically by 6% to SEK 6,984 M (6,533) Quarterly operating income is
Q3 Report 2006 Johan Molin President & CEO
 Q3 Report 2006 Johan Molin President & CEO Financial Highlights Q3 Continued high growth pace High stable demand in Europe and North America Fargo developing very well Sales SEK 7 736 M +10% +8% organic,
Stable development for ASSA ABLOY despite weak sales in the first quarter
 23 April 2008 No: 08/08 Stable development for ASSA ABLOY despite weak sales in the first quarter First quarter As expected, the sales trend in Western Europe and North America was weak during the quarter,
KONE H Half-year Financial Report
 KONE H1 2017 Half-year Financial Report 2 H1/2017 KONE s January June 2017 review: Solid execution helped weather the headwinds April June 2017 Orders received declined by 0.6% to EUR 2,056 (4 6/2016:
P R E S S R E L E A S E
 P R E S S R E L E A S E from ASSA ABLOY AB (publ) 27 April 2004 No. 5/04 ASSA ABLOY Q1: ORGANIC GROWTH AND IMPROVED MARGINS IN ALL DIVISIONS Sales in the first quarter increased organically by 3% to SEK
KONE Q Interim Report for January September
 KONE Q3 2017 Interim Report for January September 2 KONE s January September 2017 review: Orders back to growth, profitability continued to be under pressure July September 2017 Orders received declined
ASSA ABLOY OFF TO AN EXCELLENT START
 25 April 2007 25 April 2007 no:08/07 ASSA ABLOY OFF TO AN EXCELLENT START Sales in the first quarter increased by 8% to SEK 8,227 M (7,653), with 8% organic growth, 6% acquired growth and exchange-rate
STRONG FINISH TO 2006 FOR ASSA ABLOY
 14 February 2007 14 February 2007 no:04/07 STRONG FINISH TO 2006 FOR ASSA ABLOY Sales for the fourth quarter increased by 7% to SEK 8,059 M (7,530), with 9% organic growth, 5% acquired growth and -7% exchange-rate
P R E S S R E L E A S E
 P R E S S R E L E A S E from ASSA ABLOY AB (publ) 2 November 2004 No. 12/04 ASSA ABLOY: CONTINUED STRONG ORGANIC GROWTH IN THE THIRD QUARTER Sales in the third quarter increased organically by 6% to SEK
+ 6 % Earnings (EBIT) increase to 297 million
 increase to 297 million") Quarterly statement as at September 30, 2018 Q3 / 2018 Sales revenues up by 5 % to 1,953 million + 6 % Earnings (EBIT) increase to 297 million (including one-off effect) Outlook updated: Sales revenue
Quarterly statement as at September 30, 2018 Q3 / 2018 Sales revenues up by 5 % to 1,953 million + 6 % Earnings (EBIT) increase to 297 million (including one-off effect) Outlook updated: Sales revenue
Q Analyst & Investor Conference Call
 Q2 2012 Analyst & Investor Conference Call Kasper Rorsted, CEO Carsten Knobel, CFO Düsseldorf, Disclaimer This information contains forward-looking statements which are based on current estimates and assumptions
Year End Report 2006 Johan Molin President & CEO
 Year End Report 2006 Johan Molin President & CEO Financial Highlights Q4 Q4 Continued with high growth rates Record profitability in Global Technology and Entrance Systems Continued recovery in Asia Pacific
First-quarter figures: Sartorius Stedim Biotech off to a dynamic start into 2018
 First-quarter figures: Sartorius Stedim Biotech off to a dynamic start into Group revenue up 9.8%; driven by positive development in all regions Exchange rate effects dampen profit growth Guidance for
Strong performance, delivering a record free cash flow Full Year Results 2012
 Strong performance, delivering a record free cash flow Full Year Results 2012 Vernier, 5 th February 2013 Gilles Andrier CEO Full Year Results 2012 Financial Highlights Sales CHF 4.3 billion, up 6.6% in
Full-Year 2016/17 Results Stäfa, May 16, 2017 Lukas Braunschweiler CEO, Hartwig Grevener CFO, Thomas Bernhardsgrütter IR
 Full-Year 2016/17 Results Stäfa, Lukas Braunschweiler CEO, Hartwig Grevener CFO, Thomas Bernhardsgrütter IR Disclaimer This presentation contains forward-looking statements, which offer no guarantee with
Q3 Report 2007 Johan Molin, President & CEO
 Q3 Report 2007 Johan Molin, President & CEO 1 Financial Highlights Q3 Q3 - Solid improvement Good continued growth in all areas Raw material compensated & efficiency gains Earnings improvements in all
ASSA ABLOY REPORTS STRONG SALES
 25 April 2006 25 April 2006 no: 8/06 ASSA ABLOY REPORTS STRONG SALES Sales for the first quarter increased organically by 12% to SEK 7,653 M (6,269). The operating margin (EBIT) for the first quarter amounted
Eng US. 9 February Q4 Presentation 2017
 Eng US 9 February 2018 Q4 Presentation 2017 Eng US Disclaimer This presentation has been prepared by Duni AB (the Company ) solely for use at this investor presentation and is furnished to you solely for
Solid quarter with broad-based progress, strategic focus areas are delivering
 Amer Sports Q3/2018 Solid quarter with broad-based progress, strategic focus areas are delivering October 25, 2018 Heikki Takala, President and CEO Profitable growth continued in Q3 Net sales EUR 757.2
Q in brief. Strong organic sales development. Electromechanical products up 30% Strong EBIT growth of 12%
 Q4 Report 20 Q4 20 in brief Strong organic sales development Very strong growth in Americas and APAC Strong growth in Global Technologies Good growth in EMEA Growth in Entrance Systems Electromechanical
Watts Water Technologies
 Watts Water Technologies Q4 2014 Earnings Conference Call February 18, 2015 Forward-looking Statements Certain statements in this presentation constitute forward-looking statements within the meaning of
OSRAM with a solid start into FY18
 www.osram.com OSRAM with a solid start into FY18 Q1 FY18 Earnings Release (unaudited figures) February 7, 2018 Light is OSRAM Disclaimer This presentation may contain forward-looking statements that are
Conference Call Q Results. Analysts Conference Call 30 April 2015
 Conference Call Q1 2015 Results Analysts Conference Call 30 April 2015 Disclaimer This presentation contains forward-looking statements about Linde AG ( Linde ) and their respective subsidiaries and businesses.
COCHLEAR FINANCIAL RESULTS FOR YEAR ENDED JUNE 2017
 ASX Announcement 17 August 2017 COCHLEAR FINANCIAL RESULTS FOR YEAR ENDED JUNE 2017 Cochlear s market leadership position has strengthened with market growth and market share improvements throughout the
Key figures as of March 31, 2018 April 26, 2018
 Key figures as of March 31, 2018 Highlights Growth on track Growth above market All regions and business lines contributed to growth Strong activity in large projects business Execution of major strategic
Interim Report Q2 FY 18
 Interim Report Q2 FY 18 Quarter 2 / Fiscal Year 2018 Strong revenue growth driven by Signia Nx Sivantos delivered a strong organic growth 1) of 9.8% in Q2 2018 while nominal growth at 3.6% accounted negative
Good business momentum with strongly improved net profit Half year results 2012
 Good business momentum with strongly improved net profit Half year results 2012 Vernier, 3 August 2012 Gilles Andrier CEO Half Year Results 2012 Financial highlights Sales CHF 2.1 billion, up 6.9% in local
TI Fluid Systems plc Results Presentation for TI Fluid Systems plc 20 March 2018
 2017 Results Presentation for 20 March 2018 Disclaimer This presentation contains certain forward-looking statements with respect to the financial condition, results of operations and business of (the
INTERIM PRESENTATION Q October 2018
 INTERIM PRESENTATION 25 October JUAN VARGUES, PRESIDENT & CEO HIGHLIGTHS Organic growth Good organic growth in EMEA Flat organic growth in Americas despite -7% RV OEM APAC down due to softer market in
FUCHS PETROLUB / Q1 2013
 FUCHS PETROLUB / Q1 2013 Conference Call Dr. Alexander Selent, Vice Chairman and CFO Reiner Schmidt, Member of the Group Management Committee Mannheim, 2 May 2013 FUCHS increases EBIT to 73.4 million and
Normal Q2, strategic priorities are delivering, solid view on H2
 Amer Sports Q2/2018 Normal Q2, strategic priorities are delivering, solid view on H2 July 26, 2018 Heikki Takala, President and CEO Normal Q2 Net sales EUR 483.0 million (495.8), +2%* Top line mostly in-season
Amer Sports update. March 24, 2017 Heikki Takala, President & CEO
 Amer Sports update March 24, 2017 Heikki Takala, President & CEO Glidepath set to 2020 Sustainable Growth Model, but need to invest upfront into transformation focus is not on short term wins Our strategic
For personal use only
 ASX / Media release 14 February 2017 COCHLEAR FINANCIAL RESULTS FOR THE SIX MONTHS ENDED DECEMBER 2016 Positive momentum continues across all markets Net profit of $111.4m, up 19% Cochlear implant units
Q Interim Report. October 25, 2018 Panu Routila, President & CEO Teo Ottola, CFO
 Q3 2018 Interim Report October 25, 2018 Panu Routila, President & CEO Teo Ottola, CFO 2 Agenda 1. Group highlights 2. Business Area Service 3. Business Area Industrial Equipment 4. Business Area Port Solutions
Q in brief. Strong organic sales development. Electromechanical products up 25% Strong EBIT development. Strong cash flow
 Q3 Report 20 Q3 20 in brief Strong organic sales development Strong growth in Global Technologies and Americas Good growth in Entrance Systems Stable in EMEA and APAC Electromechanical products up 25%
AMER SPORTS 2013 Continued growth and improving profitability. January 28, 2014, Heikki Takala, President and CEO
 AMER SPORTS 2013 Continued growth and improving profitability January 28, 2014, Heikki Takala, President and CEO Q4: strong double-digit growth, improved profitability Net sales EUR 657.4 million (618.5),
KONE signalization, winner of 2009 Good Design Award. its second century. KONE celebrates its 100th anniversary by serving its customers worldwide.
 KONE signalization, winner of 2009 Good Design Award Taking KONE into its second century. KONE celebrates its 100th anniversary by serving its customers worldwide. KONE Q2 Interim Report for january June
Continuously improving customer experience. HANNOVER, GERMANY
 HANNOVER, GERMANY Continuously improving customer experience. To ensure excellent service, we gather constant customer feedback and carry out end-user research. This insight helps us to continuously improve
Half-year report January 1 June 30, 2017
 Half-year report January 1 June 30, 2017 August 1, 2017 Tapani Kiiski, President and CEO Business environment No changes in general picture uncertain direction of global economy and financing markets continues
Facts and figures. Interim Report as of June 30, 2017
 Facts and figures. Interim Report as of June 30, 2017 2 Key figures as of June 30, 2017 3 Sustained growth and improved results 5 Consolidated interim financial statements 8 Notes to the consolidated interim
Sustainable use of Earth s natural resources. Interim Report Q1 2017
 Sustainable use of Earth s natural resources Interim Report 2017 Safety performance Rate per million hours 14 12 10 8 6 4 2 0 Outotec global safety statistic 12-months running average Lost Time Incident
Operating profit improved in the second quarter. Interim Report January June 2015
 Operating profit improved in the second quarter Q2 2 Operating profit improved in the second quarter Figures in brackets, unless otherwise stated, refer to the same period a year earlier. SECOND QUARTER
Huhtamäki Oyj Interim Report Q January 1 September 30, 2017
 Huhtamäki Oyj Interim Report January 1 September 30, Huhtamäki Oyj s Interim Report January 1 September 30, Continued comparable growth in brief Net sales grew to EUR 732 million (EUR 719 million) EBIT
Conference Call Q Results. 25 April 2018
 Conference Call Results 25 April Disclaimer Forward-looking Statements This discussion may contain forward-looking statements about Linde and its businesses, including statements concerning its strategies,
SENSATA SECOND QUARTER 2017 EARNINGS PRESENTATION JULY 25, 2017
 SENSATA SECOND QUARTER 2017 EARNINGS PRESENTATION JULY 25, 2017 Forward-Looking Statements In addition to historical facts, this earnings presentation, including any documents incorporated by reference
P R E S S R E L E A S E
 P R E S S R E L E A S E from ASSA ABLOY AB (publ) 16 February 2005 No. 3/05 GOOD END TO A STRONG YEAR FOR ASSA ABLOY Sales for the fourth quarter increased organically by 4% to SEK 6,263 M (6,096) after
Profitability continued to improve despite lower sales, 2014 sales guidance somewhat lower, EBIT guidance unchanged
 Profitability continued to improve despite lower sales, 2014 sales guidance somewhat lower, EBIT guidance unchanged Q3 2 Profitability continued to improve despite lower sales, 2014 sales guidance somewhat
2015 Half Year Results Strongly improved free cash flow, on track to achieve 2015 targets. 17 July 2015
 Strongly improved free cash flow, on track to achieve 2015 targets 17 July 2015 Gilles Andrier Chief Executive Officer 2 Financial highlights Sales of CHF 2.2 billion, up 1.3% on a like-for-like* basis
Interim Report Q4 FY 17
 Interim Report Q4 FY 17 Quarter 4 / Fiscal Year 2017 Sustained positive development Sivantos delivered 3.1% organic growth 1) in Q4 FY2017. The moderate growth rate compared to previous quarters was a
HUHTAMÄKI OYJ INTERIM REPORT. January 1 March 31, 2012
 HUHTAMÄKI OYJ INTERIM REPORT January 1 March 31, 2012 Huhtamäki Oyj, Interim Report January 1 March 31, 2012 Good start to the year Net sales growth in all segments Improved profitability Strong performance
P R E S S R E L E A S E
 P R E S S R E L E A S E from ASSA ABLOY AB (publ) 27 April 2005 No. 8/05 STRONG GROWTH IN USA BUT WEAKER IN EUROPE FOR ASSA ABLOY Sales for the first quarter of 2005 increased organically by 2% to SEK
Zumtobel Group AG Q1 2017/ September 2017
 Zumtobel Group AG Q1 2017/18 05 September 2017 Despite stalling growth momentum Group adj. EBIT only slightly below prior year Financials Q1 FY 2017/18 at a glance Group revenues fx-adjusted 0.7% below
Nilfisk Financial Results 2017 Webcast presentation - February 28
 Webcast presentation - February 28 Today s presenters Nilfisk CEO Hans Henrik Lund Nilfisk CFO Karina Deacon Page 2 Agenda 1 2 3 4 5 6 Highlights Business unit update Financials Nilfisk Next Outlook 2018
Continued solid growth in service orders and strong improvement in Group s profitability
 Continued solid growth in service orders and strong improvement in Group s profitability H1 Photo: Meyer Turku 2 Continued solid growth in service orders and strong improvement in Group s profitability
H1/2018 Results u-blox Holding AG
 H1/2018 Results August 24, 2018 Thomas Seiler, CEO Roland Jud, CFO Disclaimer This presentation contains certain forward-looking statements. Such forward-looking statements reflect the current views of
Solid underlying development in the fourth quarter
 Interim Report Q4 2016 Full-year summary 2016 2 February 2017 The global leader in door opening solutions Solid underlying development in the fourth quarter Fourth quarter Sales increased by 6% to SEK
Professional service for true peace of mind. SAKS, SAN FRANCISCO, USA
 SAKS, SAN FRANCISCO, USA Professional service for true peace of mind. Our service professionals receive over 50 hours of technical, safety, customer service, and firstaid training every year to ensure
Q4 & FY 2017 EARNINGS PRESENTATION MARCH 13, 2018
 Q4 & FY 2017 EARNINGS PRESENTATION MARCH 13, 2018 FORWARD-LOOKING STATEMENTS & NON-GAAP FINANCIAL INFORMATION 2 FORWARD-LOOKING STATEMENTS This presentation contains, and management may make on our call
Full-Year 2017/18 Results Stäfa, May 22, 2018 Arnd Kaldowski, CEO Hartwig Grevener, CFO Thomas Bernhardsgrütter, IR
 Full-Year 2017/18 Results Stäfa, Arnd Kaldowski, CEO Hartwig Grevener, CFO Thomas Bernhardsgrütter, IR Disclaimer This presentation contains forward-looking statements, which offer no guarantee with regard
Half-year 2011 Results. July 29, 2011
 Half-year 2011 Results July 29, 2011 Disclaimer All forward-looking statements are Schneider Electric management s present expectations of future events and are subject to a number of factors and uncertainties
Interim Report Q1 FY 18
 Interim Report Q1 FY 18 Quarter 1 / Fiscal Year 2018 Continued positive development extends into the new fiscal year Sivantos delivered 3.5% organic growth 1) in Q1 2018 with negative Fx translation effects
Eng US. Q1 Presentation April, 2015
 Eng US Presentation 2015 24 April, 2015 Eng US Disclaimer This presentation has been prepared by Duni AB (the Company ) solely for use at this investor presentation and is furnished to you solely for your
Financial Information
 Financial Information H1 revenues reached 12.8bn up 9.8%, flat org. in Q2 Adj. EBITA reached 1.6bn, up 6.4%, Adj. EBITA margin flat excl. Invensys in a challenging environment 2015 targets: Around flat
1 st Quarter, 2014 Danfoss delivers strong first quarter
 1 st Quarter, 2014 Danfoss delivers strong first quarter www.danfoss.com www.danfoss.com Danfoss at a glance Danfoss is a world-leading supplier of technologies that meet the growing need for food supply,
Full-year results 2017 Conference. February 15, 2018 Nestlé full-year results 2017
 Full-year results 2017 Conference 1 Disclaimer This presentation contains forward looking statements which reflect Management s current views and estimates. The forward looking statements involve certain
Q4 Report Johan Molin President & CEO
 Q4 Report 2010 Johan Molin President & CEO 1 Financial highlights Q4 2010 Strong ending of the year Strong growth in Global Technologies, APAC and South America Americas in solid growth while EMEA remained
Good growth in order intake and sales, profitability improved and solid cashflow Interim Report Q1-Q3 2018
 Good growth in order intake and sales, profitability improved and solid cashflow Interim Report Q1-Q3 2018 Sustainable use of Earth s natural resources Market development CEO Markku Teräsvasara 2 Min &
April 27, 2011 ABB Q results Joe Hogan, CEO Michel Demaré, CFO. ABB Group April 27, 2011 Chart 1
 April 27, 2011 ABB Q1 2011 results Joe Hogan, CEO Michel Demaré, CFO Q3 2008 investor presentation April 27, 2011 April 27, 2011 Chart 1 Safe-harbor statement This presentation includes forward-looking
MISUMI Group Inc. Table of contents. FY18 1H earnings overview. FY18 1H earnings overview
 Table of contents MISUMI Group Inc. FY1 (ending March 19) First half year () earnings report 1. earnings overview. FY1 full year consolidated earnings forecasts 11 October 3, 1 Representative Director,
Financial results & business update. Quarter and year ended 31 December February 2017
 Financial results & business update Quarter and year ended 31 December 2016 14 February 2017 Disclaimer 3 Any remarks that we may make about future expectations, plans and prospects for the company constitute
KONE Capital Markets Day Business review. Matti Alahuhta President & CEO, KONE Corporation
 KONE Capital Markets Day 2008 Business review Matti Alahuhta President & CEO, KONE Corporation Content KONE 2005 2007 Business environment KONE 2008 Regional view Asia-Pacific South Europe and Middle East
Operating profit improved clearly from last year and amounted to 12.0 MEUR (10.0 MEUR). Operating margin improved to 18.9% (15.8%).
. Operating margin improved to 18.9% (15.8%).") STOCK EXCHANGE RELEASE 1 (11) INTERIM REPORT JANUARY TO MARCH 2007 Improved profitability for the first quarter Despite the weakening of US dollar and slow sales of winter fishing and sports equipment,
STOCK EXCHANGE RELEASE 1 (11) INTERIM REPORT JANUARY TO MARCH 2007 Improved profitability for the first quarter Despite the weakening of US dollar and slow sales of winter fishing and sports equipment,
Welcome to Schindler Selected key figures as of March 31, 2015
 Welcome to Schindler Selected key figures as of March 31, 2015 April 28, 2015 Modernization of Scotia Plaza, Toronto, Canada 10 double deck high-rise elevators 12 double deck mid- and low-rise elevators
HUHTAMÄKI OYJ INTERIM REPORT. January 1 September 30, 2012
 HUHTAMÄKI OYJ INTERIM REPORT January 1 September 30, 2012 Q1- Huhtamäki Oyj, Interim Report January 1 September 30, 2012 Strong earnings growth Profitability improvement continued The North America segment
ABB Q results Joe Hogan, CEO Michel Demaré, CFO
 October 27, 2011 ABB Q3 2011 results Joe Hogan, CEO Michel Demaré, CFO ABB Group Q3 2008 investor presentation October 26, 2011 Chart 1 Safe-harbor statement This presentation includes forward-looking
Q Analyst & Investor Conference Call
 Q1 2012 Analyst & Investor Conference Call Kasper Rorsted, CEO Dr. Lothar Steinebach, CFO London/Düsseldorf, Disclaimer This information contains forward-looking statements which are based on current estimates
Welcome to the Full-Year 2016 Conference. February 16, 2017 Nestlé Full-Year Results 2016
 Welcome to the Full-Year 2016 Conference 1 Disclaimer This presentation contains forward looking statements which reflect Management s current views and estimates. The forward looking statements involve
1Q 2018 Highlights and Operating Results
 1Q 2018 Highlights and Operating Results April 26, 2018 1 Table of Contents Page(s) 4 Announced Agreements to Acquire Australia and New Zealand Security Businesses 5-9 Sales Overview 10-17 Financial Performance
Nine-month figures for 2017: Sartorius continues to grow profitably in a challenging environment
 Nine-month figures for : Sartorius continues to grow profitably in a challenging environment Group revenue up 8.6%; despite unfavorable currency effects, earnings 1 up 7.3% The Lab Products & Services
Zumtobel Group AG H1 2016/ December 2016
 Zumtobel Group AG H1 2016/2017 6 December 2016 Nr. 2 Substantial increase in profitability despite lower revenues Financials H1 FY 2016/17 at a glance Fx-adjusted decline of 1.5% in Group revenues with
Fiscal 2018 Second Quarter
 Fiscal 2018 Second Quarter If you can read this Click on the icon to choose a Results picture or Reset the slide. To Reset: Right click on the slide thumbnail and select reset slide or choose the Reset
Financial results & business update. Quarter and year ended 31 December February 2016
 Financial results & business update Quarter and year ended 31 December 2015 11 February 2016 Disclaimer 3 Any remarks that we may make about future expectations, plans and prospects for the company constitute
TI Fluid Systems plc Half Year Results Presentation for TI Fluid Systems plc. 8 August 2018
 2018 Half Year Results Presentation for 8 August 2018 Disclaimer This presentation contains certain forward-looking statements with respect to the financial condition, results of operations and business
Press Release. Outlook
 Press Release October 26, 2018 Signify reports third quarter sales of EUR 1.6 billion, improvement in operational profitability by 150 bps to 12.0% and free cash flow to EUR 64 million 2018 1 Sales of
Investors presentation. November 2011
 Investors presentation November 2011 Disclaimer All forward-looking statements are Schneider Electric management s present expectations of future events and are subject to a number of factors and uncertainties
FY2018 First Quarter Results
 First Quarter Results Norio Tadakawa May 11, 2018 Corporate Executive Officer, CFO Shiseido Company, Limited In this document, statements other than historical facts are forward-looking statements that