CAGNY. February 19, 2019
|
|
|
- Winifred Webster
- 5 years ago
- Views:
Transcription

1 CAGNY February 19, 2019


2 Welcome Michael Neese, VP Investor Relations 1
3 Forward-Looking Statements This presentation includes, and our response to various questions may include, certain forward looking statements, estimates, and projections with respect to our anticipated future performance, including the statements in the Fiscal 2019 Outlook section of this presentation (collectively, Forward Looking Statements ). Words such as estimates, expects, contemplates, anticipates, projects, plans, intends, believes, forecasts, may, could, should, and variations of such words or similar expressions are intended to identify Forward Looking Statements. Forward Looking Statements reflect various assumptions of the Company s management that may or may not prove to be correct and are not guarantees of the Company s future performance or results. The Company s actual results could differ materially from those anticipated in the Forward Looking Statements. These Forward Looking Statements are subject to various risks and uncertainties, including those described in the Item 1A. Risk Factors section in our Annual Report on Form 10-K for the fiscal year ended June 30, 2018, which was filed with the Securities and Exchange Commission (the SEC ) on August 16, 2018, as such factors may be updated from time to time in the Company s periodic filings with the SEC, which are accessible on the SEC s website at The Company is not required and does not intend to update or alter any Forward Looking Statements in this presentation or any other information that may be furnished to any recipient, whether as a result of new information, future events, or otherwise. 2
4 Performance Food Group George Holm, Chairman, President & CEO 3
5 Delivering Success Our mission: To be a leader in the foodservice distribution industry by delivering world-class innovative products and value-added services that enable our customers success and support enduring supplier relationships 4

6 Delivering Success Our vision: To become a supply-chain services leader by providing customer-centric and innovative foodservice, beverage and snack solutions 5
7 Who We Are Market leader with scale Customer-centric approach Unique Performance Brands private label business Differentiated national candy, snack and beverage distributor Disciplined and proven acquirer with ample opportunities Track record of strong and consistent financial performance 6
8 PFG at a Glance Vistar is one of the leading distributors of candy, snacks, beverages to multiple distribution channels PFG is one of the leading distributors to casual dining restaurant chains PFG is the 3rd largest foodservice distribution company in the US Over 15,000 associates nationwide 75 distribution centers PFG delivers approximately 150,000 national and proprietary-branded food and food-related products PFG delivers to more than 150,000 customer locations Over 156,000,000 miles logged with one of the nation s largest truck fleets


 For reconciliation of")
9 PFG Overview U.S. Market Share EBITDA Profit Margins Sysco 17.2% US Foods 8.6% PFGC 6.5% Others 67.7% Foodservice 2.9% Vistar 4.0% 2018 Adj. EBITDA (1) = $426.7MM 2018 Net Sales = $17.6B EBITDA by Segment 19.0% Vistar 24% Vistar Foodservice 81.0% Foodservice 76% Note: EBITDA percentages presented for segments exclude corporate overhead and other (1) For reconciliation of non-gaap to GAAP measures see the Appendix. 8

10 Core Strategies Grow our independent customer base and brands in Foodservice and expand our channels in Vistar Pursue strategic acquisitions Deliver consistent financial performance through strong operating cash flows

11 Broad Geographic Footprint Headquarters Foodservice 48 Vistar As of Fiscal Q


12 Solid Industry Fundamentals Food Away From Home $ Billions CAGR 6% $816 $ U.S. Foodservice Market Size $ Billions CAGR 4% $289 $ Note: U.S. Department of Commerce for Food Away from Home; Technomic for U.S. Foodservice Market Size; excluding alcohol 11
13 Combined with Market Share Gains Top 3: 29% $ Billions CAGR 4% % Others: 71% % Note: Technomic and company filings for Sysco, PFG, and US Foods. U.S. Sales only, where available; PFG estimates. 12
14 And Unique Barriers to Entry Relationship-driven business Trucks have trailers with multi-temp coolers with large drop sizes Nationally branded, high-quality, specialized foodservice products SKUs are complex and have varying pack sizes Last mile logistics 13
15 Fragmented U.S. Foodservice Marketplace 2017 Market Size = ~ $289 $ Billions Top 3 ~$ Regional Broadliners ~$ ,000+ All Other ~$170 Note: Technomic and company filings for Sysco, PFG, and US Foods. U.S. Sales only, where available; PFG estimates. 14
16 M&A Activity The M&A pipeline is robust; however multiples remain high. Continuing to develop new channels in Vistar and broadline opportunities in Foodservice 15


17 Segment Overview - Foodservice Segment Highlights Channels served: Focus on Independent Operations: Leading distributor in Pizza/Italian Segment Family Dining Bar and Grill Fast Casual Local, Regional and Selected National Chains Independent Healthcare Hospitality Distribution Centers: broadline distribution centers 8 national chain distribution centers Comprehensive and growing portfolio of Performance Brands Footprint Product Mix Independent 44% National / Regional 56% 16
18 Segment Overview - Foodservice Industry Leading Growth Driven By: Customer-centric strategy Laser focus on faster growing independent restaurants Expanding portfolio of strategic Performance Brands Evolving technology to enhance customer experience and salesforce effectiveness Net Sales CAGR 6.0% $13.4 $13.8 $12.8 $11.4 EBITDA $ Billions $ Millions $14.3 $321.8 $279.5 CAGR 11.3% $384.0 $395.1 $411.4 FY14 FY15 FY16 FY17 FY18 FY14 FY15 FY16 FY17 FY18 17
19 We ve Delivered Industry-Leading Independent Case Growth 10.0% 5-year CAGR ~7% 9.0% 8.0% 7.0% 6.0% 5.0% 4.0% 3.0% 2.0% 1.0% 0.0%
20 Improving Mix of Business Drive Profitability Independent Foodservice Mix Performance Brand Mix of Independent 600 bps 680 bps 46.0% 31.6% 25.6% 39.2% FY13 FY18 FY13 FY18 Mix shift of 600 bps in Independent Foodservice mix Performance Brands consistently growing bps faster than independent cases 19


21 Foodservice: National Sales Organization The Foodservice Multi-Level Sales Organization is comprised of highly trained, technically equipped and segment specific sales associates. Breakdown o o o o National Account Nationwide distribution across multiple OPCOs Corporate Account Region Specific distribution across multiple OPCOs Regional Account Region Specific and OPCO managed Independent Account Market/OPCO Specific and Managed Customer Level Support The organization is comprised of approximately 3,000 sales associates focused on every level of the business and customer service. By design, crossover support ensures that all customer needs are exceeded. Specialists, account managers and sales management are all dedicated to customer-centric service and partnerships. Our approach enables customers to concentrate on running their operations to the fullest. 20


22 Performance Brands o Brand Development and What Makes Them Unique o Why Brands? o PerformanceFoodservice.com o Brand Spotlight: Braveheart & Bacio o Delivering Results 21

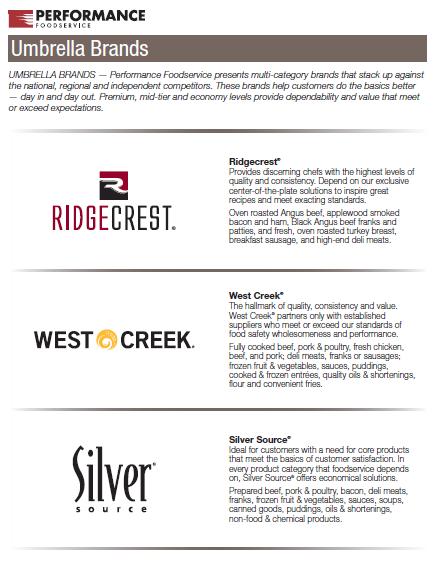

23 Brand Development Umbrella Brands & Strategic Brands 22


24 Exclusive Brand Lineup Strategic Brands BRAVEHEART BLACK ANGUS BEEF Black Angus beef to satisfy operators needs with a serious commitment to quality, food safety (traceability) and state-of-the-art processing via our exclusive PathProven program. Black Cattle raised in the Midwest and fed on local grains for superior flavor and tenderness. ROMA The standard for pizza and Italian restaurant operators. Encompassing Old World excellence, Roma boasts a vast array of consistent, high-quality products that deliver authentic flavor and meet or exceed demanding expectations. BACIO Bacio is a uniquely crafted combination of mozzarella and a signature Kiss of Buffalo Milk for delicious authenticity and unparalleled performance. Bacio cheese is carefully crafted from premium ingredients for delicious taste, exceptional melt and reheat, superb stretch, and guaranteed quality. 23
25 Segment Overview Segment Highlights Leading distributor of candy, snacks, and beverages and other single serve, impulse, immediate consumption items Channels served: Vending Distributors Office Coffee Service Distributors Theaters, Stadium and Arenas Retail Impulse Hospitality College Bookstores/C-Stores Corrections Operating Companies: 27 Core Competencies: National distribution network Unparalleled inventory variety Perishable distribution capability Proven ability to leverage specialized inventory to penetrate new customer channels Flexible distribution capabilities: truckloads to pieces Footprint Product Mix: FY2018 Refrig 4% Frozen 15% Beverage 26% Candy 22% Other 13% Snacks 20% 24
26 Delivering Growth Growth Strategy Utilize strengths to grow both core and emerging channels Improve mix Improve cost structure through utilization of technology Enter new channels and develop new capabilities through acquisitions Net Sales $ Billions $2.4 $2.3 CAGR 9.3% $2.7 $3.0 $3.3 EBITDA $ Millions $86.0 $102.8 CAGR 10.9% $110.1 $117.7 $133.1 FY14 FY15 FY16 FY17 FY18 FY14 FY15 FY16 FY17 FY18 25


27 A History of Evolution The type of products we sell define us: Single Serve Impulse Immediate consumption What began as candy, chips, and soda evolved to protein bars, energy drinks and meal replacement options SKU growth continues to evolve as consumers continue to evolve More Customers Retro and bulk candy Good to Go Better for you products Meal replacement options More Channels More SKUs 26
28 A History of Evolution FY 2002 $1.0B Net Sales FY2008 $1.4B Net Sales FY2018 $3.3B Net Sales 4% 15% 3% 19% 11% 5% 96% 73% 5% 1% 3% 5% 10% 46% Vend/OCS Theater Vend/OCS Theater/Concession Retail Hospitality/Travel Corrections All Other Vend/OCS Theater/Concession Retail Office Supply Hospitality/Travel Value Store Corrections All Other 2% 2% 27

29 Nationwide Coverage Wholesale candy, snack, and beverage specialists Delivering solutions from one box to a truckload 28
30 Evolving Beyond a Distributor Continue to build upon our core competencies in distribution centers and logistics Ongoing evolution and expansion of product offerings in the impulse, single serve, immediate consumption category Invest in the continued growth of automated facilities and IT infrastructure to expand into overnight delivery Target direct-to-consumer and automated e-commerce fulfillment Distributor Fulfillment Direct to consumer 29

31 Automated Technology Vistar Retail Central an automated parcel distribution facility in Southaven, Mississippi Allows for significant enhancement to product availability and outbound order shipping capacity Software and conveyor technology provide significant enhancements to operational processes such as: Carton sizing Temperature protective packaging Vistar has elevated its capability to respond to today s diverse customer base while ensuring we are prepared for future growth by significantly enhancing our ability to satisfy key customer requirements for LTL-Warehouse Pallet Deliveries, E-Commerce, and Pick and Pack Parcel Distribution Order picking, packing, and shipping Driving future productivity and profitability, expanding new growth channels 30
32 Plans for Growth E-Commerce Distributor of Candy & Snacks Production MANUFACTURERS Distribution Centers & Delivery Logistics VISTAR E-Commerce Retailers Other Smaller Distributors Large Retailers Boutique Retailers Brick & Mortar Retailers w/e-comm Presence Direct to E-Comm Consumers (Vistar E-Comm for business, club sports programs, consumers, etc.) 31


33 Performance Food Group Jim Hope, EVP and CFO
34 Strong Sales Growth Net Sales Growth $ Billions + 7.3% CAGR $17.6B $10.1B JUNE FY09 JUNE FY10 JUNE FY11 JUNE FY12 JUNE FY13 JUNE FY14 JUNE FY15 JUNE FY16 JuneJUNE FY17FY18 We have delivered consistent sales growth over a long-term economic cycle 33


35 Solid EBITDA Growth PFG Adjusted EBITDA (1) $ Millions CAGR ~10% $329 $367 $391 $427 $443 $193 $220 $241 $271 $286 FY10 FY11 FY12 FY13 FY14 FY15 FY16 FY17 FY18 TTM (1) For reconciliation of non-gaap to GAAP measures see the Appendix 34
36 Fiscal 2018 Financial Performance FY2018 Growth vs. PY Cases 3.0% Net Sales $17.6B 5.1% Gross Profit $2.3B 7.9% Net Income $198.7MM 106.3% Diluted EPS $ % Adjusted EBITDA 1 $426.7MM 9.2% Adj. EBITDA 1 /Gross Profit 18.6% 20 bps Adjusted Diluted EPS 1 $ % (1) For reconciliation of non-gaap to GAAP measures see the Appendix 35
37 Fiscal 2019 First Six Months Financial Performance FY2019 First Six Months Growth vs. PY Cases 4.6% Net Sales $9.2B 5.5% Gross Profit $1.2B 7.7% Net Income $71.3MM (29.1%) Diluted EPS $0.68 (29.2%) Adjusted EBITDA 1 $212.4MM 8.5% Adj. EBITDA 1 /Gross Profit 17.6% 20 bps Adjusted Diluted EPS 1 $ % (1) For reconciliation of non-gaap to GAAP measures see the Appendix 36
38 Looking Ahead: Our Focus Continued investment in growth Expanding operating margins Disciplined use of capital 37
39 Investment in Growth Foodservice AM Sales Force 1,869 1,400 FY12 FY13 FY14 FY15 FY16 FY17 FY18 FY19 Notes: FY19 as of Q2 FY
40 Expanding Margins Productivity OpEx innovation Pricing tool Brand penetration Leverage Supplier negotiations New supplier billing process Overhead control Mix Mix shift to Independent Specialty growth at higher margin 39
41 Disciplined Use of Capital 1. Investment in the business = facility expansions 149,000 sq. ft. added in FY ,000 sq. ft. added in FY2017 Net Debt and Leverage $ Millions 750,000 sq. ft. added in FY2018 $1,469 $1,454 $1, Strategic M&A Vistar $1, x 5.1x $1,135 $1,289 $1,177 Specialty 5.0x 4.4x Broadline 3.1x 3.3x 2.8x 3. Share Repurchase program $250 million program Opportunistic Offsets share dilution Deleverage Focused working capital management Under 3.0x without acquisitions 40
42 Share Repurchase Program On November 13, 2018, the Board of Directors of the Company authorized a share repurchase program for up to $250 million of the Company s outstanding common stock. During the three months ended December 29, 2018, the Company repurchased 157,900 shares of common stock for a total of $5.2 million or average cost of $32.76 per share. As of December 29, 2018, approximately $244.8 million remained available for additional share repurchases. 41
43 FY 2019 Outlook Case Growth 3% to 5% Adjusted EBITDA Growth 7% to 10% Adjusted EPS Growth 10% to 16% 1 This presentation includes several metrics, including EBITDA, Adjusted EBITDA and Adjusted Diluted Earnings per Share that are not calculated in accordance with Generally Accepted Accounting Principles in the U.S. ( GAAP ). Please see Statement Regarding NonGAAP Financial Measures at the beginning of this presentation for the definitions of such nongaap financial measures and reconciliations of such nongaap financial measures to their respective most comparable financial measures calculated in accordance with GAAP 42
44 Summary Industry-leading growth company Continue to focus and grow independent restaurant cases Profitably grow our market share in a fragmented marketplace Performance Brands private label business is unique with higher margins Differentiated national candy, snack and beverage distributor E-Commerce is a future growth platform M&A pipeline is robust Consistent track record of earnings growth 43
45 Questions 44
46 Appendix 45
47 Non-GAAP Financial Measures This presentation and the accompanying financial statement tables include several financial measures that are not calculated in accordance with GAAP, including EBITDA, Adjusted EBITDA, and Adjusted Diluted Earnings per Share. Such measures are not recognized terms under GAAP, should not be considered in isolation or as a substitute for measures prepared in accordance with GAAP, and are not indicative of net income as determined under GAAP. EBITDA, Adjusted EBITDA, Adjusted Diluted Earnings per Share, and other non-gaap financial measures have limitations that should be considered before using these measures to evaluate the Company s liquidity or financial performance. EBITDA, Adjusted EBITDA, and Adjusted Diluted Earnings per Share, as presented, may not be comparable to similarly titled measures of other companies because of varying methods of calculation. Management measures operating performance based on PFG s EBITDA, defined as net income before interest expense, interest income, income taxes, and depreciation and amortization. PFG believes that the presentation of EBITDA enhances an investor s understanding of PFG s performance. PFG believes this measure is a useful metric to assess PFG s operating performance from period to period by excluding certain items that PFG believes are not representative of PFG s core business. PFG uses this measure to evaluate the performance of its segments and for business planning purposes. In addition, management uses Adjusted EBITDA, defined as net income before interest expense, interest income, income and franchise taxes, and depreciation and amortization, further adjusted to exclude certain items we do not consider part of our core operating results. Such adjustments include certain unusual, non-cash, non-recurring, cost reduction, and other adjustment items permitted in calculating covenant compliance under the company s credit and indenture agreements (other than certain pro forma adjustments permitted under our credit agreement and indenture relating to the Adjusted EBITDA contribution of acquired entities or businesses prior to the acquisition date). Under PFG s credit agreement and indenture, the Company s ability to engage in certain activities such as incurring certain additional indebtedness, making certain investments, and making restricted payments is tied to ratios based on Adjusted EBITDA (as defined in the credit agreement and indenture). Management also uses Adjusted Diluted Earnings per Share, which is calculated by adjusting the most directly comparable GAAP financial measure by excluding the same items excluded in PFG s calculation of Adjusted EBITDA to the extent that each such item was included in the applicable GAAP financial measure. PFG believes that the presentation of Adjusted EBITDA and Adjusted Diluted Earnings per Share is useful to investors because these metrics are frequently used by securities analysts, investors, and other interested parties in their evaluation of the operating performance of companies in PFG s industry. 46
48 EBITDA and Adjusted EBITDA Reconciliation Non-GAAP Financial Measures Refer to Item 7. Management Discussion and Analysis of Financial Condition and Results of Operations included in the annual report on Form 10-K for the fiscal year ended June 30, 2018 for statements regarding our use of non-gaap financial measures and the definitions of such non-gaap financial measures. We believe that the most directly comparable GAAP measure to EBITDA and Adjusted EBITDA is net income. The following table reconciles EBITDA and Adjusted EBITDA to net income for the periods presented: For the fiscal year ended June 30, July 1, July 2, June 27, June 28, June 29, June 30, July 2, July 3, Net income $ $ 96.3 $ 68.3 $ 56.5 $ 15.5 $ 8.4 $ 21.0 $ 13.7 $ 0.9 Interest expense Income tax expense (5.1) Depreciation Amortization of intangible assets EBITDA Non-cash items(i) (2.6) Acquisition, integration and reorganization(ii) Non-recurring items(iii) (1.4) Productivity initiatives(iv) Multiemployer plan withdrawal(v) (0.1) 0.8 Other adjustment items(vi) Adjusted EBITDA $ $ $ $ $ $ $ $ $ (i) Includes adjustments for non-cash charges arising from stock-based compensation, interest rate swap hedge ineffectiveness, and gain/loss on disposal of assets. Stock compensation cost was $21.6 million, $17.3 million, $17.2 million, $1.2 million, $0.7 million, $1.1 million, $1.1 million, $1.1 million and $0.8 million for fiscal 2018, fiscal 2017, fiscal 2016, fiscal 2015, fiscal 2014, fiscal 2013, fiscal 2012, fiscal 2011 and fiscal 2010, respectively. In addition, this includes an increase (decrease) in the LIFO reserve of $0.3 million, $2.6 million, $(1.5) million, $1.7 million, $3.0 million, and $0.8 million for fiscal 2018, fiscal 2017, fiscal 2016, fiscal 2015, fiscal 2014, and fiscal 2013, respectively. There was no LIFO reserve adjustment in fiscal 2012, fiscal 2011 and fiscal (ii) Includes professional fees and other costs related to completed and abandoned acquisitions; in fiscal 2015 these fees are net of a $25.0 million termination fee related to the terminated agreement to acquire 11 US Foods facilities from Sysco and US Foods, costs of integrating certain of our facilities, facility closing costs, advisory fees paid to Blackstone and Wellspring, and offering fees. For fiscal 2013, this also includes $11.2 million for the impact of the initial fair value of inventory that was acquired as part of acquisitions. (iii) Consists primarily of an expense related to our withdrawal from a purchasing cooperative of which we were a member, pre-acquisition worker s compensation claims related to an insurance company that went into liquidation, a legal settlement expense, transition costs related to IT outsourcing, certain severance costs, and the impact of business interruption because of weather related or one-time events. (iv) Consists primarily of professional fees and related expenses associated with productivity initiatives. (v) Includes amounts related to the withdrawal from the Central States Southeast and Southwest Areas Pension Fund. See Note 15 Commitments and Contingencies to the audited consolidated financial statements included in Item 8. Financial Statements and Supplementary Data of the annual report on Form 10-K for the fiscal year ended June 30, (vi) Consists primarily of amounts related to fuel collar derivatives, certain financing transactions, lease amendments, and franchise tax expense and other adjustments permitted by our credit agreements. 47
49 EBITDA, Adjusted EBITDA, and Adjusted Diluted EPS Reconciliation Fiscal year ended June 30, 2018 July 1, 2017 Change % Diluted earnings per share (GAAP) $ 1.90 $ 0.93 $ Impact of non-cash items Impact of acquisition, integration & reorganization charges (0.13) (76.5) Impact of productivity initiatives Impact of other adjustment items (0.02) (33.3) Tax impact of above adjustments (0.14) (0.20) 0.06 (30.0) Tax impact of revaluation of net deferred tax liability (A) (0.37) (0.37) NM Tax impact of other tax law change items (B) (0.11) (0.11) NM Tax impact of stock-based compensation - performance vesting (C) (0.14) (0.14) NM Adjusted Diluted Earnings per Share (Non-GAAP) $ 1.54 $ 1.24 $ A. Represents the per share impact of the $38.5 million net benefit to deferred income tax expense as a result of the Tax Cuts and Jobs Act and the revaluation of the Company s net deferred tax liability. B. Represents the per share impact of the $11.9 million net benefit to income tax expense as a result of the blended statutory rate for fiscal 2018 and the resulting rate differential related to temporary differences. C. Represents the per share impact of the $15.4 million excess tax benefit recognized as a result of the performance metrics being met for certain stock-based compensation awards upon the exit of the Company s private equity shareholders. 48
50 EBITDA, Adjusted EBITDA, and Adjusted Diluted EPS Reconciliation Six Months Ended ($ in millions, except share and per share data) December 29, 2018 December 30, 2017 Change % Net income (GAAP) $ 71.3 $ $ (29.3) (29.1) Interest expense, net Income tax expense (benefit) 20.2 (30.3) 50.5 (166.7) Depreciation Amortization of intangible assets EBITDA (Non-GAAP) Impact of non-cash items (A) (6.5) (40.4) Impact of acquisition, integration & reorganization charges (B) (0.1) (2.4) Impact of productivity initiatives (C) 9.8 (9.8) (100.0) Impact of other adjustment items (D) Adjusted EBITDA (Non-GAAP) $ $ $ Diluted earnings per share (GAAP) $ 0.68 $ 0.96 $ (0.28) (29.2) Impact of non-cash items (0.06) (40.0) Impact of acquisition, integration & reorganization charges Impact of productivity initiatives 0.10 (0.10) (100.0) Impact of other adjustment items Tax impact of above adjustments (0.04) (0.10) 0.06 (60.0) Tax impact of revaluation of net deferred tax liability (E) (0.36) 0.36 (100.0) Tax impact of stock-based compensation - performance vesting (F) (0.14) 0.14 (100.0) Adjusted Diluted Earnings per Share (Non-GAAP) $ 0.80 $ 0.67 $ A. Includes adjustments for non-cash charges arising from stock-based compensation and gain/loss on disposal of assets. Stock-based compensation cost was $8.0 million and $14.5 million for the first six months of fiscal 2019 and fiscal 2018, respectively. In addition, this includes an increase in the LIFO reserve of $1.6 million and $1.2 million for the six months of fiscal 2019 and fiscal 2018, respectively. B. Includes professional fees and other costs related to completed and abandoned acquisitions, costs of integrating certain of our facilities, facility closing costs, advisory fees, and offering fees. C. Consists primarily of professional fees and related expenses associated with productivity initiatives. D. Consists primarily of amounts related to fuel collar derivatives, certain financing transactions, lease amendments, legal settlements, franchise tax expense, and other adjustments permitted under our credit agreement. E. Represents the per share impact of the $37.4 million net benefit to deferred income tax expense as a result of the Tax Cuts and Jobs Act and the revaluation of the Company s net deferred tax liability. F. Represents the per share impact of the $15.4 million excess tax benefit recognized as a result of the performance metrics being met for certain stock-based compensation awards upon the exit of the Company s private equity shareholders. 49
2017 Investor Presentation
 2017 Investor Presentation Growth Outpacing a Growing Industry Food Away From Home PFG Net Sales $B $B $331 5.2% $741 $10.1 $10.6 8.2% $11.5 $12.8 $13.7 $15.3 $16.1 '99 '00 '01 '02 '03 '04 '05 '06 '07
CFA Investment Research Challenge
 CFA Investment Research Challenge October 27 th, 2016 Forward-Looking Statements This document has been prepared by Performance Food Group Company (the Company, we, us and our ) solely for informational
Founded on food, focused on service.
 Founded on food, focused on service. Q1 Earnings Call November 4, 2015 Forward Looking Statements This presentation includes, and our response to various questions may include, certain forward looking
Investors: Michael D. Neese VP, Investor Relations (804)
") NEWS RELEASE For Immediate Release August 17, 2016 Investors: Michael D. Neese VP, Investor Relations (804) 287-8126 michael.neese@pfgc.com Media: Joe Vagi Manager, Corporate Communications (804) 484-7737
NEWS RELEASE For Immediate Release August 17, 2016 Investors: Michael D. Neese VP, Investor Relations (804) 287-8126 michael.neese@pfgc.com Media: Joe Vagi Manager, Corporate Communications (804) 484-7737
NEWS RELEASE For Immediate Release March 19, 2019
 NEWS RELEASE For Immediate Release March 19, 2019 Investor Contact: Media Contact: Michael D. Neese Trisha Meade VP, Investor Relations Communications & Engagement Manager (804) 287-8126 (804) 285-5390
Investors: Michael D. Neese VP, Investor Relations (804)
") NEWS RELEASE For Immediate Release February 7, 2018 Investors: Michael D. Neese VP, Investor Relations (804) 287-8126 michael.neese@pfgc.com Media: Joe Vagi Manager, Corporate Communications (804) 484-7737
NEWS RELEASE For Immediate Release February 7, 2018 Investors: Michael D. Neese VP, Investor Relations (804) 287-8126 michael.neese@pfgc.com Media: Joe Vagi Manager, Corporate Communications (804) 484-7737
Performance Food Group Company (Exact name of registrant as specified in its charter)
") UNITED STATES SECURITIES AND EXCHANGE COMMISSION WASHINGTON, D.C. 20549 FORM 8-K CURRENT REPORT PURSUANT TO SECTION 13 OR 15(d) OF THE SECURITIES EXCHANGE ACT OF 1934 Date of Report (Date of earliest event
UNITED STATES SECURITIES AND EXCHANGE COMMISSION WASHINGTON, D.C. 20549 FORM 8-K CURRENT REPORT PURSUANT TO SECTION 13 OR 15(d) OF THE SECURITIES EXCHANGE ACT OF 1934 Date of Report (Date of earliest event
Performance Food Group Company Reports First-Quarter Fiscal 2018 Results
 NEWS RELEASE For Immediate Release November 8, 2017 Investors: Michael D. Neese VP, Investor Relations (804) 287-8126 michael.neese@pfgc.com Media: Joe Vagi Manager, Corporate Communications (804) 484-7737
Performance Food Group Company (Exact name of Registrant as Specified in Its Charter)
") UNITED STATES SECURITIES AND EXCHANGE COMMISSION WASHINGTON, D.C. 20549 FORM 8-K CURRENT REPORT Pursuant to Section 13 or 15(d) of the Securities Exchange Act of 1934 Date of Report (Date of earliest event
UNITED STATES SECURITIES AND EXCHANGE COMMISSION WASHINGTON, D.C. 20549 FORM 8-K CURRENT REPORT Pursuant to Section 13 or 15(d) of the Securities Exchange Act of 1934 Date of Report (Date of earliest event
Performance Food Group Company Reports Third-Quarter Fiscal 2016 Results: Provides Full-Year Fiscal 2016 Adjusted EBITDA Growth Outlook of 10% to 12%
 NEWS RELEASE For Immediate Release May 4, 2016 Investors: Michael D. Neese VP, Investor Relations (804) 287-8126 michael.neese@pfgc.com Media: Joe Vagi Manager, Corporate Communications (804) 484-7737
Founded on food, focused on service.
 Founded on food, focused on service. Q3 FY2016 Earnings Call May 4, 2016 Forward Looking Statements This presentation includes, and our response to various questions may include, certain forward looking
Jefferies Consumer Summit 2018
 Jefferies Consumer Summit 2018 FORWARD LOOKING STATEMENTS Statements made in this presentation that look forward in time or that express management s beliefs, expectations or hopes are forward-looking
Sysco Earnings Results 2Q19
 Sysco Earnings Results 2Q19 FORWARD LOOKING STATEMENTS Statements made in this presentation or in our earnings call for the second quarter of fiscal 2019 that look forward in time or that express management
Sysco Fiscal 4Q15 and Fiscal 2015 Financial Results. August 10, 2015
 Sysco Fiscal 4Q15 and Fiscal 2015 Financial Results August 10, 2015 Forward-Looking Statements Statements made in this press release or in our earnings call for the third quarter of fiscal 2015 that look
SYSCO REPORTS SECOND QUARTER FISCAL 2019 RESULTS. The Company delivered results in line with expectations
 SYSCO REPORTS SECOND QUARTER FISCAL 2019 RESULTS The Company delivered results in line with expectations HOUSTON, February 4, 2019 - Sysco Corporation (NYSE: SYY) today announced financial results for
CAGNY /19/2019 CAGNY
 CAGNY 2019 Forward Looking Statements Statements made in this presentation that look forward in time or that express management s beliefs, expectations or hopes are forward-looking statements within the
Sysco 2Q16 Earnings Results. February 1, 2016
 Sysco 2Q16 Earnings Results February 1, 2016 Forward-Looking Statements Statements made in this presentation or in our earnings call for the second quarter of fiscal 2016 that look forward in time or that
Sysco 1Q18 Earnings Results
 Sysco 1Q18 Earnings Results 11.06.17 Forward-Looking Statements Statements made in this presentation or in our earnings call for the first quarter of fiscal 2018 that look forward in time or that express
Forward-Looking Statements
 William Blair & Company 27 th Annual Growth Stock Conference June 20, 2007 0 Forward-Looking Statements This presentation contains forward-looking statements that are subject to a number of risks and uncertainties,
SYSCO REPORTS THIRD QUARTER EARNINGS
 SYSCO REPORTS THIRD QUARTER EARNINGS HOUSTON, May 7, 2018 - Sysco Corporation (NYSE: SYY) today announced financial results for its 13-week third fiscal quarter ended March 31, 2018. Third Quarter Fiscal
SYSCO REPORTS FIRST QUARTER FISCAL 2018 RESULTS
 For more information contact: Sysco Corporation 1390 Enclave Parkway Neil Russell Camilla Zuckero Houston, TX 77077 Investor Contact Media Contact T 281-584-1308 T 281-899-1839 SYSCO REPORTS FIRST QUARTER
FORWARD LOOKING STATEMENTS
 CAGNY 2018 FORWARD LOOKING STATEMENTS Certain statements made herein that look forward in time or that express management s beliefs, expectations or hopes are forward-looking statements within the meaning
A Taste of What s Cooking at US Foods. dbaccess Global Consumer Conference June 14, 2017
 A Taste of What s Cooking at US Foods dbaccess Global Consumer Conference June 14, 2017 Cautionary Statements Forward-Looking Statements This presentation and related comments by management contain forward-looking
McCormick & Company, Inc. 1 st Quarter 2018 Financial Results and Outlook
 McCormick & Company, Inc. 1 st Quarter 2018 Financial Results and Outlook March 27, 2018 The following slides accompany a March 27, 2018, earnings release conference call. This information should be read
Sysco 3Q15 Earnings Results
 Sysco 3Q15 Earnings Results May 4, 2015 Forward-Looking Statements Statements made in this press release or in our earnings call for the third quarter of fiscal 2015 that look forward in time or that express
Investment Considerations
 Investment Considerations Schools Specialty s unique attributes provide significant earnings stability and predictability Clear market leader in attractive, fragmented industry Largest product offering
Forward-Looking Statements
 March 2006 0 Forward-Looking Statements This presentation contains forward-looking statements that are subject to a number of risks and uncertainties, many of which are outside our control. These forward-looking
Core-Mark Holding Company Jefferies 2017 Consumer Conference. June 21 st 2017
 Core-Mark Holding Company Jefferies 2017 Consumer Conference June 21 st 2017 2 Safe Harbor & SEC Regulation G Safe Harbor Statements made in the course of this presentation that state the company s or
2018 FOURTH QUARTER EARNINGS CALL
 NORTH AMERICA S LEADING BUILDING MATERIALS DISTRIBUTOR RESIDENTIAL COMMERCIAL INTERIOR SOLAR 2018 FOURTH QUARTER EARNINGS CALL Forward Looking Statements / Non-GAAP Measures This presentation contains
The J. M. Smucker Company
 The J. M. Smucker Company Fourth Quarter Fiscal 2018 Earnings SUPPLEMENTARY INFORMATION June 7, 2018 Consolidated Results ($ in millions, except per share data) FY18 Q4 FY17 Q4 YoY Change Net Sales $1,781
THIRD QUARTER 2018 REVIEW & INVESTOR OVERVIEW NOVEMBER 8, 2018
 THIRD QUARTER 2018 REVIEW & INVESTOR OVERVIEW NOVEMBER 8, 2018 REGARDING FORWARD-LOOKING STATEMENTS Statements contained in this press release that are not historical facts are forward-looking statements.
McCormick & Company, Inc. 4th Quarter 2018 Financial Results and 2019 Outlook
 McCormick & Company, Inc. 4th Quarter 2018 Financial Results and 2019 Outlook January 24 th 2019 The following slides accompany a January 24 th 2019, earnings release conference call. This information
Our Transformation Continues Sidoti NDR May 29-30, 2018
 Our Transformation Continues Sidoti NDR May 29-30, 2018 Disclosure Regarding Forward-Looking Statements Forward-Looking Statements and Factors That May Affect Future Results: Throughout this presentation,
Our Transformation Continues. March 21, 2018
 Our Transformation Continues March 21, 2018 Disclosure Regarding Forward-Looking Statements Forward-Looking Statements and Factors That May Affect Future Results: Throughout this presentation, we make
Q4 and Fiscal 2017 Results
 US Foods Holding Corporation Q4 and Fiscal 2017 Results February 15, 2018 Cautionary Statements Forward-Looking Statements This presentation contains forward-looking statements concerning, among other
Sysco Earnings Results 3Q18
 Sysco Earnings Results 3Q18 FORWARD LOOKING STATEMENTS Statements made in this presentation or in our earnings call for the third quarter of fiscal 2018 that look forward in time or that express management
Acquisition of Signode: Global Leader In Transit Packaging. December 19, 2017
 Acquisition of Signode: Global Leader In Transit Packaging December 19, 2017 Forward Looking Statement Except for historical information, all other information in this presentation consists of forward-looking
UNITED STATES SECURITIES AND EXCHANGE COMMISSION Washington, D.C
 UNITED STATES SECURITIES AND EXCHANGE COMMISSION Washington, D.C. 20549 FORM 8-K CURRENT REPORT Pursuant to Section 13 or 15(d) of the Securities Exchange Act of 1934 February 12, 2019 Date of Report (Date
Investor Presentation. Second Quarter 2018 NASDAQ: BECN BECN
 Investor Presentation Second Quarter 2018 BECN 1 Disclosures Forward Looking Statements and Non-GAAP Measures This presentation contains forward-looking statements within the meaning of the Private Securities
Zep Inc. Company Overview. October 2013
 Zep Inc. Company Overview October 2013 Safe Harbor This release contains, and other written or oral statements made by or on behalf of Zep may include, forward-looking statements, within the meaning of
Fourth Quarter and Full Year Earnings Call March 1, 2019
 Fourth Quarter and Full Year Earnings Call March 1, 2019 Safe Harbor & Non-GAAP Financial Measures Cautionary Notice Statements in this news release and the schedules hereto that are not purely historical
Investor Presentation June Henry Demone, CEO Kelly Nelson, CFO
 Investor Presentation June 2013 Henry Demone, CEO Kelly Nelson, CFO Disclaimer Certain statements made in this presentation are forward-looking and are subject to important risks, uncertainties and assumptions
Second Quarter 2017 Reconciliation of Non-GAAP Financial Measures
 Second Quarter 2017 Reconciliation of Non-GAAP Financial Measures Adjusted Operating Income Reconciliation Adjusted operating income is not a measure of financial performance under generally accepted accounting
Pinnacle Foods Reports Strong 1st Quarter Fiscal 2017 Results Company Reaffirms Guidance for the Year
 Pinnacle Foods Reports Strong 1st Quarter Fiscal Results Company Reaffirms Guidance for the Year Parsippany, NJ, April 27, - Pinnacle Foods Inc. (NYSE: PF) today reported strong results for the first quarter
2018 First Quarter Earnings Call. February 8, 2018
 2018 First Quarter Earnings Call February 8, 2018 Forward Looking Statements / Non-GAAP Measures This presentation contains information about management's view of the Company's future expectations, plans
COMPANY OVERVIEW MARCH 2018
 COMPANY OVERVIEW MARCH 2018 REGARDING FORWARD-LOOKING STATEMENTS Statements contained in this press release that are not historical facts are forward-looking statements. Forward-looking statements relate
McCormick & Company, Inc. 2 nd Quarter 2018 Financial Results and Outlook
 McCormick & Company, Inc. 2 nd Quarter 2018 Financial Results and Outlook June 28, 2018 The following slides accompany a June 28, 2018, earnings release conference call. This information should be read
An Exciting New Growth Platform
 Legal Disclaimer This presentation may contain written and oral statements that constitute forward-looking statements within the meaning of the Private Securities Litigation Reform Act of 1995, as amended.
B. Riley FBR s Annual Consumer & Media Conference
 B. Riley FBR s Annual Consumer & Media Conference October 4, 2018 Joseph C. Bartolacci President and Chief Executive Officer Steven F. Nicola Chief Financial Officer 2018 Matthews International Corporation.
Jefferies Consumer Conference June 2016
 Jefferies Consumer Conference SAFE HARBOR STATEMENT Safe Harbor Statement under the Private Securities Litigation Reform Act of 1995: Statements in this presentation regarding the business of The Chefs
Goodman Global, Inc. JPMorgan Small / Mid Cap Conference November 14, 2006
 Goodman Global, Inc. JPMorgan Small / Mid Cap Conference November 14, 2006 1 Company overview Goodman Goodman is a leading HVAC manufacturer $1.8 billion in annual sales A growing position in a growing
FOURTH QUARTER 2018 REVIEW FEBRUARY 7, 2019
 FOURTH QUARTER 2018 REVIEW FEBRUARY 7, 2019 REGARDING FORWARD LOOKING STATEMENTS Statements contained in this press release that are not historical facts are forward looking statements. Forward looking
McCormick & Company, Inc. 2nd Quarter 2017 Financial Results and Outlook June 29, 2017
 McCormick & Company, Inc. 2nd Quarter 2017 Financial Results and Outlook June 29, 2017 1 The following slides accompany a June 29, 2017 presentation to investment analysts. This information should be read
Xylem Agrees to Acquire Sensus to Broaden Portfolio and Enhance Growth Platform AUGUST 15, 2016
 1 Xylem Agrees to Acquire Sensus to Broaden Portfolio and Enhance Growth Platform AUGUST 15, 2016 Forward-Looking Statements This presentation contains information that may constitute forward-looking statements.
Descartes Uniting Business in Commerce
 Descartes Uniting Business in Commerce November 2018 : DSGX : DSG Safe Harbor Statement Certain statements to be made today and in this presentation, and that may be made in response to questions, constitute
William Blair Growth Stock Conference June 15, Member FINRA/SIPC
 William Blair Growth Stock Conference June 15, 2011 Member FINRA/SIPC Safe Harbor Disclosure The following information contains forward-looking statements. Forward-looking statements include statements
FOUNDED ON FOOD FOCUSED ON SERVICE Annual Report
 FOUNDED ON FOOD FOCUSED ON SERVICE 2016 Annual Report PERFORMANCE FOOD GROUP AT A GLANCE Performance Food Group markets and and distributes approximately 150,000 food and food-related products approximately
34 th Annual J.P. Morgan Healthcare Conference. Steve Collis, President & CEO Tim Guttman, EVP & CFO
 34 th Annual J.P. Morgan Healthcare Conference Steve Collis, President & CEO Tim Guttman, EVP & CFO January 12, 2016 Steve Collis President & CEO Cautionary Note Regarding Forward-Looking Statements Certain
SYSCO REPORTS SECOND QUARTER FISCAL 2018 RESULTS. The Company remains on track to achieve its fiscal year 2018 financial targets
 For more information contact: Sysco Corporation 1390 Enclave Parkway Neil Russell Camilla Zuckero Houston, TX 77077 Investor Contact Media Contact T 281-584-1308 T 281-899-1839 SYSCO REPORTS SECOND QUARTER
Investor Presentation. May 2018
 Investor Presentation May 2018 Disclaimer and Forward-Looking Statements Special Note Regarding Forward-Looking Statements This presentation, and certain information that management may discuss in connection
The Hanover Insurance Group
 The Hanover Insurance Group Bank of America Merrill Lynch 2019 Insurance Conference February 13, 2019 Jack Roche President and Chief Executive Officer 1 Forward-looking statements Forward-looking statements
Sysco 3Q13 Earnings Results. May 6, 2013
 Sysco 3Q13 Earnings Results May 6, 2013 Forward-Looking Statements Statements made in this presentation that look forward in time or that express management s beliefs, expectations or hopes are forward-looking
13-Week Period Change
 Impact of Certain Items (In Thousands, Except for Share and Per Share Data) Sysco s results of operations are impacted by certain items which include charges from restructuring our executive retirement
2018 RBC Capital Markets Global Industrials Conference September 8, 2018
 2018 RBC Capital Markets Global Industrials Conference September 8, 2018 Safe Harbor and Non-GAAP Financial Metrics Certain statements in this presentation may be deemed to be forward-looking. These statements
Sysco 4Q & FY14 Earnings Results. August 11, 2014
 Sysco 4Q & FY14 Earnings Results August 11, 2014 Forward-Looking Statements Statements made in this press release or in our earnings call for the fourth quarter of fiscal 2014 that look forward in time
COMPANY OVERVIEW NOVEMBER 2017
 COMPANY OVERVIEW NOVEMBER 2017 REGARDING FORWARD-LOOKING STATEMENTS Statements contained in this press release that are not historical facts are forward-looking statements. Forward-looking statements relate
First Quarter 2016 Earnings
 First Quarter 2016 Earnings Disclaimer Forward-Looking Statements This presentation contains forward-looking statements within the meaning of the Federal Private Securities Litigation Reform Act of 1995.
McCormick to Acquire Reckitt Benckiser s Food Division. Investor Presentation / July 19, 2017
 McCormick to Acquire Reckitt Benckiser s Food Division Investor Presentation / July 19, 2017 Forward-looking information Certain information contained in this presentation and our remarks that are not
Pinnacle Foods Reports Second Quarter Fiscal 2017 Results Company Maintains Full Year Guidance at Low End of Range
 Pinnacle Foods Reports Second Quarter Fiscal 2017 Results Company Maintains Full Year Guidance at Low End of Range Parsippany, NJ, July 27, 2017 - Pinnacle Foods Inc. (NYSE: PF) today reported its financial
Building a Platform for Growth. December 2016
 Building a Platform for Growth December 2016 Forward Looking Statements This presentation includes forward-looking statements about the plans, strategies, objectives, goals or expectations of SpartanNash
Multi-Color Corporation Investor Update
 Multi-Color Corporation Investor Update October 2018 Nasdaq: LABL www.mcclabel.com Safe Harbor Statement The Company believes certain SAFE statements contained HARBOR in this report STATEMENT that are
Copyright 2018 CPI Card Group. Fourth Quarter & FY 2017 Earnings Conference Call March 12, 2018
 Fourth Quarter & FY 2017 Earnings Conference Call March 12, 2018 Safe Harbor Forward-Looking Statements Statements in this presentation that are not statements of historical fact are forward-looking statements
Descartes Uniting Business in Commerce
 Descartes Uniting Business in Commerce March 2019 : DSGX : DSG Safe Harbor Statement Certain statements to be made today and in this presentation, and that may be made in response to questions, constitute
19 th Annual B. Riley FBR Investor Conference May 23, 2018
 19 th Annual B. Riley FBR Investor Conference May 23, 2018 Joseph C. Bartolacci President and Chief Executive Officer Steven F. Nicola Chief Financial Officer 2018 Matthews International Corporation. All
Per formance Food Gr oup Annual Repor
 2017 Annual Report Dear Shareholder Fiscal 2017 was a year of making strategic growth investments to fuel future growth. Our team s strong execution enabled us to generate industry-leading case growth
WESCO International John Engel Chairman, President and CEO. William Blair & Company 36 th Annual Growth Stock Conference June 14, 2016
 WESCO International John Engel Chairman, President and CEO William Blair & Company 36 th Annual Growth Stock Conference June 14, 2016 Safe Harbor Statement Note: All statements made herein that are not
William Blair Growth Conference Tom Richards. Chairman & CEO CDW Corporation
 William Blair Growth Conference 2015 Tom Richards Chairman & CEO 2012 CDW Corporation Disclaimers This presentation contains forward-looking statements within the meaning of the federal securities laws.
Third Quarter Ended September 30, 2016
 Third Quarter Ended September 30, 2016 1 Forward-Looking Statements In the interest of providing shareholders and potential investors with information regarding TransForce, including management s assessment
Q Investors Presentation
 Q2 2017 Investors Presentation Forward Looking Statements and Non-GAAP Measures This presentation contains information about management's view of the Company's future expectations, plans and prospects
News. PQ Group Holdings Inc. Reports Third Quarter 2017 Results
 News PQ Group Holdings Inc. Reports Third Quarter 2017 Results November 13, 2017 Strong revenue and Adjusted EBITDA growth in Q3 ahead of expectations; raising full year estimates Highlights Sales increased
McCORMICK REPORTS DOUBLE DIGIT THIRD QUARTER SALES AND PROFIT GROWTH AND INCREASES 2018 EARNINGS PER SHARE OUTLOOK
 FOR IMMEDIATE RELEASE McCORMICK REPORTS DOUBLE DIGIT THIRD QUARTER SALES AND PROFIT GROWTH AND INCREASES 2018 EARNINGS PER SHARE OUTLOOK HUNT VALLEY, Md., September 27, 2018 - McCormick & Company, Incorporated
Core-Mark Holding Company, Inc. B B & T Consumer, Food & Retail Conference New York December 3, 2013
 Core-Mark Holding Company, Inc. B B & T Consumer, Food & Retail Conference New York December 3, 2013 SAFE HARBOR Statements made in the course of this presentation that state the company s or management
SAFE HARBOR STATEMENT
 1 SAFE HARBOR STATEMENT Forward Looking Statements This press release, and the above referenced conference call, contains or may contain forward-looking statements made pursuant to the safe harbor provisions
Investor Presentation
 Investor Presentation November 2018 SAFE HARBOR STATEMENT & NON-GAAP MEASURES Statements in this presentation include forward-looking statements within the meaning of the Private Securities Litigation
Investor Presentation January 2015
 Investor Presentation January 2015 Safe Harbor Statement Certain statements and information included in this presentation constitute "forward-looking information" within the meaning of applicable Canadian
Washington,D.C FORM8-K. November7,2017. Delaware (Stateorotherjurisdictionof. Rosemont,IL60018
 UNITEDSTATES SECURITIESANDEXCHANGECOMMISSION Washington,D.C.20549 FORM8-K CURRENTREPORT PursuanttoSection13or15(d)oftheSecuritiesExchangeActof1934 November7,2017 DateofReport(Dateofearliesteventreported)
McCormick & Company, Inc.
 McCormick & Company, Inc. Bernstein Strategic Decisions Conference May 30, 2018 FORWARD-LOOKING INFORMATION Certain information contained in this release, including statements concerning expected performance
First Quarter 2018 Results & Outlook. May 3, 2018
 First Quarter 2018 Results & Outlook May 3, 2018 Forward-Looking Statements This presentation contains forward-looking statements within the meaning of the Private Securities Litigation Reform Act of 1995.
Forward-Looking Statements
 JPM-0807 1 Forward-Looking Statements Certain statements contained in this presentation are forward-looking statements within the meaning of the Private Securities Litigation Reform Act of 1995. These
CARBONITE (NASDAQ: CARB)
") CARBONITE (NASDAQ: CARB) FOURTH QUARTER AND FY 2016 FINANCIAL RESULTS Thursday, February 9 th 2017 JERRY SISITSKY VP, Investor Relations Phone: 781-928-0713 Email: investor.relations@carbonite.com (NASDAQ:
CARBONITE (NASDAQ: CARB) FOURTH QUARTER AND FY 2016 FINANCIAL RESULTS Thursday, February 9 th 2017 JERRY SISITSKY VP, Investor Relations Phone: 781-928-0713 Email: investor.relations@carbonite.com (NASDAQ:
NLSN 4Q and FY 2011 Investor Presentation
 NLSN 4Q and FY 2011 Investor Presentation Forward Looking Statements The following discussion contains forward-looking statements, including those about Nielsen s outlook and prospects, in the meaning
Powering healthcare provider success
 Powering healthcare provider success Now and in the future 38 th Annual William Blair Growth Stock Conference June 12, 2018 TRANSFORMING HEALTHCARE TOGETHER Premier Inc. 2018 1 Forward-looking statements
WESCO International John Engel Chairman, President and CEO
 WESCO International John Engel Chairman, President and CEO Raymond James 37 th Annual Institutional Investors Conference 2016 Raymond James 37th Annual Institutional Investors Conference 2016 Safe Harbor
Investor Presentation
 Investor Presentation September 2018 Disclaimer This presentation contains forward-looking statements. You can generally identify forward-looking statements by our use of forward-looking terminology such
FY17 Results. 25 September 2017
 FY17 Results 25 September 2017 Forward Looking Statement This document contains forward looking statements, which reflect management s current views and estimates. The forward looking statements involve
Raymond James 37 th Annual Institutional Investors Conference. March 8, 2016
 Raymond James 37 th Annual Institutional Investors Conference March 8, 2016 Forward-looking statements and Non-GAAP financial measures Forward-looking statements Certain statements included in this presentation,
Multi-Color Corporation Investor Update
 Multi-Color Corporation Investor Update November 2018 Nasdaq: LABL www.mcclabel.com Safe Harbor Statement SAFE HARBOR STATEMENT The Company believes certain statements contained in this report that are
GENERAL MILLS. Fiscal 2018 Third Quarter Results. March 21, 2018
 GENERAL MILLS Fiscal 2018 Third Quarter Results March 21, 2018 A Reminder on Forward-looking Statements This presentation contains forward-looking statements within the meaning of the Private Securities
Mondelēz International Details Strategy and Affirms Outlook at CAGNY
 Contacts: Michael Mitchell (Media) Dexter Congbalay (Investors) +1-847-943-5678 +1-847-943-5454 news@mdlz.com ir@mdlz.com Mondelēz International Details Strategy and Affirms Outlook at CAGNY BOCA RATON,
The J.M. Smucker Company
 The J.M. Smucker Company CONSUMER ANALYST GROUP OF NEW YORK CONFERENCE February 21, 2018 Strategy and Business Update Mark Smucker President and Chief Executive Officer Financial Update Mark Belgya Vice