2018 General Rate Case
|
|
|
- Hope Beasley
- 6 years ago
- Views:
Transcription
 2018 General Rate Case Tax Update Before the Public Utilities Commission of the State of California")
1 Application No.: Exhibit No.: Witnesses: A SCE-60 M. Childs J. McCarson S. Menon D. Tessler (U 338-E) 2018 General Rate Case Tax Update Before the Public Utilities Commission of the State of California Rosemead, California February 16, 2018
2 Tax Update Table Of Contents Section Page Witness I. INTRODUCTION...1 S. Menon II. BACKGROUND...2 III. SUMMARY OF UPDATED REVENUE REQUIREMENT REQUEST...3 D. Tessler IV. RESULTS OF OPERATIONS...4 V. TAX LEGISLATION CHANGE...6 M. Childs A. Change in the Federal income tax rate from 35% to 21% Equity Return on Rate Base Debt Return on Rate Base Current Year Flow-Through Tax Benefits Prior Year Flow-Through Tax Benefits Change in Deferred Income Taxes...9 B. Loss of IRC Section 199 Manufacturing Deduction...9 C. New IRC Section 168(k) Bonus Depreciation Rules Exclude Public Utility Property...9 D. Average Rate Assumption Method ( ARAM )...10 VI. CHANGES TO WORKING CASH...14 J. McCarson VII. ADDED FACILITIES AND OTHER OPERATING REVENUE FORECAST...16 D. Tessler VIII. RATEMAKING CONSIDERATIONS...18 S. Menon Appendix A -i-
3 I. INTRODUCTION Southern California Edison Company (SCE) respectfully presents this testimony that addresses the various impacts that new Federal income tax legislation 1 (Tax Legislation) has on SCE s Test Year 2018 General Rate Case (GRC) request. 2 SCE previously submitted update testimony on December 8, 2017, pursuant to the schedule established by Administrative Law Judges (ALJs) Roscow and Wildgrube. This Tax Legislation update reduces SCE s Test Year 2018 Revenue Requirement by $139 million compared to our revenue requirement request as stated in our December 8, 2017 update testimony. 3 With this update, we are requesting a 2018 GRC revenue decrease of $22 million, which is 0.38% below the 2017 authorized GRC revenue requirement. The key drivers of this reduction are changes in the Federal Income Tax Rate, Internal Revenue Code (IRC) Section 199 Deduction, Bonus Depreciation, Average Rate Assumption Method (ARAM), and Added Facilities Other Operating Revenue (OOR). This testimony provides the updated revenue requirement request along with the details regarding each of these drivers and how they impact the revenue requirement. 1 This new Federal income tax legislation is known as the Tax Cuts and Jobs Act (TCAJA). 2 As discussed at the last day of evidentiary hearings. See Evid. Hearing Transcript, Vol. 21, p (hearing date August 2, 2017). 3 This update also updates the material that was provided to intervenors and the CPUC s Energy Division in draft form on January 31,
4 II. BACKGROUND SCE submits this testimony pursuant to the guidance and direction that the ALJs provided in their January 2, ruling concerning the Tax Legislation. In conformance with that ruling, SCE hosted a meet and confer amongst the GRC parties on January 5, At the meet and confer, the parties discussed and agreed upon a proposed schedule for SCE to provide: (a) a draft and a final version of a revised Results of Operations (RO) model incorporating the changes triggered by the Tax Legislation; and (b) prepared testimony addressing the changes. The parties proposed schedule also encompassed other parties prepared testimony, evidentiary hearings, and post-hearing briefing as these additional items may be needed. On January 9, 2018, SCE filed a report on the meet and confer, which included the parties proposed schedule. On January 16, 2018, the ALJs issued a Ruling Adopting Schedule Regarding New Federal Income Tax Legislation (Ruling). The Ruling adopted the proposed procedural schedule, with one addition to the parties that would receive SCE s draft RO model. The ALJs directed that the draft RO model also be served to the Commission s Energy Division. 4 SCE served its draft RO model on January 31, The January 16 th Ruling also directed SCE to coordinate with the Energy Division to facilitate a workshop or webinar to explain the Results of Operations model changes and support the parties efforts in analyzing how the model captures the changes triggered by the tax legislation. 5 SCE noticed a workshop, which occurred on February 12, See Ruling, at Ordering Paragraph 2. 5 See Ruling, at Ordering Paragraph 3. 2
5 III. SUMMARY OF UPDATED REVENUE REQUIREMENT REQUEST The Commission s Rate Case Plan 6 outlines three general criteria for update testimony: 1. Known changes in cost of labor based on contract negotiations completed or known changes that result from updated data using the same indices used in the original presentation during the hearing. 2. Changes in non-labor escalation factors based on the same indices the party used in its original presentation during hearings. 3. Known changes due to governmental action such as changes in tax rates, postage rates, or assessed valuation. Table III-1 below summarizes the revenue requirement impact of the updates we have identified and supported in this testimony. Table III-1 GRC CPUC Line Item SCE-59 December 2017 Update Testimony 5,673,313 6,149,841 6,703, Revisions for Federal Income Tax Legislation (138,907) (184,662) (235,265) 3. SCE-60 Update for Tax Legislation 5,534,406 5,965,179 6,468,180 6 See, e.g., D
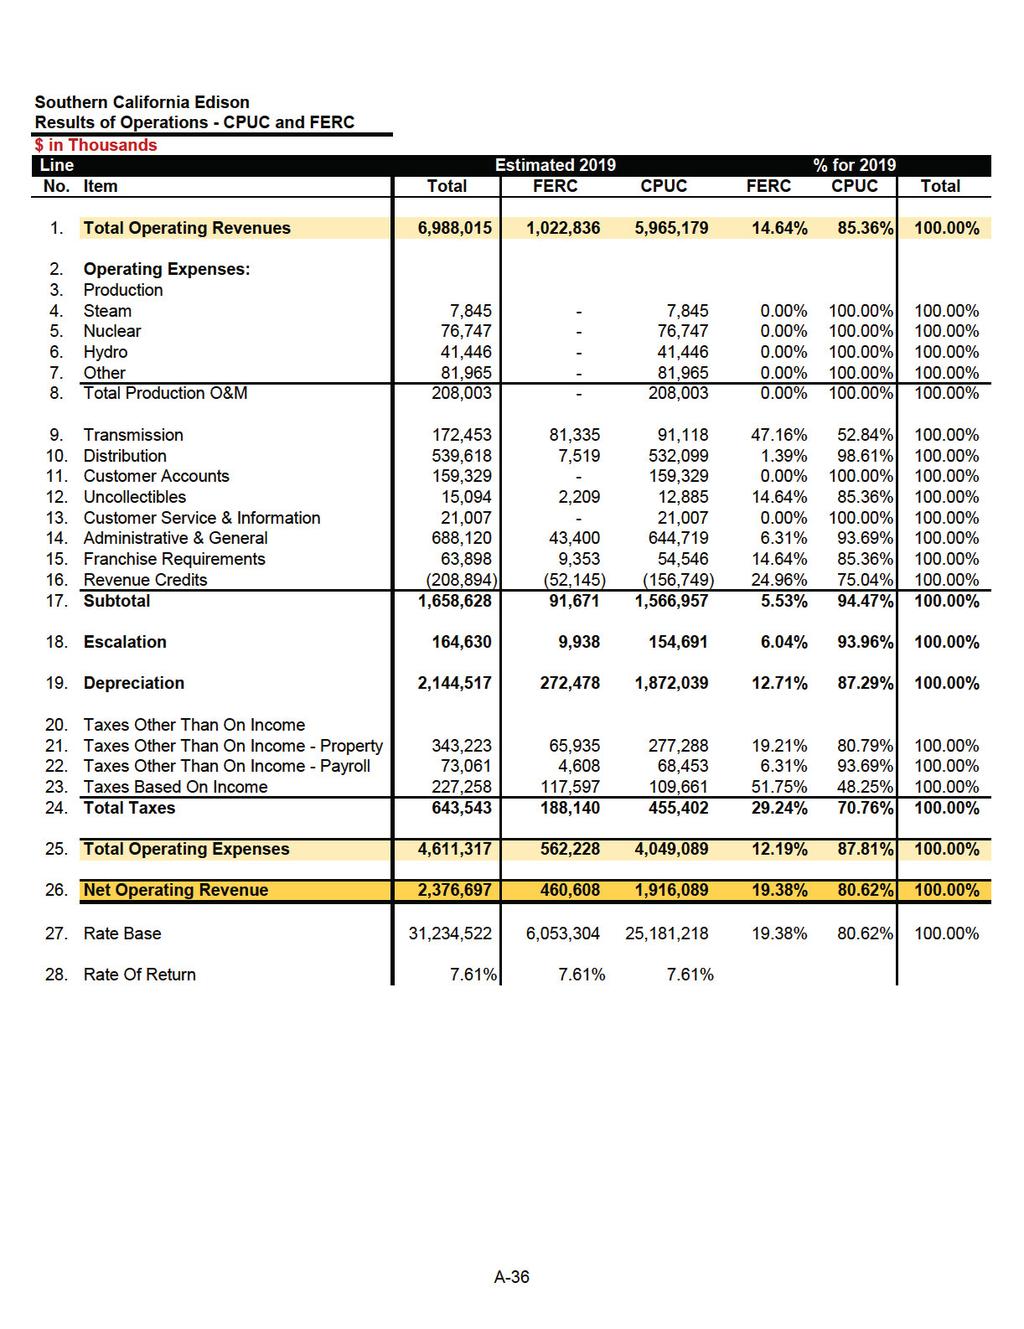
6 IV. RESULTS OF OPERATIONS This chapter presents our revised 2018 Test Year Results of Operations (RO) based on the updated information presented in Chapters VI through VIII. We request that the Commission adopt a 2018 revenue requirement of $5.534 billion. Table IV-2 presents our revised Results of Operations for Test Year 2018 and Post-Test Years 2019 and Table IV-2 Revised Results of Operations At Proposed Rates Commission Jurisdictional (Thousands of Dollars) GRC CPUC Line Item Total Operating Revenues 5,534,406 5,965,179 6,468, Operating Expenses: 3. Production 4. Steam 7,845 7,845 7, Nuclear 76,747 76,747 76, Hydro 41,446 41,446 41, Other 81,965 81,965 81, Total Production O&M 208, , , Transmission 91,118 91,118 91, Distribution 532, , , Customer Accounts 159, , , Uncollectibles 11,954 12,885 13, Customer Service & Information 21,007 21,007 21, Administrative & General 647, , , Franchise Requirements 50,607 54,546 59, Revenue Credits (153,070) (156,749) (159,711) 17. Total O&M 1,568,900 1,566,957 1,568, Escalation 103, , , Depreciation 1,752,338 1,872,039 2,048, Taxes Other Than On Income 21. Property Taxes 258, , , Payroll Taxes & Misc 66,350 68,453 70, Taxes Based On Income 38, , , Total Taxes 363, , , Total Operating Expenses 3,788,910 4,049,089 4,379, Net Operating Revenue 1,745,496 1,916,089 2,088, Rate Base 22,939,281 25,181,218 27,445, Rate Of Return 7.61% 7.61% 7.61% 7 Please refer to Appendix A for additional information. 4
7 The revenue reduction attributable to this proceeding is $22 million, as identified in Table IV-3 (line 18). This revenue change takes into account a $106 million decrease in Authorized Base Revenue Requirement (ABRR), a $43 million increase to account for a decline in 2018 forecast GWh sales, and a $41 million increase related to the recovery of the December 31, 2017 balances in five balancing and memorandum accounts as supported in prior testimony. 8 Table IV-3 also identifies the requested ABRR and CPUC-jurisdictional base-related revenue changes estimated for Post-Test Years (PTYR) 2019 and Table IV , 2019 and 2020 Revenue Changes Resulting From the 2018 Test Year and 2019 and 2020 PTYR GRC Request CPUC-Jurisdictional (Thousands of Dollars) Cumulative SCE-9 Vol. 1 Reference 1. Proposed GRC Base Revenue Requirement 5,534,406 5,965,179 6,468,180 SCE-60, Table III-1 2. Estimated Present (Prior Year) Revenue Requirement 5,640,432 5,534,406 5,965,179 For 2018, AL 3514-E 3. GRC ABRR Change (106,026) 430, , Less: GRC Revenue Growth GWhs GRC PRR 84,253 5,309,377 Table VI GRC PRR 83,572 5,266,462 Table VI GRC PRR 83,572 5,266,462 Table VI GRC PRR 83,470 5,260,034 Table VI GRC PRR 83,470 5,260,034 Table VI GRC PRR 82,567 5,203,130 Table VI GRC Revenue Growth (42,915) (6,428) (56,904) 12. Residential Rate OIR Implementation MA 18,854 (18,854) SCE-59, CH IV, plus FF&U 13. SmartConnect Opt Out BA 11,457 (11,457) SCE-59, CH IV, plus FF&U Bark Beetle CEMA 10,675 (10,675) SCE-12, Table VI-3 + FF&U 15. Residential Service Disconnection MA 27 (27) Table IV-16 plus FF&U 16. Energy Data Request Program MA 458 (458) SCE-59, CH IV, plus FF&U 17. Subtotal - Balancing/Memo Account Recovery 41,471 (41,471) GRC Revenue Change (Line 3 - Line 11 + Line 17) (21,640) 395, , , Percent GRC Revenue Change (0.38%) 7.15% 9.39% 16.15% 20. Total System PRR 11,417,570 11,393,715 11,277,777 Table VI GRC Revenue Change (21,640) (21,640) Line 18 (2018) 22. GRC Revenue Change ,730 Line 18 (2019) 23. Total System PRR with GRC Revenue Changes 11,417,570 11,372,075 11,651,866 Line 20 + Line 21 + Line Percent Total Revenue Change (0.19%) 3.48% 4.81% 8.10% Line 18 / Line 23 8 See SCE-09, Vol. 1, Ch. IV and SCE-59, Ch. IV. 5
8 V. TAX LEGISLATION CHANGE On December 22, 2017, the Tax Legislation was signed into law. This legislation included three changes that directly affect the computations of regulatory tax expense and rate base in SCE s Test Year 2018 General Rate Case. Our customers will also see excess accumulated deferred income taxes returned beginning in We have updated the RO model to reflect the following: 1. Change in the federal income tax rate from 35% to 21%. 2. Loss of Internal Revenue Code (IRC) Section 199 manufacturing deduction. 3. New IRC Section 168(k) Bonus Depreciation rules do not apply to public utility property. 4. The return of excess tax reserves on historical normalized tax differences. We have followed the average rate assumption method (ARAM) as prescribed by the Internal Revenue Service (IRS), to return these benefits to customers beginning in As discussed in more detail below, these changes have significant impacts on tax expense and rate base beginning in A. Change in the Federal income tax rate from 35% to 21% Regulatory tax expense is part of a regulated utility s cost of service, and affects the revenue requirement in five distinct ways: 1. Equity return on rate base 2. Debt return on rate base 3. Current year flow-through tax benefits generated and returned to customers 4. Recovery of prior year flow-through tax benefits from customers 5. Deferred income taxes impact on rate base Though most readers may be familiar with the calculations, we provide a brief theoretical overview of each of these factors to illustrate the underlying changes modeled. Table V-4 shows the tax rates and tax gross-up amounts used in the ensuing examples. The tax gross-up is the multiplier required to translate after-tax dollars into pretax revenue requirements. 6
9 Table V-4 Gross-Up Factor Item Old Rate New Rate Federal Tax Rate 35.00% 21.00% State Tax Rate 8.84% 8.84% Combined Tax Rate 43.84% 29.84% Gross Up Equity Return on Rate Base Revenues collected for the return on rate base are taxable. Therefore, to earn a $1,000 return, the utility must collect a grossed up 9 revenue requirement to cover not only the return but the tax expense. The gross-up factor for income taxes is a function of the statutory tax rates. Because the recently enacted federal income tax legislation lowered the income tax rate, the gross-up factor and the related revenue requirement will also be reduced. Prior to the tax legislation, $1,781 needed to be collected from customers to recover $1,000 of return; with the legislation, the former amount drops to $1,425. This is summarized in Table V-5. Table V-5 Equity Return on Rate Base of $1,000 Item Old Rate New Rate Revenue Requirement 1,781 1,425 Tax Rate 43.84% 29.84% Tax Expense/(Benefit) Net Operating Revenue 1,000 1, Debt Return on Rate Base A portion of the return on rate base is for interest expense on long-term debt used to finance the rate base. Although revenues collected for that component of return are taxable, the interest expense is tax deductible. 10 This offsetting tax deduction means that a change to the tax rate does not require a gross-up for the interest component of return on rate base. This category is only affected when rate base changes. 9 The mathematical equation to covert after tax amounts into pretax amounts is the formula 1/(1 minus the statutory tax rate) which under the new rate is 1/( ) = See discussion of Synchronized Interest at Exhibit SCE-09, Volume 2C, Section III.B.1.b.9, page 26. 7
10 Table V-6 Debt Return on Rate Base of $1,000 Item Old Rate New Rate Revenue Requirement 1,000 1,000 Tax Rate 43.84% 29.84% Tax Expense/(Benefit) Interest Deduction (Tax Effected) (438) (298) Net Operating Revenue 1,000 1, Current Year Flow-Through Tax Benefits Flow-through ratemaking (as opposed to normalization) means that accelerated tax deductions reduce customer rates in the same year they are deducted on a tax return. These savings are converted into revenues using the gross-up factor, and reduce the test year revenue requirement. The change in tax rates has two unfavorable effects on revenue requirements. First, the lower tax rate reduces the after-tax benefit of the tax deduction. Second, the lower tax rate, through the gross-up factor, reduces the value of the benefit when converted into the revenue requirement. Table V-7 Current Year Flow-Through Tax Benefit Item Old Rate New Rate Revenue Requirement (1,781) (970) Tax Rate 43.84% 29.84% Tax Expense/(Benefit) (781) (289) Flow-Through Tax (Benefit) (1,000) (681) Net Operating Revenue Prior Year Flow-Through Tax Benefits Flow-through tax benefits are cash timing differences. Customers pay reduced revenues in year 1 as the accelerated tax deductions are realized, but in the subsequent years, as the utility pays higher taxes, customer rates are increased. Mathematically, this works the opposite of category three discussed above. Therefore, the revenue requirement decreases as a result of a lower tax rate. 8
11 Table V-8 Prior Year Flow-Through Tax Benefit Item Old Rate New Rate Revenue Requirement 1, Tax Rate 43.84% 29.84% Tax Expense/(Benefit) Flow-Through Tax (Benefit) 1, Net Operating Revenue Change in Deferred Income Taxes In addition to the direct changes to the revenue requirement arising from a change in tax rates, as discussed above, a reduction to the tax rate also increases rate base. Normalized tax adjustments are a component of rate base. Typically, this results in cash tax savings from an accelerated tax deduction that is repaid over the book life of the depreciable asset. While the utility holds these cash tax savings (accumulated deferred income taxes or ADIT ), rate base is reduced. A reduction in the tax rate reduces the cash tax benefits from future accelerated tax deductions. Therefore, rate base and the corresponding revenue requirement will increase. This change is a direct result of changing the tax rate. Other effects of the newly enacted federal income tax legislation are discussed below. B. Loss of IRC Section 199 Manufacturing Deduction The new income tax legislation eliminates the domestic production activities deduction under IRC Section 199, beginning in This deduction was a permanent tax deduction that the utility claimed on net income derived from generating electricity. The benefit of this deduction was reflected in the utility s cost of service. Its effect was to reduce regulatory income tax expense and lower the revenue requirement. Due to the new legislation, we have removed the calculation of this deduction from our 2018 GRC cost of service estimates. C. New IRC Section 168(k) Bonus Depreciation Rules Exclude Public Utility Property The newly enacted tax legislation implemented new bonus depreciation rates applicable to property acquired after September 27, However, public utility property is specifically excluded from the definition of qualified bonus depreciation property. Therefore, utilities can no longer claim bonus depreciation on assets acquired and placed in service after September 27, The new tax legislation is not clear on what accelerated depreciation rules apply when a public utility asset was acquired under a contract prior to September 27, 2017 but placed in service in 2018 or later. While there is no consensus as yet among utilities or accounting firms on this issue, our position is that bonus depreciation can still be claimed on public utility property in 2018 through 2020 under the 9
12 old bonus depreciation rules, but only for assets acquired under a contract prior to September 27, We reviewed our work-in-progress balances as described below to identify what amounts would still be eligible for bonus depreciation under this interpretation of the law. Our bonus depreciation estimates are reduced due to the new tax legislation, which reduces ADIT and increases rate base. To reflect the expected changes in Bonus Depreciation in the RO model, SCE separated its Construction Work In Progress ( CWIP ) balances and forecast capital expenditures based on the assets acquisition dates. SCE then estimated when the capital expenditures would close to plant in service based on each projects in-service dates. 11 Federal bonus depreciation was adjusted by the ratio of projects remaining eligible for bonus depreciation to the total capital additions. This adjustment resulted in 41%, 30%, and 32% of the capital additions in , respectively, remaining eligible for bonus depreciation. D. Average Rate Assumption Method ( ARAM ) ARAM is a function of the normalization rules as dictated by the IRS. IRC Section 168 defines and allows for the accelerated tax depreciation of fixed assets. Section 168 does not, however, apply to public utility property unless the taxpayer uses a normalized method of accounting. 12 This requirement also applies to the regulator when setting the utility s rates. A normalized method of accounting effectively requires the use of book depreciation when establishing tax cost of service for ratemaking. 13 Any excess tax depreciation must be reserved to reflect the deferral of taxes (i.e., deferred tax expense). The deferral (cash tax savings, accumulated deferred income taxes or ADIT ) is unwound in future years when book depreciation exceeds tax depreciation. With a reduction in tax rates, the future unwinding will not equal the tax benefits as originally reserved. This creates an excess tax reserve See Exhibit SCE-09, Vol. 02, Chapter I pp for SCE s process for forecasting capital. 12 IRC Section 168(f)(2). 13 IRC Section 168(i)(9). 14 Excess tax reserves is defined in Section 13001(d) of the 2017 Tax Cuts and Jobs Act P.L to be the excess of the reserve for deferred income taxes computed at the tax rate in effect the day before the tax rate change (i.e., 35%) over the amount which would be the balance in such reserve if the amount of such reserve were determined by assuming that the corporate rate reductions (i.e., 21%) were in effect for all prior periods. 10
13 A normalized method of accounting shall not be treated as being used with respect to any public utility property for purposes of section 167 or 168 of the Internal Revenue Code of 1986 if the taxpayer, in computing its cost of service for ratemaking purposes and reflecting operating results in its regulated books of account, reduces the excess tax reserve more rapidly or to a greater extent than such reserve would be reduced under the average rate assumption method. 15 The specifics of the ARAM calculation include: 1. Excess tax benefits are only computed when book depreciation exceeds tax depreciation. This analysis is done on an asset-by-asset basis. 2. If book depreciation exceeds tax depreciation on an asset, then ADIT is reversed based on the historical tax rates used to record the original ADIT. In 2018, this is a simple calculation, since the ADIT in the prior years was all recorded at 35%. Beginning in 2019, some assets will have deferred taxes with a mix of 35% and 21%. A ratio is then used to determine the historical ADIT rate. 3. The excess between the historical ADIT amount and the ADIT at the tax rate of 21%, may be returned to customers and reduces the revenue requirement for that year. To estimate ARAM, SCE followed these steps: 1. We relied on data from our tax fixed asset system ( the system ) for the tax basis and ADIT details as of December 31, We then computed tax depreciation on those assets for the period 2018 through Next, we computed the amount of book depreciation as requested in the 2018 GRC which relates to the recovery of 2017 and earlier book vintages. This book depreciation was then input by asset type into the tax fixed asset scenario developed in Step 1, and allocated to all of the assets in that scenario (i.e., a scenario with only pre-2018 book and tax asset base). 3. Then the system identified assets for which book depreciation exceeded tax depreciation and computed the change in ADIT at 35%, instead of the 21% tax rate in effect beginning in The difference in step 3 was returned to customers as the excess tax benefits computed under ARAM in Section 13001(d) of the 2017 Tax Cuts and Jobs Act P.L
14 As ARAM is returned to customers, rate base is increased. This increase mirrors the rate base increase that would have occurred had the deferred taxes been repaid to the IRS at 35%. 6. We then repeated the process for the 2019 and 2020 attrition years. With respect to the steps above, identifying book depreciation related to 2017 and earlier book vintages requires a more detailed description. Depreciation provides a mechanism to recover the original cost of the capital expenditures as well as the future cost to retire those assets over their useful lives. 16 Since ARAM addresses historical excess tax reserves, only the depreciation that relates to the recovery of the original cost of those capital expenditures should be included. The depreciation related to recovering future cost of removal, by its definition, is not a recovery of the original cost basis that gave rise to the historical excess tax reserves from tax accelerated depreciation. The book depreciation that does relate to the recovery of the original cost of the capital expenditures was further reduced to exclude depreciation on assets placed in service beginning in 2018 and later, since the excess reserves result from accelerated tax deductions that existed prior to the tax rate change. These adjustments do not change the cumulative benefits customers will ultimately receive in rates over the remaining book lives of the assets; they only help ensure that the benefits returned in a given year remain consistent with the normalization requirements of ARAM. The estimation of ARAM described above is too complex to embed within our RO model. Therefore, ARAM will not automatically adjust if the Commission adopts levels of cost-of-service expense, book depreciation, or capital expenditures different from SCE s proposals. To the extent the Commission adopts amounts that differ, the calculation steps described above would have to be repeated using the new information, and a new ARAM adjustment included to avoid a normalization violation. ARAM only applies to protected assets, that is, assets to which the IRS normalization rules apply. Over the course of past rate case proceedings, certain timing differences have been and continue to be treated as normalized differences, even though they fall outside of the IRS definition of normalization. 17 Since the normalization requirements do not apply to these adjustments, ARAM does not apply either. However, since these adjustments have been afforded normalization treatment in prior 16 SCE-09 Vol. 02, Chapter II, page 17, Depreciation Expense. 17 The normalization rules are designed to prevent utilities from flowing through certain accelerated tax deductions to customers. Outside of that, each Commission is free to determine ratemaking treatment on the other tax adjustments. Mixed service cost is an example of an unprotected deferred tax liability related to property. 12
15 1 2 rate case decisions, SCE proposes that an ARAM methodology should also be used to return these benefits to customers. 13
16 VI. CHANGES TO WORKING CASH There are four items of cash working capital that are directly impacted by the Tax Legislation: Long Term Incentive Plan (LTIP), 18 Other Accounts Receivable (OAR), 19 Workers Compensation, 20 and Unfunded Pension Reserves. 21 SCE has applied updated tax rates to these forecasts, which are computed net of tax. 22 The composite income tax rate (including state tax benefits) changed from 40.75% to 27.98%, 23 reducing SCE s rate base by $23.4 million in 2018 (Table VI-9, Lines 8-10 and Line 14). Table VI-9 Summary of Cash Working Capital Changes from Tax Legislation Rate Change $000 s Line No. SCE-59 SCE-60 Change Working Cash 1. Income Tax Deferred 34,883 5,815 (29,068) 2. California State Tax 6,400 4,211 (2,189) 3. Federal Income Tax 5,976 5,853 (123) 4. Uncollectibles 1,803 1,738 (66) 5. Franchise Requirements (36,970) (35,624) 1, Unchanged Lead Lag requirements 384, , Total Lead-Lag Working Cash Requirement 396, ,748 (30,100) 8. Other Accounts Receivable (OAR) 82,027 73,323 (8,704) 9. Workers' Compensation (56,383) (61,680) (5,297) 10. Long-Term Incentive Plan (LTIP) (4,315) (5,244) (929) 11. Unchanged Operational Cash Requirement (66,311) (66,311) Total Operational Cash Requirement (44,982) (59,912) (14,930) 13. Total Working Cash Requirement 351, ,836 (45,030) 14. Unfunded Pension Reserves (76,201) (84,631) (8,429) 15. Total Changes in Rate Base 275, ,205 (53,460) 18 See SCE-09, Vol. 2, Ch. IV, p. 57, lines (LTIP). 19 See SCE-09, Vol. 2, Ch. IV, p. 56, lines 22-23; p. 58, lines 2-10 (OAR). 20 See SCE-09, Vol. 2, Ch. IV, p. 61, lines 4-8 (Workers Compensation). The tax rate for workers compensation is updated dynamically in the RO Model. 21 See SCE-09, Vol. 2, Ch. IV, p. 86, lines 5-8 (Unfunded Pension Reserve). 22 The tax rate is updated in workpapers and the results are inputs to the RO Model. 23 The composite income tax rate used in working cash includes state tax benefits, whereas the composite income tax rate (excluding state tax benefits) changed from 43.84% to 29.84%. 14
17 There are also five items in the lead-lag working cash requirement that have corollary impacts from the Tax Legislation: Franchise Requirement GRC, Uncollectibles GRC, Federal Income Tax, Income Tax Deferred, and CA State Corporation Franchise Tax. Because the Tax Legislation income tax rate change affects the GRC Operating Expense forecast for these items, there is a corollary impact to the lead-lag working cash requirement. The lead-lag days to compute the working cash requirement did not change, but these impacts result in a rate base reduction of $30.1 million in 2018 (Table VI-9 Lines 1-5). 15
18 VII. ADDED FACILITIES AND OTHER OPERATING REVENUE FORECAST SCE s revenue requirement recovers the costs of owning, operating, and maintaining standard facilities. Customers may request facilities in addition to, or in substitution for, the standard facilities that SCE would normally install. SCE may accommodate these requests by building such additional facilities, which are called Added Facilities. Customers are charged for the cost of these additional facilities through Added Facilities rates. In SCE-09, Volume 1, SCE proposed 2018 Added Facilities Rates, which were updated in SCE-59 to account for the 2018 Cost of Capital Decision (D.) SCE has updated its Added Facilities rates to account for the impact of the Tax Legislation. Table VII-10 below provides SCE s revised Added Facilities Rate Components which reflect both the 2018 authorized Cost of Capital and Tax Legislation changes. Table VII-10 Added Facilities Rate Components 2018 GRC Tax Reform SCE Financed Customer Financed Replacement for 20 Years at No Additional Cost Replacement (Perpetuity) at No Additional Cost Replacement for 20 Years at No Additional Cost Replacement (Perpetuity) at No Additional Cost Replacement at Additional Cost Replacement at Additional Cost Line Rate (%) (%) (%) (%) (%) (%) No. Components (1) (2) (3) (4) (5) (6) 1 Overhead: A&G, Ad Val., & Ins. 3 4 Return, Depreciation, 5 and Income Taxes Replacement: Total Average O&M Annual Monthly One-Time- 16 Payment Factor Added facilities revenues are recorded in Other Operating Revenue (OOR) FERC Accounts 454 and 456. The revised Added Facilities Rate Components, as shown in Table VII-10, reduces SCE s OOR 16
19 1 2 3 forecast by $4.277 million in In developing each year s revenue requirement, the OOR forecast is subtracted from the total O&M forecast. Therefore, the reduced OOR forecast results in an incremental increase in the revenue requirement in each year. 24 See workpapers provided in Appendix A, which provide support for the underlying calculations. 17
20 VIII. RATEMAKING CONSIDERATIONS SCE s Test Year 2018 revenue requirement request is now $106 million lower than our currently authorized 2017 revenue requirement. Our request also reflects proposed PTYR increases of $431 million in 2019 and $503 million in SCE established a 2018 GRC Revenue Requirement Memorandum Account (GRC RRMA) to determine and track the change in the revenue requirement adopted in this proceeding from January 1, 2018 to the effective date of the final GRC decision. 25 Assuming that the revenue requirements the Commission ultimately adopts follow a similar trend as the revenue requirements currently proposed by SCE (i.e., lower revenue requirement in 2018 as compared to 2017, with PTYR increases in 2019 and 2020), then if SCE reflects the entire GRC RRMA balance in rates on January 1, 2019, customers should see a modest rate change in 2019 followed by a large rate increase in There will be an increase in the GRC revenue requirement in 2019, since the 2018 adopted test year revenue requirement is expected to be materially lower than the 2017 currently authorized revenue requirement. But the PTYR 2019 adopted revenue requirement is expected to be substantially higher than the 2018 adopted revenue requirement, and the 2019 rates would reflect the net effect of these two changes. This would be followed by a potentially substantial rate increase in 2020 due to the PTYR 2020 adopted revenue requirement. Moreover, SCE and other California investor-owned utilities are at a juncture where multiple factors that significantly affect rates are simultaneously coming into play. The Tax Legislation changes have the net effect of reducing revenue requirements, as reflected in the updated RO model analysis shown in Table IV-2. At the same time, SCE has incurred and continues to incur extraordinary costs to restore service and repair, replace, or restore damaged or destroyed facilities and infrastructure due to the December 2017 wildfires and January 2018 mudslides. Additionally, we anticipate increasing costs in the future to carry out fire mitigation strategies, grid hardening, event response, and recovery activities to address the increasing risks associated with climate change and wildfires. Though the magnitude of these incremental costs is not known at this time, it is expected to be substantial. 25 Advice 3719-E was filed on December 21, 2017 and approved by the Energy Division on January 16, 2018 with an effective date of January 1,
21 As the Commission decides how to implement the tax law changes into rates, SCE proposes consideration of the impact of these factors on customer bill volatility, and suggests two potential rate making options. In a manner similar to the two-year amortization of the GRC RRMA balance the Commission adopted in the 2015 GRC, 26 SCE proposes the 2018 GRC RRMA balance be amortized over 2019 and This benefits customers by promoting some degree of rate stabilization over this two-year period. If SCE s updated revenue requirement is adopted and reflected in rates starting on January 1, 2019, and the Commission adopts a two-year amortization of the 2018 GRC RRMA, it would amount to no change in 2018 followed by a $272 million increase in 2019 and a $503 million increase in The Commission might also consider setting aside the reductions in revenue requirement associated with the Tax Legislation in a new balancing account to be used for specific wildfire-related risk mitigation activities. If the Commission agrees to such a mechanism, SCE will work closely with Commission staff to facilitate the review of these costs annually, and include the net effects of the tax benefits and the offsetting wildfire-related costs in SCE s year-end consolidated revenue requirement and rate change advice filing. 26 D , Ordering Paragraph (OP) A one-year amortization of the GRC RRMA in 2019 would amount to no change in 2018, followed by a $219 million increase in 2019 and a $609 million increase in Please refer to the workpapers provided in Appendix A, which provide support for the underlying calculations. 19
22 Appendix A
23 EXHIBIT SCE-60 CHAPTER IV RESULTS OF OPERATIONS A-1
24 AUTHORIZED BASE REVENUE REQUIREMENT (ABRR) AND REVENUE CHANGES A-2
25 SOUTHERN CALIFORNIA EDISON COMPANY Table V-3, SCE , 2019, and 2020 Revenue Changes Resulting From The 2018 Test Year and 2019 & 2020 PTYR GRC Request (thousands of dollars) ABRR and Revenue Change Including the Impact of Previously Approved and Forecasted ABRR Changes: Cumulative SCE-9 Vol. 1 Reference 1. Proposed GRC Base Revenue Requirement 5,534,406 5,965,179 6,468,180 SCE-60, Table II-1 2. Estimated Present (Prior Year) Revenue Requirement 5,640,432 5,534,406 5,965,179 For 2018, AL 3514-E 3. GRC ABRR Change (106,026) 430, , Less: GRC Revenue Growth GWhs GRC PRR 84,253 5,309,377 Table VI GRC PRR 83,572 5,266,462 Table VI GRC PRR 83,572 5,266,462 Table VI GRC PRR 83,470 5,260,034 Table VI GRC PRR 83,470 5,260,034 Table VI GRC PRR 82,567 5,203,130 Table VI GRC Revenue Growth (42,915) (6,428) (56,904) 12. Residential Rate OIR Implementation MA 18,854 (18,854) SCE-59, CH IV, plus FF&U 13. SmartConnect Opt Out BA 11,457 (11,457) SCE-59, CH IV, plus FF&U Bark Beetle CEMA 10,675 (10,675) SCE-12, Table VI-3 + FF&U 15. Residential Service Disconnection MA 27 (27) Table IV-16 plus FF&U 16. Energy Data Request Program MA 458 (458) SCE-59, CH IV, plus FF&U 17. Subtotal - Balancing/Memo Account Recovery 41,471 (41,471) GRC Revenue Change (Line 3 - Line 11 + Line 17) (21,640) 395, , , Percent GRC Revenue Change -0.38% 7.15% 9.39% 16.15% 20. Total System PRR 11,417,570 11,393,715 11,277,777 Table VI GRC Revenue Change (21,640) (21,640) Line 18 (2018) 22. GRC Revenue Change ,730 Line 18 (2019) 23. Total System PRR with GRC Revenue Changes 11,417,570 11,372,075 11,651,866 Line 20 + Line 21 + Line Percent Total Revenue Change -0.19% 3.48% 4.81% 8.10% Line 18 / Line 23 A-3
26 TOTAL COMPANY SUMMARY OF EARNINGS AT PROPOSED RATES (EXCLUDES RATE BASE ADJUSTMENT) 2015 THROUGH 2020 A-4
27 SOUTHERN CALIFORNIA EDISON TEST YEAR 2018 GENERAL RATE CASE SUMMARY OF EARNINGS ESTIMATED REVENUE REQUIREMENTS (Thousands of Dollars) Line Recorded Forecast Forecast Forecast Forecast Forecast No. Description Operating Revenues 2. Electric Revenues 6,080,010 6,236,137 6,606,304 6,523,217 7,015,159 7,590, Operating Expenses 4. Escalation 0 32,409 69, , , , Generation - Steam 7,338 7,444 7,124 7,845 7,845 7, Generation - Nuclear 79,681 76,747 76,747 76,747 76,747 76, Generation - Hydro 43,827 45,444 42,445 41,446 41,446 41, Generation - Other 78,825 80,993 79,346 81,965 81,965 81, Transmission 160, , , , , , Distribution 527, , , , , , Customer Accounts 165, , , , , , Customer Service and Information 23,327 20,638 21,074 21,007 21,007 21, Total O&M Expenses 1,086,465 1,127,053 1,154,782 1,211,040 1,265,039 1,317, Administrative and General 860, , , , , , Total A&G Expenses 860, , , , , , Revenue Credits 214, , , , , , Other Uncollectibles 11,755 14,842 15,723 14,090 15,153 16, Franchise Requirements 50,763 56,718 60,084 59,648 64,147 69, Subtotal 1,794,805 1,833,830 1,845,880 1,772,252 1,823,564 1,876,953 A-5
28 SOUTHERN CALIFORNIA EDISON TEST YEAR 2018 GENERAL RATE CASE SUMMARY OF EARNINGS (Continued) ESTIMATED REVENUE REQUIREMENTS (Thousands of Dollars) Line Recorded Forecast Forecast Forecast Forecast Forecast No. Description Depreciation - System 1,653,598 1,750,011 1,853,858 2,008,270 2,144,517 2,342, Taxes Other Than On Income - System 336, , , , , , Taxes Based On Income - System 326, , , , , , Total Taxes - System 663, , , , , , Total Operating Expenses - System 4,111,562 4,269,251 4,471,104 4,327,153 4,617,482 4,988, Net Operating Revenue - System 1,968,448 1,966,887 2,135,200 2,196,064 2,397,677 2,602, Rate Base - System (Average)-System 22,568,645 24,897,303 27,027,849 28,860,641 31,510,235 34,204, Rate of Return-System 8.72% 7.90% 7.90% 7.61% 7.61% 7.61% A-6
29 SOUTHERN CALIFORNIA EDISON TEST YEAR 2018 GENERAL RATE CASE TAXES - OTHER ESTIMATED REVENUE REQUIREMENTS (Thousands of Dollars) Line Recorded Forecast Forecast Forecast Forecast Forecast No. Description Ad Valorem Taxes 2. Ad Valorem Taxes 262, , , , , , Total Ad Valorem Taxes 262, , , , , , Payroll Taxes 5. Federal Insurance Contribution Act (FICA) 66,100 64,872 66,769 62,916 64,997 67, Federal Unemployment Tax Act State Unemployment Tax Act 3,831 3,693 3,633 3,334 3,335 3, Total Payroll Taxes 70,296 68,917 70,749 66,568 68,650 71, Misc. Taxes 10. Federal - All Other 4,145 4,566 4,699 4,842 4,994 5, Total Miscellaneous Taxes 4,145 4,566 4,699 4,842 4,994 5, ITC Amortization on CTC Property (613) (613) (612) (594) (583) (571) 13. ARAM Expense on CTC Property Total Taxes Other Than Income 336, , , , , ,016 A-7
30 SOUTHERN CALIFORNIA EDISON TEST YEAR 2018 GENERAL RATE CASE INCOME TAX ADJUSTMENTS ESTIMATED REVENUE REQUIREMENTS (Thousands of Dollars) Line Recorded Forecast Forecast Forecast Forecast Forecast No. Description California Income Tax Adjustments 2. Tax Depreciation 1,447,676 1,561,462 1,598,288 1,678,443 1,733,478 1,862, Interest On Long-Term Debt 532, , , , , , Interest On Accumulated Deferred ITC (2,805) (2,506) (2,284) (1,878) (1,693) (1,515) 5. Uniform Capitalization 130, , , , , , Capitalized Software 10,319 26,126 42,287 51,477 43,706 24, Ad Valorem Lien Date Adjustment 8,226 7,196 13,506 8,547 13,536 14, Removal Costs 524, , , , , , Amortization of Land Rights Salvage Warehouse Expense CIAC Revenues (186,558) (198,876) (219,968) (277,047) (291,320) (294,914) 12. Non Deductible Meals (2,060) (2,070) (2,132) (2,102) (2,172) (2,217) 13. Excess Compensation 3,291 3,398 3,489 3,587 3,691 3, ESOP Dividends Leased Vehicles Repair Deduction 977, ,473 1,025,107 1,038,414 1,056,033 1,085, Total CCFT Adjustments 3,442,962 3,504,197 3,662,118 3,881,513 4,007,576 4,196,111 A-8
31 SOUTHERN CALIFORNIA EDISON TEST YEAR 2018 GENERAL RATE CASE INCOME TAX ADJUSTMENTS ESTIMATED REVENUE REQUIREMENTS (Thousands of Dollars) Line Recorded Forecast Forecast Forecast Forecast Forecast No. Description Federal Income Tax Adjustments 2. Tax Depreciation 2,149,543 2,000,105 1,990,325 1,566,244 1,577,224 1,616, Interest On Long-Term Debt 532, , , , , , Uniform Capitalization 130, , , , , , Capitalized Software 10,319 26,126 42,287 51,477 43,706 24, Ad Valorem Lien Date Adjustment 8,226 7,196 13,506 8,547 13,536 14, Repair Deduction 977, ,473 1,025,107 1,038,414 1,056,033 1,085, Removal Costs 524, , , , , , Amortization of Land Rights Salvage Warehouse Expense CIAC Revenues (185,136) (197,454) (218,658) (276,006) (290,636) (294,575) 12. Non Deductible Meals (2,060) (2,070) (2,132) (2,102) (2,172) (2,217) 13. Leased Vehicles ESOP Dividends Preferred Dividend Deduction ,348 1,348 1, Section 199 Manufacturer's Deduction 0 5,278 16, Medicare D Total FIT Adjustments 4,149,055 3,952,856 4,075,145 3,773,581 3,855,047 3,953,143 A-9
32 SOUTHERN CALIFORNIA EDISON TEST YEAR 2018 GENERAL RATE CASE ESTIMATED REVENUE REQUIREMENTS TAXES - INCOME ($000) Line Recorded Forecast Forecast Forecast Forecast Forecast No. Description California Corporation Franchise Tax 2. Operating Revenues 6,080,010 6,236,137 6,606,304 6,523,217 7,015,159 7,590, Operating Expenses 1,794,805 1,833,830 1,845,880 1,772,252 1,823,564 1,876, Taxes Other Than Income 336, , , , , , Subtotal Expenses 2,131,593 2,185,083 2,219,803 2,164,206 2,239,849 2,323, Income Tax Adjustments 3,442,962 3,504,197 3,662,118 3,881,513 4,007,576 4,196, California Taxable Income 505, , , , ,734 1,070, CCFT Tax Rate % % % % % % 9. CCFT 44,682 48,342 64,035 42,211 67,868 94, California Alternate Minimum Tax Arizona Income Tax Rate % % % % % % 12. New Mexico Income Tax Rate % % % % % % 13. Arizona Income Tax New Mexico Income Tax Total Other State State Income Taxes Total State Income Taxes 44,818 48,490 64,230 42,211 67,868 94,642 A-10
33 SOUTHERN CALIFORNIA EDISON TEST YEAR 2018 GENERAL RATE CASE ESTIMATED REVENUE REQUIREMENTS TAXES - INCOME ($000) Line Recorded Forecast Forecast Forecast Forecast Forecast No. Description Federal Income Tax 2. Operating Revenues 6,080,010 6,236,137 6,606,304 6,523,217 7,015,159 7,590, Operating Expenses 1,794,805 1,833,830 1,845,880 1,772,252 1,823,564 1,876, Taxes Other Than Income 336, , , , , , Total State Income Taxes 44,818 48,490 64,230 42,211 67,868 94, Less: Current Year's CCFT 44,682 48,342 64,035 42,211 67,868 94, Plus: Prior Year's CCFT 83,455 44,682 48,342 64,035 42,211 67, Subtotal - Expenses 2,215,184 2,229,913 2,268,340 2,228,241 2,282,060 2,391, Income Tax Adjustments (Sch M) 4,149,055 3,952,856 4,075,145 3,773,581 3,855,047 3,953, Federal Taxable Income (284,229) 53, , , ,052 1,245, FIT Tax Rate 35% 35% 35% 21% 21% 21% 12. Federal Income Tax (99,480) 18,679 91, , , , Federal Alternative Income Tax Taxes Deferred-current (Plant) 408, , ,372 47,152 35,036 21, Taxes Deferred-current (AFUDC Debt) Taxes Deferred-current (Cap. Int.) Contributions in Aid of Construction (20,632) (20,980) (22,884) (41,205) (45,756) (48,427) 18. Investment Tax Credit Amortization (7,968) (9,878) (9,685) (9,791) (9,456) (9,098) 19. Accrued Vacation 1,342 1,385 1,422 6,816 1,033 1, Total Federal Income Taxes 281, , , , , , Total Taxes-Income (State and Fed) 326, , , , , ,384 A-11
34 SOUTHERN CALIFORNIA EDISON TEST YEAR 2018 GENERAL RATE CASE DEPRECIATION EXPENSE ESTIMATED REVENUE REQUIREMENTS (Thousands of Dollars) Line Recorded Forecast Forecast Forecast Forecast Forecast No. Description Depreciation Expense 1,653,598 1,750,011 1,853,858 2,008,270 2,144,517 2,342,650 A-12
35 SOUTHERN CALIFORNIA EDISON TEST YEAR 2018 GENERAL RATE CASE WEIGHTED AVERAGE RATE BASE ESTIMATED REVENUE REQUIREMENTS (Thousands of Dollars) Line Recorded Forecast Forecast Forecast Forecast Forecast No. Description Fixed Capital 2. Plant in Service (Avg.) 38,342,620 40,832,678 43,743,307 46,537,145 49,818,535 53,123, Capitalized Software (Avg.) 1,518,581 1,434,610 1,358,394 1,209,818 1,261,255 1,589, Intangibles (Avg.) 196, , , , , , Property Held for Future Use (Avg.) Total Fixed Capital (Avg.) 40,057,476 42,479,255 45,324,604 47,973,921 51,316,486 54,951, Adjustments 8. Customer Advance for Construction (Avg.) (69,490) (69,089) (67,745) (72,308) (79,137) (84,762) 9. Total Adjustments (Avg.) (69,490) (69,089) (67,745) (72,308) (79,137) (84,762) 10. Working Capital 11. Materials and Supplies (Avg) 190, , , , , , Mountainview Emission Credits (Avg) 6,774 6,106 5,468 4,861 4,284 3, Working Cash (Avg.) 356, , , , , , Total Working Capital (Avg.) 553, , , , , , Total Before Deductions for Reserves (Avg) 40,541,718 42,947,186 45,811,860 48,440,275 51,831,442 55,523,192 A-13
36 SOUTHERN CALIFORNIA EDISON TEST YEAR 2018 GENERAL RATE CASE WEIGHTED AVERAGE RATE BASE (Continued) ESTIMATED REVENUE REQUIREMENTS (Thousands of Dollars) Line Recorded Forecast Forecast Forecast Forecast Forecast No. Description Deductions for Reserves 17. Depreciation Reserve (Avg) (12,145,461) (12,016,424) (12,561,022) (13,175,659) (13,873,335) (14,721,079) 18. Accum. Amort. - Capitalized Software (Avg.) (984,700) (883,979) (753,411) (666,900) (665,848) (801,957) 19. Accum. Taxes Def. - Plant ( Avg.) (4,891,503) (5,201,910) (5,527,655) (5,787,010) (5,830,383) (5,861,230) 20. Accum. Def. Taxes for Uniform Capitalization Accum. Taxes Def. - CIAC (Avg.) 99, , , , , , Accrued Vacation (Avg) 20,236 18,873 17,469 13,350 9,425 8, Unfunded Pension Reserve (Avg.) (71,129) (71,342) (73,401) (84,631) (96,799) (98,622) 24. Total Deductions for Reserves ( Avg.) (17,973,074) (18,049,883) (18,784,011) (19,579,634) (20,321,208) (21,318,739) 25. Total Rate Base (Avg) 22,568,645 24,897,303 27,027,849 28,860,641 31,510,235 34,204,454 A-14
37 SOUTHERN CALIFORNIA EDISON TEST YEAR 2018 GENERAL RATE CASE N-T-G MULTIPLIER ESTIMATED REVENUE REQUIREMENTS Line Recorded Forecast Forecast Forecast Forecast Forecast No. Description Revenues Uncollectibles Tax Rate Uncollectibles Amount Applied Subtotal Franchise Fees Tax Rate Franchise Fees Amount Applied Subtotal Arizona/New Mexico/D.C. Income Tax Rates Other State I.T. Amount Applied Subtotal S. I. T. Rate S. I. T. Amount Applied Subtotal Federal Income Tax Federal Income Tax Amount Applied Net Operating Revenues Uncollectible and Franchise Fees Factor N-T-G MULTIPLIER A-15
38 SOUTHERN CALIFORNIA EDISON TEST YEAR 2018 GENERAL RATE CASE RATE OF RETURN ESTIMATED REVENUE REQUIREMENTS Line Recorded Forecast Forecast Forecast Forecast Forecast No. Description Cost Factor 2. Long-Term Debt 5.49% 5.49% 5.49% 4.98% 4.98% 4.98% 3. Preferred Stock 5.79% 5.79% 5.79% 5.82% 5.82% 5.82% 4. Equity 10.45% 10.45% 10.45% 10.30% 10.30% 10.30% 5. Capitalization Ratios 6. Long-Term Debt 43.00% 43.00% 43.00% 43.00% 43.00% 43.00% 7. Preferred Stock 9.00% 9.00% 9.00% 9.00% 9.00% 9.00% 8. Equity 48.00% 48.00% 48.00% 48.00% 48.00% 48.00% 9. Weighted Cost 10. Long-Term Debt 2.36% 2.36% 2.36% 2.14% 2.14% 2.14% 11. Preferred Stock 0.52% 0.52% 0.52% 0.52% 0.52% 0.52% 12. Equity 5.02% 5.02% 5.02% 4.94% 4.94% 4.94% 13. Return on Rate Base 7.90% 7.90% 7.90% 7.61% 7.61% 7.61% A-16
39 SUMMARY OF ELECTRIC RATE BASE (EXCLUDES RATE BASE ADJUSTMENT) A-17
40 Southern California Edison Summary of Electric Rate Base - Total Company Nominal $ in Thousands Total Company Rate Base Recorded Forecast Line Item Fixed Capital 1 Plant in Service 38,342,620 40,832,678 43,743,307 46,537,145 49,818,535 53,123,446 2 Capitalized Software 1,518,581 1,434,610 1,358,394 1,209,818 1,261,255 1,589,016 3 Other Intangibles 196, , , , , ,797 4 Total Fixed Capital 40,057,476 42,479,255 45,324,604 47,973,921 51,316,486 54,951,259 Adjustments 5 Customer Advances for Construction (69,490) (69,089) (67,745) (72,308) (79,137) (84,762) 6 Customer Deposits Total Adjustments (69,490) (69,089) (67,745) (72,308) (79,137) (84,762) Working Capital 8 Materials & Supplies 190, , , , , ,438 9 Mountainview Emission Credits 6,774 6,106 5,468 4,861 4,284 3, Working Cash 356, , , , , , Total Working Capital 553, , , , , ,695 Reserves 12 Accumulated Depreciation Reserve (12,145,461) (12,016,424) (12,561,022) (13,175,659) (13,873,335) (14,721,079) 13 Accumulated Amortization (984,700) (883,979) (753,411) (666,900) (665,848) (801,957) 14 Accum. Def. Taxes - Plant (4,891,503) (5,201,910) (5,527,655) (5,787,010) (5,830,383) (5,861,230) 15 Accum. Def. Taxes - Uniform Capitalization Accum. Def. Taxes - CIAC 99, , , , , , Accum. Def. Taxes - Vaca ion Accrual 20,236 18,873 17,469 13,350 9,425 8, Unfunded Pension Reserve (71,129) (71,342) (73,401) (84,631) (96,799) (98,622) 19 Total Deductions for Reserves (17,973,074) (18,049,883) (18,784,011) (19,579,634) (20,321,208) (21,318,739) 20 Rate Base 22,568,645 24,897,303 27,027,849 28,860,641 31,510,235 34,204, Depreciation and Amortization 1,653,598 1,750,011 1,853,858 2,008,270 2,144,517 2,342,650 A-18
41 Southern California Edison Summary of Electric Rate Base - CPUC Nominal $ in Thousands CPUC Rate Base Recorded Forecast Line Item Fixed Capital 1 Plant in Service 30,829,338 32,872,349 35,199,552 37,503,632 40,162,597 42,814,546 2 Capitalized Software 1,422,803 1,344,128 1,272,719 1,133,514 1,181,706 1,488,795 3 Other Intangibles 183, , , , , ,736 4 Total Fixed Capital 32,436,037 34,415,075 36,681,115 38,849,789 41,566,071 44,527,078 Adjustments 5 Customer Advances for Construction (69,490) (69,089) (67,745) (72,308) (79,137) (84,762) 6 Customer Deposits Total Adjustments (69,490) (69,089) (67,745) (72,308) (79,137) (84,762) Working Capital 8 Materials & Supplies 178, , , , , ,643 9 Mountainview Emission Credits 6,774 6,106 5,468 4,861 4,284 3, Working Cash 333, , , , , , Total Working Capital 519, , , , , ,512 Reserves 12 Accumulated Depreciation Reserve (10,720,526) (10,570,393) (10,963,163) (11,427,048) (11,965,497) (12,634,848) 13 Accumulated Amortization (922,594) (828,226) (705,892) (624,838) (623,853) (751,377) 14 Accum. Def. Taxes - Plant (3,595,222) (3,740,155) (3,917,255) (4,058,039) (4,051,416) (4,033,443) 15 Accum. Def. Taxes - Capitalized Interest Accum. Def. Taxes - CIAC 99, , , , , , Accum. Def. Taxes - Vaca ion Accrual 18,960 17,683 16,367 12,508 8,831 7, Unfunded Pension Reserve (66,643) (66,842) (68,772) (79,293) (90,694) (92,402) 19 Total Deductions for Reserves (15,186,542) (15,083,035) (15,524,706) (16,055,494) (16,586,897) (17,348,449) 20 Rate Base 17,699,240 19,766,486 21,609,006 23,226,981 25,456,930 27,709, Depreciation and Amortization 1,436,643 1,520,200 1,608,803 1,752,338 1,872,039 2,048,898 A-19
42 Southern California Edison Summary of Electric Rate Base - FERC Nominal $ in Thousands FERC Rate Base Recorded Forecast Line Item Fixed Capital 1 Plant in Service 7,513,282 7,960,329 8,543,755 9,033,513 9,655,938 10,308,900 2 Capitalized Software 95,778 90,482 85,675 76,304 79, ,220 3 Other Intangibles 12,379 13,369 14,059 14,314 14,929 15,061 4 Total Fixed Capital 7,621,439 8,064,180 8,643,488 9,124,132 9,750,415 10,424,182 Adjustments 5 Customer Advances for Construction Customer Deposits Total Adjustments Working Capital 8 Materials & Supplies 12, ,384 13,175 14,315 15,311 15,795 9 Mountainview Emission Credits Working Cash 22,463 21,101 21,485 19,352 21,889 25, Total Working Capital 34,497 33,485 34,659 33,667 37,200 41,183 Reserves 12 Accumulated Depreciation Reserve (1,424,935) (1,446,031) (1,597,859) (1,748,611) (1,907,838) (2,086,231) 13 Accumulated Amortization (62,106) (55,753) (47,518) (42,062) (41,996) (50,580) 14 Accum. Def. Taxes - Plant (1,296,281) (1,461,755) (1,610,400) (1,728,971) (1,778,967) (1,827,787) 15 Accum. Def. Taxes - Capitalized Interest Accum. Def. Taxes - CIAC Accum. Def. Taxes - Vaca ion Accrual 1,276 1,190 1, Unfunded Pension Reserve (4,486) (4,500) (4,629) (5,338) (6,105) (6,220) 19 Total Deductions for Reserves (2,786,532) (2,966,848) (3,259,304) (3,524,140) (3,734,311) (3,970,290) 20 Rate Base 4,869,404 5,130,816 5,418,844 5,633,659 6,053,304 6,495, Depreciation and Amortization 216, , , , , ,752 A-20
43 TOTAL COMPANY SUMMARY OF EARNINGS AT PRESENT RATES 2015 THROUGH 2020 A-21
44 SOUTHERN CALIFORNIA EDISON TEST YEAR 2018 GENERAL RATE CASE N-T-G MULTIPLIER ESTIMATED REVENUE REQUIREMENTS AT AUTHORIZED BASE REVENUE REQUIREMENT Line Recorded Forecast Forecast Forecast Forecast Forecast No. Description Revenues Uncollectibles Tax Rate Uncollectibles Amount Applied Uncollectibles Juris Subtotal Franchise Fees Tax Rate Franchise Fees Amount Applied Franchise Fees Juris Subtotal Arizona/New Mexico/D.C. Income Tax Rates Other State I.T. Amount Applied Other State I.T. Juris Subtotal S. I. T. Rate S. I. T. Amount Applied S. I. T. Juris Subtotal Federal Income Tax Federal Income Tax Amount Applied Federal Income Tax Juris Net Operating Revenues Uncollectible and Franchise Fees Factor N-T-G MULTIPLIER A-22
45 SOUTHERN CALIFORNIA EDISON TEST YEAR 2018 GENERAL RATE CASE RATE OF RETURN ESTIMATED REVENUE REQUIREMENTS AT AUTHORIZED BASE REVENUE REQUIREMENT Line Recorded Forecast Forecast Forecast Forecast Forecast No. Description Cost Factor 2. Long-Term Debt 5.49% 5.49% 5.49% 4.98% 4.98% 4.98% 3. Preferred Stock 5.79% 5.79% 5.79% 5.82% 5.82% 5.82% 4. Equity 10.45% 10.45% 10.45% 10.30% 10.30% 10.30% 5. Capitalization Ratios 6. Long-Term Debt 43.00% 43.00% 43.00% 43.00% 43.00% 43.00% 7. Preferred Stock 9.00% 9.00% 9.00% 9.00% 9.00% 9.00% 8. Equity 48.00% 48.00% 48.00% 48.00% 48.00% 48.00% 9. Weighted Cost 10. Long-Term Debt 2.36% 2.36% 2.36% 2.14% 2.14% 2.14% 11. Preferred Stock 0.52% 0.52% 0.52% 0.52% 0.52% 0.52% 12. Equity 5.02% 5.02% 5.02% 4.94% 4.94% 4.94% 13. Return on Rate Base 7.90% 7.90% 7.90% 7.61% 7.61% 7.61% A-23
46 SOUTHERN CALIFORNIA EDISON TEST YEAR 2018 GENERAL RATE CASE TAXES - OTHER ESTIMATED REVENUE REQUIREMENTS AT AUTHORIZED BASE REVENUE REQUIREMENT (Thousands of Dollars) Line Recorded Forecast Forecast Forecast Forecast Forecast No. Description Ad Valorem Taxes 2. Ad Valorem Taxes 262, , , , , , Total Ad Valorem Taxes 262, , , , , , Payroll Taxes 5. Federal Insurance Contr bution Act (FICA) 66,100 64,872 66,769 62,916 64,997 67, Federal Unemployment Tax Act State Unemployment Tax Act 3,831 3,693 3,633 3,334 3,335 3, Total Payroll Taxes 70,296 68,917 70,749 66,568 68,650 71, Misc. Taxes 10. Federal - All Other 4,145 4,566 4,699 4,842 4,994 5, Total Miscellaneous Taxes 4,145 4,566 4,699 4,842 4,994 5, ITC Amortization on CTC Property (613) (613) (612) (594) (583) (571) 13. ARAM Expense on CTC Property Total Taxes Other Than Income 336, , , , , ,016 A-24
47 SOUTHERN CALIFORNIA EDISON TEST YEAR 2018 GENERAL RATE CASE INCOME TAX ADJUSTMENTS ESTIMATED REVENUE REQUIREMENTS AT AUTHORIZED BASE REVENUE REQUIREMENT (Thousands of Dollars) Line Recorded Forecast Forecast Forecast Forecast Forecast No. Description California Income Tax Adjustments 2. Tax Depreciation 1,447,676 1,561,462 1,598,288 1,678,443 1,733,478 1,862, Interest On Long-Term Debt 532, , , , , , Interest On Accumulated Deferred ITC (2,805) (2,506) (2,284) (1,878) (1,693) (1,515) 5. Uniform Capitalization 130, , , , , , Capitalized Software 10,319 26,126 42,287 51,477 43,706 24, Ad Valorem Lien Date Adjustment 8,226 7,196 13,506 8,547 13,536 14, Percentage Repair Allowance Removal Costs 524, , , , , , Amortization of Land Rights Salvage Warehouse Expense CIAC Revenues (186,558) (198,876) (219,968) (277,047) (291,320) (294,914) 13. Non Deduct ble Meals (2,060) (2,070) (2,132) (2,102) (2,172) (2,217) 14. Excess Compensation 3,291 3,398 3,489 3,587 3,691 3, ESOP Dividends Leased Vehicles Total CCFT Adjustments 3,442,962 3,504,197 3,662,118 3,881,513 4,007,576 4,196,111 A-25
48 SOUTHERN CALIFORNIA EDISON TEST YEAR 2018 GENERAL RATE CASE INCOME TAX ADJUSTMENTS ESTIMATED REVENUE REQUIREMENTS AT AUTHORIZED BASE REVENUE REQUIREMENT (Thousands of Dollars) Line Recorded Forecast Forecast Forecast Forecast Forecast No. Description Federal Income Tax Adjustments 2. Tax Depreciation 2,149,543 2,000,105 1,990,325 1,566,244 1,577,224 1,616, Interest On Long-Term Debt 532, , , , , , Uniform Capitalization 130, , , , , , Capitalized Software 10,319 26,126 42,287 51,477 43,706 24, Ad Valorem Lien Date Adjustment 8,226 7,196 13,506 8,547 13,536 14, Percentage Repair Allowance Repair Deduction 977, ,473 1,025,107 1,038,414 1,056,033 1,085, Removal Costs 524, , , , , , Amortization of Land Rights Salvage Warehouse Expense CIAC Revenues (185,136) (197,454) (218,658) (276,006) (290,636) (294,575) 13. Non Deduct ble Meals (2,060) (2,070) (2,132) (2,102) (2,172) (2,217) 14. Excess Compensation 3,291 3,398 3,489 3,587 3,691 3, Leased Vehicles ESOP Dividends Preferred Dividend Deduction ,348 1,348 1, Section 199 Manufacturer's Deduction 0 5,278 16, Medicare D Total FIT Adjustments 4,149,055 3,952,856 4,075,145 3,773,581 3,855,047 3,953,143 A-26
49 SOUTHERN CALIFORNIA EDISON TEST YEAR 2018 GENERAL RATE CASE ESTIMATED REVENUE REQUIREMENTS AT AUTHORIZED BASE REVENUE REQUIREMENT TAXES - INCOME ($000) Line Recorded Forecast Forecast Forecast Forecast Forecast No. Description California Corporation Franchise Tax 2. Operating Revenues 6,080,010 6,461,352 6,716,143 6,707,448 6,706,146 6,694, Operating Expenses 1,794,805 1,836,414 1,847,141 1,774,334 1,820,071 1,866, Taxes Other Than Income 336, , , , , , Subtotal Expenses 2,131,593 2,187,667 2,221,063 2,166,289 2,236,356 2,313, Income Tax Adjustments 3,442,962 3,504,197 3,662,118 3,881,513 4,007,576 4,196, California Taxable Income 505, , , , , , CCFT Tax Rate % % % % % % 9. CCFT 44,682 68,023 73,634 58,313 40,860 16, California Alternate Minimum Tax Arizona Income Tax Rate % % % % % % 12. New Mexico Income Tax Rate % % % % % % 13. Arizona Income Tax New Mexico Income Tax Total Other State State Income Taxes Total State Income Taxes 44,818 68,231 73,859 58,313 40,860 16,325 A-27
50 SOUTHERN CALIFORNIA EDISON TEST YEAR 2018 GENERAL RATE CASE ESTIMATED REVENUE REQUIREMENTS AT AUTHORIZED BASE REVENUE REQUIREMENT TAXES - INCOME ($000) Line Recorded Forecast Forecast Forecast Forecast Forecast No. Description Federal Income Tax 2. Operating Revenues 6,080,010 6,461,352 6,716,143 6,707,448 6,706,146 6,694, Operating Expenses 1,794,805 1,836,414 1,847,141 1,774,334 1,820,071 1,866, Taxes Other Than Income 336, , , , , , Taxes Other Than Income 336, , , , , , Total State Income Taxes 44,818 68,231 73,859 58,313 40,860 16, Less: Current Year's CCFT 44,682 68,023 73,634 58,313 40,860 16, Plus: Prior Year's CCFT 83,455 44,682 68,023 73,634 58,313 40, Subtotal - Expenses 2,215,184 2,232,557 2,289,311 2,239,923 2,294,669 2,354, Income Tax Adjustments (Sch M) 4,149,055 3,952,856 4,075,145 3,773,581 3,855,047 3,953, Federal Taxable Income (284,229) 275, , , , , FIT Tax Rate 35% 35% 35% 21% 21% 21% 13. Federal Income Tax (99,480) 96, , , ,850 81, Federal Alternative Income Tax Taxes Deferred-current (Plant) 408, , ,372 47,152 35,036 21, Taxes Deferred-current (AFUDC Debt) Taxes Deferred-current (Cap. Int.) Contributions in Aid of Construction (20,632) (20,980) (22,884) (41,205) (45,756) (48,427) 19. Investment Tax Credit Amortization (7,968) (9,878) (9,685) (9,791) (9,456) (9,098) 20. Total Federal Income Taxes 280, , , ,884 96,674 45, Total Taxes-Income (State and Fed) 325, , , , ,534 61,628 A-28
51 SOUTHERN CALIFORNIA EDISON TEST YEAR 2018 GENERAL RATE CASE DEPRECIATION EXPENSE ESTIMATED REVENUE REQUIREMENTS AT AUTHORIZED BASE REVENUE REQUIREMENT (Thousands of Dollars) Line Recorded Forecast Forecast Forecast Forecast Forecast No. Description Depreciation Expense 1,653,598 1,750,011 1,853,858 2,008,270 2,144,517 2,342,650 A-29
52 SOUTHERN CALIFORNIA EDISON TEST YEAR 2018 GENERAL RATE CASE WEIGHTED AVERAGE RATE BASE ESTIMATED REVENUE REQUIREMENTS AT AUTHORIZED BASE REVENUE REQUIREMENT (Thousands of Dollars) Line Recorded Forecast Forecast Forecast Forecast Forecast No. Description Fixed Capital 2. Plant in Service (Avg.) 38,342,620 40,832,678 43,743,307 46,537,145 49,818,535 53,123, Capitalized Software (Avg.) 1,518,581 1,434,610 1,358,394 1,209,818 1,261,255 1,589, Intangibles (Avg.) 196, , , , , , Property Held for Future Use (Avg.) Total Fixed Capital (Avg.) 40,057,476 42,479,255 45,324,604 47,973,921 51,316,486 54,951, Adjustments 8. Customer Advance for Construction (Avg.) (69,490) (69,089) (67,745) (72,308) (79,137) (84,762) 9. Total Adjustments (Avg.) (69,490) (69,089) (67,745) (72,308) (79,137) (84,762) 10. Working Capital 11. Materials and Supplies (Avg) 190, , , , , , Mountainview Emission Credits (Avg) 6,774 6,106 5,468 4, Working Cash (Avg.) 356, , , , , , Total Working Capital (Avg.) 553, , , , , , Total Before Deductions for Reserves (Avg) 40,541,718 42,947,186 45,811,860 48,440,275 51,827,159 55,519,458 A-30
53 SOUTHERN CALIFORNIA EDISON TEST YEAR 2018 GENERAL RATE CASE WEIGHTED AVERAGE RATE BASE ESTIMATED REVENUE REQUIREMENTS AT AUTHORIZED BASE REVENUE REQUIREMENT (Thousands of Dollars) Line Recorded Forecast Forecast Forecast Forecast Forecast No. Description Deductions for Reserves 17. Depreciation Reserve (Avg) (12,145,461) (12,016,424) (12,561,022) (13,175,659) (13,873,335) (14,721,079) 18. Accum. Amort. - Capitalized Software (Avg.) (984,700) (883,979) (753,411) (666,900) (665,848) (801,957) 19. Taxes Def. - Plant ( Avg.) (4,891,503) (5,201,910) (5,527,655) (5,787,010) (5,830,383) (5,861,230) 20. Capitalized Interest (Avg) Taxes Def. - CIAC (Avg.) 99, , , , , , Accrued Vacation (Avg) 20,236 18,873 17,469 13,350 9,425 8, Unfunded Pension Reserve (Avg.) (71,129) (71,342) (73,401) (84,631) (96,799) (98,622) 24. Total Deductions for Reserves ( Avg.) (17,973,074) (18,049,883) (18,784,011) (19,579,634) (20,321,208) (21,318,739) 25. Total Rate Base (Avg) 22,568,645 24,897,303 27,027,849 28,860,641 31,505,951 34,200,719 A-31
54 SOUTHERN CALIFORNIA EDISON TEST YEAR 2018 GENERAL RATE CASE SUMMARY OF EARNINGS ESTIMATED REVENUE REQUIREMENTS AT AUTHORIZED BASE REVENUE REQUIREMENT (Thousands of Dollars) Line Recorded Forecast Forecast Forecast Forecast Forecast No. Description Operating Revenues 2. Electric Revenues 6,080,010 6,461,352 6,716,143 6,707,448 6,706,146 6,694, Operating Expenses 4. Escalation 0 32,409 69, , , , Generation - Steam 7,338 7,444 7,124 7,845 7,845 7, Generation - Nuclear 79,681 76,747 76,747 76,747 76,747 76, Generation - Hydro 43,827 45,444 42,445 41,446 41,446 41, Generation - Other 78,825 80,993 79,346 81,965 81,965 81, Transmission 160, , , , , , Distribution 527, , , , , , Customer Accounts 165, , , , , , Customer Service and Information 23,327 20,638 21,074 21,007 21,007 21, Total O&M Expenses 1,086,465 1,127,053 1,154,782 1,211,040 1,265,039 1,317, O&M Jurisdictional Factor % % % % % % 15. O&M Expenses Juris. 1,086,465 1,127,053 1,154,782 1,211,040 1,265,039 1,317, Administrative and General 860, , , , , , Total A&G Expenses 860, , , , , , Revenue Credits 214, , , , , , Other Uncollectibles 11,755 15,378 15,984 14,488 14,485 14, Franchise Requirements 50,763 58,766 61,083 61,333 61,321 61, Subtotal 1,794,805 1,836,414 1,847,141 1,774,334 1,820,071 1,866,824 A-32
55 SOUTHERN CALIFORNIA EDISON TEST YEAR 2018 GENERAL RATE CASE SUMMARY OF EARNINGS ESTIMATED REVENUE REQUIREMENTS AT AUTHORIZED BASE REVENUE REQUIREMENT (Thousands of Dollars) Line Recorded Forecast Forecast Forecast Forecast Forecast No. Description Depreciation 1,653,598 1,750,011 1,853,858 2,008,270 2,144,517 2,342, Taxes Other Than On Income 336, , , , , , Taxes Based On Income 325, , , , ,534 61, Total Taxes 661, , , , , , Total Operating Expenses 4,110,220 4,368,090 4,511,675 4,374,756 4,518,407 4,718, Net Operating Revenue 1,969,790 2,093,262 2,204,468 2,332,692 2,187,739 1,976, Rate Base - System (Average) 22,568,645 24,897,303 27,027,849 28,860,641 31,505,951 34,200, Rate of Return 8.73% 8.41% 8.16% 8.08% 6.94% 5.78% 29. Rate of Return Juris. 8.74% 8.41% 8.16% 8.09% 6.95% 5.78% A-33
56 CPUC JURISDICTIONALIZATION & FUNCTIONALIZATION 2018 THROUGH 2020 A-34
57 Southern California Edison Results of Operations - CPUC and FERC $ in Thousands Line Estimated 2018 % for 2018 No. Item Total FERC CPUC FERC CPUC Total 1. Total Operating Revenues 6,494, ,486 5,534, % 85.21% % 2. Operating Expenses: 3. Production 4. Steam 7,845-7, % % % 5. Nuclear 76,747-76, % % % 6. Hydro 41,446-41, % % % 7. Other 81,965-81, % % % 8. Total Production O&M 208, , % % % 9. Transmission 172,453 81,335 91, % 52.84% % 10. Distribution 539,618 7, , % 98.61% % 11. Customer Accounts 159, , % % % 12. Uncollectibles 14,029 2,075 11, % 85.21% % 13. Customer Service & Information 21,007-21, % % % 14. Administrative & General 691,464 43, , % 93.69% % 15. Franchise Requirements 59,389 8,783 50, % 85.21% % 16. Revenue Credits (203,992) (50,921) (153,070) 24.96% 75.04% % 17. Subtotal 1,661,300 92,401 1,568, % 94.44% % 18. Escalation 110,631 6, , % 93.96% % 19. Depreciation 2,008, ,933 1,752, % 87.26% % 20. Taxes Other Than On Income 21. Taxes Other Than On Income - Property 321,138 62, , % 80.48% % 22. Taxes Other Than On Income - Payroll 70,816 4,466 66, % 93.69% % 23. Taxes Based On Income 148, ,645 38, % 26.20% % 24. Total Taxes 540, , , % 67.29% % 25. Total Operating Expenses 4,320, ,810 3,788, % 87.69% % 26. Net Operating Revenue 2,174, ,676 1,745, % 80.28% % 27. Rate Base 28,572,941 5,633,659 22,939, % 80.28% % 28. Rate Of Return 7.61% 7.61% 7.61% A-35
58
59
60 Southern California Edison 2018 Results of Operations $ in Thousands 2018 Results of Operations Line No. Item CPUC Generation Peakers Distribution 1. Total Operating Revenues 5,534, ,386 57,033 4,803, Operating Expenses: 3. Production 4. Steam 7,845 7, Nuclear 76,747 76, Hydro 41,446 41, Other 81,965 74,514 7, Total Production O&M 208, ,552 7, Transmission 91,118 91, Distribution 532, , Customer Accounts 159, , Uncollectibles 11,954 1, , Customer Service & Information 21,007 1,597 19, Administrative & General 647,853 83,915 4, , Franchise Requirements 50,607 6, , Revenue Credits (153,070) (1,836) (151,234) 17. Total O&M 1,568, ,839 12,548 1,264, Escalation 103,952 20, , Depreciation 1,752, ,863 14,531 1,555, Taxes Other Than On Income 21. Property Taxes 258,451 21,384 3, , Payroll Taxes & Misc 66,350 8, , Taxes Based On Income 38,919 (3,274) 7,616 34, Total Taxes 363,720 27,109 11, , Total Operating Expenses 3,788, ,307 38,706 3,228, Net Operating Revenue 1,745, ,079 18,327 1,575, Rate Base 22,939,281 1,998, ,858 20,699, Rate Of Return 7.61% 7.61% 7.61% 7.61% A-38
61 Southern California Edison 2019 Results of Operations $ in Thousands 2019 Results of Operations Line No. Item CPUC Generation Peakers Distribution 1. Total Operating Revenues 5,965, ,745 56,865 5,209, Operating Expenses: 3. Production 4. Steam 7,845 7, Nuclear 76,747 76, Hydro 41,446 41, Other 81,965 74,514 7, Total Production O&M 208, ,552 7, Transmission 91,118 91, Distribution 532, , Customer Accounts 159, , Uncollectibles 12,885 1, , Customer Service & Information 21,007 1,597 19, Administrative & General 644,719 83,335 4, , Franchise Requirements 54,546 6, , Revenue Credits (156,749) (1,880) (154,869) 17. Total O&M 1,566, ,503 12,698 1,262, Escalation 154,691 29, , Depreciation 1,872, ,625 14,804 1,668, Taxes Other Than On Income 21. Property Taxes 277,288 21,326 3, , Payroll Taxes & Misc 68,453 9, , Taxes Based On Income 109,661 2,825 7,504 99, Total Taxes 455,402 33,435 11, , Total Operating Expenses 4,049, ,284 39,129 3,466, Net Operating Revenue 1,916, ,461 17,736 1,742, Rate Base 25,181,218 2,043, ,083 22,905, Rate Of Return 7.61% 7.61% 7.61% 7.61% A-39
62 Southern California Edison 2020 Results of Operations $ in Thousands 2020 Results of Operations Line No. Item CPUC Generation Peakers Distribution 1. Total Operating Revenues 6,468, ,025 57,282 5,678, Operating Expenses: 3. Production 4. Steam 7,845 7, Nuclear 76,747 76, Hydro 41,446 41, Other 81,965 74,514 7, Total Production O&M 208, ,552 7, Transmission 91,118 91, Distribution 532, , Customer Accounts 159, , Uncollectibles 13,971 1, , Customer Service & Information 21,007 1,597 19, Administrative & General 643,516 83,036 4, , Franchise Requirements 59,145 6, , Revenue Credits (159,711) (1,915) (157,796) 17. Total O&M 1,568, ,544 12,838 1,264, Escalation 203,661 38, , Depreciation 2,048, ,059 15,456 1,830, Taxes Other Than On Income 21. Property Taxes 300,848 21,713 3, , Payroll Taxes & Misc 70,877 9, , Taxes Based On Income 187,024 8,523 7, , Total Taxes 558,749 39,849 10, , Total Operating Expenses 4,379, ,313 40,092 3,766, Net Operating Revenue 2,088, ,713 17,190 1,912, Rate Base 27,445,654 2,085, ,907 25,133, Rate Of Return 7.61% 7.61% 7.61% 7.61% A-40
63 CHAPTER V TAX LEGISLATION CHANGES A-41
64 SCE-59 SCE-59 SCE-60 SCE-59 SCE-59 SCE-60 SCE-59 SCE-59 SCE-60 Current Current Rate Base New Current Current Rate Base New Current Current Rate Base New EQUITY RETURN ON RATE BASE 35% 21% Changes Model 35% 21% Changes Model 35% 21% Changes Model Original Rate Base 22,939,852 22,939,852 (570) 22,939,281 25,034,971 25,034, ,247 25,181,218 27,177,582 27,177, ,072 27,445,654 Equity Rate of Return 5.47% 5.47% 5.47% 5.47% 5.47% 5.47% 5.47% 5.47% 5.47% 5.47% 5.47% 5.47% Equity Return 1,254,305 1,254,305 (31) 1,254,274 1,368,862 1,368,862 7,996 1,376,859 1,486,016 1,486,016 14,658 1,500,673 Gross Up Revenue Requirement 2,233,449 1,787,778 (45) 1,787,733 2,437,432 1,951,058 11,397 1,962,455 2,646,039 2,118,039 20,892 2,138,931 Total Revenue Requirement 2,233,449 1,787,778 (45) 1,787,733 2,437,432 1,951,058 11,397 1,962,455 2,646,039 2,118,039 20,892 2,138,931 Increase/(Decrease) in Revenue (445,671) (45) (445,716) (486,374) 11,397 (474,977) (528,000) 20,892 (507,108) Current Current Rate Base New Current Current Rate Base New Current Current Rate Base New DEBT RETURN ON RATE BASE 35% 21% Changes Model 35% 21% Changes Model 35% 21% Changes Model Original Rate Base 22,939,852 22,939,852 (570) 22,939,281 25,034,971 25,034, ,247 25,181,218 27,177,582 27,177, ,072 27,445,654 Debt Rate of Return 2.14% 2.14% 2.14% 2.14% 2.14% 2.14% 2.14% 2.14% 2.14% 2.14% 2.14% 2.14% Total Revenue Requirement 491, ,234 (12) 491, , ,099 3, , , ,981 5, ,721 Increase/(Decrease) in Revenue - (12) (12) - 3,132 3,132-5,740 5,740 Current Current F/T Tax New Current Current F/T Tax New Current Current F/T Tax New CURRENT YEAR F/T BENEFITS 35% 21% Changes Model 35% 21% Changes Model 35% 21% Changes Model Total F/T Tax Deductions (1,345,734) (1,345,734) 17,097 (1,328,636) (1,351,908) (1,351,908) 34,156 (1,317,752) (1,387,210) (1,387,210) 180,153 (1,207,057) Federal Tax Rate 35.00% 21.00% 21.00% 21.00% 35.00% 21.00% 21.00% 21.00% 35.00% 21.00% 21.00% 21.00% Federal F/T Tax Benefits (471,007) (282,604) 3,590 (279,014) (473,168) (283,901) 7,173 (276,728) (485,523) (291,314) 37,832 (253,482) Federal Credits (9,791) (9,791) (9,791) (9,456) (9,456) (9,456) (9,098) (9,098) (9,098) State F/T Tax Benefits (100,544) (100,544) 683 (99,861) (96,917) (96,917) 107 (96,810) (89,837) (89,837) (994) (90,831) Total Tax Adjustments (581,342) (392,939) 4,273 (388,666) (579,541) (390,274) 7,280 (382,994) (584,458) (390,249) 36,838 (353,411) Gross Up Total Revenue Requirement (1,035,153) (560,062) 6,091 (553,971) (1,031,945) (556,263) 10,377 (545,886) (1,040,702) (556,227) 52,505 (503,722) Increase/(Decrease) in Revenue 475,091 6, , ,682 10, , ,475 52, ,980 Current Current New Current Current New Current Current New RECOVER P/Y TAX BENEFITS 35% 21% ARAM Model 35% 21% ARAM Model 35% 21% ARAM Model F/T Tax Deductions 391, ,097 (220,218) 170, , ,558 (218,856) 233, , ,362 (380,000) 175,362 Federal Tax Rate 35.00% 21.00% 21.00% 21.00% 35.00% 21.00% 21.00% 21.00% 35.00% 21.00% 21.00% 21.00% Federal F/T Tax Benefits 136,884 82,130 (46,246) 35, ,395 95,037 (45,960) 49, , ,626 (79,800) 36,826 Vacation ARAM 5,812 5,812-82,130 (40,434) 41,697 95,037 (45,960) 49, ,626 (79,800) 36,826 Gross Up Total Revenue Requirement 243, ,061 (57,630) 59, , ,458 (65,507) 69, , ,229 (113,740) 52,489 Increase/(Decrease) in Revenue (126,678) (57,630) (184,308) (146,584) (65,507) (212,091) (179,884) (113,740) (293,624) Current Updated Current Updated Current Updated Revenue Other Revenue Revenue Other Revenue Revenue Other Revenue Requirement 21% Changes Requirement Requirement 21% Changes Requirement Requirement 21% Changes Requirement Recovery of Expenses (excluding in 3,740, ,947 3,749,991 3,926, ,215 3,939,428 4,170, ,747 4,192,761 Equity Return on Rate Base 2,233,449 (445,671) (45) 1,787,733 2,437,432 (486,374) 11,397 1,962,455 2,646,039 (528,000) 20,892 2,138,931 Debt Return on Rate Base 491,234 - (12) 491, ,099-3, , ,981-5, , F/T Tax Benefits (1,035,153) 475,091 6,091 (553,971) (1,031,945) 475,682 10,377 (545,886) (1,040,702) 484,475 52,505 (503,722) Recovery of P/Y F/T Tax Benefits 243,739 (126,678) (57,630) 59, ,042 (146,584) (65,507) 69, ,113 (179,884) (113,740) 52,489 5,673,313 (97,258) (41,649) 5,534,406 6,149,841 (157,276) (27,386) 5,965,179 6,703,445 (223,409) (11,856) 6,468,180 5,673,313 5,534,406 6,149,841 5,965,179 6,703,445 6,468,180 - A-42
65 SCE-59 SCE-60 CHANGES Rate Base FERC CPUC Total FERC CPUC Total FERC CPUC Total FERC CPUC Total FERC CPUC Total FERC CPUC Total FERC CPUC Total FERC CPUC Total FERC CPUC Total Original Rate Base 5,618,892 22,939,852 28,558,7 5,97,798 25,03,971 31,009,769 6,3 7,928 27,177,582 33,525,510 5,633,659 22,939,281 28,572,9 1 6,053,30 25,181,218 31,23,522 6, 95,075 27, 5,65 33,9 0, (570) 1,197 78, ,2 7 22, , ,072 15,219 Total Rate of Return 7.61% 7.61% 7.61% 7.61% 7.61% 7.61% 7.61% 7.61% 7.61% 7.61% 7.61% 7.61% 761% 7.61% 7.61% 7.61% 7.61% 7.61% Return 27,553 1,7 5,539 2,173,092 5,63 1,90,961 2,359,595 83,027 2,067,997 2,551,023 28,676 1,7 5, 96 2,17,172 60,608 1,916,089 2,376,697 9,223 2,088,395 2,582,618 1,12 ( 3) 1,081 5,97 11,128 17,102 11,197 20,398 31,595 Debt Rate 2.1 % 2.1 % 2.1 % 2.1 % 2.1 % 2.1 % 2.1 % 2.1 % 2.1 % 2.1 % 2.1 % 2.1 % 2.1 % 2.1 % 2.1 % 2.1 % 2.1 % 2.1 % Debt Return 120,323 91,23 611, ,9 536,099 66, , , , ,639 91, , , , , , , , (12) 30 1,681 3,132,813 3,151 5,7 0 8,891 Equity Return 307,230 1,25,305 1,561, ,690 1,368,862 1,695, ,092 1, 86,016 1,833, ,037 1,25,27 1,562, ,983 1,376,858 1,707, ,137 1,500,67 1,855, (31) 777,293 7,996 12,289 8,0 6 1,658 22,70 Equity Return 307,230 1,25,305 1,561, ,690 1,368,862 1,695, ,092 1, 86,016 1,833, ,037 1,25,27 1,562, ,983 1,376,858 1,707, ,137 1,500,67 1,855, (31) 777,293 7,996 12,289 8,0 6 1,658 22,70 Gross Up ,062 2,233, 9 2,780, ,71 2, 37, 32 3,019, ,0 0 2,6 6,039 3,26,080 39,0 9 1,787,733 2,226,783 71,755 1,962, 55 2, 3, ,182 2,138,931 2,6 5,112 ( ) ( 5,716) (553,729) (109,959) ( 7,978) (58,937) (111,859) (507,109) (618,967) Flow Through Taxes FERC CPUC Total FERC CPUC Total FERC CPUC Total FERC CPUC Total FERC CPUC Total FERC CPUC Total FERC CPUC Total FERC CPUC Total FERC CPUC Total Federal 2,379 (927,856) (925, 77) 2,5 8 (878,127) (875,579) 2,753 (782,5 2) (779,789) (35,228) (1,121,562) (1,156,790) (38,590) (1,075,190) (1,113,780) (32,573) (1,000,189) (1,032,762) (37 607) (193,706) (231,313) ( 1,138) (197,063) (238,201) (35,326) (217,6 7) (252,973) P/Y State Taxes on F/T Revenue (26,273) (37,763) (6,036) (30,893) (33,265) (6,158) (33,797) (61,370) (95,167) (17,267) ( 6,768) (6,035) (21,709) (20,502) ( 2,211) (2,682) ( 3,186) (67,868) 9006 (9,005) 1 9,18 12,763 21,9 7 9,115 18,18 27,299 State Taxes on Rate Base Adj 2,3 8 2,3 8 2,250 2,250 2,156 2,156 1,938 1,938 1,851 1,851 1,772 1,772 - ( 10) ( 10) - (399) (399) - (38 ) (38 ) C/Y CA Normal zed Dif erences (19,959) 8,635 (11,325) (18,266) 9,792 (8, 75) (18, 31) 9,908 (8,523) (19,959) 8,635 (11,325) (18,266) 9,792 (8, 75) (18, 31) 9,908 (8,523) (0) (0) ( 3,853) (95,637) (998, 90) ( 6,611) (899,350) (9 5,961) ( 9, 75) (831,8 8) (881,323) (72, 5 ) (1,157,758) (1,230,212) (78,565) (1,08,0 9) (1,162,615) (75,686) (1,031,695) (1,107,381) (28 601) (203,121) (231,722) (31,95 ) (18,699) (216,653) (26,211) (199,8 7) (226,058) Tax Rate 35% 35% 35% 35% 35% 35% 21% 21% 21% 21% 21% 21% (15,3 9) (33,123) (3 9, 71) (16,31 ) (31,772) (331,087) (17,316) (291,1 7) (308, 63) (15,215) (2 3,129) (258,3 ) (16, 99) (227,650) (2,1 9) (15,89 ) (216,656) (232,550) ,99 91,127 (185) 87,122 86,937 1, 22 7, 91 75,913 State 2,536 (1,137,380) (1,13,8 ) 2,702 (1,096,3 5) (1,093,6 3) 2,905 (1,016,251) (1,013,3 6) 2,536 (1,129,651) (1,127,115) 2,702 (1,095,133) (1,092, 31) 2,905 (1,027,500) (1,02,595) - 7,729 7,729-1,212 1,212 - (11,2 9) (11,2 9) Tax Rate 8.8 % 8.8 % 8.8 % 8.8 % 8.8 % 8.8 % 8.8 % 8.8 % 8.8 % 8.8 % 8.8 % 8.8 % 8 8 % 8.8 % 8.8 % 8.8 % 8.8 % 8.8 % 22 (100,5 ) (100,320) 239 (96,917) (96,678) 257 (89,837) (89,580) 22 (99,861) (99,637) 239 (96,810) (96,571) 257 (90,831) (90,57 ) (99 ) (99 ) Tax Credits (9,791) (9,791) (9, 56) (9, 56) (9,098) (9,098) (9,791) (9,791) (9, 56) (9, 56) (9,098) (9,098) Vacation ARAM 5,812 5,812-5,812 5, (15,12 ) (, 58) ( 59,583) (16,075) ( 21,1 5) ( 37,221) (17,059) (390,081) ( 07,1 1) (1,991) (3 6,969) (361,960) (16,260) (333,916) (350,176) (15,637) (316,585) (332,222) , 89 97,622 (185) 87,229 87,0 5 1, 22 73, 96 7,919 Gross Up Total Revenue Adjustment (26,931) (791, 1 ) (818,3 5) (28,62 ) (7 9,903) (778,527) (30,377) (69,589) (72,966) (21,367) ( 9,5 0) (515,907) (23,175) ( 75,935) ( 99,110) (22,288) ( 51,233) ( 73,521) ,87 302, 38 5, 9 273, , 17 8, , , 5 Equity Return 5 7,062 2,233, 9 2,780, ,71 2, 37, 32 3,019, ,0 0 2,6 6,039 3,26,080 39,0 9 1,787,733 2,226,783 71,755 1,962, 55 2, 3, ,182 2,138,931 2,6 5,112 ( ) ( 5,716) (553,729) (109,959) ( 7,978) (58,937) (111,859) (507,109) (618,967) Debt Return 120,323 91,23 611, ,9 536,099 66, , , , ,639 91, , , , , , , , (12) 30 1,681 3,132,813 3,151 5,7 0 8,891 F/T Taxes (26,931) (791, 1 ) (818,3 5) (28,62 ) (7 9,903) (778,527) (30,377) (69,589) (72,966) (21,367) ( 9,5 0) (515,907) (23,175) ( 75,935) ( 99,110) (22,288) ( 51,233) ( 73,521) ,87 302, 38 5, 9 273, , 17 8, , , 5 6 0, 5 1,933,269 2,573, ,03 2,223,628 2,90, ,598 2,533, 31 3,257, ,321 1,78, 15 2,322, ,205 2,025,751 2,603, ,980 2,275, 19 2,898,398 (102,133) (1 8,85 ) (250,987) (102,829) (197,878) (300,707) (100,619) (258,013) (358,631) Revenue from above 6 0, 5 1,933,269 2,573, ,03 2,223,628 2,90, ,598 2,533, 31 3,257, ,321 1,78, 15 2,322, ,205 2,025,751 2,603, ,980 2,275, 19 2,898,399 (102,133) (1 8,85 ) (250,987) (102,829) (197,877) (300,706) (100,618) (258,012) (358,630) Other expenses 22,839 3,7 0,0,162,883 3,95 3,926,213,370,167 69, 62,170,01,639, 76 22,165 3,7 9,991,172,156,631 3,939, 28,38,059 73,56,192,761,666,325 (67 ) 9,9 7 9, ,215 13,892,102 22,7 7 26,8 9 Total Revenue computed 1,063,293 5,673,313 6,736,606 1,12,988 6,1 9,8 1 7,27,829 1,193,060 6,703, 5 7,896, , 86 5,53, 06 6, 9,892 1,022,836 5,965,179 6,988,015 1,096,5 6, 68,180 7,56,72 ( ) (138,907) (2 1,71 ) (102,152) (18,662) (286,81 ) (96,516) (235,265) (331,781) Check Total GRC Revenue 1,063,293 5,673,313 6,736,606 1,12,988 6,1 9,8 1 7,27,829 1,193,060 6,703, 5 7,896, , 86 5,53, 06 6, 9,892 1,022,836 5,965,179 6,988,015 1,096,5 6, 68,180 7,56,72 ( ) (138,907) (2 1,71 ) (102,152) (18,662) (286,81 ) (96,516) (235,265) (331,781) Difference A-43
66 SCE-59 SCE-60 SCE-59 SCE-60 SCE-59 SCE-60 Prior Version Prior Version Changes Prior Version Changes Changes State State Tax State Federal State Tax Effected Federal State Tax Effected Federal State Tax Effected Federal State Tax Effected Federal State Tax Effected Federal State Tax Effected Federal Tax Effected Federal Effected Federal Tax Effected Pretax Income 2,350, , 61 2,606, ,1 2,660 ( ) ( ) ( ) 2,630, , ,287,1 6 ( ) ( ) ( ) 2,92, , , 1,026 ( ) ( ) ( ) Interest (618,022) ( ) (18, 18) (617,718) ( ) (270,807) (304) ( 04) (67,760) ( ) (201,3 8) ( ) ( ) ( ) (4 813) (4 81 ) (732, 5 ) ( ) (218,56 ) ( ) ( ) (317,210) (8 891) (8 891) F/T Differences Book Depreciation 3 3,352 1,719,370 22, ,072 1,719, ,367 ( ) - ( ) 391, 19 1,837, 31 2, ( ) - ( ) 83,055 2,012, , , 31 ( ) - ( ) Tax Depreciation (229,533) (1,30, 89) (163,519) (229,533) (1,30, 89) (195,653) (212,881) (1,3 8,727) (163,932) ( ) ( ) ( ) (231,208) (1,,961) (176,288) ( ) ( ) (208,657) Cost of Removal (253,775) (529, 28) (100,09 ) (253,775) (529, 28) (135,623) (2 3,010) (535,551) (98,375) ( ) ( ) ( ) (22,363) (53,851) (9,397) ( ) ( ) (125,808) Repairs (989,8 8) (989,8 8) (295,371) (989,8 8) (989,8 8) ( 33,950) (1,022,826) (1,022,826) (305,211) ( ) ( ) ( 8, 07) (1,0 9,135) (1,0 9,135) (313,062) ( ) ( ) ( 59,9 1) ITCC 29,038 30,078 8,757 21,309 22,3 9 9, (677) 27,179 27,863 8, (2 627) 25,922 26,261 7, ,685 (9 788) (9 788) (7 920) Cap Software ( 8,230) ( 8,230) (1,392) ( 8,230) ( 8,230) (21,1 ) ( 0,950) ( 0,950) (12,219) (40 950) (40 950) (17 952) (23,295) (23,295) (6,951) (23 295) (23 295) (10,213) Interest 1, , , , M&E 2,102 2, ,102 2, (294) 2,172 2, (304) 2,217 2, (310) Ad Valorem (8,5 7) (8,5 7) (2,550) (8,5 7) (8,5 7) (3,7 7) (13,536) (13,536) (,039) (12 061) (12 061) (5 288) (1 475) (1 475) (1,608) (1,608) (,359) (13 147) (13 147) (5,76 ) (1 461) (1 461) Preferred Dividends (1,3 8) (283) (809) (283) (539) - - (1,3 8) (283) (809) (283) (539) - - (1,3 8) (283) (809) (283) (539) - - Section (19,217) (6,726) (21 015) (7 355) (23 038) (8,063) State Taxes (6,035) (15,826) (6,036) (26,376) ( 2,211) (10,6 ) (64 158) (25, 21) (67,868) (16,0 2) (95 167) (36,291) ( ) ( ) ( ) ( ) ( ) ( ) ( ) ( ) ( ) ( ) ( ) ( ) ( ) ( ) ( ) ( ) ( ) ( ) ( ) ( ) ( ) (11 249) Normalized Differences- CPUC Book Depreciation 1,389, 73 50, ,3 8 1,169,25 50,956 12, ( ) 1, 58,109 53, , ( ) 1,550,575 56,59 329, , ( ) Tax Depreciation (1,015,782) (29, 20) (215,369) (1,375,032) (29, 20) ( 82,952) (1,017, 96) (37,9 3) (216,32 ) ( ) (37 943) ( ) (1,029,313) ( 7, 5 ) (219, 70) ( ) (47 454) (355,7 0) (20 705) AFUDC Debt ( 8, 57) (48 457) (13,560) ( 8, 57) (48 457) (19,7 ) (52,182) (52 182) (1,602) (52 182) (52 82) (21 262) (51,251) (51 251) (1,3 2) (51 251) (51 251) (20,883) CPI 100, , , , (12 851) 99, , , (12 660) 106, , , (13 529) CIAC 2 6, , , , (31 519) 263, , (33 623) 268, , , (34 287) MSC (219, 7 ) ( ) (61, 17) (219, 7 ) ( ) (89, 27) (211,20 ) ( ) (59,103) ( ) ( ) (86 057) (216,663) ( ) (60,630) ( ) ( ) (88,282) Cost of Removal (275,653) (57,887) (275,653) (96, 79) (292,5 0) (61, 33) ( ) ( ) (310, 89) (65,203) ( ) (108,671) Accured Vacation (3,587) (3 587) (1,00 ) (3,587) (3 587) (1, 62) (3,691) (3 691) (1,033) (3 691) (3 691) (1 50 ) (3,799) (3 799) (1,063) (3 799) (3 799) (1,5 8) ( ) ( ) ( ) (92 916) Normalized Differences- FERC Book Depreciation 275, , , , (22 492) 29, , , (23 794) 309, , , (27 545) Tax Depreciation (320,928) (3,533) (91, 56) (393,237) (3,533) (157, 30) (3 6,8 7) (3 6,808) (97,058) ( ) ( ) (185,185) (355,923) (370,199) (100,597) ( ) ( ) (158,906) AFUDC Debt (16,535) (16 535) (,627) (16,535) (16 535) (6,737) (19,381) (19 381) (5, 23) (19 381) (19 81) (7 897) (20,269) (20 269) (5,672) (20 269) (20 269) (8,259) CPI 1, ,126 1, , (1 882) 23, , (2 937) 25, , , (3 206) MSC (32,137) (32 137) (8,993) (32,137) (32 137) (13,095) ( 8,996) (48 996) (13,711) (48 996) (48 996) (19 96 ) (51,3 8) (51 348) (1,369) (51 348) (51 348) (20,922) Cost of Removal (33, 53) (33 453) (9,361) (33, 53) (33 453) (13,631) (32, 55) (32 455) (9,082) (32 455) (32 455) (13 22 ) (27,237) (27 237) (7,622) (27 237) (27 237) (11,098) Repairs ( 8,566) (48 566) (13,590) ( 8,566) (48 566) (19,789) (33,207) (33 207) (9,292) (33 207) (33 207) (13 530) (36,792) (36 792) (10,296) (36 792) (36 792) (1,991) Capitalized Software (3,2 7) (3 247) (909) (3,2 7) (3 247) (1,323) (2,757) (2 757) (771) (2 757) (2 757) (1,123) (1,568) (1 568) ( 39) (1 568) (1 568) (639) ( ) ( ) (50 350) ( ) ( ) ( ) ( ) ( ) (49 215) ( ) ( ) ( ) ( ) ( ) (47 950) ( ) ( ) (93 019) ( ) ( ) ( ) ( ) 521,396 77, , , ( ) 878, , ( ) 1,2 5,708 1,070, ( ) ( ) Check (0) 0 0 (0) - - (0) 0 0 (0) 21% 8.8 % 35% 8.8 % 21% 8.8 % 35% 8.8 % 21% 8.8 % 35% 8.8 % Tax on Pretax 93, , , , ( ) (22 603) ( ) 552, , ,027, , ( ) (26 98 ) ( ) 61, , ,150, 5 290, ( ) (32 084) ( ) Interest Benefit (129,785) (5,633) ( ) (216,201) (5,606) ( ) (27) (1 1,700) (59,6 9) ( ) (23, 82) (59,223) ( ) (425) (153,815) (6,7 9) ( ) (253,2 7) (63,963) ( ) (786) F/T Taxes (2 2,926) (99,637) ( ) (323,917) (100,320) ( ) (233,89 ) (96,571) ( ) (306, 53) (96,678) ( ) (216,880) (90,57 ) ( ) (272,926) (89,580) ( ) (994) Fed Benefit of St Taxes (13, 7) (2 378) (15 826) (22, 13) (3 964) (26 376) (8,86 ) (1 780) (10 644) (22, 55) (2 966) (25 421) (1,252) (1 790) (16 042) (33,308) (2 983) (36 291) Tax Credits (9,791) (9 791) (9,791) - (9 791) 0-0 (9 456) (9 456) (9 456) - (9 456) (0) - (0) (9,098) (9 098) (9 098) - (9 098) ( ) (20 61) ( ) ( ) (26 11 ) ( ) ( ) (32 671) ( ) CPUC Norma ized 36,578 5,613 2,190 (1 1,851) 5,613 (136,239) , 29 51,167 6,365 57,532 (99,281) 6,365 (92 916) , 8 65,881 6, 0 72,321 36,899 6, 0 3, ,982 FERC Normalized (3,582) (12,973) ( 7,556) (96,070) (12,973) (109,0 ) , 88 (3,78 ) (11,873) ( 6,658) (116,197) (11,873) ( ) , 12 (33,389) (11,980) ( 5,369) (81,039) (11,980) (93,019) , (7 361) (5 365) ( ) (7 361) ( ) (5 509) ( ) (5 509) ( ) (5 540) (44 139) (5 540) (49 679) A-44
67
68 Southern California Edison Summary of Electric Rate Base CPUC Nominal $ in Thousands CPUC Rate Base Recorded Forecast Line Item Fixed Capital 1 Plant in Service 30,829,338 32,872,349 35,199,552 37,503,632 40,162,597 42,814,546 2 Cap ta ized Software 1,422,803 1,344,128 1,272,719 1,133,514 1,181,706 1,488,795 3 Other Intangibles Total Fixed Capital 32,436,037 34,415,075 36,681,115 38,849,789 41,566,071 44,527,078 Adjustments 5 Customer Advances for Construction (69,490) (69,089) (67,745) (72,308) (79,137) (84,762) 6 Customer Deposits Total Adjustments (69,490) (69,089) (67,745) (72,308) (79,137) (84,762) Working Capital 8 Materials & Supp ies 178, , , , , ,643 9 Mountainview Emission Cred ts 6,774 6,106 5,468 4,861 4,284 3, Working Cash Total Working Capital 519, , , , , ,512 Reserves 12 Accumulated Depreciation Reserve (10,720,526) (10,570,393) (10,963,163) (11,427,048) (11,965,497) (12,634,848) 13 Accumulated Amortization (922,594) (828,226) (705,892) (624,838) (623,853) (751,377) 14 Accum. Def. Taxes - Plant (3,595,222) (3,740,155) (3,917,255) (4,058,039) (4,051,416) (4,033,443) 15 Accum. Def. Taxes - Capitalized Interest Accum. Def. Taxes - CIAC 99, , , , , , Accum. Def. Taxes - Vacation Accrual 18,960 17,683 16,367 12,508 8,831 7, Unfunded Pension Reserve (66 643) (66 842) (68 772) (79 293) (90 694) (92 402) 19 Total Deductions for Reserves (15,186,542) (15,083,035) (15,524,706) (16,055,494) (16,586,897) (17,348,449) 20 Rate Base 17,699,240 19,766,486 21,609,006 23,226,981 25,456,930 27,709, Depreciation and Amortization 1,436,643 1,520,200 1,608,803 1,752,338 1,872,039 2,048,898 Southern California Edison Summary of Electric Rate Base CPUC Nominal $ in Thousands CPUC Rate Base Recorded Forecast Line Item Fixed Capital 1 Plant in Service 30,829,338 32,872,349 35,199,552 37,503,632 40,162,597 42,814,546 2 Cap ta ized Software 1,422,803 1,344,128 1,272,719 1,133,514 1,181,706 1,488,795 3 Other Intangibles Total Fixed Capital 32,436,037 34,415,075 36,681,115 38,849,789 41,566,071 44,527,078 Adjustments 5 Customer Advances for Construction (69,490) (69,089) (67,745) (72,308) (79,137) (84,762) 6 Customer Deposits Total Adjustments (69,490) (69,089) (67,745) (72,308) (79,137) (84,762) Working Capital 8 Materials & Supp ies 178, , , , , ,643 9 Mountainview Emission Cred ts 6,774 6,106 5,468 4,861 4,284 3, Working Cash Total Working Capital 519, , , , , ,045 Reserves 12 Accumulated Depreciation Reserve (10,720,526) (10,570,393) (10,963,163) (11,427,048) (11,965,497) (12,634,848) 13 Accumulated Amortization (922,594) (828,226) (705,892) (624,838) (623,853) (751,377) 14 Accum. Def. Taxes - Plant (3,595,222) (3,740,155) (3,917,255) (4,113,258) (4,276,619) (4,382,115) 15 Accum. Def. Taxes - Capitalized Interest Accum. Def. Taxes - CIAC 99, , , , , , Accum. Def. Taxes - Vacation Accrual 18,960 17,683 16,367 15,016 13,627 12, Unfunded Pension Reserve (66 643) (66 842) (68 772) (71 395) (74 622) (76 027) 19 Total Deductions for Reserves (15,186,542) (15,083,035) (15,524,706) (16,097,114) (16,783,345) (17,662,053) 20 Rate Base 17,699,240 19,766,486 21,609,006 23,227,552 25,310,683 27,441, Depreciation and Amortization 1,436,643 1,520,200 1,608,803 1,752,338 1,872,039 2,048,898 CPUC Rate Base Recorded Forecast Line Item Fixed Capital 1 Plant in Service Capitaized Software Other Intangibles Total Fixed Capital 32,436,037 34,415,075 36,681, Adjustments 5 Customer Advances for Construction Customer Deposits Total Adjustments (69,490) (69,089) (67,745) Working Capital 8 Materials & Supp ies Mountainview Emission Cred ts Working Cash (42 190) (50 201) (45 533) 11 Total Working Capital 519, , ,341 (42,190) (50,201) (45,533) Reserves 12 Accumulated Depreciation Reserve (10,720,526) (10,570,393) (10,963,163) Accumulated Amortization (922,594) (828,226) (705,892) Accum. Def. Taxes - Plant (3,595,222) (3,740,155) (3,917,255) 55, , , Accum. Def. Taxes - Capitalized Interest Accum. Def. Taxes - CIAC 99, , ,009 (3,193) (7,886) (14,345) 17 Accum. Def. Taxes - Vacation Accrual 18,960 17,683 16,367 (2,508) (4,796) (4,348) 18 Unfunded Pension Reserve (66 643) (66 842) (68 772) (7 898) (16 072) (16 375) 19 Total Deductions for Reserves (15,186,542) (15,083,035) (15,524,706) 41, , , Rate Base 17,699,240 19,766,486 21,609,006 (570) 146, , Depreciation and Amortization 1,436,643 1,520,200 1,608,803 1,752,338 1,872,039 2,048,898 A-46
69
70 CHAPTER VI SUMMARY OF CHANGES TO WORKING CASH A-48
71 SOUTHERN CALIFORNIA EDISON Changes in Cash Working Capital Total Company (CPUC + FERC) $ in Thousands Line No. SCE-59 SCE-60 Change Working Cash 1. Income Tax Deferred 34,883 5,815 (29,068) 2. California State Tax 6,400 4,211 (2,189) 3. Federal Income Tax 5,976 5,853 (123) 4. Uncollectibles 1,803 1,738 (66) 5. Franchise Requirements (36,970) (35,624) 1, Unchanged Lead Lag requirements 384, , Total Lead-Lag Working Cash Requirement 396, ,748 (30,100) 8. Other Accounts Receivable (OAR) 82,027 73,323 (8,704) 9. Workers' Compensation (56,383) (61,680) (5,297) 10. Long-Term Incentive Plan (LTIP) (4,315) (5,244) (929) 11. Unchanged Operational Cash Requirement (66,311) (66,311) Total Operational Cash Requirement (44,982) (59,912) (14,930) 13. Total Working Cash Requirement 351, ,836 (45,030) 14. Unfunded Pension Reserves (76,201) (84,631) (8,429) 15. Total Changes in Rate Base 1/ (53,460) 1/ Excludes changes to Deferred Taxes A-49
72 Southern California Edison Working Cash Capital - Other Accounts Receivable Total Company (CPUC + FERC) $ in Thousands Line No. Account Account Description 2018 SCE SCE Change Other Accounts Receivable - Reconciliation Account 40,271,587 41,124,917 41,981,431 40,271,587 41,124,917 41,981, Accounts Receivable - Damage Claims Recon 15,743,115 16,076,702 16,411,533 15,743,115 16,076,702 16,411, Cal CDP Trust Receivable (97,576) (99,644) (101,719) (97,576) (99,644) (101,719) HCRA Trust Receivable - Prior Year 68,944 73,770 78,934 68,944 73,770 78, DCRA Trust Receivable - Prior Year 67,277 68,703 70,134 67,277 68,703 70, PBOP Trust Reimbursement Receivable 64,449,351 68,960,805 73,788,062 64,449,351 68,960,805 73,788, Employee Tools/Safety Receivable (57,168) (58,379) (59,595) (57,168) (58,379) (59,595) Medicare RX Reimbursements 196, , , , , , Pension Plan Trustee 1,168,048 1,192,798 1,217,641 1,168,048 1,192,798 1,217, OAR - Northern Trust - VEBA 628, , , , , , Total Other Accounts Receivable 122,438, ,191, ,266, ,438, ,191, ,266, Provision for Doubtful Accounts - CRE (7,392,986) (7,549,639) (7,706,876) (7,392,986) (7,549,639) (7,706,876) Provision for Doubtful Accounts - PWRD (908,895) (928,154) (947,485) (908,895) (928,154) (947,485) Provision for Doubtful Accounts - PMO (1,595,265) (1,629,068) (1,662,997) (1,595,265) (1,629,068) (1,662,997) Provision for Doubtful Accounts - Catalina Island (1,301) (1,328) (1,356) (1,301) (1,328) (1,356) Provision for Doubtful Accounts - Damage Claims (5,982,384) (6,109,147) (6,236,383) (5,982,384) (6,109,147) (6,236,383) Provision for Doubtful Accounts - Accruals (246,591,684) (251,816,811) (257,061,433) (246,591,684) (251,816,811) (257,061,433) Provision for Doubtful Accounts - Write Off 194,271, ,387, ,519, ,271, ,387, ,519, Total Provision for Doubtful Accounts (68,201,177) (69,646,318) (71,096,851) (68,201,177) (69,646,318) (71,096,851) Tax Rate 40.75% 40.75% 40.75% 27.98% 27.98% 27.98% % % % 21=19*20 Tax Adjustment 27,789,252 28,378,089 28,969,123 19,085,417 19,489,826 19,895,743 (8,703,834) (8,888,263) (9,073,380) 22= Total Other Accounts Receivable 82,026,834 86,923,710 92,139,058 73,323,000 78,035,447 83,065,678 (8,703,834) (8,888,263) (9,073,380) A-50
73 Southern California Edison Working Cash Capital - Workers Compensation Total Company (CPUC + FERC) $ in Thousands Line SCE-59 SCE-60 Change No. Item Expense 35,758 30,608 31,283 31,993 35,758 30,608 31,283 31, Less: Payments (51,374) (54,897) (56,311) (36,435) (51,374) (54,897) (56,311) (36,435) Net Expense (15,616) (24,289) (25,029) (4,442) (15,616) (24,289) (25,029) (4,442) Pre Tax Balance (107,299) (83,010) (57,981) (53,539) (107,299) (83,010) (57,981) (53,539) Tax Rate % % % % % % % % 0.000% % % % 6 After Tax Balance (63,579) (49,187) (34,356) (31,724) (63,579) (59,780) (41,756) (38,557) - (10,594) (7,400) (6,833) 7 Avg After Tax Balance (56,383) (41,771) (33,040) (61,680) (50,768) (40,156) (5,297) (8,997) (7,116) A-51
74 Southern California Edison Working Cash Capital - Long-Term Incentive Plan Total Company (CPUC + FERC) $ in Thousands SCE-59 SCE-60 Change Line No. Item Pre Tax 1 Stock Options (4,056) (10,947) (16,852) (4,056) (10,947) (16,852) Restricted Stock Units (1,612) (3,629) (4,545) (1,612) (3,629) (4,545) Performance Shares (1,614) (3,632) (4,550) (1,614) (3,632) (4,550) = (1:3) Pretax Total LTIP (7,282) (18,208) (25,948) (7,282) (18,208) (25,948) Tax Rate 40.75% 40.75% 40.75% 27.98% 27.98% 27.98% % % % After Tax 6=1*(1-tax rate) Stock Options (2,404) (6,486) (9,986) (2,921) (7,883) (12,136) (518) (1,397) (2,151) 7=2*(1-tax rate) Restricted Stock Units (955) (2,150) (2,693) (1,161) (2,613) (3,273) (206) (463) (580) 8=3*(1-tax rate) Performance Shares (956) (2,152) (2,696) (1,162) (2,616) (3,277) (206) (464) (581) 9= Pretax Total LTIP (4,315) (10,789) (15,375) (5,244) (13,113) (18,686) (929) (2,324) (3,311) A-52
75 Southern California Edison Working Cash Capital - Unfunded Pension Reserve Total Company (CPUC + FERC) $ in Thousands Line SCE SCE-59 SCE-60 Change No. Account Description Share Actuary Forecast EXECUTIVE RETIREMENT PLAN 99% (109,899) (117,949) (123,505) (124,835) (109,899) (117,949) (123,505) (124,835) SPECIAL PENSION PROV-ACCRUAL 100% EMPLMT AGRMT SURV BNFT 100% SPECIAL PEN PROV-SURV BEN-JFD 100% EXEC SURVIVOR BENEFIT 0% SURVIVOR INCOME CONTINUATION 100% (7,189) (6,786) (6,497) (6,189) (7,189) (6,786) (6,497) (6,189) EXEC 1985 DEF COMP DEATH BNFT 100% (6,545) (6,352) (6,163) (6,001) (6,545) (6,352) (6,163) (6,001) SUPPL SURV INC/RETIR INC 100% (2,832) (2,473) (2,088) (1,678) (2,832) (2,473) (2,088) (1,678) SUPPLEMENTAL LTD 100% Total Actuary Forecast (126,465) (133,560) (138,253) (138,703) (126,465) (133,560) (138,253) (138,703) Less: Non-SCE Share 1,363 1,460 1,526 1,541 1,363 1,460 1,526 1, Total SCE Long Term Incentives (125,102) (132,100) (136,727) (137,162) (125,102) (132,100) (136,727) (137,162) Tax Rate 40.75% 40.75% 40.75% 40.75% 40.75% 27.98% 27.98% 27.98% 0.00% % % % Tax Adjustment 50,974 53,826 55,711 55,888 50,974 36,967 38,262 38,383 - (16,859) (17,449) (17,505) Total LTIP Net of Tax (74,128) (78,275) (81,016) (81,274) (74,128) (95,133) (98,465) (98,778) - (16,859) (17,449) (17,505) Average (76,201) (79,645) (81,145) (84,631) (96,799) (98,622) (8,429) (17,154) (17,477) A-53
76 BONUS DEPRECIATION ELIGIBLE CAPITAL ADDITIONS A-54
77 Southern California Edison 2018 GRC Application Bonus Eligible Additions Bonus Eligible Additions Line No Specifics 1 Bonus Eligible Adds 812, ,740 1,123,112 2 Total Adds 835, ,017 1,275,187 3=1/2 Percent Eligible 97% 97% 88% Blanket Specifics 4 Bonus Eligible Adds 296, Total Adds 1,554,201 1,789,278 1,884,075 6=4/5 Percent Eligible 19% 0% 0% Blankets 7 Bonus Eligible Adds Total Adds 321, , ,866 9=7/8 Percent Eligible 0% 0% 0% Composite 10 Bonus Eligible Adds 1,108, ,740 1,123, Total Adds 2,711,077 3,024,220 3,475,128 12=10/11 Composite 41% 30% 32% A-55
78 CHAPTER VII ADDED FACILITIES A-56
79 Southern California Edison 2018 GRC Application Added Facilities Rates OOR Total Company $ in Thousands GRC CoC Update SCE-Financed SCE-Financed Customer-Financed FERC FERC FERC Added Facilities Rates: CoC Update (Avg) 1/ Application (Avg) 1/ Change Factor 96.90% 96.90% % Added Facilities OOR Forecast: Application 34,909 15,365 20,550 Change Factor 96.90% 96.90% % CoC Update 33,827 14,889 20,764 OOR Forecast Adjustment (1,082) (476) GRC Tax Update Testimony SCE-Financed SCE-Financed Customer-Financed FERC FERC FERC Added Facilities Rates: Tax Update Testimony (Avg) 1/ CoC Update (Avg) 1/ Change Factor 94.30% 94.30% 99.24% Added Facilities OOR Forecast: CoC Update 33,827 14,889 20,764 Change Factor 94.30% 94.30% 99.24% Tax Update Testimony 31,900 14,041 20,606 OOR Forecast Adjustment (1,927) (848) (158) 1/ Represents the simple average of rates across replacement coverage options SCE-Financed SCE-Financed Customer-Financed Total FERC FERC FERC Application OOR 34,909 15,365 20,550 70,824 Change (1,082) (476) 214 (1,344) CoC OOR 33,827 14,889 20,764 69,480 Change (1,927) (848) (158) (2,933) Tax Update OOR 31,900 14,041 20,606 66,547 Total OOR Change (3,009) (1,324) 56 (4,277) A-57
80 2018 GRC Application SCE Financed Customer Financed Replacement at Additional Cost Replacement for 20 Years at No Additional Cost Replacement (Perpetuity) at No Additional Cost Replacement at Additional Cost Replacement for 20 Years at No Additional Cost Replacement (Perpetuity) at No Additional Cost Line Rate (%) (%) (%) (%) (%) (%) No. Components (1) (2) (3) (4) (5) (6) 1 Overhead A&G, Ad Val., & Ins. 3 4 Return, Depreciation, 5 and Income Taxes Replacement Total Average O&M Annual Monthly One-Time- 16 Payment Factor GRC CoC Update CoC Update vs Application Variance ($) SCE Financed Customer Financed SCE Financed Customer Financed Replacement at Additional Cost Replacement for 20 Years at No Additional Cost Replacement (Perpetuity) at No Additional Cost Replacement at Additional Cost Replacement for 20 Years at No Additional Cost Replacement (Perpetuity) at No Additional Cost Replacement at Additional Cost Replacement for 20 Years at No Additional Cost Replacement (Perpetuity) at No Additional Cost Replacement at Additional Cost Replacement for 20 Years at No Add tional Cost Line Rate (%) (%) (%) (%) (%) (%) (%) (%) (%) (%) (%) (%) No. Components (1) (2) (3) (4) (5) (6) (1) (2) (3) (4) (5) (6) Replacement (Perpetuity) at No Additional Cost 1 Overhead A&G, (0.01) (0.00) 0.03 (0.01) (0.00) Ad Val., & Ins. 3 4 Return, Depreciation, 5 and Income Taxes (0.52) (0.52) (0.52) 6 7 Replacement Total (0.53) (0.51) (0.40) (0.01) Average O&M Annual (0.53) (0.50) (0.38) (0.01) Monthly (0.04) (0.04) (0.03) (0.00) One-Time- 16 Payment Factor (1.82) GRC Tax Reform Tax Reform vs CoC Update Variance ($) Tax Reform vs Application Variance ($) SCE Financed Customer Financed SCE Financed Customer Financed SCE Financed Customer Financed Replacement at Additional Cost Replacement for 20 Years at No Additional Cost Replacement (Perpetuity) at No Additional Cost Replacement at Additional Cost Replacement for 20 Years at No Additional Cost Replacement (Perpetuity) at No Additional Cost Replacement at Additional Cost Replacement for 20 Years at No Additional Cost Replacement (Perpetuity) at No Additional Cost Replacement at Additional Cost Replacement for 20 Years at No Add tional Cost Replacement (Perpetuity) at No Additional Cost Replacement at Additional Cost Replacement for 20 Years at No Additional Cost Replacement (Perpetu ty) at No Add tional Cost Replacement at Additional Cost Replacement for 20 Years at No Additional Cost Line Rate (%) (%) (%) (%) (%) (%) (%) (%) (%) (%) (%) (%) (%) (%) (%) (%) (%) (%) No. Components (1) (2) (3) (4) (5) (6) (1) (2) (3) (4) (5) (6) (1) (2) (3) (4) (5) (6) Replacement (Perpetuity) at No Additional Cost 1 Overhead A&G, (0.01) (0.00) 0.03 (0.01) (0.00) Ad Val., & Ins. 3 4 Return, Depreciation, 5 and Income Taxes (0.80) (0.80) (0.80) (1.32) (1.32) (1.32) 6 7 Replacement (0.02) (0.09) (0.02) (0.09) (0.00) (0.01) (0.00) (0.01) 8 9 Total (0.80) (0.82) (0.89) (0.02) (0.09) (1.33) (1.32) (1.30) (0.01) (0.00) Average O&M Annual (0.80) (0.82) (0.89) (0.02) (0.09) (1.33) (1.32) (1.27) (0.01) Monthly (0.07) (0.07) (0.07) (0.00) (0.01) (0.11) (0.11) (0.11) (0.00) One-Time- 16 Payment Factor (8.26) (11.59) (0.16) (1.20) (10.09) (9.19) A-58
81 SUPPLEMENTAL SUPPORT COMPARISON TABLES A-59
82 RATEBASE A-60
83 Southern California Edison 2018 GRC Rate Base Total Company (CPUC + FERC) Thousands of Dollars SCE-59 Line No. Item CPUC FERC Total CPUC FERC Total CPUC FERC Total FIXED CAPITAL 1 Plant in Service 37,503,632 9,033,513 46,537,145 40,162,597 9,655,938 49,818,535 42,814,546 10,308,900 53,123,446 2 Capitalized Software 1,133,514 76,304 1,209,818 1,181,706 79,548 1,261,255 1,488, ,220 1,589,016 3 Other Intangibles 212,643 14, , ,768 14, , ,736 15, ,797 4 Total Fixed Capital 38,849,789 9,124,132 47,973,921 41,566,071 9,750,415 51,316,486 44,527,078 10,424,182 54,951,259 ADJUSTMENTS 5 Customer Advances for Construction (72,308) (72,308) (79,137) (79,137) (84,762) (84,762) 7 Customer Deposits Total Adjustments (72,308) (72,308) (79,137) (79,137) (84,762) (84,762) WORKING CAPITAL 6 Materials & Supplies 212,650 14, , ,446 15, , ,643 15, ,438 7 Mountainview Emission Credits 4,861 4,861 4,284 4,284 3,734 3,734 8 Working Cash 329,674 22, , ,365 25, , ,667 28, ,120 9 Total Working Capital 547,185 36, , ,095 40, , ,045 44, ,293 DEDUCTIONS FOR RESERVES 10 Accumulated Depreciation Reserve (11,427,048) (1,748,611) (13,175,659) (11,965,497) (1,907,838) (13,873,335) (12,634,848) (2,086,231) (14,721,079) 11 Accumulated Amortization (624,838) (42,062) (666,900) (623,853) (41,996) (665,848) (751,377) (50,580) (801,957) 12 Accum. Def. Taxes - Plant (4,113,258) (1,747,278) (5,860,535) (4,276,618) (1,862,256) (6,138,874) (4,382,114) (1,979,393) (6,361,507) 13 Accum. Def. Taxes - Capitalized Interest 14 Accum. Def. Taxes - CIAC 124, , , , , , Accum. Def. Taxes - Vacation Accrual 15,016 1,011 16,027 13, ,544 12, , Unfunded Pension Reserve (71,395) (4,806) (76,201) (74,622) (5,023) (79,645) (76,027) (5,118) (81,145) 17 Total Deductions for Reserves (16,097,114) (3,541,746) (19,638,860) (16,783,345) (3,816,195) (20,599,541) (17,662,053) (4,120,501) (21,782,554) 18 RATE BASE 23,227,552 5,618,893 28,846,445 25,310,683 5,974,799 31,285,482 27,441,307 6,347,929 33,789,236 Plus: Legacy Meters Plus: Rate Base Adjustment Total Rate Base 23,227,552 5,618,893 28,846,445 25,310,683 5,974,799 31,285,482 27,441,307 6,347,929 33,789,236 A-61
84 Southern California Edison 2018 GRC Rate Base Total Company (CPUC + FERC) Thousands of Dollars Line No. FIXED CAPITAL 1 Plant in Service 2 Capitalized Software 3 Other Intangibles 4 Total Fixed Capital Item SCE CPUC FERC Total CPUC FERC Total CPUC FERC Total 37,503,632 9,033,513 46,537,145 40,162,597 9,655,938 49,818,535 42,814,546 10,308,900 53,123,446 1,133,514 76,304 1,209,818 1,181,706 79,548 1,261,255 1,488, ,220 1,589, ,643 14, , ,768 14, , ,736 15, ,797 38,849,789 9,124,132 47,973,921 41,566,071 9,750,415 51,316,486 44,527,078 10,424,182 54,951,259 ADJUSTMENTS 5 Customer Advances for Construction 7 Customer Deposits Total Adjustments WORKING CAPITAL 6 Materials & Supplies 7 Mountainview Emission Credits 8 Working Cash 9 Total Working Capital DEDUCTIONS FOR RESERVES 10 Accumulated Depreciation Reserve 11 Accumulated Amortization 12 Accum. Def. Taxes - Plant 13 Accum. Def. Taxes - Capitalized Interest 14 Accum. Def. Taxes - CIAC 15 Accum. Def. Taxes - Vacation Accrual 16 Unfunded Pension Reserve 17 Total Deductions for Reserves 18 RATE BASE Plus: Legacy Meters Plus: Rate Base Adjustment Total Rate Base (72,308) (72,308) (79,137) (79,137) (84,762) (84,762) (72,308) (72,308) (79,137) (79,137) (84,762) (84,762) 212,650 14, , ,446 15, , ,643 15, ,438 4,861 4,861 4,284 4,284 3,734 3, ,483 19, , ,164 21, , ,135 25, , ,995 33, , ,894 37, , ,512 41, ,695 (11,427,048) (1,748,611) (13,175,659) (11,965,497) (1,907,838) (13,873,335) (12,634,848) (2,086,231) (14,721,079) (624,838) (42,062) (666,900) (623,853) (41,996) (665,848) (751,377) (50,580) (801,957) (4,058,039) (1,728,971) (5,787,010) (4,051,416) (1,778,967) (5,830,383) (4,033,443) (1,827,787) (5,861,230) 121, , , , , ,771 12, ,350 8, ,425 7, ,377 (79,293) (5,338) (84,631) (90,694) (6,105) (96,799) (92,402) (6,220) (98,622) (16,055,494) (3,524,140) (19,579,634) (16,586,897) (3,734,311) (20,321,208) (17,348,449) (3,970,290) (21,318,739) 23,226,981 5,633,659 28,860,641 25,456,930 6,053,304 31,510,235 27,709,379 6,495,075 34,204,454 23,226,981 5,633,659 28,860,641 25,456,930 6,053,304 31,510,235 27,709,379 6,495,075 34,204,454 A-62
85 Southern California Edison 2018 GRC Rate Base Total Company (CPUC + FERC) Thousands of Dollars Line No. FIXED CAPITAL 1 Plant in Service 2 Capitalized Software 3 Other Intangibles 4 Total Fixed Capital Item Change CPUC FERC Total CPUC FERC Total CPUC FERC Total ADJUSTMENTS 5 Customer Advances for Construction 7 Customer Deposits Total Adjustments WORKING CAPITAL 6 Materials & Supplies 7 Mountainview Emission Credits 8 Working Cash 9 Total Working Capital DEDUCTIONS FOR RESERVES 10 Accumulated Depreciation Reserve 11 Accumulated Amortization 12 Accum. Def. Taxes - Plant 13 Accum. Def. Taxes - Capitalized Interest 14 Accum. Def. Taxes - CIAC 15 Accum. Def. Taxes - Vacation Accrual 16 Unfunded Pension Reserve 17 Total Deductions for Reserves 18 RATE BASE Plus: Legacy Meters Plus: Rate Base Adjustment Total Rate Base (42,190) (2,840) (45,030) (50,201) (3,379) (53,580) (45,533) (3,065) (48,598) (42,190) (2,840) (45,030) (50,201) (3,379) (53,580) (45,533) (3,065) (48,598) 55,218 18,307 73, ,202 83, , , , ,278 (3,193) (3,193) (7,886) (7,886) (14,344) (14,344) (2,508) (169) (2,677) (4,796) (323) (5,119) (4,348) (293) (4,641) (7,898) (532) (8,429) (16,072) (1,082) (17,154) (16,375) (1,102) (17,477) 41,620 17,606 59, ,448 81, , , , ,815 (570) 14,766 14, ,247 78, , , , ,218 (570) 14,766 14, ,247 78, , , , ,218 A-63
86 INCOME TAXES A-64
87 Southern California Edison 2018 GRC Income Taxes Total Company (CPUC + FERC) Thousands of Dollars Income Tax Adjustments SCE-59 SCE-60 Change California Income Tax Adjustments Tax Depreciation 1,678,443 1,733,478 1,862,613 1,678,443 1,733,478 1,862,613 Interest On Long-Term Debt 617, , , , , , ,813 8,891 Interest On Accumulated Deferred ITC (1,878) (1,693) (1,515) (1,878) (1,693) (1,515) Uniform Capitalization 201, , , , , ,403 Capitalized Software 51,477 43,706 24,864 51,477 43,706 24,864 Ad Valorem Lien Date Adjustment 8,547 12,061 13,147 8,547 13,536 14,608 1,475 1,461 Removal Costs 562, , , , , ,088 Amortization of Land Rights CIAC Revenues (269,318) (288,633) (304,702) (277,047) (291,320) (294,914) (7,729) (2,687) 9,788 Non Deductible Meals (2,102) (2,172) (2,217) (2,102) (2,172) (2,217) Excess Compensation 3,587 3,691 3,799 3,587 3,691 3,799 ESOP Dividends Leased Vehicles Repair Deduction 1,038,414 1,056,033 1,085,928 1,038,414 1,056,033 1,085,928 Total CCFT Adjustments 3,888,938 4,003,975 4,175,971 3,881,513 4,007,576 4,196,111 (7,425) 3,601 20,140 Federal Income Tax Adjustments Tax Depreciation 1,997,802 2,010,997 1,633,057 1,566,244 1,577,224 1,616,444 (431,559) (433,772) (16,613) Interest On Long-Term Debt 617, , , , , , ,813 8,891 Uniform Capitalization 201, , , , , ,403 Capitalized Software 51,477 43,706 24,864 51,477 43,706 24,864 Ad Valorem Lien Date Adjustment 8,547 12,061 13,147 8,547 13,536 14,608 1,475 1,461 Repair Deduction 1,038,414 1,056,033 1,085,928 1,038,414 1,056,033 1,085,928 Removal Costs 562, , , , , ,088 Amortization of Land Rights CIAC Revenues (268,278) (287,949) (304,363) (276,006) (290,636) (294,575) (7,728) (2,687) 9,788 Non Deductible Meals (2,102) (2,172) (2,217) (2,102) (2,172) (2,217) Excess Compensation 3,587 3,691 3,799 3,587 3,691 3,799 Leased Vehicles ESOP Dividends Preferred Dividend Deduction ,348 1,348 1, Section 199 Manufacturer's Deduction 19,217 21,015 23,038 (19,217) (21,015) (23,038) Total FIT Adjustments 4,231,241 4,305,695 3,972,114 3,773,581 3,855,047 3,953,143 (457,661) (450,648) (18,971) A-65
88 Southern California Edison 2018 GRC Income Taxes Total Company (CPUC + FERC) Thousands of Dollars California Corporation Franchise Tax Operating Revenues 6,769,689 7,306,534 7,926,830 6,523,217 7,015,159 7,590,688 (246,472) (291,375) (336,143) Operating Expenses 1,763,031 1,811,199 1,854,566 1,772,252 1,823,564 1,876,953 9,220 12,366 22,387 Taxes Other Than Income 391, , , , , ,016 1,475 4,412 Subtotal Expenses 2,154,986 2,226,008 2,297,169 2,164,206 2,239,849 2,323,969 9,220 13,841 26,799 Income Tax Adjustments 3,888,938 4,003,975 4,175,971 3,881,513 4,007,576 4,196,111 (7,425) 3,601 20,140 California Taxable Income 725,766 1,076,551 1,453, , ,734 1,070,608 (248,267) (308,816) (383,082) CCFT Tax Rate % % % % % % % % % CCFT 64,158 95, ,506 42,211 67,868 94,642 (21,947) (27,299) (33,864) California Alternate Minimum Tax Arizona Income Tax Rate Arizona Income Tax Total Other State State Income Taxes Total State Income Taxes 64,158 95, ,506 42,211 67,868 94,642 (21,947) (27,299) (33,864) Federal Income Tax Operating Revenues 6,769,689 7,306,534 7,926,830 6,523,217 7,015,159 7,590,688 (246,472) (291,375) (336,143) Operating Expenses 1,763,031 1,811,199 1,854,566 1,772,252 1,823,564 1,876,953 9,220 12,366 22,387 Taxes Other Than Income 391, , , , , ,016 1,475 4,412 Total State Income Taxes 64,158 95, ,506 42,211 67,868 94,642 (21,947) (27,299) (33,864) Less: Current Year's CCFT 64,158 95, ,506 42,211 67,868 94,642 (21,947) (27,299) (33,864) Plus: Prior Year's CCFT 64,036 64,158 95,167 64,035 42,211 67,868 (1) (21,947) (27,299) Subtotal - Expenses 2,219,022 2,290,166 2,392,336 2,228,241 2,282,060 2,391,837 9,219 (8,106) (500) Income Tax Adjustments (Sch M) 4,231,241 4,305,695 3,972,114 3,773,581 3,855,047 3,953,143 (457,661) (450,648) (18,971) Federal Taxable Income 319, ,673 1,562, , ,052 1,245, , ,379 (316,672) FIT Tax Rate 35.0% 35.0% 35.0% 21.0% 21.0% 21.0% (14.0%) (14.0%) (14.0%) Federal Income Tax 111, , , , , ,599 (2,306) (64,345) (285,234) Taxes Deferred-current (Plant) 282, , ,818 47,152 35,036 21,605 (235,722) (233,298) (100,213) Taxes Deferred-current (AFUDC Debt) Taxes Deferred-current (Cap. Int.) Contributions in Aid of Construction (39,053) (48,852) (73,686) (41,205) (45,756) (48,427) (2,152) 3,096 25,259 Investment Tax Credit Amortization (9,791) (9,456) (9,098) (9,791) (9,456) (9,098) Accrued Vacation 1,462 1,504 1,548 6,816 1,033 1,063 5,354 (471) (485) Total Federal Income Taxes 347, , , , , ,742 (234,826) (295,018) (360,673) Total Taxes-Income (State and Fed) 411, , , , , ,384 (256,773) (322,318) (394,537) A-66
89 Southern California Edison 2018 GRC Income Taxes Total Company (CPUC + FERC) Thousands of Dollars Additional Detail Supporting Variances SCE-59 SCE-60 Change Contributions in Aid of Construction (Federal) CIAC Taxable Income CIAC Taxable Income 246, , , , , ,653 Net ITCC Collected End of Year Balance 731, , , , , ,327 (7,922) (37,715) Beginning of Year Balance (669,028) (731,948) (803,248) (669,028) (731,948) (795,325) 7,922 Reverse Book Income (Other Operating Revenue) (41,611) (46,808) (59,085) (33,882) (36,199) (39,080) 7,729 10,609 20,005 Total CIAC 268, , , , , ,575 7,729 2,687 (9,788) Section 199 Deduction Other Generation - Net Rate Base 2,240,533 2,261,724 2,285,989 2,239,469 2,276,159 2,311,715 (1,064) 14,435 25,726 After- Tax Rate of Return on Equity 5.54% 5.54% 5.54% 5.54% 5.54% 5.47% 5.54% 5.54% 5.47% Return on Equity 124, , , , , ,400 (59) 800 (244) Composite Tax Rate 40.75% 40.75% 40.75% 27.98% 27.98% 27.98% 27.98% 27.98% 27.98% Pre-Tax Book Income on Return on Equity 209, , , , , ,516 (37,204) (36,363) (38,214) Other Generation - Annual Book Depreciation 131, , , , , ,234 Other Generation - Annual Tax Depreciation (108,753) (97,305) (83,746) (93,916) (87,438) (85,525) 14,837 9,867 (1,778) Generation - Repairs Deduction (18,525) (16,177) (13,238) (18,525) (16,177) (13,238) Preliminary QPA/Limitation - Gross 213, , , , , ,988 (22,367) (26,495) (39,992) 199 Rate 9.0% 9.0% 9.0% Preliminary 199 (Deduction) 19,217 21,015 23,038 (19,217) (21,015) (23,038) Federal Taxable Income/(Loss) Before 199 (Deduction) 338, ,688 1,585, , ,052 1,245, , ,364 (339,710) 199 Rate 9.0% 9.0% 9.0% Preliminary 199 (Deduction) 30,478 65, ,688 (30,478) (65,852) (142,688) 199 (Deduction) 19,217 21,015 23,038 (19,217) (21,015) (23,038) Investment Tax Credit Amortization Federal Income Tax 111, , , , , ,599 (2,306) (64,345) (285,234) Total Amortization (10,385) (10,039) (9,669) (10,385) (10,039) (9,669) Less: CTC Related Amortization (594) (583) (571) (594) (583) (571) Net Amortization (9,791) (9,456) (9,098) (9,791) (9,456) (9,098) ITC Factor 78.9% 78.9% 78.9% 78.9% 78.9% 78.9% 78.9% 78.9% 78.9% ITC Amortization (7,723) (7,459) (7,176) (7,723) (7,459) (7,176) Annual ITC Amortization (9,791) (9,456) (9,098) (9,791) (9,456) (9,098) FERC Taxes Based on Income Taxes Based on Income Rate Base 5,618,893 5,974,799 6,347,929 5,633,659 6,053,304 6,495,075 14,766 78, ,146 Rate of Return on Rate Base 5.47% 5.47% 5.47% 5.47% 5.47% 5.47% 5.47% 5.47% 5.47% Return on Rate Base 307, , , , , , ,293 8,046 Book Depreciation on AFUDC 2,403 2,565 2,766 2,403 2,565 2,766 0 ESOP Dividend Deduction Preferred Dividend Deduction (158) (154) (152) (263) (259) (256) (106) (104) (104) Non-Deductible Meals Total Adjustments to Calculate Income Tax 309, , , , , , ,188 7,942 Tax Gross Up Composite Rate 40.75% 40.75% 40.75% 27.98% 27.98% 27.98% 27.98% 27.98% 27.98% FERC Taxes Based on Income 212, , , , , ,028 (92,322) (96,838) (101,543) A-67
90 WORKING CASH A-68
91 Southern California Edison 2018 GRC Working Cash Total Company (CPUC + FERC) Thousands of Dollars Line Item Line Item SCE-59 SCE-59 SCE-59 SCE-60 SCE-60 SCE-60 Change Change Change A Franchise Req. -- GRC (36,970) (39,902) (43,289) (35,624) (38,310) (41,453) 1,346 1,591 1,836 B Uncollectibles -- GRC 1,803 1,946 2,111 1,738 1,869 2,022 (66) (78) (90) C Ad Valorem Taxes - California 9,794 10,453 11,230 9,794 10,499 11, D Federal Income Tax 5,976 13,295 29,229 5,853 9,856 13,983 (123) (3,439) (15,246) E Income Tax Deferred 34,883 33,090 15,022 5,815 4,320 2,664 (29,068) (28,769) (12,358) F California State Corporation Franchise Tax 6,400 9,493 12,819 4,211 6,770 9,441 (2,189) (2,723) (3,378) Other Working Cash Components Working Cash Required 396, , , , , ,280 (30,100) (33,372) (29,097) Operational Cash Requirement (44,982) (31,490) (22,257) (59,912) (51,698) (41,758) (14,930) (20,209) (19,501) Total Cash Working Capital Requirement 351, , , , , ,522 (45,030) (53,580) (48,598) Total Working Cash Average Days Lag in Collection of Revenues Average Days Lag in Payment of Expenses Net Avg. Days Lag (0.71) (0.69) (0.40) Amount of Payments for Expenses 10,796,632 11,383,227 12,333,709 10,533,871 11,056,465 11,915,011 (262,761) (326,761) (418,698) Average Daily Expenses 29,580 31,187 33,791 28,860 30,292 32,644 (720) (895) (1,147) Working Cash Required 396, , , , , ,280 (30,100) (33,372) (29,097) A Franchise Fees 61,902 66,811 72,483 59,648 64,147 69,409 (2,254) (2,664) (3,074) (6) (7) (8) (Lag Estimate - Avg. Lag in Rev. Collection) (218) (218) (218) (218) (218) (218) Franchise Fees (36,970) (39,902) (43,289) (35,624) (38,310) (41,453) 1,346 1,591 1,836 B Uncollectibles 14,623 15,782 17,122 14,090 15,153 16,396 (532) (629) (726) (1) (2) (2) (Lag Estimate - Avg. Lag in Rev. Collection) Uncollectibles 1,803 1,946 2,111 1,738 1,869 2,022 (66) (78) (90) C Ad Valorem Taxes - California 310, , , , , ,535 1,475 4,412 / x (Lag Estimate - Avg. Lag in Rev. Collection) Ad Valorem Taxes - California 9,794 10,453 11,230 9,794 10,499 11, D Federal Income Tax 111, , , , , ,599 (2,306) (64,345) (285,234) / (6) (176) (781) x (Lag Estimate - Avg. Lag in Rev. Collection) Federal Income Tax 5,976 13,295 29,229 5,853 9,856 13,983 (123) (3,439) (15,246) E Income Tax Deferred Income Tax Expense/(Benefit) - Current Fed Property Related Deferred Tax 282, , ,818 47,152 35,036 21,605 (235,722) (233,298) (100,213) Income Tax Deferred 282, , ,818 47,152 35,036 21,605 (235,722) (233,298) (100,213) / (646) (639) (275) x (Lag Estimate - Avg. Lag in Rev. Collection) Income Tax Deferred 34,883 33,090 15,022 5,815 4,320 2,664 (29,068) (28,769) (12,358) F State Income Tax 64,158 95, ,506 42,211 67,868 94,642 (21,947) (27,299) (33,864) / (60) (75) (93) x (Lag Estimate - Avg. Lag in Rev. Collection) State Income Tax 6,400 9,493 12,819 4,211 6,770 9,441 (2,189) (2,723) (3,378) Working Cash Required (30,100) (33,372) (29,097) A-69
92 CHAPTER VIII RATEMAKING CONSIDERATIONS A-70
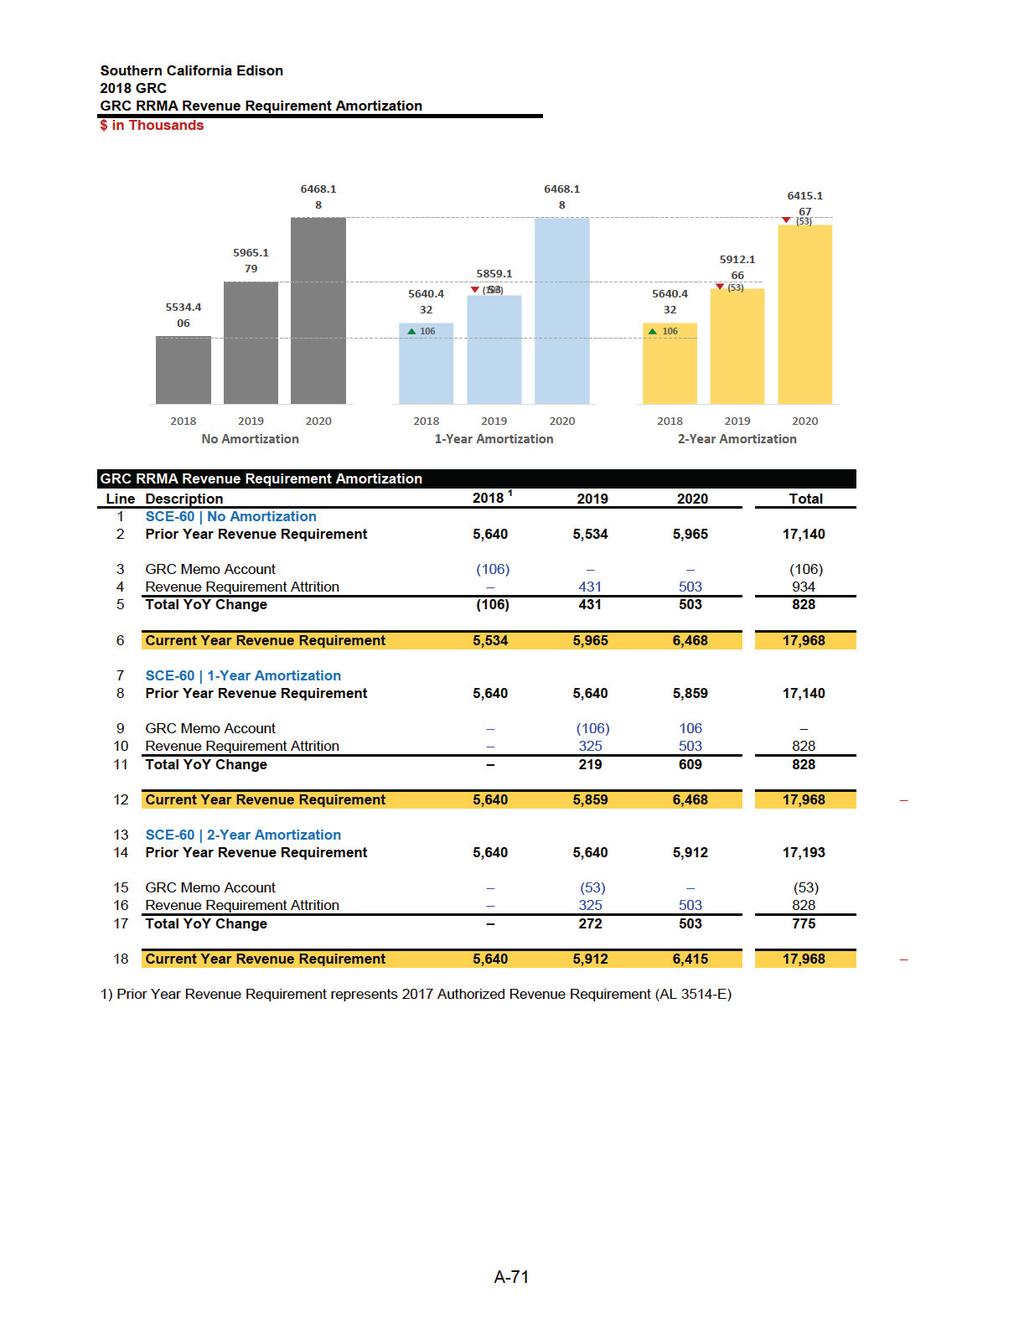
93
2015 General Rate Case
 Application No.: Exhibit No.: Witnesses: A.13-11-003 SCE-73 T. Cameron R. Fisher G. Henry C. Hu M. Marelli D. Snow P. Wong (U 338-E) 2015 General Rate Case PUBLIC VERSION Update Testimony Before the Public
2018 General Rate Case
 Application No.: Exhibit No.: Witnesses: A.16-09-001 SCE-59 B. Anderson D. Bernaudo T. Cameron M. Childs D. Gunn T. Guntrip G. Henry C. Jacobs D. Kempf S. Menon D. Tessler (U 338-E) 2018 General Rate Case
(U 338-E) 2015 General Rate Case A Workpapers
 2015 General Rate Case A Workpapers") (U 338-E) 2015 General Rate Case A.13-11-003 Workpapers Results of Operations (RO) Plant, Taxes, Depreciation Expense and Reserve, Rate Base, and Productivity SCE-10 Volume 02, Chapter IV Revision 1 April
(U 338-E) 2015 General Rate Case A.13-11-003 Workpapers Results of Operations (RO) Plant, Taxes, Depreciation Expense and Reserve, Rate Base, and Productivity SCE-10 Volume 02, Chapter IV Revision 1 April
2018 General Rate Case
 Application No.: A.1-0- Exhibit No.: SCE-0, Vol. Witnesses: M. Childs D. Gunn P. Hunt D. Lee J. McCarson (U -E) 01 General Rate Case Public Version Before the Public Utilities Commission of the State of
2018 General Rate Case. Tax Update Rebuttal
 Application No.: Exhibit No.: Witnesses: A.16-09-001 SCE-61 M. Childs J. McCarson S. Menon (U 338-E) 2018 General Rate Case Tax Update Rebuttal Before the Public Utilities Commission of the State of California
REVISED WORKPAPERS TO PREPARED DIRECT TESTIMONY OF RONALD M. VAN DER LEEDEN ON BEHALF OF SOUTHERN CALIFORNIA GAS COMPANY
 Application of SOUTHERN CALIFORNIA GAS ) COMPANY for authority to update its gas revenue ) requirement and base rates ) effective January 1, 2016 (U 904-G) ) Application No. 14-11-004 Exhibit No.: (SCG-35-R-WP)
SECOND REVISED SDG&E DIRECT TESTIMONY OF RAGAN G. REEVES (TAXES) April 6, 2018 BEFORE THE PUBLIC UTILITIES COMMISSION OF THE STATE OF CALIFORNIA
 April 6, 2018 BEFORE THE PUBLIC UTILITIES COMMISSION OF THE STATE OF CALIFORNIA") Company: San Diego Gas & Electric Company (U 0 M) Proceeding: 01 General Rate Case Application: A.1--00 Exhibit: SDG&E--R SECOND REVISED SDG&E DIRECT TESTIMONY OF RAGAN G. REEVES (TAXES) April, 01 BEFORE
Company: San Diego Gas & Electric Company (U 0 M) Proceeding: 01 General Rate Case Application: A.1--00 Exhibit: SDG&E--R SECOND REVISED SDG&E DIRECT TESTIMONY OF RAGAN G. REEVES (TAXES) April, 01 BEFORE
PREPARED DIRECT TESTIMONY OF RANDALL G. ROSE ON BEHALF OF SOUTHERN CALIFORNIA GAS COMPANY
 Application of Southern California Gas Company (U0G) for authority to update its gas revenue requirement and base rates effective on January 1, 01. Application -1- Exhibit No.: (SCG-) PREPARED DIRECT TESTIMONY
Company: Southern California Gas Company (U 904 G) Proceeding: 2019 General Rate Case Application: A Exhibit: SCG-37-2R SECOND REVISED
 Proceeding: 2019 General Rate Case Application: A Exhibit: SCG-37-2R SECOND REVISED") Company: Southern California Gas Company (U 0 G) Proceeding: 01 General Rate Case Application: A.1--00 Exhibit: SCG--R SECOND REVISED SOCALGAS DIRECT TESTIMONY OF RAGAN G. REEVES (TAXES) April, 01 BEFORE
Company: Southern California Gas Company (U 0 G) Proceeding: 01 General Rate Case Application: A.1--00 Exhibit: SCG--R SECOND REVISED SOCALGAS DIRECT TESTIMONY OF RAGAN G. REEVES (TAXES) April, 01 BEFORE
Company: Southern California Gas Company (U 904 G) Proceeding: 2019 General Rate Case Application: A Exhibit: SCG-37 SOCALGAS
 Proceeding: 2019 General Rate Case Application: A Exhibit: SCG-37 SOCALGAS") Company: Southern California Gas Company (U 0 G) Proceeding: 01 General Rate Case Application: A.1-- Exhibit: SCG- SOCALGAS DIRECT TESTIMONY OF RAGAN G. REEVES (TAXES) October, 01 BEFORE THE PUBLIC UTILITIES
Company: Southern California Gas Company (U 0 G) Proceeding: 01 General Rate Case Application: A.1-- Exhibit: SCG- SOCALGAS DIRECT TESTIMONY OF RAGAN G. REEVES (TAXES) October, 01 BEFORE THE PUBLIC UTILITIES
(U 338-E) 2018 General Rate Case A Workpapers REVISED. RO- Rate Base SCE-09 Volume 02, Chapter IV, Book A
 2018 General Rate Case A Workpapers REVISED. RO- Rate Base SCE-09 Volume 02, Chapter IV, Book A") (U 338-E) 2018 General Rate Case A.16-09-001 Workpapers REVISED RO- Rate Base SCE-09 Volume 02, Chapter IV, Book A September 2016 1 SCE-9, VOLUME 2, CHAPTER IV Rate Base Overview Witness: David Gunn Adjustments
(U 338-E) 2018 General Rate Case A.16-09-001 Workpapers REVISED RO- Rate Base SCE-09 Volume 02, Chapter IV, Book A September 2016 1 SCE-9, VOLUME 2, CHAPTER IV Rate Base Overview Witness: David Gunn Adjustments
REVISED PREPARED DIRECT TESTIMONY OF RANDALL G. ROSE ON BEHALF OF SOUTHERN CALIFORNIA GAS COMPANY
 Application of San Diego Gas & Electric Company (U0M) for Authority, Among Other Things, to Increase Rates and Charges for Electric and Gas Service Effective on January 1, 0. A.--00 (Filed December 1,
2015 General Rate Case
 Application No.: Exhibit No.: SCE-, Vol. 0, Revision 1 Witnesses: J. Carrillo M. Childs P. Wong R. Fisher P. Hunt D. Lee K. Shimmel R. Worden (U -E) 01 General Rate Case Public Version ERRATA Results of
PRELIMINARY STATEMENT Sheet 1. J. Pole Loading and Deteriorated Pole Programs Balancing Account
 Southern California Edison Revised Cal. PUC Sheet No. 60654-E Rosemead, California (U 338-E) Cancelling Original Cal. PUC Sheet No. 57949-E PRELIMINARY STATEMENT Sheet 1 J. Pole Loading and Deteriorated
PREPARED DIRECT TESTIMONY OF JACK S. LEWIS ON BEHALF OF SOUTHERN CALIFORNIA GAS COMPANY
 Application of Southern California Gas Company for authority to update its gas revenue requirement and base rates effective on January 1, 01. (U0G) Application -1- Exhibit No.: (SCG-) PREPARED DIRECT TESTIMONY
REVISED PREPARED DIRECT TESTIMONY OF JACK S. LEWIS ON BEHALF OF SOUTHERN CALIFORNIA GAS COMPANY
 Application of San Diego Gas & Electric Company (U0M) for Authority, Among Other Things, to Increase Rates and Charges for Electric and Gas Service Effective on January, 0. A.0--00 (Filed December, 00)
Southern California Edison Company s Supplemental Exhibit in Response to Administrative Law Judge s May 6, Ruling
 Application No.: Exhibit No.: Witnesses: A.1-11-00 SCE- Douglas Snow Melvin Stark (U -E) Southern California Edison Company s Supplemental Exhibit in Response to Administrative Law Judge s May, 01 Email
SECOND REVISED SOCALGAS DIRECT TESTIMONY OF KAREN C. CHAN (WORKING CASH) APRIL 6, 2018
 APRIL 6, 2018") Company: Southern California Gas Company (U 0 G) Proceeding: 01 General Rate Case Application: A.1--00 Exhibit: SCG--R SECOND REVISED SOCALGAS DIRECT TESTIMONY OF KAREN C. CHAN (WORKING CASH) APRIL, 01
Company: Southern California Gas Company (U 0 G) Proceeding: 01 General Rate Case Application: A.1--00 Exhibit: SCG--R SECOND REVISED SOCALGAS DIRECT TESTIMONY OF KAREN C. CHAN (WORKING CASH) APRIL, 01
SECOND REVISED SDG&E DIRECT TESTIMONY OF KENNETH J. DEREMER (POST-TEST YEAR RATEMAKING) April 6, 2018
 April 6, 2018") Company: San Diego Gas & Electric Company (U 0 M) Proceeding: 01 General Rate Case Application: A.1--00 Exhibit: SDG&E--R SECOND REVISED SDG&E DIRECT TESTIMONY OF KENNETH J. DEREMER (POST-TEST YEAR RATEMAKING)
Company: San Diego Gas & Electric Company (U 0 M) Proceeding: 01 General Rate Case Application: A.1--00 Exhibit: SDG&E--R SECOND REVISED SDG&E DIRECT TESTIMONY OF KENNETH J. DEREMER (POST-TEST YEAR RATEMAKING)
Southern California Edison Revised Cal. PUC Sheet No E Rosemead, California (U 338-E) Cancelling Revised Cal. PUC Sheet No.
 Cancelling Revised Cal. PUC Sheet No.") Southern California Edison Revised Cal. PUC Sheet No. 56089-E Rosemead, California (U 338-E) Cancelling Revised Cal. PUC Sheet No. 56203-E PRELIMINARY STATEMENT Sheet 2 N. MEMORANDUM ACCOUNTS 2. Definitions.
Southern California Edison Revised Cal. PUC Sheet No. 56089-E Rosemead, California (U 338-E) Cancelling Revised Cal. PUC Sheet No. 56203-E PRELIMINARY STATEMENT Sheet 2 N. MEMORANDUM ACCOUNTS 2. Definitions.
SOCALGAS DIRECT TESTIMONY OF RYAN HOM (UPDATED RESULTS OF OPERATIONS REPORT) January 2018
 January 2018") Company: Southern California Gas Company (U 904 G) Proceeding: 2019 General Rate Case Application: A.17-10-008 Exhibit: SCG-48 SOCALGAS DIRECT TESTIMONY OF RYAN HOM (UPDATED RESULTS OF OPERATIONS REPORT)
Company: Southern California Gas Company (U 904 G) Proceeding: 2019 General Rate Case Application: A.17-10-008 Exhibit: SCG-48 SOCALGAS DIRECT TESTIMONY OF RYAN HOM (UPDATED RESULTS OF OPERATIONS REPORT)
Supplemental Information
 Application No: Exhibit No: Witnesses: A.1-0-01 SCE- P. T. Hunt D. Snow (U -E) Supplemental Information Before the Public Utilities Commission of the State of California Rosemead, California June, 01 01
SECOND REVISED SOCALGAS DIRECT TESTIMONY OF JAWAAD A. MALIK (POST-TEST YEAR RATEMAKING) April 6, 2018
 April 6, 2018") Company: Southern California Gas Company (U 0 G) Proceeding: 01 General Rate Case Application: A.1--00 Exhibit: SCG--R SECOND REVISED SOCALGAS DIRECT TESTIMONY OF JAWAAD A. MALIK (POST-TEST YEAR RATEMAKING)
Company: Southern California Gas Company (U 0 G) Proceeding: 01 General Rate Case Application: A.1--00 Exhibit: SCG--R SECOND REVISED SOCALGAS DIRECT TESTIMONY OF JAWAAD A. MALIK (POST-TEST YEAR RATEMAKING)
APPENDIX IX ATTACHMENT 1 FORMULA RATE PROTOCOLS
 APPENDIX IX ATTACHMENT 1 FORMULA RATE PROTOCOLS 1. INTRODUCTION SCE shall calculate its Base Transmission Revenue Requirement ( Base TRR ), as defined in Section 3.6 of the main definitions section of
UPDATE TESTIMONY OF SOUTHERN CALIFORNIA GAS COMPANY AND SAN DIEGO GAS & ELECTRIC COMPANY AUGUST 2018
 Company: Southern California Gas Company (U904G) San Diego Gas & Electric Company (U902M) Proceeding: 2019 General Rate Case Application: A.17-10-007/-008 (cons.) Exhibit: UPDATE TESTIMONY OF SOUTHERN
SDG&E DIRECT TESTIMONY OF STEVEN P. DAIS (WORKING CASH) October 6, 2017 BEFORE THE PUBLIC UTILITIES COMMISSION OF THE STATE OF CALIFORNIA
 October 6, 2017 BEFORE THE PUBLIC UTILITIES COMMISSION OF THE STATE OF CALIFORNIA") Company: San Diego Gas & Electric Company (U 0 M) Proceeding: 01 General Rate Case Application: A.1-- Exhibit: SDG&E- SDG&E DIRECT TESTIMONY OF STEVEN P. DAIS (WORKING CASH) October, 01 BEFORE THE PUBLIC
Company: San Diego Gas & Electric Company (U 0 M) Proceeding: 01 General Rate Case Application: A.1-- Exhibit: SDG&E- SDG&E DIRECT TESTIMONY OF STEVEN P. DAIS (WORKING CASH) October, 01 BEFORE THE PUBLIC
Errata to SCE-36: Testimony of Southern California Edison Company Responding to Certain Issues Identified in July 1, 2013 ALJ Ruling
 Investigation No.: 1-10-01 Exhibit No.: SCE- Witnesses: Doug Bauder Rick Fisher (U 8-E) Errata to SCE-6: Testimony of Southern California Edison Company Responding to Certain Issues Identified in July
TURN DATA REQUEST-058 SDG&E-SOCALGAS 2019 GRC A /8 SDG&E_SOCALGAS RESPONSE DATE RECEIVED: APRIL 23, 2018 DATE RESPONDED: MAY 7, 2018
 Exhibit Reference: SCG -37 Witnesses: Reeves Subject: ADIT, ARAM, AMI meters, Property Taxes, Franchise Fees, etc. 1. Regarding detail on individual components of accumulated deferred income taxes, please
SOCALGAS DIRECT TESTIMONY OF GARRY G. YEE RATE BASE. November 2014
 Company: Southern California Gas Company (U 0 G) Proceeding: 01 General Rate Case Application: A.1-- Exhibit: SCG- SOCALGAS DIRECT TESTIMONY OF GARRY G. YEE RATE BASE November 01 BEFORE THE PUBLIC UTILITIES
PREPARED DIRECT TESTIMONY OF KHAI NGUYEN ON BEHALF OF SOUTHERN CALIFORNIA GAS COMPANY
 Application of Southern California Gas Company for authority to update its gas revenue requirement and base rates effective on January 1, 2016. (U904G) Application 14-11-004 Exhibit No.: (SCG-40) PREPARED
PREPARED DIRECT TESTIMONY OF JONATHAN B. ATUN CHAPTER 4 ON BEHALF OF SAN DIEGO GAS & ELECTRIC COMPANY
 Application No. A.1-0- Exhibit No.: Witness: Jonathan B. Atun Application of SAN DIEGO GAS & ELECTRIC ) COMPANY (U 0 E) For Approval of its ) Application No. 1-0- Electric Vehicle-Grid Integration Pilot
Exhibit A Affidavit of Alan Varvis
 Affidavit of Alan Varvis Page 1 of 9 UNITED STATES OF AMERICA BEFORE THE FEDERAL ENERGY REGULATORY COMMISSION Southern California Edison Company ) Docket No. ER16- -000 AFFIDAVIT OF ALAN VARVIS FOR SOUTHERN
2015 General Rate Case
 Application No.: Exhibit No.: SCE-0, Vol. 01, Pt. 1 Witnesses: A. Herrera G. Huckaby (U -E) 01 General Rate Case Financial, Legal, and Operational Services (FL&OS) Volume 1, Part 1 Financial Services Department
Attachment 2 to Appendix IX Formula Rate Spreadsheet
 Attachment 2 to Appendix IX Formula Rate Spreadsheet Table of Contents Worksheet Name Schedule Purpose Overview Base TRR Components. BaseTRR 1 Full Development of Retail and Wholesale Base TRRs IFPTRR
Attachment 2 to Appendix IX Formula Rate Spreadsheet
 Attachment 2 to Appendix IX Formula Rate Spreadsheet Table of Contents Worksheet Name Schedule Purpose Overview Base TRR Components. BaseTRR 1 Full Development of Retail and Wholesale Base TRRs IFPTRR
Fourth Quarter and Full Year 2017 Financial Results
 Fourth Quarter and Full Year 2017 Financial Results February 22, 2018 Forward-Looking Statements Statements contained in this presentation about future performance, including, without limitation, operating
Attachment 2 to Appendix IX Formula Rate Spreadsheet
 Attachment 2 to Appendix IX Formula Rate Spreadsheet Table of Contents Worksheet Name Schedule Purpose Overview Base TRR Components. BaseTRR 1 Full Development of Retail and Wholesale Base TRRs IFPTRR
Attachment 2 to Appendix IX Formula Rate Spreadsheet
 Attachment 2 to Appendix IX Formula Rate Spreadsheet Table of Contents Worksheet Name Schedule Purpose Overview Base TRR Components. BaseTRR 1 Full Development of Retail and Wholesale Base TRRs IFPTRR
Attachment 2 to Appendix IX Formula Rate Spreadsheet
 Attachment 2 to Appendix IX Formula Rate Spreadsheet Table of Contents Worksheet Name Schedule Purpose Overview Base TRR Components. BaseTRR 1 Full Development of Retail and Wholesale Base TRRs IFPTRR
REVISED SOCALGAS DIRECT TESTIMONY OF RONALD M. VAN DER LEEDEN POST-TEST YEAR RATEMAKING. March 2015
 Company: Southern California Gas Company (U 0 G) Proceeding: 01 General Rate Case Application: A.1--00 Exhibit: SCG--R REVISED SOCALGAS DIRECT TESTIMONY OF RONALD M. VAN DER LEEDEN POST-TEST YEAR RATEMAKING
(U 338-E) 2018 General Rate Case A Workpapers. RO-Cost Escalation SCE-09 Volume 01, Chapter VII
 2018 General Rate Case A Workpapers. RO-Cost Escalation SCE-09 Volume 01, Chapter VII") (U 338-E) 208 General Rate Case A.6-09- Workpapers RO-Cost Escalation SCE-09 Volume 0, Chapter VII September 206 Workpaper Southern California Edison / 208 GRC 2 3 4 5 6 7 8 9 0 2 3 4 5 6 7 8 9 20 2 22
(U 338-E) 208 General Rate Case A.6-09- Workpapers RO-Cost Escalation SCE-09 Volume 0, Chapter VII September 206 Workpaper Southern California Edison / 208 GRC 2 3 4 5 6 7 8 9 0 2 3 4 5 6 7 8 9 20 2 22
SOUTHERN CALIFORNIA GAS COMPANY ADVANCED METERING INFRASTRUCTURE CHAPTER VII SOCALGAS AMI BUSINESS CASE MODELING METHODOLOGY AND REVENUE REQUIREMENT
 Application No.: A.08-09-023 Exhibit No.: SCG 7 Date: March 6, 2009 Witness: Michael W. Foster SOUTHERN CALIFORNIA GAS COMPANY ADVANCED METERING INFRASTRUCTURE CHAPTER VII SOCALGAS AMI BUSINESS CASE MODELING
CHAPTER VII DIRECT TESTIMONY OF PATRICK MOERSEN (OVERHEADS) ON BEHALF OF SOUTHERN CALIFORNIA GAS COMPANY AND SAN DIEGO GAS & ELECTRIC COMPANY
 ON BEHALF OF SOUTHERN CALIFORNIA GAS COMPANY AND SAN DIEGO GAS & ELECTRIC COMPANY") Application No: A.1--XXX Exhibit No.: Witness: P. Moersen Application of Southern California Gas Company (U 0 G) and San Diego Gas & Electric Company (U 0 G) for Review of Costs Incurred in Executing Pipeline
Application No: A.1--XXX Exhibit No.: Witness: P. Moersen Application of Southern California Gas Company (U 0 G) and San Diego Gas & Electric Company (U 0 G) for Review of Costs Incurred in Executing Pipeline
UNITED STATES OF AMERICA BEFORE THE FEDERAL ENERGY REGULATORY COMMISSION EXHIBIT SCE-4 EXHIBIT TO THE TESTIMONY OF MR. BERTON J.
 UNITED STATES OF AMERICA BEFORE THE FEDERAL ENERGY REGULATORY COMMISSION ) Southern California Edison Company ) ) Dkt. No. ER18- -000 EXHIBIT SCE-4 EXHIBIT TO THE TESTIMONY OF MR. BERTON J. HANSEN ON BEHALF
September 1, Southern California Edison Company/ Docket No. ER
 Anna J. Valdberg Senior Attorney anna.valdberg@sce.com September 1, 2011 Ms. Kimberly D. Bose, Secretary Federal Energy Regulatory Commission 888 First Street, N.E. Washington, DC 20426 Re: Southern California
UNITED STATES OF AMERICA BEFORE THE FEDERAL ENERGY REGULATORY COMMISSION. ) Southern California Edison ) Docket No. ER Company )
 Southern California Edison ) Docket No. ER Company )") UNITED STATES OF AMERICA BEFORE THE FEDERAL ENERGY REGULATORY COMMISSION ) Southern California Edison ) Docket No. ER12-239-000 Company ) SOUTHERN CALIFORNIA EDISON COMPANY S REQUEST FOR LEAVE AND RESPONSE
UNITED STATES OF AMERICA BEFORE THE FEDERAL ENERGY REGULATORY COMMISSION ) Southern California Edison ) Docket No. ER12-239-000 Company ) SOUTHERN CALIFORNIA EDISON COMPANY S REQUEST FOR LEAVE AND RESPONSE
BEFORE THE PENNSYLVANIA PUBLIC UTILITY COMMISSION. PENNSYLVANIA PUBLIC UTILITY COMMISSION v. PECO ENERGY COMPANY ELECTRIC DIVISION
 PECO ENERGY COMPANY STATEMENT NO. BEFORE THE PENNSYLVANIA PUBLIC UTILITY COMMISSION PENNSYLVANIA PUBLIC UTILITY COMMISSION v. PECO ENERGY COMPANY ELECTRIC DIVISION DOCKET NO. R-0-000 DIRECT TESTIMONY WITNESS:
Michigan Public Service Commission The Detroit Edison Company Projected Net Operating Income "Total Electric" and "Jurisdictional Electric"
 Projected Net Operating Income Schedule: C1 "Total Electric" and "Jurisdictional Electric" Witness: T. M. Uzenski Projected 12 Month Period Ending March 31, 2012 Page: 1 of 1 ($000) (a) (b) (c) Historical
Business Update Supplement SCE 2015 General Rate Case Decision
 Business Update Supplement SCE 2015 General Rate Case Decision November 9, 2015 Forward-Looking Statements Statements contained in this presentation about future performance, including, without limitation,
PUBLIC VERSION WORKPAPERS TO PREPARED DIRECT TESTIMONY OF KAREN C. CHAN BEFORE THE PUBLIC UTILITIES COMMISSION OF THE STATE OF CALIFORNIA
 Application of SOUTHERN CALIFORNIA GAS ) COMPANY for authority to update its gas revenue ) requirement and base rates ) effective January 1, 2019 (U 904-G) ) Application No. 17-10- Exhibit No.: (SCG-38-WP)
SOCALGAS / SDG&E DIRECT TESTIMONY OF JAMES VANDERHYE (SHARED SERVICES & SHARED ASSETS BILLING, SEGMENTATION & CAPITAL REASSIGNMENTS)
") Company: Southern California Gas Company (U 0 M) / San Diego Gas & Electric Company (U 0 M) Proceeding: 01 General Rate Case Application: A.1-- Exhibit: SCG-/SDG&E- SOCALGAS / SDG&E DIRECT TESTIMONY OF
Company: Southern California Gas Company (U 0 M) / San Diego Gas & Electric Company (U 0 M) Proceeding: 01 General Rate Case Application: A.1-- Exhibit: SCG-/SDG&E- SOCALGAS / SDG&E DIRECT TESTIMONY OF
First Quarter 2018 Financial Results. May 1, 2018
 First Quarter 2018 Financial Results May 1, 2018 Forward-Looking Statements Statements contained in this presentation about future performance, including, without limitation, operating results, capital
Dkt. No. ER Draft Informational Filing. Table of Contents
 Table of Contents Worksheet Name Schedule Purpose Overview Base TRR Components. BaseTRR 1 Full Development of Retail and Wholesale Base TRRs. IFPTRR 2 Calculation of the Incremental Forecast Period TRR
Attachment 2 to Appendix IX Formula Rate Spreadsheet
 Attachment 2 to Appendix IX Formula Rate Spreadsheet Table of Contents Worksheet Name Schedule Purpose Overview Base TRR Components. BaseTRR 1 Full Development of Retail and Wholesale Base TRRs IFPTRR
UNITED STATES OF AMERICA BEFORE THE FEDERAL ENERGY REGULATORY COMMISSION SAN DIEGO GAS & ELECTRIC COMPANY ) DOCKET NO.
 DOCKET NO.") UNITED STATES OF AMERICA BEFORE THE FEDERAL ENERGY REGULATORY COMMISSION SAN DIEGO GAS & ELECTRIC COMPANY ) DOCKET NO. ER13-941-000 TRANSMISSION OWNER TARIFF FOURTH RATE FORMULA VOLUME NO. 11 FEBRUARY
UNITED STATES OF AMERICA BEFORE THE FEDERAL ENERGY REGULATORY COMMISSION SAN DIEGO GAS & ELECTRIC COMPANY ) DOCKET NO. ER13-941-000 TRANSMISSION OWNER TARIFF FOURTH RATE FORMULA VOLUME NO. 11 FEBRUARY
Dkt. No. ER Draft Informational Filing. Table of Contents
 Table of Contents Worksheet Name Schedule Purpose Overview Base TRR Components. BaseTRR 1 Full Development of Retail and Wholesale Base TRRs. IFPTRR 2 Calculation of the Incremental Forecast Period TRR
SUEZ WATER RHODE ISLAND, INC.
 9- Page of 2 9-. Details of ADIT balances at December 3, 207. a) Identify the December 3, 207 recorded per-book balance of Accumulated Deferred Income Taxes (ADIT) in each account (account 90, 282, 283
October 26, 2017 Advice Letter 3665-E
 STATE OF CALIFORNIA PUBLIC UTILITIES COMMISSION SAN FRANCISCO, CA 94102-3298 Edmund G. Brown Jr., Governor October 26, 2017 Advice Letter 3665-E Russell G. Worden Director, Regulatory Operations Southern
February 1, Ms. Kimberly D. Bose, Secretary Federal Energy Regulatory Commission 888 First Street, N.E. Washington, DC Dear Ms.
 Karen Koyano Principal Manager FERC Rates and Compliance February 1, 2017 Ms. Kimberly D. Bose, Secretary Federal Energy Regulatory Commission 888 First Street, N.E. Washington, DC 20426 Dear Ms. Bose:
PG&E Corporation. Fourth Quarter Earnings Call February 21, 2013
 1 PG&E Corporation Fourth Quarter Earnings Call February 21, 2013 This presentation is not complete without the accompanying statements made by management during the webcast conference call held on February
/s/ John L. Carley Assistant General Counsel
 John L. Carley Assistant General Counsel Law Department July 28, 2016 Christopher Psihoules, DAG Division of Law 124 Halsey Street, 5 th Floor P.O. Box 45029 Newark, NJ 07101 Christine M. Juarez, Esq.
Fourth Quarter and Full Year 2018 Financial Results. February 28, 2019
 Fourth Quarter and Full Year 2018 Financial Results Forward-Looking Statements Statements contained in this presentation about future performance, including, without limitation, operating results, capital
Southern California Edison Revised Cal. PUC Sheet No E Rosemead, California Cancelling Revised Cal. PUC Sheet No E
 Southern California Edison Revised Cal. PUC Sheet No. 35321-E Rosemead, California Cancelling Revised Cal. PUC Sheet No. 35307-E PRELIMINARY STATEMENT Sheet 1 ELECTRIC DISTRIBUTION REVENUE ADJUSTMENT BALANCING
1407 W North Temple, Suite 310 Salt Lake City, Utah 84114
 1407 W North Temple, Suite 310 Salt Lake City, Utah 84114 February 7, 2018 VIA ELECTRONIC FILING Utah Public Service Commission Heber M. Wells Building, 4 th Floor 160 East 300 South Salt Lake City, UT
Excerpt of D On Test Year 2012 General Rate Case For Southern California Edison Company (Pages 1-5, 13-14, , & )
") Application No.: Exhibit No.: Witnesses: A.13-11-003 SCE-45 T. Godfrey (U 338-E) Excerpt of D.12-11-051 On Test Year 2012 General Rate Case For Southern California Edison Company (Pages 1-5, 13-14, 209-211,
Application No.: Exhibit No.: Witnesses: A.13-11-003 SCE-45 T. Godfrey (U 338-E) Excerpt of D.12-11-051 On Test Year 2012 General Rate Case For Southern California Edison Company (Pages 1-5, 13-14, 209-211,
Third Quarter 2017 Financial Results
 Third Quarter 2017 Financial Results October 30, 2017 Forward-Looking Statements Statements contained in this presentation about future performance, including, without limitation, operating results, capital
Advice Letters 3072-E and 3072-E-A
 STATE OF CALIFORNIA PUBLIC UTILITIES COMMISSION SAN FRANCISCO, CA 94102-3298 Edmund G. Brown Jr., Governor August 19, 2014 Advice Letters 3072-E and 3072-E-A Megan Scott-Kakures Vice President, Regulatory
BEFORE THE PUBLIC UTILITIES COMMISSION OF THE STATE OF COLORADO * * * * * DIRECT TESTIMONY AND ATTACHMENTS OF LISA H.
 Page of BEFORE THE PUBLIC UTILITIES COMMISSION OF THE STATE OF COLORADO * * * * * RE: IN THE MATTER OF ADVICE LETTER NO. -ELECTRIC FILED BY PUBLIC SERVICE COMPANY OF COLORADO TO REVISE ITS PUC NO. -ELECTRIC
PUBLIC UTILITIES COMMISSION
 STATE OF CALIFORNIA EDMUND G. BROWN JR., Governor PUBLIC UTILITIES COMMISSION 505 VAN NESS AVENUE SAN FRANCISCO, CA 94102-3298 FILED 10/29/18 02:02 PM October 29, 2018 Agenda ID #16979 Ratesetting TO PARTIES
Southern California Edison Revised Cal. PUC Sheet No E Rosemead, California (U 338-E) Cancelling Revised Cal. PUC Sheet No.
 Cancelling Revised Cal. PUC Sheet No.") Southern California Edison Revised Cal. PUC Sheet No. 21344-E Rosemead, California (U 338-E) Cancelling Revised Cal. PUC Sheet No. 18069-E PRELIMINARY STATEMENT Sheet 1 N. MEMORANDUM ACCOUNTS 1. Purpose.
Southern California Edison Revised Cal. PUC Sheet No. 21344-E Rosemead, California (U 338-E) Cancelling Revised Cal. PUC Sheet No. 18069-E PRELIMINARY STATEMENT Sheet 1 N. MEMORANDUM ACCOUNTS 1. Purpose.
GridLiance West Transco LLC (GWT) Formula Rate Index
 Formula Rate Index") (GWT) Formula Rate Index Appendix III Main Body of the Formula Attachment 1 Revenue Credit Worksheet Attachment 2 Cost Support Attachment 2a Cost Support Attachment 2b Cost Support Attachment 3 Incentives
(GWT) Formula Rate Index Appendix III Main Body of the Formula Attachment 1 Revenue Credit Worksheet Attachment 2 Cost Support Attachment 2a Cost Support Attachment 2b Cost Support Attachment 3 Incentives
Overview. Overview of SCE Retail Base TRR. SCE's retail Base Transmission Revenue Requirement is the sum of the following components:
 Table of Contents Worksheet Name Overview BaseTRR IFPTRR TrueUpAdjust TUTRR ROR PlantInService PlantStudy AccDep ADIT CWIP PHFU AbandonedPlant WorkCap IncentivePlant IncentiveAdder PlantAdditions Depreciation
2018 General Rate Case
 Application No.: A.1-0- Exhibit No.: SCE-0, Vol. Witnesses: S. Kempsey (U -E) 01 General Rate Case PUBLIC VERSION Administrative & General (A&G) Volume - Property & Liability Insurance Before the Public
Before the Minnesota Public Utilities Commission. State of Minnesota
 Direct Testimony and Schedules Jamie L. Jago Before the Minnesota Public Utilities Commission State of Minnesota In the Matter of the Application of Minnesota Power for Authority to Increase Rates for
BEFORE THE PENNSYLVANIA PUBLIC UTILITY COMMISSION. PENNSYLVANIA PUBLIC UTILITY COMMISSION v. PECO ENERGY COMPANY ELECTRIC DIVISION
 PECO ENERGY COMPANY STATEMENT NO. BEFORE THE PENNSYLVANIA PUBLIC UTILITY COMMISSION PENNSYLVANIA PUBLIC UTILITY COMMISSION v. PECO ENERGY COMPANY ELECTRIC DIVISION DOCKET NO. R-01-1 DIRECT TESTIMONY WITNESS:
BEFORE THE PUBLIC UTILITIES COMMISSION OF THE STATE OF CALIFORNIA
 BEFORE THE PUBLIC UTILITIES COMMISSION OF THE STATE OF CALIFORNIA Application of Pacific Gas and Electric Company (U 39 E) for Authority to Establish the Wildfire Expense Memorandum Account. Application
PG&E Corporation. First Quarter Earnings Call. May 2, 2013.
 PG&E Corporation First Quarter Earnings Call May 2, 2013 This presentation is not complete without the accompanying statements made by management during the webcast conference call held on May 2, 2013.
Second Quarter 2017 Financial Results
 Second Quarter 2017 Financial Results July 27, 2017 Forward-Looking Statements Statements contained in this presentation about future performance, including, without limitation, operating results, capital
Edison International Reports First Quarter 2018 Financial Results Page 3 of 9. Appendix. Use of Non-GAAP Financial Measures
 Page 3 of 9 Use of Non-GAAP Financial Measures Appendix Edison International s earnings are prepared in accordance with generally accepted accounting principles used in the United States and represent
Public Service Company of Colorado. Proceeding No. 14AL-0660E
 Page 1 of 9 Page 1 of 9 Public Service Company of Colorado Earnings Test Sharing Mechanism Calculation Methodologies and Adjustments for 2015 2017 Calendar Year Reports RATE BASE 1. Rate Base will be calculated
FOR IMMEDIATE RELEASE Media relations contact: Charles Coleman, (626) Investor relations contact: Scott Cunningham, (626)
 Investor relations contact: Scott Cunningham, (626)") NEWS FOR IMMEDIATE RELEASE Media relations contact: Charles Coleman, (626) 302-7982 Investor relations contact: Scott Cunningham, (626) 302-2540 Edison International Reports Second Quarter 2016 Results;
NEWS FOR IMMEDIATE RELEASE Media relations contact: Charles Coleman, (626) 302-7982 Investor relations contact: Scott Cunningham, (626) 302-2540 Edison International Reports Second Quarter 2016 Results;
Historical Year Historical Year (page 114 of P-521) 5,211,499 1,524,457 1,455, , ,812 43,194 85, ,521 - (1) 859,550
 5,211,499 1,524,457 1,455, , ,812 43,194 85, ,521 - (1) 859,550") Adjusted Net Operating Income Schedule: C1 For the 12 Months Ended December 31, 2016 Witness: T. M. Uzenski (d) (e) (f) (g) (h) (i) (j) (k) (l) (m) Deprec State & Local Federal Source Fuel & and Property
Adjusted Net Operating Income Schedule: C1 For the 12 Months Ended December 31, 2016 Witness: T. M. Uzenski (d) (e) (f) (g) (h) (i) (j) (k) (l) (m) Deprec State & Local Federal Source Fuel & and Property
Third Quarter 2018 Financial Results. October 30, 2018
 Third Quarter 2018 Financial Results October 30, 2018 Forward-Looking Statements Statements contained in this presentation about future performance, including, without limitation, operating results, capital
ADVICE LETTER (AL) SUSPENSION NOTICE ENERGY DIVISION
 SUSPENSION NOTICE ENERGY DIVISION") ADVICE LETTER (AL) SUSPENSION NOTICE ENERGY DIVISION Utility Name: Southern California Edison Co. Utility Number/Type: U 338-E Advice Letter Number(s): 3695-E Date AL(s) Filed: Nov. 16, 2017 Utility Contact
ADVICE LETTER (AL) SUSPENSION NOTICE ENERGY DIVISION Utility Name: Southern California Edison Co. Utility Number/Type: U 338-E Advice Letter Number(s): 3695-E Date AL(s) Filed: Nov. 16, 2017 Utility Contact
Residential Line and Service Extension Allowance Testimony. Application No.: Witnesses: C. Silsbee S. Reed J. Schichtl L. Vellanoweth (U 338-E)
") Application No.: Exhibit No.: Witnesses: SCE-1 C. Silsbee S. Reed J. Schichtl L. Vellanoweth (U -E) Residential Line and Service Extension Allowance Testimony Before the Public Utilities Commission of
Application No.: Exhibit No.: Witnesses: SCE-1 C. Silsbee S. Reed J. Schichtl L. Vellanoweth (U -E) Residential Line and Service Extension Allowance Testimony Before the Public Utilities Commission of
Before the Minnesota Public Utilities Commission State of Minnesota. Docket No. E002/GR Exhibit (RRS-1) Pension and Benefits Expense
 Pension and Benefits Expense") Direct Testimony and Schedules Richard R. Schrubbe Before the Minnesota Public Utilities Commission State of Minnesota In the Matter of the Application of Northern States Power Company for Authority to
Direct Testimony and Schedules Richard R. Schrubbe Before the Minnesota Public Utilities Commission State of Minnesota In the Matter of the Application of Northern States Power Company for Authority to
Granite State Electric Company Financial Statements For the years ended March 31, 2011 and March 31, 2010
 Granite State Electric Company Financial Statements For the years ended March 31, 2011 and March 31, 2010 GRANITE STATE ELECTRIC COMPANY TABLE OF CONTENTS Page No. Report of Independent Auditors 2 Balance
2015 General Rate Case
 Application No.: Exhibit No.: Witnesses: A.--00 SCE-0, Vol. 0, Pt. 1 M. Bennett G. Henry J. Trapp R. Worden (U -E) 01 General Rate Case ERRATA Human Resources (HR) Volume, Part 1 Benefits and Other Compensation
GridLiance West Transco LLC (GWT) Formula Rate Index
 Formula Rate Index") (GWT) Formula Rate Index Appendix III Main Body of the Formula Attachment 1 Revenue Credit Worksheet Attachment 2 Cost Support Attachment 2a Cost Support Attachment 2b Cost Support Attachment 3 Incentives
(GWT) Formula Rate Index Appendix III Main Body of the Formula Attachment 1 Revenue Credit Worksheet Attachment 2 Cost Support Attachment 2a Cost Support Attachment 2b Cost Support Attachment 3 Incentives
Prepared Remarks of Edison International CEO and CFO First Quarter 2017 Financial Teleconference May 1, 2017, 1:30 p.m. (PDT)
") Prepared Remarks of Edison International CEO and CFO First Quarter 2017 Financial Teleconference May 1, 2017, 1:30 p.m. (PDT) Pedro Pizarro, President and Chief Executive Officer, Edison International
Prepared Remarks of Edison International CEO and CFO First Quarter 2017 Financial Teleconference May 1, 2017, 1:30 p.m. (PDT) Pedro Pizarro, President and Chief Executive Officer, Edison International
STATE OF NEW JERSEY OFFICE OF ADMINISTRATIVE LAW BEFORE HONORABLE IRENE JONES, ALJ ) ) ) ) ) ) ) ) ) ) )
 ) ) ) ) ) ) ) ) ) )") STATE OF NEW JERSEY OFFICE OF ADMINISTRATIVE LAW BEFORE HONORABLE IRENE JONES, ALJ I/M/O THE VERIFIED PETITION OF ROCKLAND ELECTRIC COMPANY FOR APPROVAL OF CHANGES IN ELECTRIC RATES, ITS TARIFF FOR ELECTRIC
STATE OF NEW JERSEY OFFICE OF ADMINISTRATIVE LAW BEFORE HONORABLE IRENE JONES, ALJ I/M/O THE VERIFIED PETITION OF ROCKLAND ELECTRIC COMPANY FOR APPROVAL OF CHANGES IN ELECTRIC RATES, ITS TARIFF FOR ELECTRIC
Superseding Sheet No. 89 REVISED SHEET NO. 89 Effective April 9, 2012 Effective June 1, 2013 RATE ADJUSTMENT MECHANISM PROVISION
 Superseding Sheet No. 89 REVISED SHEET NO. 89 Effective April 9, 2012 Effective June 1, 2013 RATE ADJUSTMENT MECHANISM PROVISION Rate Adjustment Mechanism ( RAM ) Provision Purpose This mechanism is subject
Superseding Sheet No. 96 REVISED SHEET NO. 96 Effective May 4, 2012 Effective June 1, 2013
 Superseding Sheet No. 96 REVISED SHEET NO. 96 Effective May 4, 2012 Effective June 1, 2013 RATE ADJUSTMENT MECHANISM PROVISION Rate Adjustment Mechanism ( RAM ) Provision Purpose This mechanism is subject
STATE OF NEW JERSEY BOARD OF PUBLIC UTILITIES
 STATE OF NEW JERSEY BOARD OF PUBLIC UTILITIES In The Matter of the Petition of Public Service Electric and Gas Company for Approval of an Increase in Electric and Gas Rates and For Changes In the Tariffs
BEFORE THE PUBLIC UTILITIES COMMISSION OF THE STATE OF CALIFORNIA ) ) ) ) )
 ) ) ) )") BEFORE THE PUBLIC UTILITIES COMMISSION OF THE STATE OF CALIFORNIA Application of Southern California Edison Company (U 338-E for Authority to, Among Other Things, Increase its Authorized Revenues for Electric
BEFORE THE PUBLIC UTILITIES COMMISSION OF THE STATE OF CALIFORNIA Application of Southern California Edison Company (U 338-E for Authority to, Among Other Things, Increase its Authorized Revenues for Electric
(a) (b) (c) (d) (e) (f) (g) (h) (i) (j) (k) (l) (m)
 (b) (c) (d) (e) (f) (g) (h) (i) (j) (k) (l) (m)") Adjusted Net Operating Income - Total Electric and Jurisdictional Electric Schedule: C1 For The 12 Months Ended December 31, 2009 Witness: T. M. Uzenski (a) (b) (c) (d) (e) (f) (g) (h) (i) (j) (k) (l)
Adjusted Net Operating Income - Total Electric and Jurisdictional Electric Schedule: C1 For The 12 Months Ended December 31, 2009 Witness: T. M. Uzenski (a) (b) (c) (d) (e) (f) (g) (h) (i) (j) (k) (l)
2018 General Rate Case
 Application No.: Exhibit No.: Witnesses: A.1-0-001 SCE-TURN-01 S. Menon (SCE) W. Marcus (TURN) (U -E) 01 General Rate Case SCE-TURN Joint Supplemental Testimony Regarding SPIDA Software Disallowance Scenarios
Exhibit SCE-1
 Exhibit SCE-1 Exhibit SCE-2 UNITED STATES OF AMERICA BEFORE THE FEDERAL ENERGY REGULATORY COMMISSION ) Southern California Edison Company ) Dkt. No. ER18- -000 ) DECLARATION OF BERTON J. HANSEN FOR
First Quarter 2017 Financial Results
 First Quarter 2017 Financial Results May 1, 2017 Forward-Looking Statements Statements contained in this presentation about future performance, including, without limitation, operating results, capital
FOR IMMEDIATE RELEASE Investor relations contact: Sam Ramraj, (626) Media relations contact: Charles Coleman, (626)
 Media relations contact: Charles Coleman, (626)") NEWS FOR IMMEDIATE RELEASE Investor relations contact: Sam Ramraj, (626) 302-2540 Media relations contact: Charles Coleman, (626) 302-7982 Edison International Reports Second Quarter 2018 Results ROSEMEAD,
NEWS FOR IMMEDIATE RELEASE Investor relations contact: Sam Ramraj, (626) 302-2540 Media relations contact: Charles Coleman, (626) 302-7982 Edison International Reports Second Quarter 2018 Results ROSEMEAD,