Integrated Annual Report and Financial Statements for the year ended 31 December 2014
|
|
|
- Adela Rosalyn Morton
- 6 years ago
- Views:
Transcription

1 1
2 2

3 3
4 4
5 Corporate Information Registered Office & Principal Place of Business LR No /9 Mombasa Road PO Box Nairobi GPO. Company Secretary Edgar Jumba Imbamba P.O. Box 30429, Nairobi GPO. Share Registrars Custody & Registrars Services Limited Bruce House, 6th floor, Standard Street, P. O. Box 8484, Nairobi GPO. Principal Bankers NIC Bank Limited, NIC House, Masaba Road, off Uhuru highway, P.O.Box 44599, Nairobi GPO. Standard Chartered Bank Kenya Limited, 48, Westlands Road, P.O. Box, 30003, 00100, Nairobi GPO. CfC Stanbic Bank Limited CfC Stanbic Centre Chiromo Road, Westlands P.O. Box 72833, Nairobi Principal Advocates Kipkorir, Titoo & Kiara, Posta Sacco Plaza, PO Box Nairobi GPO. Waruhiu K owade and Nganga Advocates, Taj Towers, 4th Floor, Wing B, Upperhill Road, P.O. BOX 47122, Nairobi GPO. Auditors KPMG Kenya, Certified Public Accountants, ABC Towers, 8th Floor, Waiyaki Way, PO Box 40612, Nairobi GPO. 5
6 185/70R14 6
7 Contents SECTION 1: OVERVIEW 1.1 Report of the Directors 1.2 Repoti ya Wakurugenzi 1.3 Investor proposition 1.4 Performance highlights 1.5 Group five year performance 1.6 Wealth creation 1.7 Chairman s statement 1.8 Taarifa ya Mwenyekiti PAGE SECTION 2: STRATEGIC REPORT 2.1 Managing Director s report 2.2 Ripoti ya Mkurugenzi Mkuu 2.3 Organisational review and business model 2.4 Operating context and risk management 2.5 Strategic review 2.6 Performance review SECTION 3: GOVERNANCE AND REMUNERATION 3.1 Board of Directors 3.2 Executive Committee 3.3 Chairman s governance statement 3.4 Governance report 3.5 Audit, risk and corporate governance committee report 3.6 Directors remuneration report SECTION 4: FINANCIAL STATEMENTS Statement of Directors responsibilities Report of the Independent Auditors Consolidated Statement of Profit or Loss and Other Comprehensive Income Company Statement of Profit or Loss and Other Comprehensive Income Consolidated Statement of Financial Position Company Statement of Financial Position Consolidated Statement of Changes in Equity Company Statement of Changes in Equity Consolidated Statement of Cash Flows Company Statement of Cash Flows Notes to the financial statements SECTION 5: OTHER RELEVANT INFORMATION Notice of the 46th Annual General Meeting Ilani ya Mkutano Mkuu wa 46 wa Kila Mwaka Form of proxy Sameer Africa sales depot contacts Yana Tyre Centre locations and addresses

8 8
9 Contents SECTION 1: OVERVIEW PAGE 1.1 Report of the Directors Ripoti ya Wakurugenzi Investor proposition Performance highlights Group five year performance Wealth creation Chairman s statement Taarifa ya Mwenyekiti
10 1.1 Report of the Directors The Directors have pleasure in presenting their integrated annual report together with the audited financial statements for the year ended 31 December. About this report Our integrated annual report and audited financial statements for the year ended 31 December, is made up of the following three volumes: The integrated annual report, through which we aim to provide stakeholders with a greater understanding of the Group s strategy and business model and its material economic, social and environmental impacts. It also examines the integrated nature of our operational, financial and sustainability performance; The audited financial statements for the year ended 31 December, which discloses the state of affairs of the Group and the Company and fulfils our statutory financial reporting requirements; and Other relevant corporate information. We have embraced integrated reporting and view it as a philosophy rather than a set of prescriptive principles. This enables us to demonstrate to stakeholders, in our own way, how we create and sustain value and work towards ensuring the long term viability of Sameer Africa Limited and its subsidiaries (the Group). Throughout this report we have attempted to demonstrate the relationship between our strategy, performance, targets, remuneration and prospects and how these factors lead to wealth creation. Assurance on the audited financial statements for the year ended 31 December, has been provided by the external auditors, KPMG Kenya, as confirmed in the independent auditors report on page 99. The contents of the integrated annual report have not been externally assured. Forwardlooking statements The integrated annual report includes forwardlooking statements which relate to the possible future financial position and results of the Group s operations. These statements, by their nature, involve risk and uncertainty, as they relate to events and depend upon circumstances that may or may not occur in the future. Factors that could cause actual future results to differ materially from those in the forwardlooking statements include, but are not limited to, changes in (a) global and national economic conditions, (b) our trading environment, (c) future strategies as contained in our strategic priorities and plans included in the strategic trends, (d) interest rates, (e) credit conditions and the associated risks of lending, (f) actual cash collections, (g) inventory levels, (h) gross and operating margins, (i) capital management, and (j) competitive and regulatory factors. The Group does not undertake to update or revise any of these forwardlooking statements publicly, whether to reflect new information or future events or otherwise. The forwardlooking statements have not been reviewed or reported upon by the Group s external auditors. Principal activities The principal activities of the Group are the manufacture, importation and sale of tyres and related products and services and the letting of investment properties. Results The results for the year are as set out below; Group Company (Loss)/profit before income tax (69,457) 456,521 (106,961) 534,297 Income tax credit / (expense) 2,528 (55,332) 21,644 (26,052) (Loss)/profit for the year (66,929) 401,189 (85,317) 508,245 10
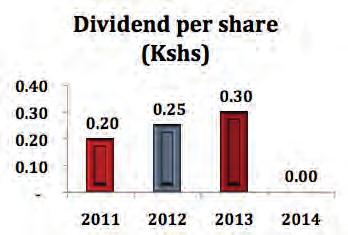
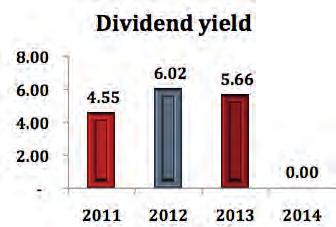
11 1.1 Report of the Directors (Continued) Dividend The Directors do not recommend the payment of a dividend ( Kshs 0.30 per share). Directors The Directors who held office during the year and to the date of this report were: Eng. E. Mwongera Chairman A. Walmsley* Managing Director S.M. Githiga P. Gitonga A.H. Butt S. N. Merali * South African Auditors The auditors, KPMG Kenya, continue in office in accordance with Section 159(2) of the Companies Act (Cap. 486). Approval of the integrated annual report and financial statements The Directors confirm that they have collectively assessed the contents of the integrated annual report and believe it addresses the Group s material issues and risks and is a fair representation of the integrated performance of the Group. The audit, risk and corporate governance committee, which has oversight responsibility for the integrated annual report, recommended the report for approval by the board of directors. The board has therefore, approved the integrated annual report for release to shareholders. The financial statements were approved at a meeting of the directors held on 25 March By order of the board Edgar J. Imbamba Company Secretary Date: 25 March
12 1.2 Ripoti ya Wakurugenzi Wakurugenzi wanafuraha kuwasilisha ripoti yao jumuishi ya mwaka pamoja na taarifa za kifedha zilizokaguliwa za mwaka ulioishia 31 Desemba. Kuhusu ripoti hii Ripoti yetu jumuishi ya mwaka, ya mwaka na taarifa za kifedha zilizokaguliwa za mwaka ulioishia 31 Desemba, ina sehemu tatu: Kupitia ripoti yetu jumuishi ya mwaka, ya mwaka, tunalenga kuwapa washika dau ufahamu mpana wa mkakati wa kundi na mtindo wa biashara na athari zake muhimu kiuchumi, kijamii na kimazingira, pia kutahini asili ya ujumuishi wa utendaji wetu kiuendeshaji, kifedha, na kiendelevu. Taarifa za kifedha zilizokaguliwa za mwaka ulioishia 31 Desemba, ambazo zinaweka wazi hali ya mambo ya kundi na kampuni na zinatimiza wajibu wetu wa kisheria wa kuripoti kuhusu fedha. Habari nyingine za shirika Tumekubali utumizi wa ripoti jumuishi na tunaiona kama ni falsafa wala hatuioni kuwa ni vifungu tu vya utimizaji masharti ya kanuni. Hili linatuwezesha kuwadhihirishia washika dau wetu, kwa namna yetu wenyewe, vipi tunavyojenga na kuendeleza thamani na pia vipi tunajitahidi ili kuhakikisha uwezo wa Sameer Africa na kampuni zake tanzu (Kundi) unaendelea kwa muda mrefu. Katika ripoti hii nzima tumejaribu kudhihirisha uhusiano kati ya mkakati wetu, utendaji, malengo, mishahara na matarajio na vipi mambo haya yanapelekea katika utengezaji wa mali. Hakikisho la taarifa za kifedha zilizokaguliwa za mwaka ulioishia 31 Desemba, limetolewa na wakaguzi wa nje, KPMG Kenya, kama ilivyothibitishwa katika ripoti ya wakaguzi huru ukurasa 99. Yale Yaliyomo katika ripoti jumuishi ya mwaka hayajahakikishwa kutoka nje. Taarifa zinazotizama mbele Ripoti jumuishi ya mwaka imo na taarifa zinazotazama mbele ambazo zinahusu hali ya kifedha na matokeo ya uendeshaji kazi za kundi zinavyoweza kuwa katika siku zijazo. Taarifa hizi, kwa kawaida zake, huangazia tishio na hali tatanishi, kwa kuwa zinahusiana na matukio na huandamana na hali ya mambo yanavyoweza kutokea au kutotokea katika siku za baadaye. Sababu za matokeo halisi ya baadaye kuwa tofauti pakubwa na yale ya taarifa zinazotizama mbele, zinajumuisha ya fuatayo, wala haikomi kwayo, mabadiliko ya (a) hali ya kiuchumu ya ulimwengu na ya kitaifa, (b) mazingira yetu ya kufanyia biashara, (c) mikakati ya baadaye kama ilivyo katika vipaumbele vya kimkakati na mipango yetu iliyojumlishwa katika mienendo ya kimkakati, (d) viwango vya riba, (e) hali ya mikopo na tishio za mikopo,(f) fedha zilizokusanywa, (g) viwango vya bidhaa katika bohari, (h) faida za jumla na za uendeshaji, (i) Usimamizi wa mtaji na (j) Sababu zinazotokana na ushindani na za kisheria. Kundi halichukui dhamana kuwa litafanya upya au kurekebisha hadharani lolote katika taarifa hizi zinazotazama mbele, iwe ni kutoa habari mpya au matukio ya baadaye au lolote. Taarifa zinazotizama mbele hazijachambuliwa wala kuripotiwa na wakaguzi wa kundi wa nje. Shughuli kuu za kundi Shughuli kuu za kundi ni utengenezaji, uagizaji kutoka nje na uuzaji magurudumu na bidhaa na huduma husika na ukodishaji wa majengo ya uwekezaji. Matokeo Matokeo ya mwaka ni kama ifuatavyo; Kundi Kampuni (Hasara)/ faida kabla ya kodi ya mapato (69,457) 456,521 (106,961) 534,297 Kodi ya mapato iliopokewa/ (iliolipwa) 2,528 (55,332) 21,644 (26,052) (Hasara)/ faida ya mwaka (66,929) 401,189 (85,317) 508,245 12
13 1.2 Ripoti ya Wakurugenzi Gawio Wakurugenzi hawapendekezi kulipa gawio (mwaka Kshs 0.30 kwa kila hisa) Wakurugenzi Wakurugenzi waliohudumu katika mwaka hadi tarehe ya ripoti hii walikuwa: Eng. E. Mwongera Mwenye Kiti A. Walmsley* Mkurugenzi Mkuu S.M. Githiga P. Gitonga A.H. Butt S. N. Merali * Muafrika Kusini Wakaguzi Wakaguzi, KPMG Kenya, wanaendelea kushikilia ofisi kuambatana na kifungu 159(2) cha sheria za Kampuni (Sura 486). Kuidhinisha ripoti jumuishi ya mwaka na taarifa za kifedha Wakurugenzi wanathibitisha kuwa wote kwa pamoja wametathmini yaliyomo katika ripoti jumuishi ya mwaka na wana amini inazungumzia mambo muhimu ya kundi na tishio na ni kiashirio sawa cha utendaji jumuishi wa Kundi. Kamati ya ukaguzi tishio na utawala bora wa kampuni ambayo ina jukumu la kuchambua ripoti jumuishi ya mwaka ilipendekeza ripoti iidhinishwe na halmashauri ya wakurugenzi. Halmashauri kwa hivyo, imeidhinisha ripoti jumuishi ya mwaka itolewe kwa wanahisa. Taarifa za kifedha ziliidhinishwa katika mkutano wa wakurugenzi uliofanyika mnamo tarehe 25 Machi Kwa amri ya halmashauri Edgar J. Imbamba Katibu wa Kampuni Tarehe: 25 Machi
14 1.3 Investor proposition A case for investing in Sameer Africa Proposition Unique location Superior brands Strong financial position Labour and trade unions stability Growth potential Effective risk management and governance A case for Investing Sameer Africa is the only tyre manufacturing company in East and Central Africa with potential to service markets in the region and beyond. Our manufactured products enjoy preferential duty tariffs with the COMESA and the EAC economic blocs. The envisaged merger of the SADC, EAC and COMESA economic blocs offers significant potential opportunities given an increased market, a population of more than 600 million people and an estimated GDP of approximately USD 1 trillion. Yana Sameer Africa s pan African brand is a high performance tyre that rides on a strong heritage associated with high quality, durability, reliability and safety derived from its unique technical specifications. Summit tyre is Sameer Africa s second tyre brand developed to serve the fastgrowing discount market and is an appropriate and affordable tyre that delivers value for money without compromising on performance. Bridgestone is a world renowned brand that has withstood performance tests across all six continents with diversified products made for varied applications to support entire market segments Sameer Africa prides itself as having a strong balance sheet with net tangible assets in excess of Kshs 2.5 billion. Net debt to equity ratio stands at only 8.6% with potential to acquire additional debt for further growth and expansion. Strong cash flows to date our organic growth capital expenditure has predominantly been funded from our cash flows. We have an incredibly diverse and talented group of people in this company who are committed to creating and delivering continuous value to our customers, our shareholders and society at large. We have a 2 year CBA agreement in place expiring in We have had no labour strikes or unrest in the recent past and employee productivity has consistently improved over time. There is a significant untapped growth potential for the tyre business not only within the larger East and Central Africa region, but also in export markets beyond. East African economies are projected to grow at an average of 6.5% per annum through 2018, driven by growth in transport, tourism, communications, mining and agriculture and supported by public investment in infrastructure. The real value of Sameer Africa lies in its huge untapped investment property portfolio. Ongoing and planned improvements to the road infrastructure will mean that the Industrial Area of Nairobi will become an improved destination for commercial office and retail developments. The Group s land holdings are valued at over Kshs 2.3 billion and investment properties valued at Kshs 1.6 billion are available for redevelopment. The fair value gains of Kshs 3.7 billion have not been factored in the Group Statement of Financial Position. Sameer Africa has adopted effective enterprise risk management processes, strong governance structures and robust processes and procedures. 14


15 1.4 Performance highlights 15
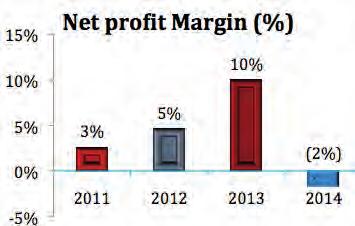
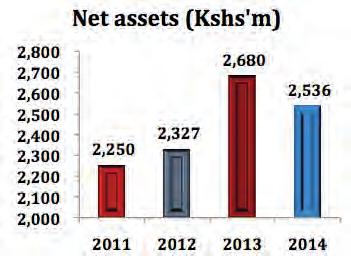
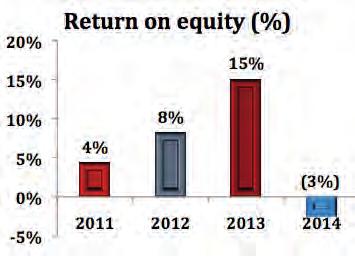
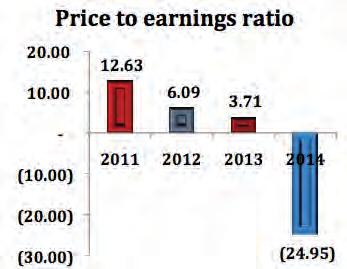
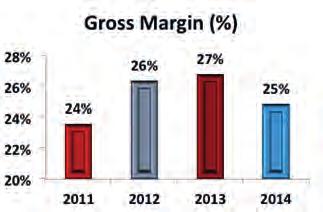
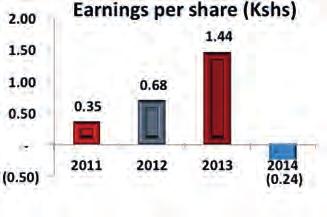
16 1.5 Group five year performance Statement of profit or loss Revenue Gross profit (Loss) / profit before income tax Income tax credit /(charge) (Loss) /profit for the year 3,777, ,511 (69,457) 2,528 (66,929) 4,029,841 1,078, ,521 (55,332) 401,189 4,083,631 1,074, ,761 (110,307) 188,454 3,757, , ,446 (51,498) 96,948 3,414, ,758 62,199 (4,803) 57,396 Statement of financial position Assets Property, plant and equipment Investment property Equity accounted investees Inventories Receivables and prepayments Cash and bank balances Other assets 529, , ,777 1,512, , , , , , ,073 1,268, , , , , , ,130 1,086,087 1,255, , , , , ,763 1,091,500 1,022, , , , , , , , ,284 60,602 Total assets Equity Share capital Reserves 3,857,392 1,391,712 1,144,732 3,668,487 1,391,712 1,287,901 3,399,651 1,391, ,011 3,125,040 1,391, ,076 2,845,307 1,391, ,430 Total equity Liabilities Retirement benefit obligations Payables and accrued expenses Borrowings Other liabilities 2,536, , , ,258 5,343 2,679, , , ,236 10,875 2,326, , , ,768 27,451 2,249, , , ,162 65,083 2,168, , , ,816 21,053 Total liabilities 1,320, ,874 1,072, , ,165 Total equity and liabilities 3,857,392 3,668,487 3,399,651 3,125,040 2,845,307 Key ratios Gross margin Net profit margin Earnings per share (Kshs) Dividends per share (Kshs) Dividend yield Price to earnings ratio Price to book value (Kshs) Return on equity 25% (2%) (0.24) (24.95) 0.66 (3%) 27% 10% % 26% 5% % 24% 3% % 21% 2% % 16


17 1.6 Wealth creation A key measure of the sustainability of a business is the level of economic value or wealth created for stakeholders through the efficient operation of the business. Wealth creation is the value generated from the income generating activities of the business and is determined as gross revenues less the cost of goods, services and other operational requirements. In, the Group created wealth of Kshs 1.6 billion, which is 15% lower than the Kshs 1.9 billion generated during the prior financial period. The table below shows how the total wealth created by the Group was distributed to stakeholders, while retaining sufficient capital for continued investment in the growth of the business. Wealth created Wealth creation: Gross revenues received Less: Payment to suppliers Wealth created Wealth distribution: Employees Government Capital providers Broader community Capital expenditure Utilities Reinvested in the Group Wealth distributed Kshs m 3,897 (2,282) 1, ,615 Kshs m 4,653 (2,747) 1, , Employees Government Employees Government Capital providers Broader community Capital providers Broader community Capital expenditure Utilities Capital expenditure Utilities Reinvested in the Group Reinvested in the Group 17


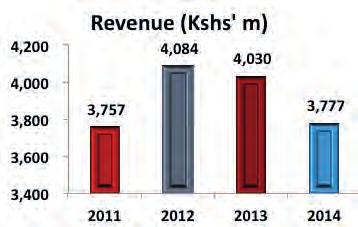
18 1.7 Chairman s statement Tight liquidity in the dealer trade as well as everincreasing competition from subsidized tyres imported from the East, adversely affected Group performance. Distinguished shareholders, members of the board, ladies and gentlemen, it is with great pleasure that I welcome you all to the 46th annual general meeting of the company holding this 29th day of May 2015, at the company s head office, off Mombasa Road, Nairobi, Kenya. was one of the most difficult and challenging years for Sameer Africa. Tight liquidity in the dealer trade as well as everincreasing competition from subsidized tyres imported from the East, adversely affected Group performance. Despite a 3% decline in factory production costs, mainly on account of lower raw material input prices, average selling prices of our flagship YANA brand declined again by 7% compared to the same period last year, as competition from subsidized imports intensified. Export sales also declined in, given civil and political unrest in certain of our markets as well as hard currency shortages in others. As a result, Group revenues declined by 6% to Kshs 3.8 billion, compared to Kshs 4.03 billion recorded in. This year also saw an increase of 10% in operating costs, affected mainly by initial set up costs of new retail outlets and full year costs of our new subsidiary in Burundi, as well as the impact of general inflation. The combined effect of the decline in Group revenues and the increase in operating costs resulted in the Group posting a pretax loss of Kshs 69 million compared to a profit of Kshs 457 million recorded in. Profit in was, however, boosted by an exceptional profit of Kshs 255 million arising from the sale of land. Operating environment Eng. Erastus Kabutu Mwongera FIEK, RCE, CBS 18 Chairman The global economy grew at a moderate rate of 3.3% in, reflecting both the legacy of weak performances, particularly in the United States and Europe, as well as challenges in several emerging and frontier economies. In Kenya, the manufacturing sector is a key driver of the Vision 2030 initiative and has significant, yet untapped potential, to contribute to employment and GDP growth. The sector s contribution to GDP however deteriorated from 9.5 per cent in 2012, to 8.9 per cent in. This adverse performance is largely attributable to stiff and sometimes unfair competition from imported goods, the high cost of credit as well as high energy costs in comparison to competitor nations. The influx of counterfeits and the volatility in international oil prices also continued to adversely affect the performance of the sector.
19 1.7 Chairman s statement (Continued) Tyre manufacturing environment The costs of raw material inputs for tyre manufacture have witnessed a declining trend over the last 3 years, fuelled primarily by the unprecedented decline in the price of natural rubber one of the main components in tyre manufacture. After raw material inputs, energy constitutes the second largest cost in the tyre manufacturing process. Consequently, the price dynamics of electricity and fuel oil significantly affect conversion costs and consequently the pricing and margins of our end products. The high cost of electricity continues to have an adverse effect on manufacturing entities in the country, contributing to higher finished goods costs when compared to outputs from countries with relatively cheaper electricity tariffs. Your board is cognisant of the fact that the current tyre manufacturing technology in Sameer Africa is somewhat dated when compared to plants in Asia, against whose products we must compete. To this end, your board is at an advanced stage in negotiating a partnership with a technical and equity investor to modernise the plant and related infrastructure. Should these negotiations be concluded, we should realise a reduction in the production costs of our YANA brand and with it, an increased competitive advantage in the market. Market overview The East African tyre market is estimated at 4 million tyres per annum. Sameer Africa s share of this market is estimated at between 8% 10%. Motor vehicle registrations in Kenya have been growing at an average rate of 10% per annum between 2009 and and the market is expected to continue to grow at this rate. Direct subsidies on tyre exports from China are on a sliding scale of up to 81% of manufacturer s sales revenue, depending upon manufacturer. In addition, underinvoicing by tyre importers across the region has also reached endemic proportions, thereby making the playing field extremely uneven for Sameer Africa. In addition, due to Kenya s porous borders, a number of tyres are imported into the country uncustomed. As a result, Sameer Africa s sales to the dealer distribution channel have now declined by 20% since, as more dealers embark on importing their own requirements. The manufacturing sector in Kenya has received little support from government in terms of polices aimed at protecting local manufacture, despite the best of lobbying efforts. The recent factory closures by Eveready and Cadbury, which followed those of Reckitt Benckiser, Colgate Palmolive and Johnson & Johnson is clear testimony of the challenges local manufacturers are facing. To counter the effect of the subsidized tyre imports on the company s margins, your board in, commenced the contract manufacture of its second brand SUMMIT with a Chinese manufacturer, so as to take advantage of the favourable manufacturing regime there and also to actively participate in the growing discount sector of the market. The first shipment of SUMMIT was received in the last quarter of, and sales have been very encouraging. The company will introduce additional sizes and increase production quantities in Traditionally, the Group has relied on the dealer network as its principal distribution channel. The dealer network, which is shared by all the main tyre distributors, has witnessed significant change in last 5 years with many now importing their requirements and hence becoming competitors. To address this, the board has, since 2012, continued to pursue its strategy of growing its retail network through the Yana Tyre Centres. The Group rolled out 6 new tyre centres in, bringing the total number to 16 within the region. The expansion of our retail stores comes with its own challenges however, given that set up costs for new tyre centres will continue to depress Group profits in the short term. The board is confident that the long term profitability of the company is dependent upon the aggressive growth of this channel. Risk management The board has committed the company to a process of risk management that is aligned to the principles of best practice and corporate governance. Our business strategy depends upon us taking calculated risks in a way that does not jeopardize the direct interests of the different stakeholders. Sound assessment of risk enables us to anticipate and respond to changes in our business environment, as well as make informed decisions under conditions of uncertainty. The risk management process has been embedded in our business systems and processes, so that our responses to risk remains current and dynamic. All key risks associated with major change and significant actions by the company also fall within the process of risk management. Governance and remuneration There was no change in the composition of the board during the year. The various board committees continued to play a vital role in supporting the board in discharging its duties. In, as part of our expanded reporting and enhanced corporate governance, the board introduced a separate and comprehensive section on governance and remuneration in this integrated report. 19
20 1.7 Chairman s statement (Continued) In it, your board reports on all key areas addressed during the year, as well as detailing future areas of emphasis. In addition, the section also details our policy on remuneration and how it is linked to strategy. The chairman of the audit, risk and corporate governance committee also reports separately, highlighting areas that the committee reviewed during the year and reporting on the significant financial reporting issues and judgements made in connection with the preparation of the Group s financial statements and risk management processes. Social responsibility and sustainability Our social responsibility and sustainability efforts continued unabated in, given that we undertake these with the same passion as our commercial activities. Indeed, all our programs are underpinned by the fact that they are part of our strategy and not something we are forced to do by regulatory mandate. Outlook East African economies are projected to grow at an average of 6.5% per annum through to 2018, driven by growth in transport, tourism, communications, mining and agriculture and supported by public investment in infrastructure. However, security concerns in Kenya may impact on tourism and negate the expected gains from that sector. The changing environment in which Sameer Africa operates presents both opportunities and challenges which the board continues to evaluate and to realign its strategies. The planned increase in electricity generating capabilities in Kenya and the discovery of oil and coal is likely to see a significant reduction in the cost of energy in the coming years and which will significantly reduce our factory conversion costs and with it, the eventual cost of tyres produced locally. A number of projects including the standard gauge railway, Lamu Port and LAPSSET projects and infrastructure developments in the northern corridor are also expected to significantly reduce logistics and transportation costs. This will not only reduce the cost of inbound materials but also the distribution costs of manufactured goods. Your company continues to realign itself to new realities. Your board is therefore aware that the onslaught of subsidized tyres from the East will continue. The introduction and growth of our SUMMIT brand will be key to securing market share in the discount sector of the market and to protect margins of our YANA brand. Nonetheless, your board will continue to lobby, through various industry bodies, for the imposition of countervailing and antidumping duties on subsidised tyre imports so as to protect our local manufacture. The sustainability of local manufacturing in the face of increased dumping and subsidized tyre imports into the market is also dependent on modernising manufacturing technologies in our Nairobi plant. As noted above, your board will actively continue to seek and contract with a technical and equity partner who is expected to inject significant capital. In 2015, we will also look aggressively at opportunities to unlock value from our significant property portfolio. Ongoing and planned improvements to the road infrastructure will mean that the Industrial Area of Nairobi will become an improved destination for commercial office and retail developments. We will also continue to focus on our key strategic priorities: Firstly, a clear focus on maintaining a healthy top line and bottom line with the priority being profitable growth. Growth at any cost is not your company s way of doing business. We will continue to focus our attention on increasing efficiencies across the board and realigning costs to protect margins. Secondly, enhance customer contact which entails a mixture of superior customer service as well as customer loyalty programs that deliver on excellent customer relationships. Thirdly, we will continue to manufacture high performance tyres that ride on a strong heritage associated with high quality, durability, reliability and safety. We will continue to develop and diversify our product offering so as to meet ever changing customer requirements. Fourthly, we will invest in our people to achieve superior performance for our customers and shareholders alike. We are very conscious of the need to provide appropriate development for our talented workforce. Encouraging effective collaboration and teamwork across the company, within the bounds of regulation and good governance, is also a key part of our strategy. In 2015, the board will also continue to enhance governance practices and will focus relentlessly on risk management. Finally, I would like to thank all shareholders, business partners, advisors and customers for their unwavering support and goodwill. My appreciation also to the members of the board, management and staff for their efforts and contribution to the sustainable growth of Sameer Africa Limited. God bless Sameer Africa Limited and each of you!!! Eng. Erastus Kabutu Mwongera FIEK, RCE, CBS Chairman 20

21 1.8 Taarifa ya Mwenyekiti Waheshimiwa wanahisa, wanachama wa halmashauri, mabibi na mabwana, ni furaha kuwakaribisha nyote katika mkutano mkuu wa pamoja wa arobaini na sita (46) wa kila mwaka wa kampuni unaofanyika tarehe hii 29 Mei 2015, katika ofisi kuu ya kampuni kando ya barabara ya Mombasa, Nairobi, Kenya. Mwaka ulikuwa ni mojawapo ya miaka migumu zaidi na uliyokuwa na changamoto kwa Sameer Africa Ltd. Utendaji wa kundi uliathirika vibaya na hali ya fedha iliyobanika kwa wauzaji wasambazaji na vilevile kwa ushindani unaoongezeka kutoka kwa bidhaa zilizo punguziwa gharama zilizoagizwa kutoka nchi za Mashariki. Ijapokuwa gharama za utengenezaji katika kiwanda zilishuka kwa asilimia 3, kutokana hasa na bei zilizoshuka za malighafi za pembejeo, bei wastani ya mauzo ya bidhaa yetu inayoongoza ya YANA iliteremka tena kwa asilimia 7 ikilinganishwa na wakati huo huo mwaka jana, huku ushindani kutoka kwa bidhaa zilizopunguziwa gharama zilizoagizwa kutoka nje ukishamiri. Mauzo nje ya nchi pia yalipungua katika mwaka, kutokana na mchafuko wa kijamii na kisiasa katika masoko yetu mengine pamoja na uhaba wa fedha za kigeni katika masoko mengine. Kutokana na hayo mapato ya kundi yalishuka kwa asilimia 6 kufika Kshs bilioni 3.8, ikilinganishwa na Kshs bilioni 4.03 iliyorekodiwa mwaka. Mwaka huu ulishuhudia kuongezeka kwa gharama za uendeshaji kwa asilimia 10, zikiathiriwa hasa na gharama za kuanzisha vituo vipya vya rejareja na gharama za mwaka mzima za kampuni yetu tanzu ya Burundi, na vilevile pia zikiathiriwa na athari za mfumuko wa bei kwa jumla. Athari za mchanganyiko wa kushuka kwa mapato ya kundi na kuongezeka gharama za uendeshaji zilisababisha kundi kurekodi hasara kabla ya kodi ya Kshs milioni 69 ikilinganishwa na faida ya Kshs milioni 457 iliorekodiwa mwaka wa. Faida ya mwaka, hata hivyo, ilikuwa imepelekwa juu na faida ya nadra ya Kshs milioni 255 kutokana na uuzaji wa ardhi. Mazingira ya uendeshaji kazi Uchumi wa ulimwengu ulikuwa kwa kiasi cha kadiri cha asilimia 3.3% katika mwaka, ukionyesha mfululizo wa utendaji dhaifu, hasa katika nchi ya umoja wa marekani na uropa vilevile na changamoto katika uchumi wa nchi zinazoibuka na zilizokaribia kuibuka. Nchini Kenya, sekta ya utengenezaji bidhaa ni kisukumo muhimu cha mpango wa ruwaza 2030 na ina uwezo mkubwa ambao haujategwa ili kuchangia ajira na ukuaji wa pato la kitaifa. Mchango wa sekta kwa pato la kitaifa hata hivyo ulizorota kutoka asilimia 9.5 mwaka 2012 hadi asilimia 8.9 mwaka. Utendaji huu usioridhisha umechangiwa kwa kiasi kikubwa na ushindani mgumu, na kwa wakati mwingine usio wa haki, kutoka kwa bidhaa zinazoagizwa kutoka nje, gharama kubwa ya madeni,vilevile na gharama za juu za nishati zikifananishwa na nchi shindani. Kufurika kwa bidhaa ghushi na bei zisizo thabiti za mafuta kimataifa pia zimeendelea kuathiri vibaya sekta hiyo. Eng. Erastus Kabutu Mwongera FIEK, RCE, CBS Mwenyekiti 21
22 1.8 Taarifa ya Mwenyekiti (Kuendelea) Mazingira ya utengenezaji magurudumu Tumeshuhudia mwenendo wa kushuka gharama za pembejeo za malighafi za utengenezaji magurudumu katika miaka 3 iliyopita, ikisukumwa hasa na kushuka bei za raba asili kwa kiasi cha kipekee raba asili ni kiungo mojawapo muhimu cha utengenezaji magurudumu. Baada ya pembejeo za malighafi, nishati hubeba gharama ya pili kubwa zaidi katika mchakato wa utengenezaji magurudumu. Kwa hivyo, mabadiliko ya bei za umeme na mafuta ya tanuri huathiri kwa kiasi kikubwa gharama za ubadilishaji na hatimaye huathiri uwekaji bei na mapato ya bidhaa zetu. Gharama za juu za umeme zinaendelea kuwa na athari mbaya kwa watengenezaji bidhaa nchini, huchangia gharama za juu za bidhaa zilizokamilika ikifananishwa na bidhaa zilizotengenezwa kutoka mataifa yenye bei za nishati kidogo zenye nafuu. Halmashauri yenu inafahamu vizuri ukweli kwamba teknolojia ya utengenezaji magurudumu inayotumika sasa Sameer Africa kidogo imepitwa na wakati ikilinganishwa na viwanda katika bara Asia, bidhaa zao ambazo lazima tushindane nazo. Kutatua hili halmashauri yenu iko katika hatua iliyosogea mbele ya mazungumzo ya kutafuta mshirika na mwekezaji wa kiufundi na wa hisa za usawa kukifanya kiwanda kiwe cha kisasa na chenye muundo mbinu husika. Ikiwa mazungumzo hayo yatakamilika, tutaweza kushuhudia kupungua kwa gharama za utengenezaji wa bidhaa zetu za YANA na pamoja na hilo nguvu zetu za ushandani zitaongezeka katika soko. Muhtasari wa soko Soko la magurudumu la Afrika Mashariki linakisiwa kuwa magurudumu milioni 4 kwa mwaka. Sehemu ya Sameer Africa katika soko hili inakisiwa kuwa baina ya asilimia 8 na 10. Usajili wa magari nchini Kenya umekua kwa kiwango cha wastani cha asilimia 10 kwa mwaka kati ya mwaka 2009 na na inatarajiwa soko litaendelea kukua kwa kiwango hiki. Uchina hutumia vipimo vinavyobadilika vya mpaka kufikia asilimia 81% ya mapato ya mauzo ya watengenezaji kulingana na vipimo au aina ya magurudumu kupunguzia gharama moja kwa moja magurudumu yanayotoka huko. Aidha, mtindo wa waingizaji bidhaa kutoka nje katika kanda nzima kuonesha bei ya chini katika ankara umesambaa sana, hivyo kuufanya uwanja wa mchezo kuegemea dhidi ya Sameer Africa. Aidha, magurudumu mengi yanaingia nchini bila kulipiwa ushuru kutokana na mipaka ya Kenya kuwa na mipenyezo. Kutokana na hayo, mauzo ya Sameer Africa kwa kitengo cha wafanyi biashara wasambazaji sasa yamepungua kwa asilimia 20 toka mwaka, kwa kuwa wasambazaji wengi wameamua kuagiza wenyewe mahitaji yao ya bidhaa. viwanda vya Eveready na Cadbury, ambako kulifatia kufungwa kwa Reckitt Benckiser, Colgate Palmolive na Johnson & Johnson ni ushuhuda wazi wa changamoto wanazozikabili watengenezaji wenyeji. Ili kukabiliana na athari inayoathiri mapato ya kampuni kutokana na kupunguziwa gharama magurudumu yaliyoagizwa kutoka nje, halmashauri yenu katika mwaka, ilianzisha utengenezaji, aina ya bidhaa yake ya pili SUMMIT kwa kandarasi na mtengenezaji kutoka China ili kunufaika na usimamizi maridhawa wa utengenezaji ulioko huko na vilevile kushiriki kikamilifu katika sekta ya soko inayokua ya bidhaa zenye punguzo la bei. Shehena ya kwanza ya SUMMIT ilipokewa katika robo ya mwisho ya mwaka, na mauzo yamekuwa yenye kutia motisha. Kampuni itaanzisha vipimo vingine zaidi na kuongeza kiasi cha utengenezaji katika Kiasilia, kampuni imetegemea mtandao wa wauzaji kama njia kuu ya usambazaji. Mtandao wa wauzaji unaotumiwa na kila msambazaji mkuu wa magurudumu, umeshuhudia mabadiliko makuu katika miaka 5 huku wengi sasa wakiagiza wenyewe bidhaa kutoka nje kukidhi mahitaji yao hatimaye wanakuwa washindani. Ili kushughulikia suala hili, halmashauri toka mwaka 2012, imeendelea kutekeleza mkakati wa kukuza mtandao wake wa rejareja kupitia vituo vya magurudumu vya Yana. Kundi lilianzisha vituo 6 vipya katika mwaka, na kufikisha idadi ya jumla ya vituo 16 katika kanda. Upanuzi wa maduka yetu ya rejareja unakuja na changamoto zake hata hivyo, kwa kuwa gharama za kuanzisha vituo vya magurudumu zitaendelea kushusha faida za kundi katika kipindi kifupi kijacho. Halmashauri ina imani katika kipindi kirefu kijacho faida ya kampuni itategemea ukuaji wa nguvu wa njia hii ya uuzaji. Usimamizi wa tishio Halmashuri imejitolea kuwa kampuni itakuwa na taratibu za usimamizi wa tishio ambazo zinafungamana na kanuni za utendaji bora na utawala bora wa kampuni. Mkakati wetu wa kibiashara unatutegemea sisi kuchukua hatua zilizokadiriwa ingawa ni za kutisha kwa njia isiyo hatarisha maslahi ya moja kwa moja ya washika dau mbalimbali. Kutathmini kikamilifu tishio hutuwezesha kutarajia na kukabiliana na mabadiliko katika mazingira yetu ya kibiashara, vilevile kusaidia kufanya maamuzi yenye ufahamu wa mambo wakati wa hali za kutatanisha. Taratibu za usimamizi wa tishio zimeambatanishwa na mifumo na taratibu zetu za kibaishara,ilikwamba hatua dhidi ya tishio zitakuwa za kisasa na zenye kuuwiana. Tishio zote zinazohusiana na mabadiliko makuu na hatua muhimu za kampuni pia zinaingia ndani ya taratibu za usimamizi wa tishio. Licha ya juhudi bora za ushawishi, Sekta ya utengenezaji nchini Kenya imepokea usaidizi mchache kutoka kwa serikali kwa upande wa sera zinazolenga kulinda watengenezaji wenyeji. Kufungwa hivi karibuni kwa 22 Utawala na mishahara Kulikuwa hakuna mabadiliko katika mpangilio wa halmashauri katika mwaka. Kamati mbalimbali za halmashauri ziliendelea kutekeleza majukumu muhimu ya kusaidia halmashauri kutimiza wajibu wake.
23 1.8 Taarifa ya Mwenyekiti (Kuendelea) Katika, kama sehemu ya kupanua ripoti zetu na kuboresha utawala bora wa kampuni, halmashauri imeanzisha kifungu kilichotengwa na cha kina cha utawala bora wa kampuni na mishahara katika ripoti yetu jumuishi. Katika sehemu hiyo halmashauri ina ripoti juu ya nyanja muhimu zilizoshughulikiwa katika mwaka, vile vile kuweka wazi nyanja za kuangaziwa siku zijazo. Aidha kifungu hicho kina maelezo juu ya sera yetu ya mishahara na inavyouwiana na mkakati. Mwenyekiti wa kamati ya ukaguzi, tishio, na utawala bora wa kampuni huripoti kando, akiangazia nyanja zilizochambuliwa na kamati katika mwaka na kuripoti juu ya masuala muhimu ya kifedha na maoni kuhusu utayarishi wa ripoti za fedha za kundi na taratibu za usimamizi wa tishio. Uwajibikaji kijamii na uendelevu Juhudi zetu za uwajibikaji kijamii na za uendelevu ziliendelea bila ya kusita katika mwaka, hasa ikizingatiwa kuwa sisi hufanya hayo kwa ari ile ile kama ari ya shughuli zetu za kibiashara. Kwa hakika,mipango yetu yote inakokotezwa na uhakika kuwa ni sehemu ya mkakati wetu na wala sio jambo tumeshurutiswa kufanya na mwongozo wa mamlaka. Mtazamo bidhaa kwa magurudumu yaliyopunguziwa gharama yanayoingizwa kutoka nje ili kulinda watengenezaji wetu wa ndani. Uendelevu wa utengenezaji nchini, mkabala na ubwagaji bidhaa unaongezeka na bidhaa zilizopunguziwa gharama kutoka nchi za nje zinazoingia kwenye soko unategemea pia kujadidi teknolojia ya utengenezaji katika kiwanda chetu Nairobi. Kama ilivyobainishwa hapo juu halmashuri yenu itaendelea kutafuta na kuingia kwenye mkataba na mshirika wa kiufundi na mwekezaji wa hisa za usawa anayetarajiwa kuchangia mtaji mkubwa. Katika mwaka 2015, tutatafuta kwa juhudi kubwa nafasi za kufumbua thamani kutoka kwa majumba yetu mengi. Uboreshaji unaondelea na uliopangwa wa muundo mbinu wa barabara utamaanisha kuwa eneo la viwandani Nairobi litakuwa ni kituo kilichoboreka cha ofisi za kibiashara na ukuaji wa biashara za rejareja. Tutaendelea kuzingatia vipaumbele vyetu muhimu vya kimkakati : Kwanza, mwelekeo sahihi wa kudumisha mapato bora na faida na kipaumbele ni ukuaji wa faida.ukuaji wa bila kujali gharama siyo njia ya kampuni yenu ya kufanya biashara. Tutaendelea kuangazia hima yetu katika kuongeza utendaji bora katika nyanja zote na kusawazisha gharama ili kulinda faida. Uchumi wa nchi za Afrika Mashariki unatabiriwa kukua kwa kiwango cha wastani wa asilimia 6.5 kwa mwaka hadi mwaka Ukiendeshwa na ukuaji katika usafiri, utalii, mawasiliano, uchimbaji madini, na ukulima na ukichangiwa na uwekezaji wa umma katika miundo mbinu. Hata hivyo wasiwasi juu ya usalama nchini Kenya unaweza kuathiri utalii na kunyima faida zinazotarajiwa katika sekta hiyo. Mazingira yanayobadilika ambamo Sameer Africa inaendesha kazi yanaleta mawili, nafasi na changamoto na halmashauri inaendelea kutathmini na kufanyia marekebisho mikakati yake. Mpango ulioko wa kuongeza uwezo wa uzalishaji wa umeme nchini Kenya na ugunduzi wa mafuta na makaa ya mawe yote hayo yanaweza kuleta kupungua kwa kiasi kikubwa kwa gharama ya nishati katika miaka ijayo na itapunguza kwa kiasi kikubwa gharama zetu za ubadilishaji na pamoja na hayo hatimaye kupunguwa gharama za magurudumu yanayotengenezwa nchini. Miradi mingi ikiwemo miradi ya ujenzi wa reli mpya, bandari ya Lamu na LAPSSET na ujenzi wa miundo mbinu katika ukanda ya kaskazini inatarajiwa pia kupunguza kwa kiasi kikubwa gharama za usimamizi wa usafirishaji na za uchukuzi. Hili halitopunguza gharama za bidhaa zinazokuja tu bali pia gharama za usambazaji bidhaa zilizotengenezwa. Kampuni yenu inaendelea kujizatiti kukabiliana na hali halisi mpya. Halmashauri yenu kwa hivyo inafahamu vizuri hujuma ya magurudumu yanayopunguziwa gharama yanayotoka nchi za mashariki itaendelea. Uanzilishi na ukuaji wa bidhaa ya SUMMIT itakua ni muhimu katika kuchukuwa sehemu katika sekta ya soko la bidhaa zenye punguzo la bei na kuhifadhi mapato ya bidhaa zetu za Yana. Hata hivyo halmashauri yenu itaendelea kushawishi, kupitia makundi mbalimbali katika sekta ya kibiashara, kuwekwa ushuru dhidi ya ubwagaji Pili, kuongeza mawasiliano na wateja na kufanya hivyo kunahitaji kuchanganyisha huduma ya hali ya juu kwa wateja na vilevile mifumo ya kuvuta uaminifu wa wateja inayoleta uhusiano bora nao. Tatu, tutaendelea kutengeneza magurudumu yenye utendaji wa juu yanayoandamana na utamaduni madhubuti unaotungamanishwa na ubora wa bidhaa, kudumu, kutegemewa na usalama. Tutaendelea kuanzisha na kupanua aina ya bidhaa zetu tunazozitoa ili kutimiza mahitaji ya wateja yanoyobadilika kila mara. Nne, tutawekeza kwa watu wetu ili kufikia utendaji unaoshinda kwa ajili ya wateja wetu na vilevile pia kwa wanahisa. Tunafahamu sana haja ya kuwapa wafanyikazi wetu wenye vipaji maendeleo mwafaka. Pia ni sehemu muhimu ya mkakati wetu kuhimiza ushirikiano wa sawa na kufanya kazi kwa umoja kote kwenye kampuni kuambatana na miongozo na utawala bora. Katika mwaka 2015, halmashauri itaendelea kuinua desturi za utawala na tutazingatia bila kusita usimamizi wa tishio.mwisho ningependa kuwashukuru wanahisa wote,washirika wa biashara,washauri na wateja kwa usaidizi wao usiotelekeza na ukarimu wao.shukurani zangu pia ziende kwa wanachama wa halmashauri,wasimamizi na wafanyikazi kwa juhudi na mchango wao katika ukuaji himilivu wa Sameer Africa Limited. Mungu ibariki Sameer Africa Limited na kila mmoja wenu!!!!! Mhandisi Erastus Kabutu Mwongera. FIEK,RCE,CBS Mwenyekiti 23

24 195R15C 24
25 Contents SECTION 2: STRATEGIC REPORT PAGE 2.1 Managing Director s report Ripoti ya Mkurugenzi Mkuu Organisational review and business model Operating context and risk management Strategy review Performance review
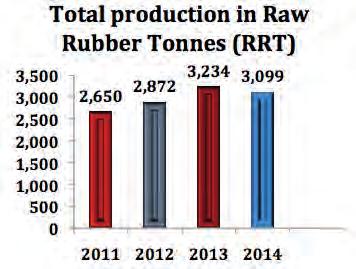
26 2.1 Managing Director s report Despite the challenging economic environment, we took significant steps during the year to strengthen our business for the future, increase our competitive advantage and prepare us for growth. was a challenging year both operationally and financially, as we progressed our strategy of growing and rebalancing the business. Although performance for the first half of the year was modestly upbeat, with revenues and pretax profits increasing by 1% and 4.5% respectively as against same period in, the onslaught from imported, subsidized and uncustomed tyres and a consumerled slowdown in the second half of the year, completely eliminated the first half gains. Dealer trade sales in, declined by a staggering 20% compared to, with export sales declining by a further 23%. Whilst raw material prices declined by 10% in, compared to, the benefits arising from the lower production costs were passed on to customers through increased discounts as a strategy to counter competition and to maintain market share. Despite the challenging economic environment, we took significant steps during the year to strengthen our business for the future, increase our competitive advantage and prepare for growth. The Group continued to focus on its key strategic thrusts of profitable growth, maximizing retail sales and aggressive cost reduction plans. Consequently, the Group rolled out 6 new tyre centres in, and increased its product and service offerings across all distribution channels. To cushion the Group against increased competition, the Group also launched its fighter brand SUMMIT which is price positioned to compete in the growing discount sector of the market. Business review Total tyre production declined by 5% in, to 3,099 raw rubber tonnes (RRT) compared to 3,240 RRT produced in, on account of the decline in demand in the second half of the year, longer factory shutdown periods as well as a deliberate effort to reduce our inventory levels. Total production costs declined by 3%, from Kshs 858,000/RRT in to Kshs 831,000/RRT mainly on account of the 10% drop in the cost of raw material inputs. Factory conversion costs increased by 6% to Kshs 389,000/ RRT when compared to, driven mainly by higher energy costs as well as additional depreciation on recent plant upgrades. Allan Walmsley Managing Director 26 We continued to witness growth in vehicle registrations in all the territories in which we operate, supported by various infrastructural projects and a growing middle class but the competitive environment continued unabated with growing imports of subsidised tyres from the East and an unprecedented growth in uncustomed tyres
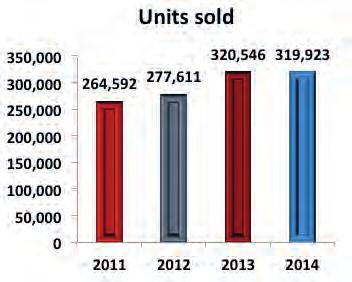
27 2.1 Managing Director s report (Continued) entering the East African markets. Indeed, the discount sector of the market has grown to over 50% of total tyre demand in the last 5 years alone. We have positioned ourselves in this discount market segment with the launch of our SUMMIT fighter brand. We continued with our banded offer promotion throughout the year and also launched a number of instore promotions across our Yana Tyre Centres. Tactical sales promotions were carried out on certain tyre categories whilst general awareness campaigns were run on television and radio. Sales revenues from our tyre business declined by 7% from Kshs 3.9 billion in to Kshs 3.6 billion in. Channel performance was mixed with notable growth in sales to Government bodies (82%), fleet (27%) and Yana Tyre Centres (15%). However, the decline in sales to both the dealer trade (20%) and the export market (23%) reversed these gains. Unit sales remained relatively unchanged at 320,000 units, a marginal 2% decline against. Volume growth was however, witnessed in passenger, 4X4, truck and bus and agricultural tyres but with volume growth challenges remaining in the light truck and medium truck categories. Gross margin declined to 25%, from the 27% recorded in, in line with increased competition from imported tyres. The Group recorded a pretax loss of Kshs 69 million, compared to a profit of Kshs 457 million recorded in. The combined effect of declining sales and higher operating expenses adversely affected performance. A negative earnings per share of Kshs 0.24 is recorded for, compared to an earnings per share of Kshs 1.44 recorded in. However, the Group s cash generation improved during, as we emphasized on working capital management by encouraging more cash sales, aggressive collection of receivables and the liquidation of excess inventory. Capital spend increased to Kshs 232 million, compared to Kshs 190 million in, mainly on the establishment of new tyre centres and the continuous upgrade of our manufacturing plant. The implementation of our risk management framework was completed in and our focus now is on risk amelioration through monitoring, reassessment and reporting. In, we continued to leverage our SAP backbone system by focusing on value extraction, especially in the area of purchasing, warehouse management, finance and controls and time and attendance. During the year we also upgraded and migrated our Microsoft servers, and mail and office applications to the version. Other ICT projects included the setup of a fullyfledged call centre, installation of phase one of the CCTV surveillance system and a number of online marketing campaigns. Update on our strategic priorities Profitable growth Our strategic objectives are to achieve certain targeted gross and operating margins while growing revenues. During the year we witnessed a downward trend against our objectives with a decline in sales and a reduction in both gross and operating margins. This was attributable to the decline in the size of the premium and high price market segments where our Bridgestone and YANA brands are positioned. Our late entry into the growing discount segment with our SUMMIT brand also did not assist. Our strategy to grow export revenues was adversely affected by civil and political unrest in certain of our markets as well as hard currency shortages in others. On the upside, we grew our cash generated from operations through improved working capital management. During the last quarter of the year, we embarked on an aggressive program to reduce both factory conversion costs and operating expenses. Although most cost initiatives are likely to be actualized in 2015, we did achieve cost savings in excess of Kshs 10 million in the last quarter of. Customer focus We remain focussed on achieving unrivalled customer satisfaction levels through effective communication, increasing direct customer contact through our Yana Tyre Centres, delivering quality products on time and revamping our marketing activities. To date we have achieved an end user satisfaction index of 76% against a 2016 target of 85%. During the year, we rolled out six new Yana Tyre Centres across the region bringing the total number to sixteen. We also completely refurbished two tyre centres in order to improve customer and street appeal. We launched our new Yana call centre with the key objective of providing a direct link to our customers and consumers through various communication channels. To date we have collected over 16,000 contacts and completed a pilot communication initiative for the launch of our SUMMIT brand. Our strategy of resolving tyre claims within 48 hours has improved to 90% against a target of 95% and our claim ratio has dropped to only 0.47% of total tyres sold due to our continuing uniformity improvement initiatives. Formal and detailed surveys of customer brand awareness and customer service perceptions were carried out during the year, the findings of which continually assist in formulating future strategies with regards to our marketing and customer service platforms and systems. Innovation We are three years into our strategic plan and Sameer Africa is now a demonstrably stronger and a more efficient business operationally, financially and innovatively. During, we achieved mixed results against our strategic priorities which were aimed at positioning the Group for future growth, whilst controlling costs and maximising the efficiency of our balance sheet. We are committed to the manufacture of high performance tyres of the highest quality, durability, reliability and safety; attributes which give better value for money in terms of cost per kilometre (CPK). We remain focussed on our strategy of upgrading our manufacturing technologies and improving factory utilization. 27
28 2.1 Managing Director s report (Continued) During the year we launched 10 new YANA and 8 new SUMMIT tyre sizes which accounted for 7% of total annual revenue. Since the commencement of our strategic plan in 2012, we have launched a total of 30 new tyre sizes accounting for 18% of total revenue in. We continued to improve the uniformity and thumb balance ratio of our products through both capital interventions and process changes. Our tyre uniformity initiatives achieved an average yield of 67% during the year with a high of 87% in July. Post year end, we have registered a uniformity yield of 96% and 89% in January and February 2015, respectively. We continued to focus on factory waste and scrap reduction by reducing the number of operatorrelated defects during tyre curing and building, daily machine verifications, treatment of hydraulic water in powerhouse as well as repairs to certain equipment. I am happy to report that these initiatives are bearing fruit and during, we registered a 19% reduction in scrap and waste, compared to. We achieved a factory utilisation of 73% at 13.2 RRT/ day against a strategic target of 80% (14.5 RRT/day). Improving factory utilization remains a challenge given the decline in market segment for our YANA brand. Upgrading our manufacturing technology remains a critical component to ensuring efficient manufacturing. We estimate a capital injection of Kshs 1.2 billion is required to replace our ageing equipment with the latest, state of the art equipment. During the year, discussions continued with a potential technical and equity investor to modernise our plant and related infrastructure. People and leadership Sustainability performance At Sameer Africa, the bedrock principle is that we conduct our business in a sustainable and responsible manner. We will always ensure that our business today never compromises the ability of future stakeholders to meet their own needs. Environmental and social aspects have a strong link with economic performance through the investments we make in environmental management initiatives and which involves our work with employees, suppliers, customers and the community. Environmental performance Our activities for environmental management focus on key aspects in the operational units, manufacturing process and product output where we endeavour to minimise negative impacts and enhance positive ones. During the year we carried out boiler stack emissions testing and analyses. To evaluate the levels of contaminant concentrations emitted from the measured emissions, World Bank Guidelines for maximum values were used. The results were well within the guidelines and continued to show an improvement in the stack emission quality from the burner, compared with values recorded in. Sampling of Volatile Organic Compounds (VOC s) was also concluded in, according to ISO The VOC s were passively sampled into diffusion tubes packed with adsorbents. Laboratory analysis was carried out and results showed Below Detectible Limits for most of the compounds. Social performance Social performance measures the company s interactions with its employees and the community. Our strategy remains to create a lean, dynamic and fitforpurpose organisation. We aim to attract, develop and retain the right talent while inculcating a performance based culture. During our training calendar year running from April to March 2015, we targeted 60 staff training courses and at the close of, we had conducted 42 training programs, representing 70% of target. Overall leave utilisation was 84% against a target of 90%. We continue to enforce our policy of a maximum leave carryover of 7 days per staff member. We successfully concluded the CBA negotiations with the principal union of our unionisable staff for the years 2015 and We also continuously endeavour to improve staff communication through departmental meetings and other informal interactions. During the year, the Managing Director continued with his flagship breakfast meetings with staff in all departments where performance and strategic information is disseminated and feedback is received. During the year we achieved 98% compliance on performance measurement and we have now aligned our reward system to performance. 28 Employees Employee turnover in averaged 11% which was within the industry acceptable level of 14%. We saw high turnover ratios recorded in Finance, Sales and our Tanzania operations. Management continues to address challenges affecting staff turnover in those departments. The company follows international standards on health and safety. There were no fatalities arising from any of our operations during the year. We however, lost 853 man days through sick leave and 552 man days through injury leave arising from 16 accidents; 7 at the work place and 9 away from the office. Measures have been taken to enhance employee awareness on the importance of having protective gear at all times and adhering to laid down safety regulations. The company has a Wellness program which is used to raise awareness on personal wellbeing of our employees. In, we ran awareness campaigns on personal financial management, Ebola, ENT, kidney disease and cancer. The company recognises and is sensitive to human rights and has policies against discrimination in any form. Our employees are made aware of the expectation not to engage in any fraudulent or corrupt dealings in any of their business activities. Our policy is zero tolerance to these vices.
29 2.1 Managing Director s report (Continued) Product responsibility The quality standards on our product performance, health and safety has been a key differentiator of our brands in the market. All our products come with a manufacturer s warranty; a testimony to the belief we have in our production processes. Social responsibility Sameer Africa community development initiatives focus on improving the livelihoods and general wellbeing of the societies in which we operate. During the year, we supported various charities through sponsored golf tournaments and direct contributions to needy causes. On safety, we undertook 110 technical trainings on tyre handling and safety to target groups including matatu saccos, tour operators and mechanics. In recognition of these initiatives, Sameer Africa was awarded the Public Safety Award. Outlook We expect the challenging operating environment, as witnessed in, to persist into The influx of imported, subsidized and uncustomed tyres is likely to continue with adverse effects on both our volumes and margins. On a positive note, the economic outlook for most African countries and in particular East African economies, appears promising. We therefore anticipate sustained growth in the demand for tyres in the coming year. We have already noted a significant decline in the cost of electricity going into 2015, and we expect crude oil prices to remain depressed for most of the year. Early indications are that raw material prices used for tyre manufacture will continue to decline by more than 10% in 2015, with a favourable effect on our factory costs. In 2015, we will continue to focus on our strategic priorities and in particular reversing the negative sales trends witnessed in, by: aggressive penetration into the discount sector of the market using our SUMMIT fighter brand; exploring new export markets and strengthening existing ones; increasing our corporate and government customer base; and focussing on cash and overall reduction in working capital levels. We will also intensify our high volume Yana sales promotions to reverse the declining dealer trade sales in the light and medium truck categories. Our brand building activities will include media advertising campaigns for both the Yana brand and our Yana Tyre Centres. We plan to fully operationalize our Yana call centre as well as using our website to support below the line marketing activities. On innovation, we plan to roll out additional sizes under both Yana and Summit. We are optimistic that we will finalise negotiations to secure a new technical partner who will contribute both capital and equipment to modernise our factory but we will also continue to explore contract manufacturing options and alternatives both within our plant as well as offshore. We plan to intensify the cost cutting initiatives rolled in the last quarter of, and we will focus on rationalising establishment costs as well as cost reductions in energy and scrap in the factory. Our target is to achieve annual cost savings of Kshs 120 million in overheads and Kshs 100 million in factory conversion costs. We will also review the cost structures of our regional operations in Tanzania, Uganda and Burundi with a view to running profitable operations. We will continue to leverage on our IT systems and plans are underway to develop SAP bank integration, an electronic document management system and disaster recovery and cyber security enhancements. To ensure the achievement of our strategic objectives through people, we will continue to develop our talent pipeline at all levels and we will continue to refine our efforts to achieve a performance based culture in line with our strategic objectives. We have plans to fully implement succession planning at all levels within the organisation in We will continue to focus on our property portfolio to maximize returns, given that we have now achieved 100% occupancy at Sameer Industrial Park and Sameer Export Processing Zone. We will also continue our efforts to tenant Sameer Business Park but against a strategy of securing only AAA tenants for this world class facility. In 2015, we will also look aggressively at other opportunities to unlock value from our significant property portfolio. Ongoing and planned improvements to the road infrastructure will mean that the Industrial Area of Nairobi will become an improved destination for commercial office and retail developments. The Group would never have reached this stage of its journey without our people and the value system that forms the basis of all our endeavours. We faced significant challenges in, but given these challenges we believe that we have developed strategies which will continue to see the Group prosper into the future. We have an incredibly diverse and talented group of people in this company who are committed to creating and delivering continuous value to our customers, our shareholders and society at large. We are in the process of concluding contract negotiations for additional Yana Tyre Centre sites. To improve on customer and street appeal, we plan to renovate and rebrand our existing tyre centres. Allan Walmsley Managing Director 29


30 2.2 Ripoti ya Mkurugenzi Mkuu Licha ya changamoto za kiuchumi, tulichukua hatua muhimu katika kipindi cha mwaka kuimarisha biashara yetu kwa ajili ya siku zijazo,kuongeza nguvu za ushindani na kujiandaa kwa ukuaji. ulikuwa mwaka wenye changamoto kwa pande mbili za kiuendeshaji na kifedha, huku tukiendeleza mkakati wetu wa ukuaji na wa kusawazisha biashara. Ingawa utendaji katika nusu ya kwanza ya mwaka ulikuwa wa kuridhisha kidogo, huku mapato na faida kabla ya kodi yakiongezeka kwa asilimia 1 na asilimia 4.5 mtawalia ikilingalishwa na kipindi kama hicho katika mwaka, pigo kutoka kwa bidhaa zilizopunguzwa bei ambazo ziliagizwa kutoka nje na magurudumu ambayo hayakulipiwa ushuru na ukawiaji uliosababishwa na watumizi katika nusu ya pili ya mwaka, yote yalifutilia mbali faida iliyokuwa imepatikana katika nusu ya kwanza. Mauzo kwa wauzaji wasambazaji katika mwaka, yalipungua kwa kushangaza mno, kwa asilimia 20 ikilinganishwa na mwaka, na mauzo katika nchi za nje kupungua kwa asilimia 23 zaidi. Licha ya kupungua kwa bei za mali ghafi kwa asilimia 10 katika mwaka, ikilinganishwa na, manufaa yaliyopatikana kutoka kwa gharama za chini za utengenezaji yalipeanwa kwa wateja kupitia punguzo za bei ikiwa ni mkakati wa kukabiliana na ushindani na kuweza kudhibiti sehemu katika soko. Licha ya changamoto katika mazingira ya kiuchumi, tulichukua hatua muhimu katika kipindi cha mwaka kuimarisha biashara yetu kwa sababu ya siku zijazo, kuongeza nguvu za ushindani na kujiandaa kwa ukuaji. Kundi liliendelea kuangazia misukumo muhimu yake ya kimkakati ya ukuaji wenye faida,kuzidisha mauzo ya rejareja na mipango madhubuti ya kupunguza gharama.kwa hivyo, kundi lilifungua maduka sita mapya ya kibiashara katika mwaka, na kuongeza aina ya bidhaa na huduma zinazotolewa katika njia zote za usambazaji. Ili kupunguzia kundi athari za ushindani, kundi lilizindua bidhaa yake ya ushindanisummitbei yake ikiwa imewekwa sawa kushindana katika sekta ya soko la bei zilizopunguzwa ambalo linaendelea kukua. Uchanganuzi wa biashara Allan Walmsley Mkurugenzi Mkuu 30 Jumla ya utengenezaji wa magurudumu ilishuka kwa asilimia 5 katika mwaka, ikiwa tani 3,099 ya raba (mpira) ikilinganishwa na tani 3240 ya raba iliotengenezwa mwaka, kushuka huko kulisababishwa na kuzorota kwa mahitaji katika nusu ya pili ya mwaka, vipindi virefu vya kufungwa kiwanda, na pia hatua za makusudi za kupunguza viwango vya bidhaa kwenye mabohari. Jumla ya gharama za utengenezaji zilishuka kwa asilimia 3, kutoka Kshs 858,000 kwa tani ya raba katika mwaka kufikia Kshs 831,000 kwa tani ya raba, kutokana hasa na kupungua gharama za pembejeo
31 2.2 Ripoti ya Mkurugenzi Mkuu (Kuendelea) ya mali ghafi kwa asilimia 10. Gharama za utengenezaji katika kiwanda ziliongezeka kwa asilimia 6 kufikia 389,000 kwa tani ya raba ikilinganishwa na mwaka, ikipanda juu kwa sababu ya gharama za juu za nishati na pia gharama zaidi za uchakavu kutokana na uboreshaji wa kiwanda hivi karibuni. Tuliendelea kushuhudia ongezeko la usajili wa magari katika maeneo yote tunayo endesha kazi. Ongezeko hilo lilitiliwa nguvu na miradi tofauti ya miondo mbinu na tabaka la kati linalokua lakini mazingira ya ushindani yaliendelea bila pingamizi kwa kuongezeka uingizaji wa bidhaa zilizopunguziwa gharama kutoka nchi za mashariki na ongezeko ambalo halijaonekana tena la magurudumu yasiyolipiwa ushuru yakiingia katika masoko ya Afrika Mashariki. Kwa hakika soko la bidhaa zenye punguzo la bei limekua hadi asilimia 50 ya jumla ya mahitaji ya magurudumu katika kipindi cha miaka mitano iliopita pekee. Katika mwaka, tulichukua nafasi katika kitengo cha soko la bei zenye punguzo kwa kuzindua bidhaa yetu ya ushindani ya SUMMIT. Tuliendelea na uvutiaji mauzo kupitia bei za mafungu katika kipindi chote cha mwaka na tukazindua vivutio kadhaa pale pale madukani katika vituo yetu vya Yana.Tulitumia uvutiaji mauzo kwa kutumia mbinu katika kuuza baadhi ya aina ya magurudumu huku kampeni za kufahamisha zikiendeshwa katika runinga na redio. Mapato ya mauzo kutoka katika biashara yetu ya magurudumu yalipungua kwa asilimia 7 kutoka shilingi bilioni 3.9 katika mwaka hadi shilingi bilioni 3.6 mwaka. Utendaji wa vitengo tofauti ulikuwa na matokeo tofauti kukiwa na ongezeko la kutambulika katika mauzo kwa idara za serikali (asilimia 82), wenye magari mengi(asilimia 21), na vituo vya magurudumu vya Yana (asilimia 15). Hata hivyo kupungua mauzo kwa wanabiashara wasambazaji (asilimia 20) na uuzaji katika masoko ya nje (asilimia 23) kulirudisha nyuma mafanikio yaliyokuwa yamepatikana. Idadi ya magurudumu yaliyouzwa ikilinganishwa na mwaka, ilibaki pasi na mabadiliko ikiwa ni magurudumu 320,000, ikiwa ni upungufu mdogo wa asilimia 2. Hata hivyo, ongezeko la mauzo kwa idadi lilishuhudiwa katika magari ya kibinafsi, 4x4, malori na mabasi na magurudumu ya ukulima lakini kulikuwa na changamoto katika mauzo kwa idadi ya aina zilizobakia za malori mepesi na malori ya kadiri. Jumla ya pato ilishuka kufika asilimia 25, kutoka asilimia 27 iliyosajiliwa mwaka wa, sambamba na kuongezeka ushindani kutoka kwa magurudumu yaliyoagizwa kutoka nje. Kundi lilisajili hasara kabla ya kodi ya Kshs milioni 69, ikilinganishwa na faida ya Kshs milioni 457 iliyosajiliwa katika mwaka. Mchanganyiko wa athari ya kudorora kwa mauzo na gharama za juu za utendakazi ziliathiri vibaya utendaji.hasara katika mapato kwa kila hisa ya senti 24 ilisajiliwa katika mwaka, ikilinganishwa na mapato kwa kila hisa ya Kshs 1.44 iliyosajiliwa mwaka. Hata hivyo, uzalishaji wa fedha wa kundi uliboreka katika mwaka, kwa kuwa tulisisitiza usimamizi bora wa mtaji wa kufanya kazi, tulihimiza uuzaji kwa malipo hapo kwa hapo, juhudi kuu ya kudai madeni na uuzaji wa haraka wa bidhaa zilizozidi. Matumizi ya kiraslimali yaliongezeka kufika Kshs milioni 232, ikilinganishwa na Kshs milioni 190 katika mwaka, yakitumika zaidi katika kuanzisha vituo vipya vya magurudumu na shughuli inayoendelea ya kuboresha mitambo ya utengenezaji. Utekelezaji wa mfumo wa usimamizi wa matukio ulikamilika katika mwaka na sasa tunaangazia kuboresha mfumo huo kupitia ufuatiliaji, kutathmini na kuripoti. Katika mwaka tuliendelea kutilia nguvu uti wa mfumo wetu wa SAP tukiangazia uchimbuaji wa thamani hasa katika nyanja za ununuzi, usimamizi wa bohari,fedha na udhibiti na kupima wakati na kuhudhuria.katika kipindi cha mwaka pia tuliboresha na kuhamisha vihudumu vya Microsoft, barua pepe na fumo tumizi za ofisi kutumia toleo la. Miradi mingine ya habari na mawasiliano ilijumuisha kituo kamilifu cha mawasiliano, na awamu ya kwanza ya mfumo wa ufatiliaji wa vipiga picha za usalama (CCTV) na kampeni kadhaa za uuzaji katika mtandao. Mpasho kuhusu vipaumbele Vyetu Vya Kimkakati Tumeingia katika mwaka wa tatu wa mpango wetu wa kimkakati wa miaka 2012 hadi 2016 na Sameer Africa ni wazi ina nguvu zaidi na biashara inaendeshwa kwa ubora zaidikiutendakazi,kifedha na kiuvumbuzi. Katika kipindi cha mwaka, tulipata matokeo mchanganyiko ikilinganishwa na vipaumbele vya kimkakati vilivyolenga kuliweka kundi katika nafasi bora ya ukuaji katika siku zijazo, huku gharama zikidhibitiwa na kuzidisha uzuri wa karatasi yetu ya mizania. Ukuaji wenye faida Makusudio yetu ya kimkakati ni kufikia kiwango maalum kilicholengwa cha faida ya jumla ya pato na utendakazi huku tukiendelea kukuza mapato. Katika kipindi cha mwaka tulishuhudia mwenendo wa kurudi chini kinyume na malengo yetu pamoja na kudorora kwa mauzo na kupungua kiwango cha faida ya jumla ya pato na uendeshaji. Hili limechangiwa na kitengo cha soko la bidhaa za hali ya juu na bei za juu kuwa dogo, ambapo bidhaa zetu za Bridgestone na YANA ndipo zilipo. Kuchelewa kuingia kwetu katika kitengo cha bidhaa zenye punguzo pia hakukusaidia. Michafuko ya kijamii na kisiasa katika masoko yetu mengine na uhaba wa fedha za kigeni katika masoko mengine yaliathiri vibaya mkakati wetu wa kukuza soko la kuuza bidhaa nje. Kwa upande wa mafanikio tulikuza fedha zinazotokana na uendeshaji kwa kuboresha usimamizi wa mtaji wa kufanya kazi. 31
32 2.2 Ripoti ya Mkurugenzi Mkuu (Kuendelea) Katika robo ya mwisho ya mwaka, tulichukua hatua madhubuti za mpango wa kupunguza gharama za utengenezaji kiwandani pamoja na gharama za uendeshaji. Ingawa matokeo mengi ya hatua za kupunguza gharama yatapatikana katika mwaka 2015, tulipata kuokoa gharama kwa zaidi ya Kshs milioni 10 katika robo ya mwisho ya. Kuangazia wateja Bado tunazingatia kufikia viwango visio mithili vya kuridhisha wateja kupitia mawasiliano bora, kuongeza mawasiliano ya moja kwa moja na wateja kwa kutumia vituo vyetu vya Yana, kusambaza bidhaa za hali ya juu kwa wakati ufaao na kufufua upya harakati zetu za masoko. Hadi leo, tumefikia kipimo cha asilimia 76 cha kuridhisha watumiaji ikilinganishwa na kipimo kilicho lengwa cha asilimia 85 mwaka Katika kipindi cha mwaka tulianzisha katika kanda nzima vituo sita vipya vya magurudumu vya Yana kufikisha jumla ya idadi ya vituo kumi na sita. Na tulivifanyia ukarabati kikamilifu vituo viwili vya magurudumu ili kuvutia wateja na kuwa na mandhari ya kuvutia. Tulizindua kituo chetu kipya cha mawasiliano tukiwa na lengo muhimu la kutoa kiunganishi cha moja kwa moja na wateja wetu na watumiaji kupitia njia tofauti za mawasiliano.kufikia leo tumekusanya zaidi ya majina ya kuwasiliana na tumekamilisha majaribio ya mpango wa mawasiliano ili kuzindua bidhaa yetu ya SUMMIT. Mkakati wetu wa kutatua madai ya magurudumu ndani ya masaa 48 uliboreka kufika asilimia 90 ikilinganishwa na lengo la asilimia 95 na viwango vya madai vilishuka kwa asilimia 0.47 ya magurudumu yote yaliyouzwa ikiwa ni natija ya mipango yetu inayoendelea ya kuboresha usawa wa bidhaa. Tafiti rasmi na za kina za ufahamu wa wateja kuhusu bidhaa na mtazamo wa huduma kwa wateja zilifanyika katika mwaka, matokeo yake huendelea kusaidia katika kuandaa mikakati ya majukwaa na mifumo yetu ya masoko na utoaji huduma katika siku zijazo. Uvumbuzi Tumejitolea kutengeneza magurudumu ya utendaji wa hali ya juu na ya ubora wa juu zaidi, kudumu, kutegemewa na salama; sifa zinazozalisha thamani bora ya pesa unapolinganisha gharama kwa kila kilomita. Bado tunaendelea kuangazia mkakati wa kuendeleza teknolojia ya utengenezaji na kuboresha utumizi wa kiwanda. Katika kipindi cha mwaka tulizindua vipimo vipya tofauti vya magurudumu, 10 vya Yana na 8 vya SUMMIT ambavyo vilichangia asilimia 7 ya jumla ya mapato.toka tulipoanza mpango wa kimkakati mwaka 2012, tumezindua jumla ya vipimo 30 tofauti vipya vya magurudumu vikichangia asilimia 18 ya jumla ya mapato katika mwaka. Tuliendelea kuboresha vipimo vya usawa na uiano wa bidhaa zetu kupitia hatua za kimtaji na kubadilisha mchakato.harakati za kuboresha usawa wa magurudumu zilileta matokeo ya wastani ya asilimia 67 katika mwaka na katika mwezi wa Julai tulifikia upeo wa asilimia 87.Baada ya mwaka kumalizika tumesajili matokeo ya usawa wa bidhaa wa asilimia 96 na asilimia 89 katika mwezi wa Januari na Februari 2015, mtawalia. Tuliendelea kuzingatia kupunguza ufujaji na bidhaa chakavu katika kiwanda kwa kupunguza makosa ya waendeshaji mitambo wakati wa kuoka magurudumu na wakati wa uundaji, na kwa ukaguzi wa kila siku wa mitambo, usafishaji wa maji ya kuendesha mashine katika kijumba cha nishati pamoja na ukarabati wa baadhi ya mitambo. Nina furaha kuripoti kuwa hatua hizi zinazaa matunda na katika mwaka tulisajili kupungua kwa bidhaa chakavu na ufujaji kwa asilimia 19 ikilinganishwa na. Tulifikia asilimia 73 ya utumizi wa kiwanda ikiwa ni tani 13 ya raba kwa siku ikilinganishwa na lengo la kimkakati la asilimia 80 (tani 14.5 ya raba kwa siku). Uboreshaji wa utumizi wa kiwanda umesalia kuwa ni changamoto baada ya kushuka kwa sehemu ya soko la bidhaa zetu za Yana. Kuinua teknolojia yetu ya utengenezaji bado ni kiungo muhimu cha kuhakikisha utengenezaji wa ufanisi. Tunakadiria inahitajika mtaji wa Kshs bilioni 1.2 kubadilisha mitambo iliyochakaa kwa mitambo ya kisasa, na ya kiufundi wa hali ya juu.katika kipindi cha mwaka mazungumzo yaliendelea na mwekezaji mtarajiwa wa kiufundi na wa mtaji wa usawa ili kukifanya kiwanda kiwe cha kisasa na chenye miundo mbinu husika. Wafanyi kazi na uongozi Mkakakati wetu ungali ni wa kutengeneza shirika lenye wafanyikazi wachache, wachangamfu, wenye uwezo wa kufikia malengo.tunanuia kuvutia, kukuza na kuwashikilia wafanyi kazi wenye vipaji mwafaka huku tukizoezesha tabia za msingi wa utendaji. Katika kalenda yetu ya mafunzo, ya mwaka, inayotumika kutoka Aprili hadi Mechi 2015 tulilenga kozi 60 kwa wafanyikazi na kufikia mwisho wa mwaka,tulikuwa tumeendeleza mipango 42 ya mafunzo, ikiwa ni asilimia 70 ya lengo. Uchukuwaji wa likizo kwa ujumla ulikuwa asilimia 84% ikilinganishwa na lengo la asilimia 90. Tunaendelea kutekeleza sera yetu ya kupeleka mbele hadi mwaka mwingine siku zisizozidi saba pekee kwa kila mfanyikazi. Tulihitimisha kwa mafanikio mazungumzo ya CBA (makubaliano ya pamoja ya malipo) ya miaka 2015 na 2016 na chama kikuu cha wafanyi kazi wetu ambao ni wanachama wa chama cha wafanyikazi. Tunaendelea pia kujaribu kuboresha mawasiliano na wafanyikazi kupitia mikutano ya idara na kwa miamala mingine isio rasmi. Katika kipindi cha mwaka, Mkurugenzi Mkuu aliendelea na mikutano yake maarufu ya kiamsha kinywa na wafanyikazi katika idara zote ambapo habari kuhusu utendaji na mikakati husambazwa na maoni kuchukuliwa. 32
33 2.2 Ripoti ya Mkurugenzi Mkuu (Kuendelea) Katika kipindi cha mwaka tulifikia asilimia 98 ya kushikamana na mfumo wa kupima utendaji na sasa tumefungamanisha mfumo wetu wa malipo na utendaji. Utendaji endelevu Katika Sameer Africa,msimamo wetu wa kimsingi ni kuwa, tuendeshe biashara yetu kwa njia endelevu na ya kuwajibika. Daima tutahakikisha kuwa biashara yetu hivi leo haito athiri uwezo wa washika dau wa baadaye kukidhi mahitaji yao. Masuala ya kimazingira na kijamii yana uhusiano wenye nguvu na utendaji wa kiuchumi kupitia uwekezaji tunaofanya katika juhudi za usimamizi wa mazingira na zinahusisha kushirikiana na wafanyikazi, waletaji bidhaa, wateja na jamii. Utendaji wa kimazingira Shughuli zetu za usimamizi wa kimazingira huzingatia masuala muhimu katika vitengo vya uendeshaji, mchakato wa utengenezaji na utoaji wa bidhaa ambapo sisi hujaribu sana kupunguza athari hasi na kukuza zile chanya. Katika kipindi cha mwaka tulipima na kuchambua moshi ufukao kutoka kwa mtambo wa mvuke (Boiler). Miongozo ya benki ya dunia ya kutambua vipimo vya juu kutambua ilitumiwa katika kutathmini viwango vya uchafu wa kimazingira katika moshi unaofuka uliopimwa.matokeo yalikuwa katika mizani ya miongozo hiyo na yalionesha kuendelea kuboreka kwa usafi wa moshi unaofuka kutoka kwa tanuri, ikilinganishwa na vipimo vilivyo sajiliwa mwaka. Uchambuzi wa sampuli ya VOC (misombo yenye shinikizo za mvuke inapoingia hewani) ulihitimishwa katika mwaka kuambatana na ISO Misombo (VOC) hiyo ilifanyiwa uchambuzi kwa kupitishwa pasi na juhudi katika vifaa vya kuchambua vilivyotiwa vifyonzi vya kutega kemikali. Uchambuzi wa maabara ulifanywa na matokeo yalionesha chini ya viwango vinanyoweza kugunduliwa kwa mengi ya misombo hiyo. Utendaji kijamii Utendaji kijamii hupima muamala wa kampuni na wafanyikazi wake na jamii. Wafanyikazi Kiwango cha mabadiliko ya wafanyikazi kilikuwa wastani asilimia 11% ikiwa ni ndani ya kiwango cha asilimia 14% kinachokubalika katika sekta ya kibiashara. Tulishuhudia viwango vya juu katika idara ya fedha, mauzo na uendeshaji kazi Tanzania. Halmashauri ya usimamizi inaendelea kukabiliana na changamoto zinazochangia mabadiliko ya wafanyikazi katika idara hizo. Kampuni hufuata viwango vya kimataifa katika afya na usalama. Hakukuwa na vifo kutokana na uendeshaji kazi wetu wowote katika mwaka. Hata hivyo tulipoteza siku za kazi 853 kupitia likizo za ugonjwa na siku za kazi 552 kupitia likizo kutokana na majeraha yaliyotokana na ajali 16; 7 zikiwa kazini na 9 nje ya ofisi. Hatua zimechukuliwa kuinua ufahamu wa wafanyikazi kuhusu umuhimu wa kutumia mavazi ya kujikinga wakati wote na kufuata kanuni za usalama zilizowekwa. Kampuni ina mpango wa Uzima ambao unatumiwa kuinua ufahamu wa ustawi wa kibinafsi kwa wafanyikazi. Katika mwaka, tuliendesha kampeni za kufahamisha kuhusu usimamizi bora wa fedha za kibinafsi, Ebola, Maradhi ya koo, masikio na pua, maradhi ya figo na saratani. Kampuni inatambua na ina hisia kuhusu haki za kibinadamu na imeweka sera dhidi ya ubaguzi wa aina yoyote. Wafanyikazi wetu hufahamishwa kuhusu matarajio kuwa hawatajihusisha na aina yoyote ya shughuli za ulaghai au ufisadi katika harakati zao za kibiashara. Sera yetu ni kutosubiria kwa vyovyote vile maovu hayo. Uwajibikaji katika bidhaa Viwango vya ubora vya utendaji wa bidhaa zetu,afya na usalama vimekuwa kitofautishi muhimu cha bidhaa zetu katika soko.bidhaa zetu zote zina udhamini wa mtengenezaji:ikiwa ni ushuhuda wa imani tuliyo nayo na michakato yetu ya utengenezaji. Kuwajibika kijamii Mipango ya maendeleo ya kijamii inayoanzishwa na Sameer Africa huzingatia kuboresha maisha na ustawi wa jamii tunazoendeshea kazi miongoni mwao. Katika kipindi cha mwaka tulifadhili vyama kadhaa vya misaada kupitia kufadhili michezo ya golf na michango ya moja kwa moja kwa wahitaji. Kwa upande wa usalama tuliandaa mafunzo 110 ya kiufundi jinsi ya kutumia magurudumu na usalama wake kwa makundi yaliolengwa ikiwamo vyama vya ushirika vya matatu, waendeshaji biashara ya utalii na mafundi wa magari. Kwa kutambuliwa juhudi hizi, Sameer Africa ilituzwa tuzo la Usalama wa Umma. Mtazamo Tunatarajia mazingira yenye changamoto kuendelea katika mwaka 2015 kama ilivyo shuhudiwa mwaka. Kunawezekana sana kuendelea kufurika kwa bidhaa zinazoagizwa kutoka nje, bidhaa zilizopunguziwa gharama na magurudumu yasiolipiwa ushuru na hayo yatakuwa na athari mbaya kwa idadi ya mauzo yetu na mapato yetu. Kwa habari nzuri, mtazamo wa kiuchumi wa nchi nyingi za Afrika na hasa uchumi wa Afrika Mashariki, ni wenye kuonesha matumaini mazuri. Basi hivyo tunatarajia ukuaji endelevu wa mahitaji ya magurudumu katika mwaka ujao. Kuingia katika mwaka 2015, tayari tumeona kupungua kwa kiasi kikubwa gharama za umeme na tunatarajia bei za mafuta yasiyosafishwa kuendelea kuwa chini kwa muda mrefu katika mwaka huu.ishara za awali ni 33
34 2.2 Ripoti ya Mkurugenzi Mkuu (Kuendelea) kuwa bei za malighafi yanayotumika katika kutengeneza magurudumu zitaendelea kushuka kwa zaidi ya asilimia 10 katika mwaka 2015, hivyo kuwa na athari maridhawa katika gharama zetu za kiwanda. Katika mwaka 2015 tutaendelea kuangazia vipaumbele vya kimkakati na hususan kugeuza mwenendo wa kudorora mauzo ulioshuhudiwa in kwa: Kupenyeza kwa nguvu katika sehemu ya soko yenye punguzo za bei kwa kutumia bidhaa yetu ya ushindani SUMMIT; Kutafuta masoko mapya ya uuzaaji katika nchi za nje na kuimarisha masoko yaliyoko; Kupanua biashara yetu kwa wateja wa mashirika na serekali; na Kuzingatia fedha na kupunguza kwa jumla viwango vya mtaji wa kufanya kazi. Vilevile tutaongeza juhudi za kuinua juu mauzo ya Yana kwa idadi katika aina magurudumu ya malori madogo na ya wastani ili kugeuza udororaji wa mauzo kwa wafanyi biashara wasambazaji.shughuli za kujenga jina la bidhaa zetu zitahusisha matangazo ya kibiashara kutangaza bidhaa zetu za Yana na pia vituo vya magurudumu vya Yana katika vyombo vya habari.tunapanga kuendesha kikamilifu kituo chetu cha mawasiliano cha Yana na vilevile kutumia tovuti yetu kutilia nguvu shughuli zetu za matangazo ya masoko kwa kutumia mbinu maalum kuwafikia wateja maalum wanaolengwa. Tuko katika harakati za kuhitimisha mazungumzo ya makubaliano kuhusu makao zaidi ya vituo vya Yana. Tunapanga kuvikarabati na kuvipaka rangi za bidhaa vituo vyetu vya zamani ili kuboresha kuvutia wateja na kuleta mandhari ya kuvutia. Kwa upande wa uvumbuzi, tunapanga kuanzisha vipimo vingine vya ziada vya bidhaa za Yana Na Summit. Tuna matumaini makubwa tutahitimisha mazungumzo ya kumpata mshirika mpya wa kiufundi ambaye atachangia mtaji na mitambo ya kukifanya kiwanda chetu kuwa cha kisasa lakini bado tutaendelea kujaribu chaguo la utengenezaji kwa kandarasi na pia njia nyingine mbadala ndani ya kiwanda chetu na pia katika nchi za nje. Tunapanga kuimarisha mipango iliyoanzishwa katika robo ya mwisho ya mwaka ya kupunguza gharama, na tutazingatia kusawazisha gharama za kimsingi na pia vilevile kupunguza gharama za nishati na bidhaa chakavu katika kiwanda.lengo letu ni kuokoa gharama kwa kiasi cha Kshs milioni 120 kwa mwaka kutoka kwa gharama za uendeshaji na Kshs milioni 100 kutoka kwa gharama za ubadilishaji za kiwanda.vilevile pia tutachambua mpangilio wa gharama za uendeshaji katika kanda nchini Tanzania,Uganda na Burundi kwa lengo la kuendesha shughuli zenye kuleta faida. Tutaendelea kuinua mifumo yetu ya habari na kiufundi na mipango inaendelea kuboresha SAPuwiano na benki, mfumo wa kielektroniki wa usimamizi wa nyaraka na maandalizi ya kurejesha shughuli baada ya mikasa na kuboresha usalama wa mtandao. Kama hatua yetu ya kuhakikisha kufikia malengo yetu ya kimkakati kupitia wafanyi kazi, tutaendelea kuboresha utafutaji wetu wa vipaji katika ngazi zote na tutaendelea kupiga msasa jitihada zetu za kuleta desturi zinazofungamana na utendaji sambamba na malengo yetu ya kimkakati. Katika mwaka 2015, tuna mipango ya kutekeleza kikamilifu mpango wa kujiandaa kupokezana kazi katika ngazi zote katika shirika. Ikizingatiwa kuwa tumefikia asilimia 100 ya upangishaji katika Sameer Industrial Park na Sameer Export Processing Zone tutaendelea kuzingatia mkusanyiko wetu wa majengo ili kupata mapato ya juu zaidi. Vilevile tutaendelea na juhudi zetu za kupangisha Sameer Business Park lakini kulingana na mkakati wa kuleta wapangaji wa hadhi ya juu pekee kwa jumba hili la kiwango cha mataifa. Katika mwaka 2015, tutatafuta kwa juhudi kuu nafasi nyingine za kufumbua thamani kutoka katika mkusanyiko usio haba wa majengo yetu. Uboreshaji wa muundo mbinu wa barabara unaondelea na uliopangwa utamaanisha kuwa eneo la viwanda Nairobi litakuwa ni kituo kilichoboreka kwa ofisi za kibiashara na ukuaji wa biashara za rejareja. Kundi halingefika mpaka kipande hiki katika safari yake bila ya watu wetu na mfumo wa maadili ambao ndio unajenga msingi wa shughuli zetu zote.tulikabiliwa na changamoto kubwa katika mwaka, lakini kufuatia changamoto hizo tunaamini kuwa tumeandaa mikakati itakayoendelea kuona kundi linafanikiwa kuendelea katika siku zijazo. Tuna kundi la kuvutia katika shirika hili na mchanganyiko wa watu wenye vipaji ambao wamejitolelea kuzalisha na kutoa thamani yakuendelea kwa wateja wetu, wanahisa wetu na jamii kwa jumla. Allan Walmsley Mkurugenzi Mkuu 34
35 2.3 Organisational review and business model In this section... Sameer Africa Limited understands and respects its role and responsibility towards ensuring benefits to its stakeholders and society at large. This section gives an overview of Sameer Africa s business philosophy and the sustainability approach and performance in its operations. The elements of this section provide the foundation on which the more specific disclosures elsewhere in the report are based Company profile Sameer Africa Limited, under the name Firestone East Africa (1969) Limited, was established in Kenya in 1969 by Firestone Tyre and Rubber Company of the USA and the Government Kenya to produce tyres for the East African market. Sameer Investments Limited, a Kenyan company, later purchased a significant part of the shareholding from Firestone Tyre and Rubber Company. In 1988, when Bridgestone Corporation purchased Firestone Tyre & Rubber Company, Sameer Investments Limited retained its shareholding in Firestone East Africa (1969) Limited and the company was listed on the Nairobi Stock Exchange in The company s corporate identity changed to Sameer Africa Limited in April This change created an independent tyre producer based in Kenya that aims to supply the East African and COMESA markets. With a technical capability developed over 45 years of producing tyres in Kenya, the company is now able to produce a comprehensive range of tyres to meet customers needs across Africa. Sameer Africa s product range currently includes: passenger textile and steel belted radials, 4x4 tyres, light truck radial and bias, truck and bus, agricultural, industrial and OffTheRoad tyres under the brand name, Yana. Sameer Africa produces both tube type and tubeless tyres and also produces tubes and flaps. The Yana brand, officially launched in November 2005 in Nairobi, is Sameer Africa s own brand that aims to be a panafrican tyre brand. This brand is backed by leading tyre technology and local development and production is engineered to meet the challenging driving conditions in Africa. Yana is a high performance tyre that rides on a strong heritage associated with high quality, durability, reliability and safety derived from its unique technical specifications. These attributes give better value for money in terms of cost per kilometer (CPK). The brand is also packaged with full warranty cover for the life of original tread of the tyre without limit as to distance covered and against any manufacturing defects in material and workmanship under normal use and service. The Yana brand is positioned in the high value price segment of the market at a comparatively affordable price. Summit Tyre is Sameer Africa s second tyre brand developed to serve the fastgrowing discount market segment currently dominated by brands from the Asian continent. The brand is an appropriate and affordable tyre that delivers value for money without compromising on performance. Manufactured in China under license to Sameer Africa, all the technical specifications for Summit tyre are developed by the same engineers empowered and entrusted with manufacturing Africa s number one leading tyre brand, Yana; hence the confidence in the quality and performance of Summit. The tyres are all manufactured under strict supervision of our own technical experts from Kenya to ensure that quality standards are observed. Summit tyre therefore, encompasses high level technical specifications and uncompromised safety with guaranteed quality and to underpin this, the brand is sold on warranty. The brand is also available in the key categories and sizes ranging from passenger, light truck, medium truck and truck & bus offered in different patterns for different vehicle applications, ensuring that the mass market needs are fully met.the unique selling propositions for the brand cut across good performance, affordability and warranty and thus the tagline Taya poa, thamani poa. Bridgestone is a world wellknown brand under the premium tyre market segment manufactured in Japan. This premium brand has withstood performance tests across all six continents, with diversified products manufactured for varied applications to support industry and consumers across the globe. With a global production network set to respond rapidly to customer needs, Bridgestone tyres are distributed by leading tyre companies, and Sameer Africa Limited triumphs to be one of the distributors of the brand in the East African market. 35
36 2.3 Organisational review and business model (Continued) The brand is committed to environmental protection and road safety and has developed education programs and corporate citizenship activities worldwide. The brand is also a proud leader in global motorsports, an aspect which stamps its superior quality and endorses trust and pride in the brand Our business philosophy Our Mission Provide safe mobility with unparalleled experience The Sameer Africa, business philosophy is core to the success of our business. It drives our business model and strategy. The company has undergone a number of fundamental changes over the last few years including: Growth of its retail network; Expansion into regional markets; Contract manufacturing; Enhancement of its governance structure; Nonetheless, our Vision and Values have remained constant even as our strategic objectives, commitments to stakeholders, operating model and structure and strategy have evolved. As a result, our business philosophy is not only intact, but has become better integrated, coherent and reflective of our stakeholder interests. Sameer Africa business philosophy is made up of three parts: Our Purpose, Our Vision and Our Values. Our purpose defines our customer and key customer offerings. Our vision describes our ideal stakeholder expectations and provides a measure for ourselves in determining the success of our business philosophy. Our values shape the business culture and employee behaviours required in order to achieve our purpose. These components work together collectively to define the product and service offerings to our customers, how we interact with stakeholders and how delivery to those stakeholders is measured. Our Vision To be the ultimate provider of innovative reliable tyre solutions Our Values Integrity Respect Innovation Accountability Our Slogans Sameer Africa will take you there At corporate level to link with the products range for mobility. Africa rides on Yana Tyres At brand level to link with the brand promise of reliability, comfort, safety and ultimate trust. 36
37 2.3 Organisational review and business model (Continued) Creating value for our stakeholders Material issues and risks Sameer Africa s material issues are identified as those having the potential to significantly impact our business and our stakeholders. This assists us in identifying, managing and mitigating risks. The business risks and concerns outlined below are in line with the risk management process outlined in the Operating Context and Business Risks section of this report. Inculcating our operations with a firm commitment to economic, manufacturing, customer, environmental and social development, acknowledging our responsibilities towards stakeholders and strengthening good governance, helps us to shape our material issues, moving beyond simply addressing business risks. Business risks and concerns Material Issues Responsible business practice Financial Continued economic growth Raw material prices volatility Interest and exchange rate volatility Capital adequacy Cost escalation Economic performance Capital management Manufacturing Product innovation Factory shutdowns Raw material availability Inferior products Customer Product positioning in the market Market share Corporate and brand risk New product development Upgrade manufacturing technologies Quality control Raw material sourcing and management Product quality Customer value proposition Competition monitoring Customer satisfaction Market research and intelligence Economic, environment and social development Responsibilities to stakeholders Good governance Social Suboptimal staff performance Staff turnover Succession planning Labour relations Health and wellness Employee deployment and management Societal development Ethics, transparency and accountability Environmental Safe working environment Responsible waste management Controlling emissions Lowering energy consumption Environmentality enhanced products Energy sourcing and management Controlling GHG emissions Ethical and fair working practices Compliance with legal regulations Waste generation and management 37
38 2.3 Organisational review and business model (Continued) Stakeholders Every material issue has the potential to influence the decision, action and performance of one or more of our stakeholder groups. Our key stakeholders are identified based on a three point criteria and defines how we interact with them; Stakeholders who are directly or indirectly impacted by our operations and activities; Stakeholders towards whom Sameer Africa has a legal, commercial, operational, societal or ethical responsibility; Stakeholders who can impact on our strategy and operational decision making. The following have been identified as Sameer Africa s key stakeholder groups: Shareholders / investors Local community Employees Suppliers Customers Regulatory bodies Material issues across the value chain Identification of material issues across the value chain provides Sameer Africa with a view of its overall impact. It gives us an opportunity to strengthen our sustainability performance with relevant stakeholders across the value chain. The figure below outlines a basic schematic diagram of the value chain of Sameer Africa along with the value chain location where the organisation s material issues are impacted. Original Equipment Manufacturers (OEM) 38

39 2.3 Organisational review and business model (Continued) Our regional footprint Sameer Africa depots and regional offices 39
40 2.4 Operating context and risk management In this section... This section of the report describes the external factors affecting the business (both positively and negatively) and how the business identifies and responds to these factors. It looks at not only the downside risks affecting the business, but also addresses the business opportunities that form an integral part of the long term value of the business External factors and trends Economic outlook The global economy grew at a moderate rate of 3.3% in, reflecting both the legacy of a weak performance in the United States and Europe and a less optimistic outlook for several emerging markets. In January, the IMF estimated a GDP growth rate of 3.7%. That dropped to 3.6% in April, to 3.4% in July, and to 3.3% in October. The steady deterioration in the global economy s performance was both remarkable and worrying. Both Europe and Japan grew at slower rates than was previously forecast and overall GDP growth in emerging markets was just 4.4% in, only 2.6 percentage points better than advanced economies. The East African economies are projected to grow at an average of 6.5% per annum through The Tanzanian economy was projected to grow by approximately 7% in and 7.2% in 2015, driven by transport, communications, manufacturing and agriculture and supported by public investment in infrastructure. The government is expected to maintain fiscal consolidation aimed at expenditure and debt management, as well as a tight monetary policy to anchor inflation. In, Uganda saw the consolidation of macroeconomic stability and a gradual recovery of economic activity, with real GDP growth projected to reach 6.4% in. A fiscal and monetary policy stance focused on containing inflationary pressures provided an enabling environment for economic growth by ensuring debt and exchange rate stability. Rwanda s real GDP growth slowed to 5.0% in, from 7.3% in 2012 due to the lower than programmed performance in agriculture and aidrelated delays in the implementation of strategic public investments following the suspension of budget support disbursements in Growth is projected to recover to 7.5% in and 2015, due to the recovery in services, improvement in agricultural productivity and sustained implementation of the public investment programme. Burundi s growth accelerated to an estimated 4.5% in, up from 4.2% in 2012, due to increased activity in the secondary and tertiary sectors. Government finances improved, but the country is still faced with major constraints due to the poor mobilization of domestic resources and the volatility of external aid. Meanwhile, political tensions have grown in the runup to the 2015 elections. In Kenya, as underscored by the killing of 148 university students in Garissa in April 2015, security risks associated with terrorism will persist in the wake of the Westgate attack and will threaten to damage the crucial tourism sector. Despite this, growth should remain robust in , at an annual average of 5.9%, largely assisted by ongoing infrastructure development. However, faster growth may serve to exacerbate domestic structural deficiencies in the economy. Industry analysis The manufacturing sector in Kenya constitutes 70 per cent of the industrial sector s contribution to GDP, with building, construction, mining and quarrying cumulatively contributing the remaining 30 per cent. Kenya s Vision 2030 identifies the manufacturing sector as one of the key drivers for realizing a sustained annual GDP growth of 10 per cent. The manufacturing sector has high, yet untapped potential to contribute to employment and GDP growth. The contribution of the manufacturing sector to GDP has continued to stagnate at below 10 per cent, with contribution to wage employment on a declining trend. The first Medium Term Plan (MTP) targets for realizing Vision 2030 remain largely unachieved in terms of contribution of the sector to GDP and implementation of flagship projects. Vision 2030 envisages a robust, diversified and competitive manufacturing sector capable of accelerating employment and economic growth. The performance of the manufacturing sector is reflected in the contribution to GDP, employment, value added and exports trends in the light of Vision 2030 targets and selected aspirator and peer economies. The manufacturing sector s contribution to GDP declined from 9.5 per cent in 2012 to 8.9 per cent in. This adverse change is attributed to high costs of production, stiff competition from imported goods, high cost of credit and drought incidences. The influx of counterfeits and volatility in international oil prices also continued to affect the performance of the sector. Kenya s manufacturing sector is largely agroprocessing and its performance is dependent on weather patterns. To spur growth in the sector, the government plans to; 40
41 2.4 Operating context and risk management (Continued) Increase installed electricity capacity to 5000MW by This will not only improve reliability of supply but also reduce the cost of energy. Improve the logistics framework including the Port of Mombasa, the standard gauge railway and the transport corridor Tyre manufacturing inputs Raw materials Raw materials for tyre manufacture have witnessed a declining trend over the last 3 years fuelled primarily by the unprecedented decline in the price of natural rubber; the main ingredient in tyre manufacture. Raw Material Prices 2012 to US$ PMT C&F Mombasa Material 2012 Change: /2012 Natural Rubber (NR) Synthetic Rubber Fabrics Carbon Black Steel Cord Rubber Chemicals Bead Wire Average % 35% 5% 17% 5% 14% 20% 20% (a) Natural rubber outlook After the historic boom at the beginning of this decade, the natural rubber market has declined mainly on account of the fall in demand across the globe and new plantations which came on stream in 2009/10. Projections of the supplydemand scenario do not point to an immediate boom in the market. Much depends on the highly unpredictable cycles of the global economy in the years to come. Natural rubber output increased 4.5 percent in from an estimated 11.7 million tons in, as plantings between 2006 and 2008 come into tapping. Natural rubber consumption is forecast to rise 4.5 percent per year through 2015, to 12.4 million tons. Rubber demand will be stimulated by a pickup in tyre output growth as global motor vehicle production accelerates in many developed nations. Because tyres represent the largest market for rubber, growth in the output of motor vehicles, as well as the rising numbers of motor cycles in use, greatly impacts the amount of rubber consumed globally. The Asia/Pacific region will exhibit the fastest gains in rubber production of any region except the small Africa/ Mideast market. Gains in China will be especially strong, with the country accounting for over onefourth of global rubber output gains through 2015, in volume terms. The Asia/Pacific region is also an important producer of non tire rubber products and it is expected to account for 80 percent of the world market growth in volume terms through (b) Synthetic rubber World synthetic rubber demand is expected to increase to 16.1 million tonnes in and rise to 16.8 million tonnes in Energy The use of energy is critical in the tyre manufacturing process. During the mixing cycle, heat and friction are applied to the mixer to soften the rubber and evenly distribute the chemicals. During the tyre building and curing processes, steam is pumped into the chamber, expanding it to shape the tyre against the sides of the mould. Sameer Africa uses electricity from the national grid and to generate heat for vulcanisation during curing, the company uses fuel oil in its steam generating boilers. After raw materials, energy constitutes the second largest cost in the tyre manufacturing process. Consequently, the price dynamics of electricity and fuel oil significantly affect our conversion costs and consequently the pricing and margins of the final product. 41
42 2.4 Operating context and risk management (Continued) (a) Electricity tariffs The current effective power generation capacity in Kenya is 1,664 MW (hydro 770, geothermal 241, thermal 622, cogeneration 26, and wind 5). The monitored demand, which is considered suppressed largely due to transmission and distribution system weaknesses, stands at about 1,357 MW while the unsuppressed demand is estimated as 1,700 MW, thus depicting a shortfall of 536 MW (after providing for a 30% reserve margin recommended by the National Economic and Social Council (NESC)). This demandsupply imbalance has hitherto contributed to regular power rationing, particularly during dry seasons. This undesirable situation has persisted since The challenges facing the electricity supply sector are mainly inadequate generation capacity arising from insufficient investment in power generation. The sector has had to resort to expensive, quick fixes such as Medium Speed Diesel (MSDs) running on Heavy Fuel Oil (HFO) and High Speed Diesel plants running on Automotive Gas Oil (AGO). Electricity is therefore expensive as these plants contribute over 40% of the effective capacity with the cost of electricity generated ranging from US cents 26 to 36 cents per unit. The high cost of electricity has had adverse effects on manufacturing entities in the country with a resultant high cost of manufactured output as compared to outputs from countries with relatively cheaper electricity costs. In order to provide affordable electricity for commercial, industrial and domestic use, the government has developed a roadmap to expand generation capacity to over 5,000 MW from the current 1,664 MW by Through this roadmap, the generation cost is expected to reduce from US cents 11.3 to 7.1 cents and the electricity tariff for commercial/ industrial use from US cents to 9.0 cents with domestic rates coming down from US cents to cents. (b) Crude oil prices The price of fuel oil used in steam generation in the tyre manufacturing process is dependent on crude oil price movements. North Sea Brent crude oil spot prices averaged $48/bbl in January 2015, the lowest monthly average Brent price since March 2009, down $15/bbl from the December average. The combination of robust world crude oil supply growth and weak global demand has contributed to rising global inventories and falling crude oil prices. Global oil inventories are expected to continue to build in 2015, limiting upward pressure on oil prices because of declining drilling activity. The forecast Brent crude oil price average for 2015, is $58/bbl. The recent decline in oil prices and associated increase in oil price volatility continues to contribute to a particularly uncertain forecasting environment and several factors could cause oil prices to deviate significantly from current projections. Among these factors is the responsiveness of supply to lower prices. Despite OPEC s November, decision to leave its crude oil production target at 30 million bbl/d, key producers could decide to reduce output, tightening market balances. The level of unplanned production outages could also vary from forecast levels for a wide range of producers, including OPEC members, Libya, Iraq, Iran, Nigeria and Venezuela. The degree to which nonopec supply growth is affected by lower oil prices will also affect market balances and prices. 42
43 2.4 Operating context and risk management (Continued) (c) Recent developments in Kenya energy sector (i) Discovery of oil in Turkana County In 2012, the Government announced the discovery of oil in Turkana County. This followed extensive exploratory efforts in areas such as Lamu and Isiolo. Efforts to establish the commercial viability of the oil find are underway, with an expected timeline exceeding three years before the country can become an oil producer. The discovery has been described as a major breakthrough that will contribute significantly to meeting the country s energy requirements. (ii) Confirmation of coal deposits The confirmation of commercially viable deposits of coal in the Mui Basin, in Mwingi East, Mwingi Central and Mutitu Districts means that Kenya is set to join the coal mining nations of the world. This discovery is expected to go a long way in filling the energy deficit in the country. (iii) Geothermal power development Kenya is endowed with vast geothermal potential and is recognized as one of the leading generators of geothermal power in Africa. It is estimated that the country has 7,000 MW 10,000 MW of geothermal potential and it is currently Africa s largest geothermal producer with 210 MW of capacity. The discovery of commercially exploitable geothermal steam in Menengai contributes to the country s energy portfolio that will drive Kenya toward the achievement of Vision The Kenyan Government has recently initiated the Scalingup Renewable Energy Program (SREP) investment plan in line with the national renewable energy development strategy Fiscal Measures Inflation and interest rate trends After an aggressive and successful tightening of monetary policy, the Central Bank of Kenya (CBK) has reversed gear now that inflation is under control and cut its policy rates to forestall a prolonged economic slowdown. The CBK s action to tighten monetary policy in order to fight inflation and stabilize the exchange rate, triggered a climb in interest rates, which in turn cooled the economy. As inflation has come down below the targeted 5 percent and with inflation expectations anchored at a lower level, the CBK reduced the central bank rate (CBR) by 950 basis points, signalling the market to lower lending rates and ease credit conditions. In response, interbank rate declined by 1049 basis points, average lending rate shed 394 basis points, average deposit rates declined by 132 basis points while the spread between average lending rate and average deposit rate was down 261 basis points and 91day Treasury Bills declined by 28 basis points between June 2012 and June. It is projected that inflation will average 8% over the next 5 year period with bank lending rates progressively declining from 16.58% in to 14.85% by Inflation Bank Lending rates ( KES) Source: Trading economies Exchange rates 7.34% 16.58% % 15.84% % 14.85% The Kenya Shilling daily exchange rate trading against the US dollar has remained stable albeit weakening since the third quarter of. The slight appreciation in June could be explained by the inflow from the Eurobond proceeds of USD 2 billion that came at the end of the month. Among the factors behind the local currency depreciation are external shocks to trade that affected key exports like tea, decline in tourism revenues as a result of insecurity jitters, arising import bill and short term capital outflows reflected in foreign investors net divestiture from the Nairobi Securities Exchange (NSE) between December and June. The market volatility measured by the level of the standard deviation shows that the shilling was volatile in the first half of 2012, in the second quarter of and the last quarter of. As a result government borrowed USD 600 million through syndicated loans from international banks partly to enhance foreign exchange reserves at CBK. Market volatility in could be explained by the announcement by the U.S Federal Reserve to commence exit from quantitative easing and the reaction by emerging markets and frontier markets to this policy normalization. The Kenya Shilling (Ksh.) is expected to maintain the current trend in the medium term as interest rates are expected to decline in line with the current Government policy of a low interest rates regime to support credit uptake by the private sector. Continued strong recovery in the U.S and U.K will affect portfolio equity outflows thus impacting the exchange rate. Against other currencies, the Ksh. strengthened against Rwanda and Burundi currencies between December and June. The Ksh. however weakened against the U.S Dollar, the U.K Pound Sterling, the Euro, Japanese Yen, Tanzania Shilling and Uganda Shilling during the first half of. 43


44 2.4 Operating context and risk management (Continued) Market dynamics World tyre demand World demand for tyres is forecast to rise 4.7 percent per year through 2015, to 3.3 billion units. In value terms, the tyre market is projected to advance 6.5 percent annually over the same time frame to $220 billion. The large motor vehicle tyre market will see acceleration in growth through Stronger gains will be registered for industrial and other tyre segments, which includes a variety of tyre types, including bicycle, motorcycle and offroad tyres. The Asia/Pacific region is by far the largest market for tyres, accounting for over half of global tyre demand in 2010, due in large part to its huge appetite for bicycle and motorcycle tyres. In addition, the region will register the strongest growth in tyre demand through The massive Chinese tyre market, which alone accounted for more than onequarter of global tyre demand in 2010, will record the strongest gains of any country through The tyre markets in North America and Western Europe will continue to see advances below the global average, although both regions will rebound from the declines recorded during the 2005 to 2010 period. As income levels increase worldwide, the share of the global population able to own a vehicle will rise. This growth will bolster demand for both OEM and replacement motor vehicle tyres, especially for light vehicles. Although the industrial and other tyre segments include a wide range of tyres, the vast majority of demand is comprised of bicycle and motorcycle tyres used in developing nations worldwide. The African tyre market The African continent is one of the fastest growing markets for the global tyre industry. The rising demand for tyres in Africa has led to stiff competition between tyre manufacturers from across the world seeking to garner a major share of the market for tyres. Traditionally, European tyre manufacturers have had a monopoly over the African markets and many European brands were top selling tyres in many African countries. However, Chinese tyres have now gained popularity in the majority of African markets. Many developing countries, especially in Africa, are pricesensitive markets and prefer to import lowpriced tyres rather than the expensive European and American brands. As a result, China has emerged as a leading exporter of tyres to many African countries in recent times. Players in the tyre business worldwide are not renowned for fair trade practices. Kenya and indeed the whole Eastern Africa region, is no exception. In Kenya, a significant bulk of uncustomed products enters the local market. International tyre manufacturers also maintain that retail and wholesale prices of some foreign products in the market are well below the expected minimum if costs of production, transport, insurance and duty are considered an indication that there is illegal dumping or subsidisation at source. Besides new tyres, there are also lowquality, secondhand tyres entering most African markets which soon wear out on the region s rough roads. Most used tyres are dumped into the African market after exceeding the legal use limit in European and other developed countries. Despite the best efforts of the continent s tyre manufacturer s, Sameer Africa included, the onslaught by the Chinese manufacturers continues. As a consequence, margins on locally manufactured tyres have dramatically reduced. East Africa tyre market parameters Market potential The East Africa tyre market (including Rwanda & Burundi) is estimated at 4 million tyres per annum. Sameer Africa s share of this market is estimated at between 8% 10 %. Almost 50% of the market is serviced by Chinese and Indian brands. Motor vehicle registrations in Kenya have been growing at a rate of 10% on average per annum over the last five years (between 2009 and ). Total number of vehicles registered in, including motor cycles, was 222,178 representing an increase of 28% over 2012 registrations. 44

45 2.4 Operating context and risk management (Continued) Vehicle Registration Body Type Saloons & station wagons Vans & pickups Minibuses & buses Lorries, trucks & heavy vans Trailers Road construction & tractors Total motor vehicles Motor cycles & 3 wheelers Total Registrations 44,529 7,120 5,540 6,037 2,883 3,690 69,799 92, ,813 53,718 6,975 4,864 6,085 2,379 5,169 79, , ,456 42,225 7,442 2,113 5,247 2,556 3,903 63, , ,841 52,847 7, ,821 3,761 3,139 77,229 95, ,044 65,005 9,819 2,297 9,570 3,973 3,353 94, , ,178 21% 5% 15% 28% Source: Kenya Revenue Authority The total number of licensed vehicles operating within the country has continued to grow by an average of 10% per annum from It is estimated that Kenya has approximately 1.8 million registered vehicles. Similar growth rates have been witnessed in other East African economies. Some of the envisaged changes that are likely to take place within the transport sector that will have a major impact in the motor industry in the next few years include: Increased spend on infrastructure development Envisaged light rail development within Nairobi metropolis and surrounding areas Upgrading of the Nairobi to Malaba & Kampala railway line to standard gauge Proposed Lamu Isiolo Juba / Moyale transportation corridor that will link Southern Sudan and Ethiopia to the Indian ocean Policy changes concerning the licensing of public vehicles with a carrying capacity of 14 passengers or less and the requirement that public transport providers create organized societies to manage their businesses will have an impact on the tyre consumer market and should be an area of great interest for the tyre industry to leverage and innovate upon. Competitive environment The East Africa tyre market is segmented on price which characterises changing consumer spending behaviour. The market is divided into the following price segments; Premium segment; High price segment; Medium price segment Discount segment Following an influx of cheap imported tyres, the market has witnessed an unprecedented growth in the discount sector. The discount sector grew from a low of 5% in 2005 to an estimated 54% in. 45
46 2.4 Operating context and risk management (Continued) Sameer Africa s leading manufactured brand YANA is categorized under the high price sector which has declined from a high of 62% in 2005 to only 25% in. The impact of the decline in this segment has adversely affected the company s market share over the years. The market parameters affecting locally manufactured tyres include; a) Chinese government subsidies Chinese government subsidies on tyre exports are as high as 81% of manufactured sales revenue, depending upon manufacturer. Indeed, the United States Department of Commerce recently introduced countervailing duties on Chinese tyre imports into the USA of between 19% and 81%, so as to protect its own tyre industry. b) Underinvoicing by tyre importers Underinvoicing by tyre importers across the region has reached endemic proportions making the playing field very uneven for local tyre manufacturers. In addition, due to Kenya s porous borders, a number of tyres are imported into the country uncustomed. The margin expectations of most of these importers are also low, given their low operating costs. As a consequence, Sameer Africa sales to the dealer trade channel has declined by 20% compared to, as more dealers embark on importing their own requirements. c) Lack of government support The manufacturing sector in Kenya has received little support from the government in terms of polices aimed at protecting local manufacturing, despite the best of lobbying efforts. The recent factory closures by Eveready and Cadbury which followed those of Reckitt Benckiser, Colgate Palmoline and Johnson & Johnson is a clear testimony of the challenges local manufacturers are faced by uncustomed imports Operating context Challenges and opportunities The changing environment in which Sameer Africa operates presents opportunities and challenges which the board and management continually evaluate. The current operating environment presents the following opportunities and challenges; Opportunities (i) Economic outlook The positive economic outlook within the regional economies is likely to see growth in infrastructure projects and with it a growth in disposable incomes of the various communities. It is also expected that these developments will see a growth in the automotive industry both for personal vehicles as well as commercial and off the road vehicles. Inflation is expected to remain at single digits through to 2018, while interest rates are expected to fall. (ii) Electricity infrastructure projects The planned 5000MW + power project, the discovery of oil and coal and the growth in geothermal generation is likely to see a significant reduction in the electricity tariffs in the coming years in Kenya. It is expected that these developments will significantly reduce factory conversion costs and with it, the eventual factory gate cost of tyres produced locally. (iii) Tyre manufacturing inputs The depressed raw material costs and in particular the price of natural rubber, is expected to persist well into The cost of tyre manufacturing is therefore expected to remain favourable in the short term. Crude oil prices are expected to remain subdued through 2015, signifying reduced cost of fuel oil used in steam production for tyre manufacturing. (iv) Improved logistics A number of projects including the standard gauge railway, Lamu Port Project and LAPSSET project and other infrastructure developments in the northern corridor are expected to significantly reduce logistics and transportation costs. This will not only reduce the cost of inbound materials but also the distribution costs of manufactured goods. Challenges (i) Dumping of subsidized imports The continued importation of subsidized, uncustomed and dumped tyres in the regional markets is expected to continue impacting negatively on our margins. Although manufacturing entities within the country will continue to lobby for the introduction of antidumping duties, there is no definitive path to success here. (ii) Economic indicators Weaker projected global growth for , underscores the fact that raising actual and potential output may become policy priority in most economies. Emerging market economies are then particularly exposed, as they could face a reversal in capital flows. These risks could adversely impact the projected growth rates of the regional economies. (iii) Crude oil prices The volatility of crude oil prices in the coming years remains a concern. Oil prices may also have overshot on the downside and could rebound earlier or more than 46
47 2.4 Operating context and risk management (Continued) expected if the supply response to lower prices is stronger than forecast. Important other downside risks remain. The board and management have evaluated the impact of these challenges and opportunities on the Group s s operations and have developed strategies to take advantage of the opportunities and address the challenges and risks. Details of the strategic interventions are contained in the Strategy review section Risk management Policy statement The board of directors of Sameer Africa have committed the company to a process of risk management that is aligned to the principles of best practice and corporate governance. Our business strategy depends on us taking calculated risks in a way that does not jeopardize the direct interests of the different stakeholders. Sound assessment of risk enables us to anticipate and respond to changes in our business environment, as well as make informed decisions under conditions of uncertainty. The risk management processes have been embedded in our business systems, so that our response to risk remains current and dynamic. All key risks associated with major change and significant actions by the company also fall within the process of risk management. Sameer Africa s Risk Management Policy ( RMP ) supports the following corporate objectives: To help ensure that the risk management policy is understood and consistently applied across the company; To enhance compliance with relevant regulatory requirements; To create and protect value at Sameer Africa by contributing to the achievement of company objectives; To identify, measure and control risks that might impact on the achievement of Sameer Africa objectives; To provide a framework for the formulation of risk management strategies; To identify and harness opportunities; and To protect and enhance the reputation of the company. Risk management strategy Risk management is an integral part of the strategic management of any company. As part of the risk management process, Sameer Africa has developed a Risk Management Strategy (RMS) which methodically identifies and addresses the risks attached to all company activities in order to achieve sustained benefit(s) from each/all activities. The RMS details the impact of the identified risks on the achievement of strategic and operational objectives, the treatment of the identified risks including residual risks, taking into account the risk tolerance levels. The RMS forms the basis on which to provide assurance that the processes are effective through formal audit, review, reassessment and monitoring. The process is illustrated in the figure below. Risk Identification and Assessment Risk Response Residual Risk Formal Audit & Reviews Monitoring and Reporting Risk Registration While risk identification and assessment is primarily aimed at those events that may occur within the planning period, management does not ignore long term risks. 47
48 2.4 Operating context and risk management (Continued) Key risks We believe that because of the international scope of our operations, there are numerous factors that may have an adverse effect on our results and operations. The following describes the material risks that could affect Sameer Africa operations and the risk management approach to addressing those risks. Risk area External risks Key risks 1. Fluctuations in natural rubber and other raw materials prices and impact of ongoing global economic volatility may negatively affect our results, including cash flows and asset values. 2. Continued subsidization of the Chinese tyre industry exports is likely to have adverse effects on the company s margins and sales. 3. Actions by governments or political events in the countries in which we operate could have a negative impact on our business. Risk management approach The audit, risk and corporate governance committee and management review the changing operating environment at least annually and develop strategies to address any adverse trends. Contract manufacturing with Chinese firms to take advantages of export subsidies. Continually lobby for legislation of antidumping taxes. We engage with governments and other key stakeholders to ensure the potential adverse impacts of proposed fiscal, tax, infrastructure access and regulatory changes are understood and where possible mitigated. Business risks 1. Product positioning in a particular price category may affect sales and margins if market dynamics adversely change. 2. Our corporate and product brand may be affected by inadequate market research and limited marketing budgets. 3. The company products market share are subject to competition, narrow product portfolio, product quality and levels of customer service. 4. Our ability to innovate and grow our product offering may be affected by inadequate market intelligence, lengthy development cycles, and inadequate development capacity. Creation of a portfolio mix that addresses consumer needs in various price segments. Improve market research and intelligence gathering capacity and expand markets and channels. Contract manufacturing where necessary to reduce development life cycles. Investment in staff training and development to enhance development capacity Financial risks 1. Our financial results may be negatively affected by commodity prices and currency exchange rate fluctuations and interest rate risks. 2. The commercial counterparties we transact with may not meet their obligations, which may negatively impact our results. 3. If our liquidity and cash flow deteriorate significantly it could adversely affect our ability to fund our activities. We seek to maintain a portfolio risk management strategy. As part of this strategy, commodity prices and currency exchange rates are not hedged, and wherever possible we take the prevailing market price. We use Cash Flow and Risk analysis to monitor any volatilities. Credit limits and review processes are established for all customers and financial counterparties. The audit, risk and corporate governance committee oversees these processes. Note 5 Financial Instruments: Risk Management and fair values under the Financial Statements section also outlines our financial risk management strategy. 48
49 2.4 Operating context and risk management (Continued) Risk area Key Risks Risk management approach Operational risks 1. Cost pressures and reduced productivity could negatively impact our operating margins and expansion plans 2. Breaches in our information technology security processes may adversely impact our business activities 3. Unexpected natural and operational catastrophes may adversely impact our operations. 4. Factory shutdowns arising from machinery breakdown of an ageing plant, unavailability of critical spares and raw material supplies can adversely affect production. The Group s concerted effort to reduce operating costs and drive productivity improvements is expected to realise tangible results. The capability to sustain productivity improvements is being further enhanced through continued refinements to our Operating Model. Global sourcing arrangements have been established to ensure continuity of supply and competitive costs for key supply inputs. Through the application of our risk management processes, we identify catastrophic operational risks and implement the critical controls and performance requirements to maintain control effectiveness. Business continuity plans are to be established to mitigate consequences. Consistent with our portfolio risk management approach, we continue to be largely insured for losses arising from property damage, business interruption and fire perils IT security controls to protect IT infrastructure, applications and communication networks and respond to security incidents are in place and subject to regular monitoring and assessment. Sustainability risks 1. Suboptimal staff performance arising from poor hiring and training practices and performance management could adversely affect results. 2. Staff turnover due to poor working conditions and an uncompetitive remuneration structure could affect productivity. 3. The risk of fraud as a result of poor staff integrity and weak internal controls can seriously compromise company values. 4. A breach of our governance processes may lead to regulatory penalties and loss of reputation. 5. Safety, health, environmental and community impacts, incidents or accidents and related regulations may adversely affect our people, operations and reputation or licence to operate. We subscribe to best practices in our recruitment process, giving internal candidates room for growth. We have a wellstructured staff development, training and performance management practice. Our Code of Business Conduct sets out requirements related to working with integrity, including dealings with government officials and third parties. We seek necessary approvals from relevant authorities before commencement of any project. We are ISO certified on environmental management with regular internal and external audits. All our tyres undergo inspection before leaving the factory to ensure quality and safety standards are met. 49
50 2.5 Strategy review In this section... Sameer Africa strategy remains firm. Through profitable growth, customer focus, innovative products under strong brands, and dedicated employees, Sameer Africa creates the conditions to be the ultimate provider of innovative reliable tyre solutions. 3. To target an annual turnover growth of at least 12% over the plan period. 4. To maintain operating overheads within 18% of revenue. Key performance indicators Markets remain sensitive to the influence of political as much as economic decisions and we continue to see spikes in volatility. This creates a difficult environment and the risk on/risk off environment means that investor sentiment remains fragile. In light of this challenging backdrop we are focusing on the things we can control as set out in our strategic priorities. From our review of the operating environment, we have identified key strategic trends which have a significant impact on attainment of our strategy and developed strategic responses to address them Strategic priorities Sameer Africa is now three years into its five year strategic plan which can be summarized into four key strategic priorities (a) profitable growth; (b) customer focus; (c) innovation; (d) people and leadership. There have been a number of implementation successes as well as challenges in execution. Due to continuous changes in our operating environment, management continually assesses the impact of these changes to its strategy implementation and develops appropriate strategic responses to harness the successes and respond to the challenges. Our board and the executive management committee maintains a strong focus on the strategic priorities in order to execute the corporate strategy. Profitable growth To ensure market growth and simultaneously enhance profitability, the Group has implemented a number of strategic initiatives which focus on (a) increasing our share of sales into export markets (b) strengthening our position in all core markets (c) maintaining a sustained focus on cost control and (d) expanding our retail network of tyre centres. Strategic objectives 1. To achieve a gross margin of 30% within the plan period. 2. To have earnings before tax of not less than 10% of annual turnover. We have witnessed a decline in total sales over the last two years mainly on account of increased competition from subsidised and uncustomed tyre imports. Gross margins, which increased from 24% in 2012 to 27% in, declined to 25% in as the Group was forced to discount prices to counter competition. The overheads to revenue ratio has continued to rise on account of declining revenues as well as set up costs associated with our opening of new Yana Tyre Centres. Milestones Gross margin improved from 24% in 2011 to 25% in Factory cost reduced by 12.5% from Kshs 950,000/ RRT in 2012 to Kshs 832,000/RRT in Retail sales through our Yana Tyre Centres grew by 34% between 2011 and, to Kshs 463 million. Opened a new sales office in Burundi which generated sales of Kshs 98 million in. Exports sales have grown by 45% from 29,000 tyres in 2011 to 42,000 in. There was however, a 20% decline in export revenues in, as against, due to security issues and foreign currency shortages in various markets. Trade receivable days have reduced from 57 days in 2012 to 50 days in. Achieved full order delivery within 24 hours, in 94% of all orders. Sales units grew by 21% between 2011 and an average growth of 7%. However, sales values have been on a declining trend due to depressed yields arising from increased competition. Operating expenses have remained high at 27% of turnover against a target of 18%, due to set up costs of new Yana Tyre Centres and a new subsidiary in Burundi and beyond As we look to 2015 and beyond, we will focus on reversing the declining sales trend by aggressively penetrating and gaining market share in the discount segment of the market with the recent introduction of our SUMMIT 50

51 2.5 Strategy review (Continued) fighter brand. We will also reenergize our efforts at growing export markets and strengthening others in order to reduce over reliance on certain distribution channels which have witnessed volatility in terms of growth in recent years. We shall continue to grow our Yana Tyre Centre retail footprint, which has seen significant growth in sales and profitability and where we plan to have a total of 50 outlets by end We also expect the challenging operating environment witnessed in to continue into The threat of subsidised and uncustomed tyre imports into our markets will continue to persist into 2015 and beyond, and we will redouble our efforts to lobby Government to ensure a level playing field for all legitimate operators. We will maintain our focus on cost containment, increasing operational efficiencies and maintaining a strong balance sheet. Indeed, we have identified Kshs 220 million in potential cost savings both in the factory as well as in operating expenses. It is essential that we remain operationally and financially fitforpurpose and consequently must balance cost and cash discipline with the need to invest in the business. Our balance sheet now gives us the flexibility to invest where appropriate to drive future growth and improve shareholder returns. Customer focus Our customer focus strategy aims to enhance customer contact through a combination of superior customer service and customer loyalty programs, to deliver on excellent customer relationships. We remain focussed on achieving unrivalled customer satisfaction levels through effective communication, increasing direct customer contact through our new Yana call centre, delivering quality products on time and continually revamping our marketing activities. Strategic objectives 1. To achieve a customer satisfaction level of 95% within 5 years. 2. To expand market share to 25% for Kenya Key performance indicators Customer satisfaction and end user satisfaction indices declined in compared to to 64% from 83% and 76% from 81% respectively. The main complaint remains the higher prices of our Yana brand compared to other brands in the market as well as unfavourable structuring of our dealer promotions, especially with regards our smaller dealers. We have witnessed improvement in product quality in line with our ongoing uniformity improvement processes and actions, whilst claim resolution and order delivery turnaround times have remained high at 90% and 94% respectively. Milestones Achieved 90% claims resolution within 48 hours, as against a target 95%. Increased Yana Tyre Centre retail outlets from 9 outlets in 2012, to 16 in. Rolled out a fully operational call centre. Launched 22 new Yana products and 8 Summit sizes between 2012 and, contributing 18% of total sales in. Introduced various incentives and promotions as part of our customer lockin strategies. Increased marketing spend from Kshs 56 million in 2011 to Kshs 104 million in and beyond To improve on customer and end user satisfaction levels, we will critically review and implement, where possible, issues raised in our customer satisfaction survey completed in late. In particular we will review the discount structure offered to dealers with a view to reversing declining sales in this distribution channel. We will also focus on increasing our direct customer contact using our recently launched Yana call centre. We will double our marketing campaigns demonstrating that our Yana brand is a cheaper cost per kilometre solution, as compared to other imported brands in the market. Innovation The Sameer Africa process for customerdriven product development ensures that we maintain cutting edge tyre technology engineered to meet the challenging driving conditions in Africa. Sustainability is a core element of the Group s strategy and sustained innovation is a prioritized area for product development. The Group s manufacturing platform is continuously adapted and operations streamlined to increase productivity. Strategic objectives 1. To upgrade manufacturing technologies. 2. To have new innovative products 30% of turnover to be from the sale of new products. 3. To achieve a factory utilization of 80% by end of the plan period. 4. Set up a tyre retreading facility. 51

52 2.5 Strategy review (Continued) Key performance indicators We are optimistic that we will finalise negotiations to secure a new equity and technical partner who will contribute both capital and equipment to modernise our factory. People and leadership An innovative corporate culture with dedicated employees from diverse backgrounds provides a robust foundation to develop successful products for our customers. At the same time, it is important to contribute to sustainable development for current and future generations in a world that is evolving at an increasingly rapid pace. Employee passion for innovation, consumer insight and motivation to achieve results sets Sameer Africa apart. Committed and talented managers play a decisive role in the successful implementation of the Group strategy. Strategic objectives 1. To have the ability to attract, develop and retain the right talent. 2. To inculcate a performance based culture. Key performance indicators Staff turnover Sales from new products accounted for 18% of total tyre sales in. Factory utilisation as measured in raw rubber tonnes per day (RRT/day), has steadily increased to 73% against a target of 80%. Milestones In, we experienced an increase in staff turnover within the factory management staff, finance and the Tanzanian operation compared to. Total staff turnover was 11% in, which is within the acceptable industry average of 14%. We have invested Kshs 215 million in factory capital expenditure in the last 3 years, We are at an advanced stage in negotiations with a potential new equity and technical partner. Entered into a contract manufacturing arrangement with a Chinese manufacturer for our new SUMMIT brand. Introduced Achilles, Exceed, Continental and Primewell brands into the market to cover product lineup gaps in our Yana brand. Evaluated the business case for investing in a retreading facility and discarded the same both in terms of financial unviability and changing customer demands and beyond To ensure that we are well positioned to meet everchanging customer requirements, we shall continue to evaluate opportunities for contract manufacturing both within our factory and in other locations. We plan to roll out additional tyre sizes in both Yana and Summit. 52


 and generation Y (20s to early 30s).")
53 2.5 Strategy review (Continued) Recruitment Increase of new employees, especially in the sales department, is attributed to the opening of new Yana tyre centers. Notably, recruitment of tyre center staff is done 2 months prior to opening to enable sufficient time for indepth training. Proper forecasting and staff planning has improved the turnaround time for filling vacant positions. 59% of all new hires were replacements while 41% were new positions. 12 employees were promoted. Job rotation within the sales department was carried out in October, as per the nominations and remuneration committee s recommendation. 88% of vacant positions were filled on time while 12% were behind the acceptable time frame Overall staff recruitment turnover is one month. Gender Analysis The majority of our staff age profile falls within generation X (mid 30s to early 40s) and generation Y (20s to early 30s). Generation X typically adapt well to change, are ambitious and eager to learn new skills. Generation Y have grown up with technology and embrace it in the performance of their duties. They value teamwork and seek input and affirmation of others. Our target is to achieve a minimum of 30% female representation. However, the very nature of the factory operations tends to skew recruitment towards male candidates. Achieving the target therefore, remains a challenge. Demographics Demographics Milestones Rolled out a performance measurement system for all staff. Carried out a staff satisfaction survey in, achieving a 56% satisfaction index. Key gaps identified are now being addressed. Benchmarked the remuneration scales of the Group against other similar entities achieving 75% percentile rating. Aligned our reward system to performance. Age Distribution 2015 and beyond To achieve superior performance for our customers and shareholders we will strive to have the right people in the right roles, fully motivated and competitively paid. Encouraging effective collaboration and teamwork across the Group, within the bounds of regulation and good governance, is our priority. We will continue to develop our talent pipeline at all levels and we will continue to refine our efforts to achieve a performance based culture. We have plans to fully implement succession planning at all levels within the organisation in
54 2.5 Strategy review (Continued) Strategic trends As with any multinational company, our business is subject to a range of external strategic dynamics that will inform decision making and impact our performance both now and in the future. It is incumbent upon us to understand: The drivers behind these dynamics and how they interact; The implications for our business; How we can best navigate them in the short and long term. Below, we examine the key adverse strategic trends that affected our business in, and explain how we are proactively addressing the risks and opportunities that they represent. The case for local manufacturing Issue 1. The EAC Common External Tariff (CET) for passenger and 4x4 vehicles tyres was reduced in 2010 from 35% to 25%, while truck and bus (TBR) tyres reduced from 35% to 10%. The latter adjustment had the anomaly of putting TBR tyres under the semifinished CET category, according to the WTO definition. Whilst this was a political decision, it had the impact of encouraging imports and exposing local manufacture to unfair competition. It was after this tariff change that General Tyres of Arusha experienced difficulties and had to close its manufacturing plant. 2. Chinese government subsidies on tyre exports are as much as 81% of manufactured sales revenue, depending upon manufacturer. 3. Underinvoicing by tyre importers across the region is rampant, rendering the playing field very uneven for local tyre manufacturers and legitimate traders. In addition, due to Kenya s porous borders, a number of tyres are imported into the country uncustomed. 4. The manufacturing sector in Kenya has received little support from the government in terms of polices aimed at protecting local manufacturing, despite the best of lobbying efforts. 5. The high cost of power has made tyres produced locally costly and uncompetitive compared to tyres from regimes where power tariffs are significantly lower. Implications As a result of the above factors, we have witnessed unprecedented growth in the discount sector of the market, mostly comprised of imported tyres from the East. The high price market segment, where our locally manufactured Yana tyres are price positioned, has shrunk from a high of 62% in 2010 to only 25% today. The size of this price segment will continue to decline as the onslaught from imported tyres persists. As the market share of locally manufactured tyres declines, the board is forced to evaluate the case for local manufacturing in the absence of other interventions. Our factory can only operate efficiently and profitably at a minimum 55% utilization (10 RRT / per day). Below this utilization level, the units produced will not be able to competitively absorb the factory fixed costs. Strategic response The Group is pursuing a multipronged approach to address the threat of subsidized and uncustomed imported tyres into the market: 1. Introduction of our SUMMIT fighter brand in, the Group entered into a contract manufacturing agreement with a Chinese manufacturer to develop and produce the SUMMIT range of tyres, which is positioned to compete in the discount sector of the market. In 2015, we will adopt aggressive market penetration strategies for SUMMIT in order to gain profitable market share. We will also increase product sizes and market the brand locally, regionally and in emerging export markets. 2. Explore contract manufacturing both locally and overseas we will pursue opportunities for contract manufacturing with other parties either within our plant or overseas. Local contract manufacturing will ensure that we obtain critical mass in production volumes thereby reducing conversion costs per unit through better fixed cost absorption. External contract manufacturing will be aimed at providing a wide product range to meet the growing customer demands and emerging tyre technologies. 3. Strategic / equity investor the board will continue its negotiations with a potential technical and equity investor to modernise our factory infrastructure. 4. Intensify lobbying efforts we will intensify our lobbying efforts to ensure the Kenyan government moves to create a level playing field for all operators. We will also lobby, through the various industry bodies, for the introduction of countervailing duties for imported tyres in line with decisions made by other countries with significant investments in tyre manufacturing. 54

55 2.5 Strategy review (Continued) Implications The relatively high cost of energy in our manufacturing process has the impact of dramatically increasing our conversion costs compared to competitor plants. Waste and scrap is a sunk cost whose reduction will improve yields on our locally manufactured tyres. Strategic response Energy and scrap cost management Issue As Yana brand profit margins continue to come under pressure from imported brands, it is imperative that we pursue a strategy of enhancing factory efficiency, thereby reducing overall production costs. In 2015 we will move to improve energy consumption efficiencies as well as reduce factory waste and scrap. Energy costs account for 36% of total conversion costs and hence any increase adversely affects the cost per tyre. Energy costs increased by 4% in, compared to, reflecting both an increase in the cost of energy per Energy As part of the Kenyan government infrastructure developments, we have witnessed a reduction in electricity tariffs from the start of 2015, averaging US12 cents/kwh, following the commissioning of additional geothermal capacity. Internally, we continue to invest in programs aimed at reducing overall energy costs. In the last quarter of, we carried out the following measures which we believe will continue to bring down energy costs; Replacement of the boiler economizer (expected 60l/ RRT saving); Fireside furnace repair done to eliminate internal smoking and losses; Burner unit overhaul (efficiency improvement); Water softening plant to ensure effective heat transfer. In 2015, we plan to make the following additional enhancements; Installation of a new and more efficient compressor; Enhance water treatment for the boiler; Improve condensate recovery at the tube room; Implementation of energy audit findings; Upgrade the burner unit to PLC control. Waste and scrap unit as well boiler inefficiencies. The figure below shows energy consumption trends for the company. Although significant downward price adjustments were made toward the end of, electricity tariffs continue to be high compared to other African economies. Industrial tariffs for Kenya averaged US 15 cents/ KWH in compared to just US 4 cents/kwh in Ethiopia, US 6 cents/kwh in Egypt and US 9 cents/kwh in South Africa. Factory waste and scrap accounted for 2.55% of total factory costs in. Machine breakdowns, operator related defects and intermittent electricity supply account for the bulk of waste and scrap. In, significant management attention was focussed in this area and we were able to reduce wastage from the 2.98% level in. Initiatives employed to reduce waste and scrap include the following; Reduction of operator related defects in tyre curing and building as well as tube assembly area and extrusion; Daily machine setup checks by engineers; Treatment of hydraulic water in powerhouse; Repair centre mechanism for press B2; and Stabilize steam temperatures at the tube room. The total of these initiatives, as well as a one day reduction in production ticket attainment, are expected to yield cost savings of Kshs 110 million in
56 2.5 Strategy review (Continued) Cost reduction strategies Issue It is estimated that there are over 300 tyre importers in Kenya offering direct competition to Sameer Africa. The cost base for some of these importers is quite low and they are therefore, able to operate on lower margins. Operating costs for Sameer Africa have continued to grow in line with inflation, the growth in retail tyre centre outlets as well as our extended distribution channel structure. Operating expenses as a percentage of sales have increased from 17% in 2011 to 27% in. Implications To effectively compete with an increasing number of tyre importers, the Group needs to review its distribution and establishment structure in order to create a dynamic and fit for purpose organisation. Although costs have continued to grow in line with increased operations, the negative growth in sales has negatively impacted on operating margins. Strategic response In 2015, management have devised strategies to reduce the cost base. Initiatives which have been put in place include: Review of the Group s distribution network; Assessment of the Group s regional offices on a cost benefit approach; Review of the total establishment; Review of the Group s marketing strategies; Review of staff salary awards; Control over discretionary spends. fivefold in Nairobi in the last 7 years alone, up 535% from The average price per acre was little more than Kshs 30m in 2007, but is more than Kshs 170m today. Commercial and highdensity housing are driving the pricing with the city s most expensive land in Upper Hill, at around Kshs 470m per acre, followed by Kilimani at approximately Kshs 370m an acre. Implications The continued competition in the tyre business has seen the Group s revenues and operating profits decline in the last 2 years. The level of competition is expected to increase before it decreases. To cushion the Group s profitability against the volatility of its tyre business, the board is pursuing strategies of unlocking the Group s property potential and diversifying the revenue base. Strategic response Key strategic initiatives being undertaken include: Focus on tenanting Sameer Business Park so as position it as the premier business park in Nairobi. Explore plans to develop warehouses, retail and/ or hotel developments on the Group s land bank on Mombasa Road. Manage Sameer Industrial Park and Sameer EPZ Limited to world class standards. Explore redevelopment of the Group properties in Westlands, Nairobi for a state of the art commercial office park. These initiatives are expected to yield cost savings in excess of Kshs 120 million in Diversification Issue The Group s tyre business accounts for 96% of total revenue, with the property rental business accounting for the remaining 4%. The tyre business has continued to experience challenges in terms of competition, as well as volatility to the global prices of key raw material inputs. These external shocks continue to have an adverse effect on total Group profitability. The Group however, has a significant land bank currently valued at over Kshs 2.3 billion, with significant potential for redevelopment. Advertised land prices have risen 56
57 2.6 Performance review In this section... Our key performance indicators (KPIs) enable us to measure our financial, operational and sustainability performance. This section attempts to demonstrate the relationship between our strategy and performance. In this section we evaluate our financial, operational and sustainability performance for against set targets as well as a comparison with prior years. We also look at performance trends and assess them in line with our overall long term strategic goals Financial performance The review of the Group s financial performance analysed here below should be read in conjunction with the audited financial statements for the year ended 31 December which follow on pages 100 to 162. Summary Statement of Comprehensive Income Financial overview Kshs m Kshs m Change % Tyre sales Rental income Total revenues Cost of sales 3, ,777 (2,841) 3, ,030 (2,952) 7% 9% 6% 4% Gross profit Other operating income Operating expenses (1,007) 1, (915) 13% 85% 10% Operating (loss) / Profit Net Finance costs (26) (44) 461 (4) 106% 949% (Loss) / profit before income tax Income tax credit / (expense) (70) (56) 115% 105% (Loss) / profit for the year Earnings per share: Basic and diluted (Kshs) (67) (0.24) % 117% Other key information Gross margin Operating margin Units sold 000 RRT sold Selling price Kshs m/rrt Cost price Kshs m/rrt 25% 1% 320 3, % 11% 325 3, % 106% 2% 1% 6% 3% Group revenues Group revenues declined by 6% in, compared to.this was mainly due to depressed demand from the dealer trade in Kenya because of liquidity challenges as well as increased competition from imported tyres. In addition, slowed growth in exports to African markets was witnessed during the year due to political uncertainties, particularly in South Sudan, and foreign currency challenges in others. We have however, seen signs of recovery in some of these markets and are confident that there will be an improvement in the trading environment in Despite the drop in revenues, volume sales as measured by raw rubber tonnes (RRT) remained relatively stable with a 1% drop against. Sales of imported units increased by 39% however, driven by the introduction of our Summit brand in the last quarter of. YANA brand sales however, registered an expected 2% decline. Rental income in was 57
58 2.6 Performance review (Continued) up 9% compared to. The increase is attributable to additional subtenants at our leased premises in Dar es Salaam and full letting of the EPZ subsidiary s warehouses. Revenues by channel Revenues by distribution channel recorded mixed performance during the year. Sales to key accounts (government, fleet and corporate) recorded an impressive both as a result of organic growth as well as contribution from new outlets. Sales from regional operations in Tanzania, Uganda and Burundi have remained flat over the last 3 years. Sales to the dealer trade and exports declined by 20% and 23% respectively. The impact of the decline in these two channels more than offset the gains from the other channels. Dealer trade channel contribution to total tyre revenue declined from 43% in to 36% in. Gross margins Selling prices per RRT declined on average by 6% against a cost of sales per RRT decline of 3%. To cushion the Group against increased competition from tyre importers, management responded by offering additional discounts to the dealer trade. The yield, measured as the differential between the selling price per RRT and cost price per RRT, declined by a significant 16%. Indeed, yield has been on a declining trend for the last 3 years as increased competition continues to put pressure on selling prices. 42% growth following the successful award of various government tenders. Yana Tyre Centre revenues grew by 15% 58
59 2.6 Performance review (Continued) The effect of declining yields resulted in absolute gross margins declining from 27% in to 25% in. Operating expenses Operating expenses were contained at 10% above last year, through prudent management of costs despite notable increases in costs from new retail outlets and our Burundi subsidiary. Operating expenses increased by Kshs 92 million in absolute terms fuelled by growth in the following expenses; Depreciation charge from new equipment purchased mainly for our tyre centres accounted for Kshs 16 million of the increase. We witnessed additional professional fees during the year of Kshs 16 million mainly on account of professional services rendered to challenge tax assessments from the regional tax bodies. Costs related to new Yana Tyre Centre outlets accounted for Kshs 32 million of the increase. New retail outlet set up costs relate to new staff hires and rent charges for new premises. Motor vehicle running expenses grew by Kshs 12 million in the year due to new leases at higher rates than the expired ones. Employee compensation costs Group employee costs comprise fixed base salaries, benefits, expenses related to retirement benefits obligation and bonus pay. Compensation costs in total were 19% of revenue up from 15% in, mainly on account of a 20% growth in costs related to the retirement benefits obligation. Costs related to retirement benefits obligation represent the current service cost and interest. Benefits in the scheme are payable on retirement or death. The actual cost to the company of the benefits is therefore subject to the demographic movements of employees. Fixed compensation and benefits grew by only 7% as there was no salary award for management staff during the year. Net finance costs Net finance costs grew from Kshs 4 million in to Kshs 44 million in, fuelled mainly by a 78% increase in interest costs and 100% increase in foreign exchange losses. The increase in interest expense is attributable to increased financing of raw material purchases and capital expenditure. Depreciation of the regional currencies against the US dollar was instrumental in the increase in net foreign exchange losses. Cash earnings (EBITDA) As the Group has a number of noncash items in the income statement, it is important to focus on cash earnings to measure the true earnings potential of our business. The table below gives a reconciliation of adjusted income before tax to adjusted EBITDA. The main differences are net finance expense, depreciation and amortization, current service costs and interest obligations on our retirement benefits obligation as well as the elimination of exceptional items. (Loss) / Profit before income tax Add back: Net finance costs Depreciation and amortisation Net current service and interest costs on retirement benefits obligation Less: Exceptional items Income from sale of land Adjusted EBITDA EBITDA Margin Kshs m (67) % Kshs m (255) 327 8% 59
60 2.6 Performance review (Continued) As a result of declining sales in the last two years, the EBITDA margin has declined from a high of 12% in 2012 to 4% in. Statement of Financial Position The Group s balance sheet remains strong and liquid. At 31 December, total shareholders equity was Kshs 2.54 billion with net tangible assets of Kshs 2.50 billion. Summary Statement of Financial Position Cash and cash equivalents Inventories Trade and other receivables Total liquid assets Trade and other payables Net liquid assets Property plant and equipment Investment property Equity accounted investees Prepaid operating lease rentals Current income tax Net deferred tax asset Total tangible assets Borrowings Unclaimed dividends Retirement benefits obligation Net tangible assets Intangible assets Shareholders funds Kshs m 362 1, ,816 (526) 2, ,278 (611) (178) 2, ,536 Kshs m 483 1, ,747 (258) 2, ,345 (571) (7) (149) 2, ,680 Liquidity Our primary sources of liquidity is cash generated from our operating activities. Our cash flows from operating activities are driven primarily by our operating results and changes in our working capital requirements. In the last two years, the Group has been working intensively to reduce tiedup capital in its working capital elements. In addition to Groupwide measures to streamline and optimize manufacturing, we have been working on reducing working capital to release resources that can instead be invested in growth activities. The work focuses on efficiency enhancement measures in primarily four areas: trade receivables, accounts payables, inventory and procurement. The working capital program has resulted in an increase in the capital turnover rate and a reduction in structural working capital. 60
61 2.6 Performance review (Continued) Capital management The Group s capital management strategy focuses on two key areas: Investing in the organic growth of the business. Returning excess funds to shareholders through dividends. During the period, capital expenditure of Kshs 232 million (: Kshs 190m) was incurred primarily to expand our Yana Tyre Centre retail outlets as well as factory upgrades. The structure of the capital expenditure in the Group has been changing to more expansionary investments and less maintenance investments. In addition to a dividend payment of Kshs 84 million (: Kshs 70 million), the Group also remitted Kshs 9 million to the Unclaimed Financial Assets Authority in. Net debt Financial net debt increased by Kshs 161 million as a result of the growth in capital expenditure, funded typically using shortterm financing arrangements, and the payment of dividends in the year. As a result, net debt to equity ratio increased from 3.2% to 8.96% Equity and return on equity Total equity as of December 31,, amounted to Kshs billion (: Kshs billion), which corresponds to Kshs 9.1 (: Kshs 9.6) per share. The Group registered a negative return on equity of (3%) in (: 15%). 61
62 2.6 Performance review (Continued) Statement of Cash Flows Cash flow from operating activities increased marginally to Kshs 234 million despite the decline in earnings, mainly on account of our increased focus on working capital reduction. Accounting policies and standards The accounting policies and standards applied by the Group have remained consistent with those applied during the prior period except for the adoption of new standards, amendments and interpretations. The adoption of these amendments has resulted in minor revisions to accounting policies and disclosures, but has had no impact on the Group s financial position or performance. For further information refer to note 4 of the financial statements Operational performance Total tyre production declined by 5% in, to 3,099 raw rubber tonnes (RRT) compared to 3,240 RRT produced in, on account of the decline in demand in the second half of the year, longer factory shutdown periods as well as a deliberate effort to reduce our inventory levels. Total production costs declined by 3%, from Kshs 858,000/ RRT in to Kshs 831,000/RRT mainly on account of the 10% drop in the cost of raw material inputs. Factory conversion costs increased by 6% to Kshs389,000/ RRT when compared to, driven mainly by higher energy costs as well as additional depreciation on recent plant upgrades. Raw material costs have witnessed a significant decline of 27% in the last 4 years with an average annual decline of 7%. This is mainly attributable to the decline in the cost of natural rubber fuelled by a global decline in demand. Increases in labour costs have remained marginal at below 2% per annum on average, mainly through increases in productivity per manhour. Growth in factory production has been achieved without an increase in manpower levels. We have witnessed a 3% decline in other operating costs despite a general increase in depreciation, mainly as a result of a reduction in curing bladder costs. Waste and scrap recorded a decline in, as a result of various activities undertaken to address the causes. Energy costs have been growing at an average of 9% over the last 4 years, both as a result of increases in the cost per unit as well as boiler inefficiencies. 62
63 2.6 Performance review (Continued) Sustainability performance At Sameer Africa, we will always ensure that our business today never compromises the ability of future stakeholders to meet their own needs. Environmental and social aspects have a strong link with economic performance through the investments we make in environmental management initiatives and which involve our work with employees, suppliers, customers and the community. (a) Stack emissions During the year we carried out boiler stack emissions testing and analyses. To evaluate the levels of contaminant concentrations emitted from the measured emissions, World Bank Guidelines for maximum values were used. The results were well within the guidelines and continued to show an improvement in the stack emission quality from the burner, compared with values recorded in. Environmental performance Pollutant or Parameter Limit Our activities for environmental management focus on key aspects in all operational units, the manufacturing process and product output where we endeavour to minimise negative impacts and enhance positive ones. Emissions SO2 mg/nm3 2000* Emissions NOX mg/nm3 2300* Prevention and Abatement *World Bank Pollution Stack emissions performance Actual Actual 15% O2 Gases Dry Units Dry Units Ref Units Oxygen 9.5 % Carbon Dioxide 7.0 % Carbon Monoxide ppm mg/nm mg/nm3 Sulphur Dioxide ppm mg/nm mg/nm3 Nitrogen Oxide ppm mg/nm mg/nm3 Nitrogen Dioxide 4.4 ppm 9.0 mg/nm3 4.7 mg/nm3 NOX ppm mg/nm mg/nm3 NO ppm mg/nm mg/nm3 CxHy ppm mg/nm3 mg/nm3 Stack Temperature ºC K 63

64 2.6 Performance review (Continued) (b) Volatile organic compounds Sampling of Volatile Organic Compounds (VOC s) was also concluded in, according to ISO The VOC s were passively sampled into diffusion tubes packed with adsorbents. Laboratory analysis was carried out and results showed Below Detectible Limits for most of the compounds. Other Compounds have their Time Weighted Averages (TWA) on Occupational Exposure Limit (OEL) yielding results within the recommended/ critical limits. Table 2 VOC Results in mg/m3 Section MRC LAB TYRE ROOM CEMENT HOUSE TWA OELRL (mg/m3 ) TWA OELCL (mg/m3 ) Acetone BDL BDL BDL 1780 Benzene Butyl Acetate BDL BDL BDL 710 Ethanol BDL BDL BDL 980 Ethyl Acetate BDL BDL BDL 1400 Isopropyl Alcohol BDL BDL BDL 980 nheptane nhexane Toluene m&p Xylene BDL BDL BDL 435 oxylene BDL BDL BDL 435 BDLBelow Detectable Limit (c) Waste management The company has a welldefined waste management system within its manufacturing plant. The system takes into account the requirements of ISO and goes beyond just mere compliance requirements. All our vendors and recyclers are recognised and authorised to collect and recycle or dispose of different types of waste. 64

65 2.6 Performance review (Continued) Hazardous waste control strategies Short term Elimination of oil leaks at the receiving process oil tank areas: containment sand contributes to up to 200kg of hazardous waste per spill containment incident. Dispose of all pending expired /obsolete chemicals by Jan 2015 Long term Map out all hazardous waste source points and control generation. Social performance The definition of corporate social responsibility in Sameer Africa Limited remains unchangeable as the company is still steadfast in going beyond philanthropy and compliance and addresses how it manages its economic, social, and environmental impacts, as well as its relationships in all key spheres of influence: the workplace, the marketplace, the supply chain, the community and the entire public realm. Social performance measures the company s interactions with its employees and the community. The table below shows the Group s social investment from 2011 to. 65
66 2.6 Performance review (Continued) (a) Employees Health and wellness has always formed an integral part of Sameer Africa s strategy. The company has therefore, always endeavoured to promote this, not just within its employees, but also amongst the entire community within which it operates. In, Sameer Africa decided to evolve the HIV and Peer Educators initiative that had developed initiatives on creating awareness on HIV amongst staff members, to a more holistic scheme dubbed Wellness. The scheme boosts awareness amongst staff members and by extension, their families and dependents, on how to be well physically, mentally and emotionally. The scheme reaches out to staff through s and notice boards on issues ranging from stress management, the importance of exercise, financial wellbeing and how to safeguard oneself from the Ebola pandemic, amongst others. The scheme organized a personal financial management and investment week in the month of November. In conjunction with Avenue Healthcare and Eagle Africa, the company also organized a fiveday wellness week in October themed My Health, My Wealth. The campaign gave staff members an opportunity to interact with the health providers and learn current and developing trends in the health and medical fields for general wellbeing. The camp offered free health checkups to all staff members during the week. The company recognises and is sensitive to human rights and has policies against discrimination in any form. Our employees are also made aware of the expectation not to engage in any fraudulent or corrupt dealings in any of their business activities. Our policy is zero tolerance to these vices. (b) Product responsibility The quality standards on our product performance, health and safety has been a key differentiator of our brands in the market. All our products come with a manufacturer s warranty; a testimony of the belief we have in our production processes. (c) Social responsibility Sameer Africa community development initiatives focus on improving the livelihoods and general wellbeing of the societies in which we operate. During the year, we supported the following initiatives; Road safety In, Kenya lost 2,907 lives through road accidents, most of them between the ages of 15 and 44 years. The cost to the economy from these accidents is immeasurable. A significant percentage of these fatalities were attributed to tyre deficiencies. In, Sameer Africa extended its engagement in grassroot road safety campaigns across the country by training organized motor groups on tyre safety and maintenance. This educative programme focused on motorists through various interest groups within the motor industry in Kenya, Uganda, Tanzania and Burundi and was extended to matatu saccos, dealer workshops, mechanic groups, tour operators, corporates and organized fleets. The road safety initiative also involved Sameer Africa factory tours by institutions, universities and colleges. In, Sameer Africa was awarded, for the second time running, Best Safe Tyre Company by the National Road Safety Agency, for manufacturing quality tyres that relate with, and withstand the unique challenges presented by African roads. Charitable sports In, Sameer Africa sponsored and participated in a number of sports that were organized to help destitute people, elevate livelihoods and/or eradicate human pandemics. As part of the Sameer group of companies, we contributed Kshs 700,000 to the Beyond Zero Campaign, a drive which is an initiative of the First Lady of Kenya, geared towards raising awareness and galvanizing support towards combating maternal and childhood mortality. The Sameer group contributed a total of Kshs 10 million. This sponsorship allowed a number of Sameer Africa staff to participate in the First Lady s Half Marathon which was held on 9th March,. Sameer Africa further sponsored a number of golf tournaments whose proceeds were channeled to help the needy. These included the Canada Golf Tournament held on 22nd June, aimed at helping needy students at Starehe Girls Centre and Vet Lab Charity Golf Tournament aimed at supporting underprivileged children at the Shangilia Mtoto Education Centre. In addition to this, Sameer Africa contributed Kshs 100,000 towards the renovation of Nyumba Ya Wazee shelters, a congregation of religious sisters caring for the elderly poor. The destitute home, cares for 70 poor elderly people, aged between 65 and 107 years. The home solely depends on charity and the generosity of wellwishers. Support of local tourism In, local tourism suffered a great deal following a number of security incidents in various parts of the country. Sameer Africa, one of the key pillars in developing Kenya s economy, crafted a promotion that linked the purchase of tyres to the promotion of tourism. The promotion, dubbed Cross Over To Yana, took place in the months of September and October, and coincided with the great wildebeest migration. The promotion urged motorists to buy new Yana tyres in return for which the company then donated Kshs. 100/ for every tyre sold to the Mara Conservancy. A total of Kshs 703,700 was paid over. 66


67 2.6 Performance review (Continued) First Lady Margaret Kenyatta receives Kshs 10 Million in donation towards the inaugral Beyond Zero campaign from Mrs Zarin Merali and PA to Sameer Group Chairman Peter Gitonga in April. 2. Golf Tournament in support of Starehe Girls Center. 3. Tyre display at the First Lady s half marathon Marketing agencies taken through the production process at Sameer Africa Factory 2. Nairobi based mechanics taken through a training on tyre care and maintenance at Yana Training Centre 3. An award on best quality and safe tyres being received by the Brand and Communications Manager, Margaret Mboga, on behalf of Sameer Africa The Managing Director Mr Allan Walmsley hands over a cheque to Mara Conservancy Veterinarian Dr Asuka Takita to aid in the conservancy efforts of the Mara triangle. 2. Looking on are Mara Conservancy game rangers and Sameer Africa team. 3. Cross Over To Yana campaign activation at selected roundabouts in Nairobi. 67
68 68
69 Contents SECTION 3: GOVERNANCE AND REMUNERATION PAGE 3.1 Board of Directors Executive Committee Chairman s governance statement Governance report Audit, risk and corporate governance committee report Directors remuneration report

70 3.1 Board of Directors Peter M. Gitonga Akif H. Butt Eng. Erastus K. Mwongera 70

71 Allan Walmsley Stephen M. Githiga Sameer N. Merali Edgar J. Imbamba 71

72 3.1 Board of Directors Directors Eng. E. Mwongera Chairman A. Walmsley * Managing Director S. N. Merali A. H. Butt S. M. Githiga P. M. Gitonga * South African Company Secretary Edgar Jumba Imbamba P.O. Box Nairobi GPO Eng. Mwongera had a distinguished career in the public service spanning thirty years. He started his career in the water sector where he was Principal of the Kenya Water Institute and a director of Water Development for a combined period of 12 years. Thereafter, for over 15 years, he served as permanent secretary in the Office of the Vice President, Ministry of Home Affairs, Ministry of Lands and Housing, Ministry of Roads, Public Works and Housing, Ministry of Water Resources and Ministry of Land Reclamation, Regional and Water Development. In recognition for his distinguished career in the public sector he was decorated with Chief of Burning Spear (CBS) and Elder of Burning Spear (EBS). Eng. Mwongera is a distinguished engineer who has played a key role in the development of the engineering profession and practice in Kenya as a past chairman of the Engineers Registration Board and he is currently chairman of the Eminent Fellow Engineers Forum. Eng. Mwongera is very active in local and social circles where he is a past chairman of the Elders Court in his church, Director of the Leadership Foundation of Kenya and a member of many social and charity organizations. Eng. Mwongera is the chairman of the board of directors of Sameer Africa Limited and also the chairman of the nominations and remuneration committee. 1. Eng. Erastus K. Mwongera Chairman (NonExecutive) Engineer Erastus Mwongera is an engineering graduate from the United Kingdom university system and a Fellow of the Institute of Engineers of Kenya. He is currently a management consultant specializing in engineering, management and strategic planning. He is a board member of National Bank of Kenya Limited and is also the immediate past Chairman and current board member of the Federation of Kenya Employers. He is also the current Chairman of Kenya National Highways Authority. He is a Director of Hillside Green Growers and Exporters Company Limited and Chairman of Linksoft Group Limited with responsibility for policy direction and guidance on productivity and profitability. From 2006 to 2009, Eng. Mwongera was chairman of the Kenya Airports Authority during a time of major rehabilitation, modernization and expansion of Kenya s international and national airports and airstrips. 2. Allan Walmsley Managing Director (Executive) Allan Walmsley was appointed to the position of Managing Director in August, He has over 25 years experience in various industries in fi nance and general management. Some of the companies he has worked for include Hunyani Paper and Packaging Company (Zimbabwe), Sun International (South Africa), Gallagher Estate Conference & Marketing (South Africa), Lonrho Motors (United Kingdom and Kenya) and Royal Exchange Plc (Nigeria). Allan holds a Bachelor s Degree in Accountancy and is also a Chartered Accountant. 72
 in Management Science. Mr.")

73 3.1 Board of Directors 3. Sameer N. Merali Director (NonExecutive) Mr. Sameer N Merali holds a Master of Science degree in Banking and International Finance and a BSc (Hons) in Management Science. Mr. Merali initially worked with Merrill Lynch International Bank Limited in the United Kingdom as an Investment Analyst between October 2000 and February 2003 and joined Sameer Investments Limited in March He is the Chairman of Ryce East Africa Limited and Nandi Tea Estates Limited. He is the Chief Executive Officer of Sameer Investments Limited and a Director of Sasini Limited, a company listed on the Nairobi Securities Exchange. Mr. Merali is a member of the audit risk and corporate governance committee of the board. 5. Akif H. Butt Director (NonExecutive) Mr. Akif H. Butt is a Fellow of the Association of Chartered Certified Accountants (ACCA) and a Certified Public Accountant of Kenya (CPA (K)) and has a wealth of experience in fi nancial management, corporate planning and strategic management. He previously worked with PricewaterhouseCoopers in Kenya and the East Africa region, Liberia and England. He joined the Sameer Group in 1989 and is currently the Group s Finance Director. He represents the interests of the Sameer Group on the boards of various companies. Mr. Butt is also a Director of Sasini Limited and Eveready East Africa Limited, which are both quoted on the Nairobi Securities Exchange. Mr. Butt is the chairman of the finance and investment committee of the board. 4. Peter M. Gitonga Director (NonExecutive) Mr. Peter Gitonga has previously served in various capacities at senior management level in Sameer Africa Limited. He holds a Bachelors of Science Degree in Business Administration and a Master of Science in Strategic Management from the United States International University (USIU). Mr. Gitonga is a member of the nominations and remuneration and the finance and investment committee of the board. 6. Stephen M. Githiga Director (NonExecutive) Mr. Stephen Githiga is currently the Managing Director of First Assurance Company Limited and holds a Master Degree in Business Administration and a Bachelor of Science Degree from the University of Nairobi. He is also a Certifi ed Public Accountant and is currently pursuing an ACII qualifi cation. Prior to joining First Assurance, Stephen worked with Deloitte & Touche and Lonrho Africa Limited. Mr. Githiga is the chairman of the audit risk and corporate governance committee of the board. 73

74 3.2 Executive Committee John Kabare General Manager, Manufucturing Jackline Omuka AG. Head of Human Resource Martin Makundi General Manager, Finance & Strategy Steve Mwenda General Manager, Marketing & Business Development Allan Walmsley Managing Director 74


75 Romulus Omondi General Manager, Operations Richard Opiyo Chief Information Officer Hassan Awadh Head of Audit and Risk Mishek Wanjohi General Manager, Sales Edgar Imbamba Company Secretary 75

 and Royal Exchange Plc (Nigeria). Allan holds a Bachelor s Degree in Accountancy and is also a Chartered Accountant. 2.")
76 3.2 Executive Committee 1. Allan Walmsley Managing Director (Executive) Allan Walmsley was appointed to the position of Managing Director in August, He has over 25 years experience in various industries in fi nance and general management. Some of the companies he has worked for include Hunyani Paper and Packaging Company (Zimbabwe), Sun International (South Africa), Gallagher Estate Conference & Marketing (South Africa), Lonrho Motors (United Kingdom and Kenya) and Royal Exchange Plc (Nigeria). Allan holds a Bachelor s Degree in Accountancy and is also a Chartered Accountant. 2. Steve Mwenda General Manager Marketing & Business Development Steve Mwenda is responsible for developing, leading and implementing the company s marketing strategy and programmes to deliver sustainable and profi table growth. Steve joined the Company in Prior to this, he worked as the Sales and Marketing Manager at the Kenya Literature Bureau. He also worked as Regional Sales Manager, Marketing Manager, Product Group Manager, Brand Manager and Sales Representative with Unilever Plc, both in Kenya and Nigeria, having joined as a management trainee. Steve is a holder of a Bachelor of Commerce (Marketing) degree and is a member of the Marketing Society of Kenya. Misheck Wanjohi is responsible for giving strategic direction to the sales function with emphasis on regional business expansion, retail growth and customer satisfaction. He has a wealth of experience in sales and marketing and was previously the National Sales Manager PZ Cussons East Africa Limited. Misheck holds a B. Pharm Degree from the University of Nairobi, an MBA in Strategic Management from the United States International University (USIU) and a post graduate Diploma in Marketing from the Chartered Institute of Marketing. 4. Martin Makundi General Manager Finance & Strategy Martin Makundi joined the Company in February Leading the financial management and strategy function for optimal utilization of company s financial resources and coordinating the company s strategic focus, he also ensures compliance with regulatory requirements and appropriate reporting standards. Prior to his appointment, he was the Manager, Revenue Accounting at Kenya Airways and also served as the Chief Finance Officer (CFO) in Precision Air Services Tanzania. Martin also held senior positions in the Central Bank of Kenya, Kenya Petroleum Refineries Limited, Total Kenya Limited and was a Senior Auditor with Deloitte. Martin holds a Bachelor of Commerce (Accounting) degree from the University of Nairobi and is a Certified Public Accountant CPA (K). He is also a Certified Information Systems Auditor (CISA) and a Certified Financial Modelling Masterclass (CFMM). 5. John Kabare General Manager Manufacturing 3. Misheck Wanjohi General Manager Sales John Kabare is the General Manager, Manufacturing and has vast experience in tyre manufacturing technologies and processes. He has held various senior positions in chemical, technical and plant services within the company. John holds a BSc Degree in Chemistry and Computer Science from the University of Nairobi and an MBA in Strategic Management from the JKUAT. 76


77 3.2 Executive Committee 6. Romulus Omondi General Manager Operations Romulus Omondi is responsible for developing, leading and implementing procurement, supplies planning and logistics processes to ensure cost effective sourcing and timely availability of quality raw materials, fi nished products and services. He joined Sameer Africa Limited in Prior to this, he worked for Unilever East Africa for over 19 years in various positions in supply chain management in both Kenya and Tanzania. He has been an Associate Consultant with ESokoni as well as with International Supply Chain Solutions. He holds a Bachelor of Arts Degree (Economics) and he is also a member of CIPS and KISM. 7. Jackline Omuka Ag. Head of Human Resources Jackline Hellen Omuka joined the company in February 2012 as the Learning & HR Development Manager. Prior to that she was the Manager, Training and Consultancy Services at the Kenya Institute of Management, and also served as the Programmes Coordinator at International Supply Chain Solutions. Jackline holds a Bachelor of Business Administration and Management degree from Daystar University. She is a finalist student at the University of Nairobi and The Institute of Human Resource Management having undertaken an MBA in Strategic Management and post graduate diploma In Human Resources, respectively. She is also a member of the Kenya Institute of Managemand Institute of Human Resource Management. Hassan Awadh is responsible for evaluating and monitoring the adequacy of internal controls, risk management processes and corporate governance platforms in order to safeguard company assets and enhance business performance. He joined the company in 2000 and has held various positions within the finance and audit departments. He previously worked with Siginon Freight Limited for 8 years. Hassan is a Certified Public Accountant (CPA), a Certified Information Systems Auditor (CISA), a member of the Institute of Certified Public Accountants (ICPAK) and a member of the Information Systems Audit and Control Association (ISACA). 9. Richard Opiyo Chief Information Offcer Richard Opiyo holds a Bachelors of Science degree in Computer Science from Makerere University. He underwent SAP training in Mumbai, India and specialized in the following SAP functional areas; Production Planning (PP), Plant Maintenance (PM), and Materials Management (MM). Richard has participated in two SAP end to end implementation projects, and has over 5 years post golive support experience in Mukwano Group (Uganda) and Sameer Africa respectively. He is a member of the SAP User Group in East Africa. 10. Edgar Imbamba Company Secretary Mr. Edgar Imbamba is an Advocate of the High Court of Kenya and a practicing Certifi ed Public Secretary. He holds a Bachelor of Laws degree from the University of London and a Master of Laws degree from the University of Hull in the United Kingdom. He has previously held senior management positions at the Postal Corporation of Kenya, Kenya Tourist Development Corporation and Kenya Tea Development Agency Holdings Limited. 8. Hassan Awadh Head of Audit and Risk 77
78 3.3 Chairman s governance statement At Sameer Africa, we believe that good governance supports longterm value creation. Simply put, we think good governance is good business. Dear Shareholder, The board believes that a high standard of corporate governance is a key contributor to the longterm success of the company. The board remains committed to ensuring that a combination of good leadership and the highest standards of corporate governance are maintained through a combination of a robust internal framework of systems and controls underpinned by the right values and culture. This framework of policies and processes is regularly reviewed against developments in the legislative, regulatory and governance landscape. This governance and remuneration section comprises the following sections: Governance report Audit, risk and corporate governance committee report Remuneration report and effective communication. We believe that continued engagement with our shareholders is highly beneficial to all parties as it helps to build a greater understanding of our investors views, opinions and concerns. The CMA Code of corporate governance practices As a listed company, Sameer Africa is governed by the Capital Markets Authority (CMA) Code of Corporate Governance Practices for Listed Companies in Kenya. I am pleased to report that the board has incorporated the recommended practices of the CMA code into its own code of corporate governance. Eng. Erastus K. Mwongera, Chairman, 25 March 2015 The role of the board The board s main role is to work with the executive team, providing support and advice to complement and enhance the work undertaken. The board consistently challenges processes, plans and actions and exercises a degree of rigorous enquiry and intellectual debate. This serves to promote continuous and sustained improvement across the business. The board consists of a majority of independent, nonexecutive directors. Further details of our board composition and appointments are set out on page Governance report In addition to scheduled formal board and committee meetings, there are meetings for cross interaction among the members of the board and the executive management team. The company has a policy and programme for induction and continuing professional development for directors. On appointment, each director takes part in a comprehensive induction programme. To enhance performance and effectiveness, the board has established a process for the annual development of the board, its committees and individual directors. We remain committed to sharing our business vision with our shareholders by maintaining regular open dialogue 78
79 3.4 Governance report In this section... At Sameer Africa, we have a governance framework that goes beyond an interest in governance for its own sake or the need to comply with regulatory requirements. Instead, we believe that highquality governance supports longterm value creation. Simply put, we think good governance is good business. In the same spirit, we do not see governance as just a matter for the Board. Good governance is also the responsibility of executive management and is embedded throughout the organisation. In this section we evaluate how our governance framework supports the proactive and effective management of strategic dynamics and ultimately how it determines our longterm sustainability How the board works Our meetings Our role The board is collectively responsible for delivering the longterm success of the Group by: Establishing the strategic direction of the Group and overseeing and monitoring its activities. Ensuring that appropriate corporate governance structures and practice, systems, policies, processes, strategies and resources are in place and are functional to enable the Group to operate in a safe, responsible and ethical manner and in compliance with all moral, legal and regulatory requirements. Reviewing corporate strategy, major plans of action, policies, business plans and overseeing major capital expenditure and business acquisitions. Ensuring that the requirements of all stakeholders are fully understood and met. Monitoring and formally assessing the performance of the boards, their committees, individual directors and the senior executive management team against the relevant charters, corporate governance policies, agreed goals and objectives and the annual budget. Selecting, compensating, monitoring and when necessary, replacing key executives and overseeing succession planning. Ensuring the continuity of the Group via formal disaster recovery procedures and the establishment of a clear succession plans. Establishing an appropriate risk management framework which effectively identifies and manages all risks in line with the Group s overall risk appetite. Ensuring that the internal and external audit functions are effective and that robust accounting and internal control systems are in place. Establishing effective procedures for monitoring internal and external financial and other reporting to ensure it continually gives an accurate account of the Group s progress, profitability, financial position and risk. The board at all times, conducts the business of the group based upon sound practices and acts in good faith, with due diligence and care in the best interests of all stakeholders. There is a schedule of specific matters reserved to the board for decisions which is available and is clearly documented and understood by management. The number of meetings held during the year and attendance of directors is set out in the table on page 81 The board agrees a schedule of matters it wishes to consider at each of its meetings and those of its committees. The schedule ensures that all relevant matters are considered and receive appropriate attention. Meetings are normally held at the company s head office along Mombasa Road, Nairobi. Board meetings are structured around the following areas: Operational and functional updates Financial updates Strategy and risk Progress against strategy Other reporting and items for approval Feedback from committees Senior executives and other colleagues are regularly invited to attend meetings for specific items. In addition to formal board and committee meetings, meetings take place between the board members and executive committee where departmental performance is reviewed. What we focussed on in? Business performance reviews Enterprise Risk Management (ERM) Corporate governance and disclosure requirements Technical partners engagement Board performance Our plans for 2015 Strategic trends Board performance evaluation Property business strategy Business performance reviews Risk monitoring and mitigation Succession planning Product diversification 79
80 3.4 Governance report (Continued) Our governance structure THE BOARD (Chairman, one Executive director and four NonExecutive directors) Managing Director Executive Committee (ExCo) Risk Management Committee Nominations and Remuneration Committee Finance and Investment Committee Audit, Risk and Corporate Governance committee The diagram above shows Sameer Africa governance structure. The board has approved a formal framework for the approval of expenditure within the company around this governance structure Who is on our board and how we work as a team Composition and appointments The composition of the board is set out on page In accordance with the company s articles of association, one third of the nonexecutive directors retire annually at the company s annual general meeting (AGM) and if eligible, and offer themselves, they may be so reelected in that meeting. In the last AGM held on 23 May, the Chairman, Eng. E. K. Mwongera retired under the rotation rule and being eligible offered himself for reelection and was duly elected. As per the articles, the directors retiring by rotation are shown in the notice of the 46th annual general meeting on page 166. Nonexecutive directors are expected to commit sufficient time to the company and the board activities and the board is satisfied that each of the nonexecutive directors committed sufficient time to the business of the company during the year. Skills and experience There are job descriptions in place for each of the Chairman, the Chief Executive and the NonExecutive Directors which have been agreed by the board. The board is of the view that the nonexecutive directors are independent in both character and judgement. They constructively challenge and help develop proposals on strategy, scrutinise the performance of management in meeting agreed goals and objectives and monitor the reporting of performance. The board works well together bringing strong, independent, balanced judgement, knowledge and experience to the board s deliberations. Each nonexecutive director has appropriate skills and experience such that their views carry significant weight in the board s decision making process. 80
81 3.4 Governance report (Continued) Board and committee membership and attendance at meetings in Audit, Risk & Nominations & Finance & Status Board governance remuneration investment Eng. Erastus K Mwongera Chairman, Independent 4 3 Allan Walmsley Executive Stephen M. Githiga Independent 4 2 Akif H. Butt NonExecutive 4 3 Peter M. Gitonga NonExecutive Sameer N. Merali NonExecutive Board committees The board has delegated certain responsibilities to its committees. The terms of reference for each committee are reviewed annually and are clearly documented. Audit risk and corporate governance committee The committee is established to assist the board in the effective discharge of its oversight responsibility to ensure and oversee the integrity of the Group s s accounting and reporting processes and for the risk assessment and risk management functions of the Group. The Head of Risk and Audit reports directly to this committee and makes quarterly presentations for the consideration of members. The committee is responsible for: Ensuring the integrity of the company s accounting and reporting processes and policies. Ensuring compliance with all applicable accounting standards. Reviewing scope and emphasis as regards the work of both the internal and external auditor. The selection, evaluation and compensation of the external auditors. Ensuring that the company s internal audit function is effective and sufficiently independent of management. Ensuring that the Group s accounting policies are suitable and are consistently and completely applied in the preparation of all financial reports. Ensuring the Group s enterprise risk management structures are proactive and operate effectively at all levels of the Group on a continuous basis. Ensuring the Group has a formal risk management policy that is reviewed and evaluated annually. Ensuring formal procedures and contingencies are in place to ensure business recovery and continuity in the event of fundamental disruption and dislocation. Ensuring the Group s total risk profile is capable of systematic measurement as a basis for determining the Group s overall risk appetite. Ensuring a risk management based culture is developed and is continuously enforced by management. Reviewing risk registers on a quarterly basis for all major systems and processes. Nominations and remuneration committee The committee is established to assist the board in discharging its responsibilities relating to board nominations, composition and performance appraisal and in particular all high level establishment issues relating to senior level executive staff. This committee is responsible for: Ensuring that formal procedures exist to properly identify and assess all new board nominations and senior executive staff appointments. Reviewing the composition of all Group boards and committees. Conducting annual appraisals and performance reviews of the boards and all their committees and members thereof. Ensuring that there are formalized procedures for the proper induction of all new directors and staff. Establishing remuneration and rewardbased incentive schemes for executive director and executive management. Approving executive director and executive committee selection, appraisal and compensation. 81
82 3.4 Governance report (Continued) Ensuring that the Group s employee appraisal procedures are properly formalized and are effective as a basis for all internal promotions and salary awards. Ensuring that the Group s personnel policies and board procedures are comprehensive and are properly formalized. Rewarding the results of the annual employee appraisal exercise. Finance and investment committee The committee is established to assist the board in fulfilling its financial oversight responsibilities with specific references to corporate finance, resource and asset utilization, investment portfolio performance, capital structure, cash management, equity and debt financing, capital expenditure, financial planning and reporting and the overall financial performance on the Group. This committee is responsible for: Approval of all significant investments and divestures. Approval of the Group s annual financial budget and monitoring the Group s financial performance against such annual budget. Approval of the Group s annual capital expenditure budget Evaluating all major capital expenditure and business acquisition proposals from management and monitoring actual expenditure against such proposals and/or approved budgets Effectiveness Evaluation The board has established an ongoing evaluation and development process. The process focuses on roles and responsibilities, culture, balance of skills and experience, diversity and how the board works together. In particular, it focuses on how effective the directors are in assisting the executive team in the achievement of the overall strategy. At the end of, the board embarked on a comprehensive board development programme. This included a rigorous assessment of performance, agreement on the board and committee charters, aspirations for itself and identification of steps required to achieve its objectives. In 2015, the board has embarked on evaluating how well it performed in collectively as a board and for each individual director. The process will also involve evaluating the performance of the board committees in executing their mandates. At the end of the process further feedback will be given and a programme for future development agreed and a further health check review will be undertaken annually. Board tenure All directors are required by the company s articles of association to be elected by shareholders at the first AGM following their appointment by the board. Subsequently, all directors are subject to annual reelection by shareholders as per the rotation rules in the articles of association. Succession planning The board has agreed a succession planning framework to ensure that; board tenure is appropriate and encourages fresh thinking and new ideas; the board is sufficiently diverse but most importantly has the appropriate mix of generalist and specialist skills; and; nonexecutive directors have the appropriate level of independence, from the executive and each other Diversity It is the board s policy to retain a strong but relatively small board bringing a balance of indepth commercial and technical experience. Although the size of the board remains small, it is our intention to increase the gender diversity of board membership as opportunities arise. Induction The company has a policy and programme for induction and continuing professional development of directors. On appointment, each director takes part in a comprehensive induction programme where they: receive information about the Group in the form of presentations by executives from all parts of the business and on the regulatory environment; meet representatives of the company s key advisers; receive information about the role of the board and the matters reserved for its decision, the terms of reference and membership of board committees and the powers delegated to those committees; receive information about the company s corporate governance practices and procedures and the latest financial information about the Group; and; are advised of their legal and other duties and obligations as a director of a listed company. This is supplemented by visits to key locations, including the factory, our Yana Tyre Centres and meetings with major shareholders where appropriate. 82
83 3.4 Governance report (Continued) Additional specific induction programmes are in place when nonexecutive directors join committees. Continuing professional development During their period in office, the directors are continually updated on the Group s businesses and the competitive and regulatory environments in which they operate. This is done through: updates and papers which cover changes affecting the Group and the markets in which we operate; meetings with senior executives regular updates on changes to the legal and governance requirements of the Group and in relation to their own position as directors. Presentation are also given at board and committee meetings on business matters and technical update sessions from external advisers where appropriate. stakeholders as it helps to build a greater understanding of investors views, opinions and concerns. Our executive team meet with institutional investors throughout the year to keep them updated on the company s performance when such information is sought. These range from onetoone meetings to group presentations including the full year and interim results and the AGM. Specifically, following the full year and interim results, meetings are held with representatives of our largest shareholder. The company has made available an investor relations web page where it communicates with its shareholders on major happenings including interim and annual financial results. As part of their professional development, executive directors may accept external appointments as nonexecutive directors of other companies and retain any related fees paid to them. Conflicts of interest The board has delegated the authorisation of conflicts to the nomination and remuneration committee and has adopted a specific Conflict of Interest policy. The board has considered in detail the current external appointments of the directors which may give rise to a situational conflict and has authorised potential conflicts where appropriate. This authorisation can be reviewed at any time but will always be subject to annual review. The board is confident that these procedures operate effectively. Insurance and indemnities The company maintains liability insurance for its directors and officers which is renewed on an annual basis. The company has also entered into deeds of indemnity with its directors Our Shareholders Relations with shareholders The board attaches a high priority to effective communication with shareholders and has regular and open dialogue with our institutional investors. The board believes that continued engagement with our shareholders is beneficial to both the company and its 83
84 3.4 Governance report (Continued) Principal shareholders and share distribution Principal shareholders The ten largest shareholdings in the company and the respective number of shares held at 31 December are as follows: No. Name Number of Shares % 1 Sameer Investments Limited 200,817, % 2 Patrick Njogu Kariuki 5,561, % 3 BNP Paribas (Suisse) SA 4,417, % 4 Kenyalogy.com 2,753, % 5 Swani Coffee Estate Limited 1,767, % 6 CFC Stanbic Nominees A/C NR ,500, % 7 Ameerali Abdulrasul Somji 1,286, % 8 Kamlesh Raichand Shah 1,106, % 9 Craysell Investments Limited 1,093, % 10 Minaxshri Shah and Sureshchandra Raichand Shah 1,071, % Distribution of shareholders Share range Number Number of of shareholders shares % ,800 2,192, % 501 5,000 5,229 8,324, % 5,001 10, ,618, % 10, , ,160, % 100,001 1,000, ,668, % Over 1,000, ,376, % Total 14, ,342, % Annual General Meeting (AGM) The annual general meeting (AGM) will be held on 29 May 2015 (further details can be found on page 166 ). The notice of meeting sets out the resolutions being proposed. The notice, together with any related documents, is made available to shareholders on our website. In, all resolutions were passed unanimously by acclamation. In the meeting was attended by 660 shareholders, either in person or by proxy. At each AGM, the Chairman and Chief Executive will review the Group s current trading performance which is followed by a question and answer session. Separate resolutions are proposed on each substantially separate issue and all resolutions are taken by acclamation or on a poll, if there is no unanimous agreement. Shareholders who are not able to attend the meeting can send and vote through a proxy. The form of proxy is available on page 171. Save in exceptional circumstances, all members of the board will attend the AGM. 84
85 3.5 Audit, risk and corporate governance committee report In this report... The purpose of this report is to highlight areas that the committee has reviewed during the year, reporting back to shareholders the significant financial reporting issues and judgements made in connection with the preparation of the company s financial statements. The report also notes any areas or specific topics, such as risk, that the committee has reviewed. Also highlighted is how the committee has assisted the board in reviewing the company s internal control environment and what the committee has done to review the effectiveness of both internal and external auditors. This year the report addresses the implementation of the Enterprise Risk Management methodology and reviews the proposed changes in the CMA Code of Corporate Governance Practices for Public Listed Companies in Kenya. We seek not just to respond to changes but to support and challenge management to develop controls as they anticipate future opportunities and risk. Dear Shareholder, On the following pages we set out the audit, risk and corporate governance committee s report for. The report comprises four sections: How the committee works Roles, responsibilities and processes What we focused on in Internal controls Our auditors Strong and effective risk management and control procedures underpin our ability to execute and implement our strategy. The principal aims of the committee are to support the maintenance and continuing development of a strong control environment across Sameer Africa and to ensure the integrity of the financial information provided to our shareholders. In reporting to you, we have sought to respond to shareholders changing requirements and expectations of audit committees. This is no doubt the start of improved communication between audit committees and shareholders and we welcome feedback. Stephen M. Githiga Chairman, audit, risk and corporate governance committee 25 March 2015 We seek not just to respond to changes but to support and challenge management to develop controls as they anticipate future opportunities and risks. As requested by the board, the committee has considered the processes and controls in place to ensure that the integrated annual report presents a fair, balanced and understandable view of the business. As a result of this work, the committee concluded that the processes and controls were appropriate and was able to provide positive assurance to the board. Who is on the committee? The committee is composed entirely of nonexecutive directors. The current members are: Stephen M. Githiga (Chairman) and Sameer N. Merali. The Managing Director, General Manager, Finance & Strategy and the Head of Risk and Audit attend all meetings by invitation. The Company Secretary takes the minutes and plans committee meetings. 85
86 3.5 Audit, risk and corporate governance committee report (Continued) How the committee works The audit, risk and corporate governance committee forms an integral part of Sameer Africa s governance framework with oversight of the Group s financial reporting, internal and external audit, risk management, governance and regulatory compliance. The committee members have between them a wide range of business and financial experience which enables them to fulfil their terms of reference in a robust and independent manner. The Managing Director, General Manager, Finance & Strategy and Head of Risk and Audit and external auditors attended meetings during the course of the year at the invitation of the Chairman of the committee. The committee as a whole has regular private sessions with both internal and external auditors and also, when appropriate, with the managing director and general manager, finance & strategy. The committee works to a structured programme of activities with agenda items focused to coincide with key events of the annual financial reporting cycle, themes or areas of risk that the committee has identified, together with standing items that the committee is required to consider regularly under its terms of reference. Reports are provided by management, internal audit and external audit, addressing the key risks and reporting matters faced by the Group. Following each meeting the committee communicates its main discussion points and findings to the board. In reviewing the various topics on its agenda the committee members receive input from management, internal audit and external audit as appropriate. Committee members draw upon this and their own experience to provide a constructive challenge to the judgements made by management and consider alternative scenarios or accounting treatments in reaching their conclusions Committee s roles, responsibilities and processes The committee has oversight over the functions detailed below and is responsible for reporting its findings and any recommendations to the board. Financial reporting The committee reviews the yearend and interim financial statements to ensure they give a fair, balanced and understandable view of the business and comply with required accounting standards and regulations, with particular focus on: Key accounting policies and judgements; Going concern statement; Integrated annual report sections on risk management and the audit, risk and governance committee report; Changes to financial reporting standards and regulations; and Effectiveness of the financial controls framework. Risk management, internal controls and compliance (i) The committee reviews the effectiveness of: the Group risk management framework including policies and processes for the identification, assessment and management of risk; internal controls; the Group s regulatory reporting activities and compliance function. (ii) Approval of the annual internal audit plan and internal audit activities; (iii) The effectiveness of the internal audit function (iv) All significant internal audit recommendations and findings and management s response to, and progress in, addressing them. External audit (i) Recommending the appointment of, and determining the remuneration of the external auditors, including reviewing their effectiveness and independence (ii) Review of the findings of the audit and the auditors management letter and ensuring appropriate action is taken where required. (iii) Approval and monitoring of the policies relating to the provision of nonaudit services by the external auditors What we focused on in In planning its own agenda and reviewing the audit plan of the internal auditor, the committee takes account of significant issues and risks, both operational and financial, likely to impact on the Group s financial statements. Throughout the year the committee continued to be focused on the integrity of the Group s financial reporting, risk management processes and the effectiveness of internal controls. Financial reporting Complex and discrete transactions The committee did not identify any complex or discrete transactions on or off balance sheet transactions made by management during the year. Recurring transactions in the year There are a number of areas where the Group transacts as part of its business which may require the application of judgement by management or have underlying complexity that should be considered on an ongoing basis by the 86
87 3.5 Audit, risk and corporate governance committee report (Continued) committee. Consequently, the topics noted below are regularly reviewed by the committee: Revenue recognition: every year the committee considers management s assessment of the Group s internal controls framework which includes control over revenue. The Group s processes and controls around existing revenue streams, including yearend cut off procedures, have remained consistent and effective during the year. Pension accounting: the Group s inhouse, defined benefit plan is a significant liability on the Group s balance sheet (see note 25) and the value of the scheme will fluctuate due to changes in underlying assumptions. The main assumptions which drive these fluctuations include the forecast discount rates, future salary increments and mortality assumptions. The committee considered the processes management undertook to finalise the assumptions and how these assumptions benchmark against the market. The committee concluded that the process was robust and the resulting calculation appropriately balanced. Impairment losses: During the year, the committee extensively reviewed the overdue position of accounts receivables and evaluated management s assessment for impairment losses arising therefrom. Further, the committee recommended to management to strengthen key controls in respect of the Group s credit evaluation and extension processes. Joint arrangements During the year the Group entered into a joint arrangement with Discount Tyres Limited for the operation and management of the Galleria Yana Tyre Centre. The committee reviewed the disclosures and computations made by management in determining the Groups share of operating results and its share of assets and/ or liabilities. Governance and compliance review The committee documented and presented to the board for ratification, the code of business conduct and ethics for directors and executives. The committee also presented to the board a review of the new CMA Code of Corporate Governance Practices for Listed Companies. The committee highlighted to the board the key areas of nonconformity and identified measures to be implemented to ensure compliance. The committee also developed and presented to the board a directors independence standard. Risk management The committee continued to consider the process for managing risk within the business. During the year, the company completed implementation of a complete Enterprise Risk Management (ERM) program. The committee presented to the board the key strategic risks affecting the Group as well as the top ten risks per each department within the Group. Every year the board and senior management will review and challenge the Group s high impact, low likelihood (HILL) risks and the strategic risks. Each risk is assigned an owner and has a series of mitigating actions identified. For each HILL risk the committee reviewed the Group s current level of exposure and considered the appropriateness of the mitigating actions being taken by management. The committee also considered management s response to each strategic risk, including the level of assurance provided around the risk and how the risk is tracked using key risk indicators. With regard to process risks, the committee reviewed how effective management was in addressing the findings of internal and external audit, as well as the method by which management accepted process risks. The committee was comfortable with the processes in place for risk management, that the internal audit plan for was aligned to the highlighted risks and with those process risks that have been identified and accepted. Information technology The committee receives updates from the Chief Information Officer on key technology risks and noted the good progress made in enhancing the overall IT control environment, increased robustness of the IT infrastructure and the benefits accruing to the business both through reduced costs and enhanced functionality. Key areas which had been identified by both the internal and external audit teams addressed during the year include; Improvement of access controls within the SAP environment; Activation of real time SAP system activity logs; Incident management; Infrastructure upgrade and migration Internal Controls The board has overall responsibility for the Group s systems of internal control and for regularly reviewing the effectiveness of those systems. The committee assists the board in reviewing the Group s systems of internal control. The primary responsibility for the operation of these systems is delegated to management. Such systems can only provide reasonable and not absolute assurance against material misstatement or loss. 87
88 3.5 Audit, risk and corporate governance committee report (Continued) Key control procedures are designed to manage rather than eliminate risk and can be summarised as follows: Strategy and financial reporting Organisational structure and authorisation procedures Risk assessment and management Control environment Reviewing and monitoring the effectiveness of internal controls During the year the committee reviewed audit reports addressing the following areas; Completeness of customer and vendor master data; Sales and delivery procedures with particular emphasis on delivery confirmations; Fixed asset management controls; Stock controls; Stock valuation between production and finished goods warehouse; Review of outstanding receivables and credit evaluation procedures Our auditors Internal auditors The Group has a robust internal audit function headed by the Head of Risk and Audit. The effectiveness of the internal audit function is assessed over the year using a number of measures which include (but are not limited to): an evaluation of each audit assignment completed, using feedback from the part of the business that has been audited; a continuous assessment on the quality of value added recommendations from various assignments; a high level annual review that is completed by obtaining feedback from senior management in each division. At the start of the year the committee considered and approved the internal audit plan, which included audits across the Group as well as assurance over ongoing projects. During the year the committee reviewed findings from these internal audit reports, the actions taken to implement the recommendations made in the reports and the status of progress against previously agreed actions. All internal audit reports are available to the committee as required. External auditors The committee considered and reviewed the external audit fees vis a vis the complexity of the Group s audit environment and recommended the same to the board for approval. The agreed audit fees for the Group and its subsidiaries for the financial year was 5,900 ( 5,730). During the year the committee considered the performance and audit fees of the external auditor and recommended to the board that a resolution for the reappointment of KPMG for a further year as the company s auditor be proposed to shareholders at the AGM to be held in May. The resolution was passed and KPMG was reappointed as the auditors for the year ended 31 December,. Independence, objectivity and fees The committee seeks to ensure the objectivity and independence of our auditors through: focus on the assignment and rotation of key personnel; the adequacy of audit resources and policies in relation to nonaudit work. The appointment by the company of former senior employees of the external auditor would require approval of the committee. The committee regularly monitors the other services being provided to the Group by its external auditor and has developed a formal policy to ensure this does not impair their independence or objectivity. The policy is based on the five key principles which underpin the provision of other services by the external auditor. These are that the auditor may not provide a service which: places them in a position to audit their own work; creates a mutuality of interest; results in the auditor developing close personal relationships with the Group s employees; results in the auditor functioning as a manager or employee places the auditor in the role of advocate for the company. Other than in exceptional circumstances, management and the committee do not expect nonaudit fees to be in excess of fees for audit and audit related services. In, the significant nonaudit engagements related to VAT and corporate tax services, including tax advice. 88
89 3.6 Directors remuneration report In this report... The purpose of this report is to set out for shareholders the principles and policy we apply to remuneration for our directors and senior executives and to update you on how we have applied these for the financial year ended 31 December. The report also aims to demonstrate how our remuneration policy is aligned to our strategy, supports the retention of the executive directors and rewards them for outperformance. Remuneration in reflects the performance of the business in the context of a depressed market environment whilst recognising the significant achievements made by the management team in reshaping the company Dear shareholders, On behalf of the board, I present the Directors remuneration report for the year ended 31 December. Remuneration in reflects the performance of the business in the context of a depressed market environment throughout most of the year, whilst recognising the significant achievements made by the executive team in reshaping the company. This report covers the remuneration governance arrangements and the remuneration outcomes for the Executive Director, NonExecutive Directors and other members of the executive management team, including disclosure requirements which comply with the relevant accounting standards. Link to strategy Our corporate strategy sets out our purpose, values and how we measure our success. In framing how we remunerate our executives we are guided by the measures of success contained therein. They are designed to ensure that executives take a longterm approach to decisionmaking and to minimise activities that focus only on shortterm results at the expense of longerterm business growth and success. The nominations and remuneration committee has considered the ways in which risk management and the longterm horizon are reflected throughout the Group s remuneration arrangements for all executives and is satisfied that our approach reinforces the desired behaviours. Consequently, the committee did not recommend any salary increases for The shortterm annual cash bonus for staff is determined based on assessment of performance against set targets. In recognition of the notable achievements in, the committee recommended to the board the approval of an annual bonus equivalent to 50% of monthly basic pay for the executive management committee and all other staff. The committee did not recommend the payment of a bonus for the financial year. The board reviewed the committee s proposals for a new internal sales force incentive (SFI) scheme aimed at promoting sales growth and market share. The committee also successfully approved the Collective Bargaining Agreement (CBA) with the principal trade union representing the company s unionisable staff, for the years 2015 to Summary This year s remuneration report takes into account the challenging trading environment and reduced financial performance. It also takes cognisance of the long term, turnaround measures the executive has put in place to return the company to growth and profitability. Remuneration outcomes for Executive committee and management salaries were reviewed and an average increment of 10% above levels was awarded. However, due to the difficult trading environment, depressed financial performance and tight liquidity the implementation of the award was deferred until performance improves. This strengthens alignment with shareholders and the future performance of the company. Eng. E. K. Mwongera Chairman, Nominations and Remuneration Committee 25 March
90 3.6 Directors remuneration report (Continued) How the committee works Who is on the committee? The committee is comprised of the following directors; Eng. E. K. Mwongera (Chairman) Mr. P. M. Gitonga (Non Executive Director) Mr. A. Walmsley (Managing Director) What is our role? The role of the committee is primarily to: review the ongoing appropriateness, relevance and effectiveness of the Group remuneration policy including in relation to retention and development; approve the remuneration policy and strategy for the executive director, executive management committee and other senior executives; approve the design of the company s annual bonus arrangements, including the performance targets that should apply; and determine any award levels for the executive management committee and other senior executives based on performance against annual bonus targets. Principles considered when setting remuneration The company operates in a particularly competitive trading environment. We aim to balance the need to attract and retain high quality talent essential to the company s success with the need to be costeffective and to reward exceptional performance. The committee has developed a remuneration policy for the company which balances these factors, while taking into account prevailing best practice and a fair outcome for investors. The company s bonus and the sales force incentive (SFI) schemes are tied to the achievement of challenging performance targets which align remuneration with our strategy to deliver strong business performance and create shareholder value. Individuals should be rewarded for success and performance measured over clear timescales. The remuneration package is focused on rewarding sustained, longterm performance and aligning executives with the shareholder experience What we did in? In addition to the remuneration review described in the Chairman s letter, during our work was broadly in three areas: Setting targets setting the business targets and executives balanced scorecards for, which were also aligned with the business plan for the year; carrying out periodic reviews of actual performance against targets during the year. Reviewing outcomes reviewed the annual bonus outcomes and award levels for and indicative outcomes ahead of recommendations for final approval in 2015; approved the agreed CBA with the registered trade union for years 2015 and 2016 Reward framework agreed the base salaries for the executive committee with effect from 1 January using the same process as applied to the wider employee population; agreed the remuneration packages for new appointments to the executive committee. The committee reports regularly to the board on its work. An annual review of the performance of the committee is due in early Feedback will be sought from the Chief Executive, Head of Human Resources and other board members Remuneration Policy Executive Directors remuneration policy Aligning the interests of the executive directors with those of shareholders and with the Group s strategic goals is central to Sameer Africa s remuneration policy. In line with shareholders interests being managed within a robust governance framework, the company aims to retain and incentivise high calibre executive directors by paying competitive base salary and benefits, together with a shortterm annual bonuses and terminal benefits linked to: Profits and contribution; The achievement of individual objectives, which are consistent with the strategy of the company and building sustainable profitability; The achievement of longterm strategic KPIs in line with the longterm focus of the company; The creation of longterm shareholder value; Ongoing oversight of a robust risk management framework; Maintenance of strong capital and liquidity positions; and Addition of senior talent, building succession for leadership and setting a strong governance structure for the board s delegated authorities. 90
91 3.6 Directors remuneration report The table below summarises the main elements of the remuneration packages for the executive director. Function Purpose & link to strategy Operation Performance metrics Basic Salary Reflects the individual s skills, responsibilities and experience. Supports the recruitment and retention of executive directors of the calibre required to deliver the business strategy within the competitive market environment the company operates. Reviewed annually and paid monthly in cash. Consideration is typically given to a range of factors when determining salary levels, including: Personal and companywide performance. Typical pay levels in relevant markets for each executive whilst recognising the need for an appropriate premium to attract and retain superior talent, balanced against the need to provide a costeffective overall remuneration package. The wider employee pay review. Basic salary is subject to tax and other statutory deductions such as NSSF and NHIF Continued good performance. Overall individual and business performance is considered when setting and reviewing salaries. Housing Allowance Allowances paid monthly to cater for executive housing. Determined on the basis of housing rates for executives of comparable entities. Paid monthly in cash and is subjected to tax under the PAYE system None Provision for an income in retirement To provide competitive postretirement benefits or cash allowance as a framework to save for retirement. Supports the recruitment and retention of executive directors of the calibre required to deliver the business strategy. Executives can choose to participate in the Sameer Africa defined contribution scheme or receive a gratuity allowance. Contributions are set as a percentage of base salary. Postretirement benefits do not form part of the base salary for the purposes of determining incentives. Contract gratuity is payable at the end of the contract period and is subject to tax under the PAYE system. None. The maximum contributions for gratuity allowances for the executive directors are 25% of base salary. Benefits To provide noncash benefits which are competitive in the market in which the executive is employed. Ensures the overall package is competitive and provides financial protection for executives and their families. The company provides a range of market competitive benefits including leave passages, private medical insurance and other life insurance benefits. Additional benefits include company car, education support and club membership subscriptions. Other adhoc benefits such as relocation can be offered, depending on personal circumstances. Non cash benefits are taxable in accordance with the Income Tax Act. None 91
92 3.6 Directors remuneration report (Continued) Function Purpose & link to strategy Operation Performance metrics Performance bonus Incentivises executives and senior management to achieve key strategic outcomes on an annual basis. Focus on key financial metrics and objectives to deliver the business strategy. Measures and targets are set annually based on business plans at the start of the financial year and payout levels are determined by the committee following the yearend based on performance against objectives. Paid once per annum. The committee has the discretion to amend the bonus payout should any formulaic assessment of performance not reflect a balanced view of overall business performance for the year. The bonus is based on the remuneration committee s assessment of executive directors performance over the financial year against objectives, which cover: 1. Strategy, structure and people 2. P&L performance and sales 3. Financial health 4. Risk, compliance and reputation Performance measures selection and approach to targetsetting Annual objectives are set according to immediate priorities identified by the board and management and are reviewed and adjusted annually to reflect changing priorities. The annual bonus is assessed against both financial and individual targets determined by the committee. This enables the committee to reward both annual financial performance delivered for shareholders and performance against specific financial, operational or strategic objectives set for each executive, which are closely linked to the strategic priorities of the business. The committee sets targets for longterm incentive plans taking into account external forecasts, internal budgets and business priorities. Targets are set to be appropriately stretching in this context with maximum performance being set at a level which is considered to be the delivery of exceptional performance. When considering performance outcomes, the committee will look beyond formulaic results to ensure the outcomes align with the overall business performance. The longterm incentive measures are in line with the longterm strategic focus of the company and are reviewed as part of the annual board strategic review. NonExecutive Directors remuneration policy Nonexecutive directors have formal letters of appointment. These do not contain any notice provisions or provision for compensation in the event of early termination. Nonexecutive directors are encouraged to build a shareholding in the company. The table below summarises the main elements of remuneration for nonexecutive directors: Function Purpose & link to strategy Operation Performance metrics Fees 92 To attract and retain nonexecutive directors of the highest calibre and experience relevant to Sameer Africa. Directors fees are fixed and payable monthly in arrears. The committee determines the directors fees at a level that is considered to be appropriate, taking into account the size and complexity of the business and the expected time commitment and contribution of the role. Fees are reviewed annually by the board at the yearend taking into account market benchmarks for nonexecutives of companies of similar size and complexity with consideration of sector relevance. The chairman s remuneration is recommended by the remuneration committee and approved by the board. Director s fees are subject to tax under the PAYE regulations. None
93 3.6 Directors remuneration report (Continued) Function Purpose & link to strategy Operation Performance metrics Sitting allowances To encourage directors full participation in board and committee meetings. Sitting allowances are paid on the basis of actual meetings attended by each director. None Benefits Non executive directors are currently not entitled to any other benefits N/A None Service contracts and loss of office The Executive Director has a renewable two (2) year service contract that provides for 3 months notice on either side. There are no special provisions that apply in the event of a change of control. A payment in lieu of notice, including base salary, allowances and contractual provision for an income in retirement is provided for and payable if: either party terminates the employment of the executive with or without due notice; or termination is agreed by mutual consent. The company may also make a payment in respect of outplacement costs where appropriate. The table below shows the current service contracts and exit payment obligations of the executive director Mr. Allan Walmsley. Element Contracts period Notice period (by either Company or director) Contractual entitlement annual bonus. Provisions for contract termination Termination due to incapacitation or ill health Condition 2 years contract from 1st August 2012 Renewed for a further 2 years from 1st August to 31st July months None Under the contract terms, either party can opt to terminate contract gratuity earned including the notice period immediately by making a payment in lieu of the notice period or part thereof. Full payment for the first 30 days of absence including accrued gratuity. Thereafter the remuneration committee may issue a notice to discontinue any further payments To protect the Group s business interests, the executive director s service contract contains covenants which restrict his ability to solicit or deal with clients and his ability to disclose trade secrets and confidential information gained during the tenancy of his directorship. When considering exit payments, the committee reviews all outstanding incentive awards and assesses outcomes that are fair to both shareholders and participants. 93
94 3.6 Directors remuneration report (Continued) External appointments With specific approval of the board, executive directors may accept external appointments as nonexecutive directors of other companies and retain any related fees paid to them. Mr. Allan Walmsley is currently a Non Executive Director of First Assurance Company Kenya Limited. The company, whose Managing Director is also the chairman of the audit, risk and corporate governance committee has been treated as a related party and the transactions with the company and outstanding balances disclosed under the relevant note. (See note 32) Annual report on remuneration The following section provides details of how Sameer Africa s remuneration policy was implemented during the financial year ended 31 December. Committee membership in The committee is comprised of the Chairman, the Managing Director and one nonexecutive director. All committee meetings in were attended by all its members. At the invitation of the committee, the Company Secretary and Head of Human Resources attended selected agenda items requiring their contribution. No individual participated in the discussion or approval of his or her own compensation. The committee follows relevant legal and regulatory requirements including the principles and provisions of the CMA Code of Corporate Governance for Listed Entities and the relevant labour laws. The committee seeks professional services of an externally appointed remuneration advisor as may be necessary. Key activities In the committee s key activities included: Reviewed the revised remuneration reporting structure and approved the directors remuneration report. Continued working closely with the audit, risk and corporate governance committee in reviewing current and future risks around setting remuneration. Reviewed the committee s terms of reference in the light of the evolving CMA governance guidelines. The committee held three (3) meetings during the year. In these meetings the committee monitored and implemented regulatory and best practice updates. Advisers The committee invites independent consultants to provide advice on specific remuneration issues. In, the board engaged the services of BPC Africa consultants to carry out a salary and benefits alignment review. The objectives of the review included; Study of the results of the Hay Remuneration Survey previously done by the Hay Group; Discuss and agree the panel companies required for comparison and alignment; Obtain specific salary and benefits information from the remuneration survey; Identify the benchmark jobs in every salary grading range for comparison purposes; Obtain the detailed total salary and make up for all the benchmark jobs for Sameer Africa and compare with those of the Hay remuneration results; Analyse, discuss and agree the reward policy and guidelines in terms of the percentile where to pitch and reward principles; Analyse and agree the bonus or variable pay incentive scheme; both the functionality and application; Draw up a new salaries and benefits design with inbuilt talent principles; As a follow up to the review done by the advisers, the committee continued to implement key recommendations which included; Making technical adjustments to the base pay and benefits in a number of areas which were evaluated as below the agreed percentile; Internal equity and alignment of the individual benefits to the approved benefits per grade; Development of salary policy guidelines; Variable pay objectives and bonus payment guidelines; Remuneration for Executive Director and Executive Committee The table below sets out the total remuneration received by the executive director and members of the executive management committee for the year ended 31 December and the prior year. 94
95 3.6 Directors remuneration report (Continued) Mr. Allan Walmsley Basic pay and allowances Non cash benefits Pension / gratuity Bonus pay Executive Committee (ExCo) Basic pay and allowances Non cash benefits Pension / gratuity Bonus pay 20, ,502 25,986 45, ,635 48,221 20,760 1,482 4, ,494 39, ,151 15,300 57,669 Shortterm annual bonus The committee reviewed the performance of the company for financial year, together with the individual balanced scorecard of the executive director, members of the executive management and other senior executives and approved an overall payment of bonus equivalent to 50% of the monthly basic salary. The distribution of the bonus payment to individual executives depended upon their actual performance against set targets. The payment of bonus is anchored on the overall corporate financial performance and no bonus is paid when the company registers a loss irrespective of mitigating factors and individual performance. Consequently the committee did not recommend the payment of a bonus for the year ended 31 December. Longterm incentives The company does not currently have a share option scheme for its executive directors and members of executive committee. However, management is encouraged to invest in the company s shares through the Nairobi Securities Exchange. Remuneration for NonExecutive Directors The table below sets out the total remuneration received by each nonexecutive director for the year ended 31 December and the prior year. Eng. E. K. Mwongera (chairman) Mr. S. M. Githiga Mr. A. H. Butt Mr. S. N. Merali Mr. P. M. Gitonga Mr. I. A. Timamy Fees 2, Sitting allowances Total 2, Fees 2, Sitting allowances Total 2, , ,860 5, ,747 Directors interests Directors interests in shares of Sameer Africa are as shown below; Peter Gitonga Akif H. Butt Issa A. Timamy (Resigned 1 November ) Sameer N. Merali Akif H. Butt (jointly with another party) 12, N/A 15,000 20,000 12, ,000 20,000 95

96 9.5R R R /80R
97 Contents SECTION 4: FINANCIAL STATEMENTS PAGE Statement of Director s responsibilities 98 Report of the Independent Auditors 99 Consolidated Statement of Profit or Loss and Other Comprehensive Income 100 Company Statement of Profit or Loss and Other Comprehensive Income 101 Consolidated Statement of Financial Position 102 Company Statement of Financial Position 103 Consolidated Statement of Changes in Equity 104 Company Statement of Changes in Equity 105 Consolidated Statement of Cash Flows 106 Company Statement of Cash Flows 107 Notes to the financial statements
98 Statement of Directors responsibilities The Directors are responsible for the preparation and presentation of the consolidated and separate financial statements of Sameer Africa Limited set out on pages 100 to 162 which comprise the consolidated and separate statements of financial position at 31 December, and the consolidated and separate statements of profit or loss and other comprehensive income, statements of changes in equity and the statements of cash flows for the year then ended, and a summary of significant accounting policies and other explanatory information. The Directors responsibilities include: determining that the basis of accounting described in Note 2 is an acceptable basis for preparing and presenting the financial statements in the circumstances, preparation and presentation of financial statements in accordance with International Financial Reporting Standards and in the manner required by the Kenyan Companies Act and for such internal control as the directors determine is necessary to enable the preparation of financial statements that are free from material misstatements, whether due to fraud or error. Under the Kenyan Companies Act the directors are required to prepare financial statements for each financial year which give a true and fair view of the state of affairs of the Group and the Company as at the end of the financial year and of the operating results of the Group for that year. It also requires the Directors to ensure the Group keeps proper accounting records which disclose with reasonable accuracy the financial position of the Group and the Company. The Directors accept responsibility for the annual financial statements, which have been prepared using appropriate accounting policies supported by reasonable and prudent judgments and estimates, in conformity with International Financial Reporting Standards and in the manner required by the Kenyan Companies Act. The Directors are of the opinion that the financial statements give a true and fair view of the state of the financial affairs of the Group and the Company and of the Group s operating results. The Directors further accept responsibility for the maintenance of accounting records which may be relied upon in the preparation of financial statements, as well as adequate systems of internal financial control. The Directors have made an assessment of the Company and its subsidiaries ability to continue as a going concern and have no reason to believe the Group and the Company will not be a going concern for at least the next twelve months from the date of this statement. Approval of the financial statements The financial statements, as indicated above, were approved by the Board of Directors on 25 March 2015 and were signed on its behalf by: Eng. Erastus Kabutu Mwongera FIEK, RCE, CBS Chairman Allan Walmsley Managing Director 98
99 Report of the Independent Auditors to the members of Sameer Africa Limited KPMG Kenya, Certified Public Accountants, 8th Floor, ABC Towers Waiyaki Way PO Box GPO Nairobi, Kenya Telephone Fax Internet The We have audited the consolidated and separate financial statements of Sameer Africa Limited set out on pages 100 to 162 which comprise the consolidated and separate statements of financial position at 31 December, and the consolidated and separate statements of profit or loss and other comprehensive income, statements of changes in equity and the statements of cash flows for the year then ended, and a summary of significant accounting policies and other explanatory information. Directors responsibility for the financial statements As stated on page 98, the Directors are responsible for the preparation and fair presentation of these financial statements in accordance with International Financial Reporting Standards and in the manner required by the Kenyan Companies Act and for such internal control as the Directors determine is necessary to enable the preparation of financial statements that are free from material misstatements, whether due to fraud or error. Auditors responsibility Our responsibility is to express an opinion on these financial statements based on our audit. We conducted our audit in accordance with International Standards on Auditing. Those standards require that we comply with relevant ethical requirements and plan and perform the audit to obtain reasonable assurance whether the financial statements are free from material misstatement. An audit involves performing procedures to obtain audit evidence about the amounts and disclosures in the financial statements. The procedures selected depend on our judgement, including the assessment of the risks of material misstatement of the financial statements, whether due to fraud or error. In making those risk assessments, we consider internal control relevant to the entity s preparation and fair presentation of the financial statements in order to design audit procedures that are appropriate in the circumstances, but not for the purpose of expressing an opinion on the effectiveness of the entity s internal control. An audit also includes evaluating the appropriateness of accounting policies used and the reasonableness of accounting estimates made by management, as well as evaluating the overall presentation of the financial statements. We believe that the audit evidence we have obtained is sufficient and appropriate to provide a basis for our opinion. Opinion In our opinion, these financial statements give a true and fair view of the consolidated and separate financial position of Sameer Africa Limited at 31 December, and the consolidated and separate financial performance and consolidated and separate cash flows for the year then ended in accordance with International Financial Reporting Standards and in a manner required by the Kenyan Companies Act. Report on other legal requirements As required by the Kenyan Companies Act we report to you, based on our audit, that: (i) We have obtained all the information and explanations, which to the best of our knowledge and belief were necessary for the purpose of our audit; (ii) In our opinion, proper books of account have been kept by Company, so far as appears from our examination of those books; and (iii) The statement of financial position and statement of profit or loss and other comprehensive income of the Company are in agreement with the books of account. The Engagement Partner responsible for the audit resulting in this independent auditors report is FCPA Eric Aholi P/ March 2015 KPMG Kenya is the Kenyan partnership and a member fi rm of the KPMG network of independent member fi rms affiliated with KPMG international Cooperative ( KPMG International ), a Swiss entity Partners (British*) EE Aholi PC Appleton* BC D Souza JM Gathecha JL Mwaura RB Ndung u AW Pringle* 99
100 Consolidated Statement of Profit or Loss and Other Comprehensive Income for the year ended 31 December Note Revenue 8 3,777,146 4,029,841 Cost of sales 9 (b) (i) (2,840,635) (2,951,719) Gross profit 936,511 1,078,122 Other operating income 9 (a) 44, ,550 Selling and distribution costs 9 (b) (ii) (336,305) (356,790) Administrative expenses 9 (b) (ii) (469,975) (352,103) Other operating expenses 9 (b) (ii) (200,789) (206,080) Operating (loss)/profit (25,624) 460,699 Finance income 10 41,516 37,305 Finance costs 10 (85,053) (42,426) Share of (loss)/profit of equity accounted investees (net of income tax) 18 (296) 943 (Loss)/profit before income tax (69,457) 456,521 Income tax credit / (expense) 11 (a) 2,528 (55,332) (Loss)/profit for the year (66,929) 401,189 Other comprehensive income (net of tax) (a) Items that will never be reclassified to profit or loss Actuarial losses on remeasurement of defined benefit liability 25 (c) (7,496) (11,228) Related tax at 30% 11 (b) 2,249 3,368 (5,247) (7,860) (b) Items that are or may be reclassified to profit or loss Foreign currency translation differences for foreign operations (page 10) 12,510 29,147 Total other comprehensive income for the year 7,263 21,287 Total comprehensive income for the year (59,666) 422,476 Earnings per share: Basic and diluted (Kshs) 12 ( 0.24) 1.44 The notes set out on pages 108 to 162 form an integral part of these financial statements. 100
101 Company Statement of Profit or Loss and Other Comprehensive Income for the year ended 31 December Note Revenue 8 3,281,226 3,502,301 Cost of sales 9 (b) (i) (2,706,110) (2,809,138) Gross profit 575, ,163 Other operating income 9 (a) 37, ,398 Selling and distribution costs 9 (b) (ii) (202,469) (246,261) Administrative expenses 9 (b) (ii) (337,725) (261,252) Other operating expenses 9 (b) (ii) (140,719) (127,870) Operating (loss)/profit (68,271) 334,178 Finance income 10 28, ,443 Finance costs 10 (67,453) (39,324) (Loss)/profit before income tax (106,961) 534,297 Income tax credit/ (expense) 11 (a) 21,644 (26,052) (Loss)/profit for the year (85,317) 508,245 Other comprehensive income (net of tax) Items that will never be reclassified to profit or loss Actuarial losses on remeasurement of defined benefit liability 25 (c) (7,496) (11,228) Related tax at 30% 11 (b) 2,249 3,368 Total other comprehensive income for the year (5,247) (7,860) Total comprehensive income for the year (90,564) 500,385 The notes set out on pages 108 to 162 form an integral part of these financial statements. 101
102 Consolidated Statement of Financial Position as at 31 December ASSETS Noncurrent assets Property, plant and equipment , ,967 Intangibles 14 47,115 61,695 Investment property 15 (a) 180, ,197 Prepaid operating lease rentals Equity accounted investees , ,073 Deferred income tax ,878 52,660 Total noncurrent assets 985, ,956 Current assets Inventories 19 1,512,888 1,268,150 Receivables and prepayments , ,377 Current income tax 11 (d) 56,103 75,171 Cash and bank balances , ,833 Total current assets 2,872,111 2,822,531 TOTAL ASSETS 3,857,392 3,668,487 EQUITY (page 104) Share capital 22 (a) 1,391,712 1,391,712 Retained earnings 1,252,707 1,324,883 Translation reserve (107,975) (120,485) Proposed dividends 22 (c) 83,503 Total equity 2,536,444 2,679,613 LIABILITIES Noncurrent liabilities Borrowings Deferred income tax 24 4,609 3,341 Retirement benefit obligations , ,830 Total noncurrent liabilities 182, ,313 Current liabilities Payables and accrued expenses , ,933 Current income tax 11 (d) Borrowings , ,236 Unclaimed dividends 27 6,776 Total current liabilities 1,137, ,561 Total liabilities 1,320, ,874 TOTAL EQUITY AND LIABILITIES 3,857,392 3,668,487 The financial statements on pages 100 to 162 were approved by the Board of Directors on 25 March 2015 and were signed on its behalf by: Note Eng. Erastus Kabutu Mwongera FIEK, RCE, CBS Chairman The notes set out on pages 108 to 162 form an integral part of these financial statements. Allan Walmsley Managing Director 102
103 Company Statement of Financial Position as at 31 December Note ASSETS Noncurrent assets Property, plant and equipment , ,367 Intangibles 14 46,777 61,695 Investment property 15 (a) 101, ,424 Prepaid operating lease rentals Investment in subsidiaries , ,414 Equity accounted investee , ,026 Deferred income tax 24 69,533 30,135 Total noncurrent assets 874, ,425 Current assets Inventories 19 1,238,627 1,059,011 Receivables and prepayments , ,916 Current income tax 11 (d) 21,869 35,052 Cash and bank balances , ,396 Total current assets 2,446,182 2,320,375 TOTAL ASSETS 3,321,007 3,136,800 EQUITY (page 105) Share capital 22 (a) 1,391,712 1,391,712 Retained earnings 539, ,392 Proposed dividends 22 (c) 83,503 Total equity 1,931,540 2,105,607 LIABILITIES Noncurrent liabilities Retirement benefit obligations , ,830 Total noncurrent liabilities 178, ,830 Current liabilities Payables and accrued expenses , ,049 Borrowings , ,538 Unclaimed dividends 27 6,776 Total current liabilities 1,211, ,363 Total liabilities 1,389,467 1,031,193 TOTAL EQUITY AND LIABILITIES 3,321,007 3,136,800 The financial statements on pages 100 to 162 were approved by the Board of Directors on 25 March, 2015 and were signed on its behalf by: Eng. Erastus Kabutu Mwongera FIEK, RCE, CBS Chairman The notes set out on pages 108 to 162 form an integral part of these financial statements. Allan Walmsley Managing Director 103
104 Consolidated Statement of Changes in Equity for the year ended 31 December Share capital Retained earnings Translation reserve Proposed dividends Total : At start of year Comprehensive income for the year Loss for the year Other comprehensive income Net actuarial losses on remeasurement of defined benefits obligation Foreign currency translation differences on foreign operations 1,391,712 1,324,883 (66,929) (5,247) (120,485) 12,510 83,503 2,679,613 (66,929) (5,247) 12,510 Total comprehensive income (72,176) 12,510 (59,666) Transactions with owners recorded Dividends paid (Note 22(c)) (83,503) (83,503) Total transactions with owners (83,503) (83,503) At end of year 1,391,712 1,252,707 (107,975) 2,536,444 : At start of year Comprehensive income for the year Profit for the year Other comprehensive income Net actuarial losses on remeasurement of defined benefits obligation Foreign currency translation differences on foreign operations 1,391,712 1,015, ,189 (7,860) (149,632) 29,147 69,586 2,326, ,189 (7,860) 29,147 Total comprehensive income Transactions with owners recorded 393,329 29, ,476 Dividends paid (Note 22(c)) Proposed dividends (Note 22(c)) (83,503) (69,586) 83,503 (69,586) Total transactions with owners (83,503) 13,917 (69,586) At end of year 1,391,712 1,324,883 (120,485) 83,503 2,679,613 The notes set out on pages 108 to 162 form an integral part of these financial statements. 104
105 Company Statement of Changes in Equity for the year ended 31 December Share capital Retained earnings Proposed dividends Total : At start of year Comprehensive income for the year Loss for the year 1,391, ,392 (85,317) 83,503 2,105,607 (85,317) Other comprehensive income Net actuarial losses on remeasurement of defined benefits obligation (5,247) (5,247) Total comprehensive income (90,564) (90,564) Transactions with owners recorded Dividends paid (Note 22(c)) (83,503) (83,503) Total transactions with owners (83,503) (83,503) At end of year 1,391, ,828 1,931,540 : At start of year 1,391, ,510 69,586 1,674,808 Comprehensive income for the year Profit for the year 508, ,245 Other comprehensive income Net actuarial losses on remeasurement of defined benefits obligation (7,860) (7,860) Total comprehensive income 500, ,385 Transactions with owners recorded Dividends paid (Note 22(c)) Proposed dividends (Note 22(c)) (83,503) (69,586) 83,503 (69,586) Total transactions with owners (83,503) 13,917 (69,586) At end of year 1,391, ,392 83,503 2,105,607 The notes set out on pages 108 to 162 form an integral part of these financial statements. 105
106 Consolidated Statement of Cash Flows for the year ended 31 December Note Cash flows from operating activities Cash receipts from customers 28 3,884,543 4,369,645 Cash payments for purchases 28 (2,781,571) (3,101,585) Cash payments for expenses 28 (869,040) (1,034,410) Cash generated from operating activities 233, ,650 Interest paid 10 (52,558) (29,486) Income tax paid 11 (d) (33,201) (121,044) Net cash generated from operating activities 148,173 83,120 Investing activities Interest received 10 9,578 7,926 Purchase of property, plant and equipment 13 (a) (219,285) (161,780) Purchase of intangible assets 14 (6,943) (28,007) Additions to investment property 15 (5,466) Proceeds from disposal of property, plant and equipment 3,002 3,670 Proceeds from disposal of leasehold land 255,300 Net cash (used in)/generated from investing activities (219,114) 77,109 Financing activities Dividends paid 22 (c) (83,503) (69,586) Surrender of unclaimed assets (6,776) Repayment of borrowings (1,690) (1,351) Net cash absorbed by financing activities (91,969) (70,937) (Decrease)/increase in cash and cash equivalents (162,910) 89,292 Movement in cash and cash equivalents: At start of year (86,705) (178,701) (Decrease)/increase in cash and cash equivalents (162,910) 89,292 Effect of movements in exchange rates on cash held 123 2,704 At end of year 21 (249,492) (86,705) The notes set out on pages 108 to 162 form an integral part of these financial statements. 106
107 Company Statement of Cash Flows for the year ended 31 December Note Cash flows from operating activities Cash receipts from customers 28 3,255,595 3,666,650 Cash payments for purchases 28 (2,632,548) (2,883,134) Cash payments for expenses 28 (494,493) (913,897) Cash generated from /(used in) operating activities 128,554 (130,381) Interest paid 10 (52,155) (29,134) Income tax paid 11 (d) (2,322) (60,013) Net cash generated from /(used in) operating activities 74,077 (219,528) Investing activities Interest received 10 8,487 7,790 Dividends received ,000 Purchase of property, plant and equipment 13 (b) (136,021) (84,207) Purchase of intangible assets 14 (6,595) (28,007) Acquisition of subsidiary 17 (1,728) Proceeds from disposal of property, plant and equipment 2,998 4,125 Proceeds from disposal of leasehold land 255,300 Net cash (used in) / generated from investing activities (131,131) 373,273 Financing activities Dividends paid 22 (c) (83,503) (69,586) Surrender of unclaimed assets (6,776) Net cash absorbed by financing activities (90,279) (69,586) (Decrease)/increase in cash and cash equivalents (147,333) 84,159 Movement in cash and cash equivalents: At start of year (231,142) (312,464) (Decrease)/increase in cash and cash equivalents (147,333) 84,159 Effect of movements in exchange rates on cash held 1,034 (2,837) At end of year 21 (377,441) (231,142) The notes set out on pages 108 to 162 form an integral part of these financial statements. 107
108 Notes to the financial statements 1. Reporting Entity Sameer Africa Limited is a limited liability company incorporated in Kenya under the Kenyan Companies Act, and is domiciled in Kenya. The consolidated financial statements of the company for the year ended 31 December comprise the company, its subsidiaries, and associates (together referred to as the Group ). The Group primarily is involved in the manufacture, importation and sale of tyres, tubes and flaps and letting of investment properties. The address of its registered office is as follows: LR No /9 Mombasa Road PO Box Nairobi The company s shares are listed on the Nairobi Securities Exchange. The company s parent company is Sameer Investments Limited, a company incorporated in Kenya and which holds 72.15% of the company s equity interest. For Kenyan Companies Act reporting purposes, the balance sheet is represented in these financial statements by the statement of financial position and the profit and loss account by the statement of profit or loss and other comprehensive income. 2. Basis Of Preparation (a) Statement of compliance The consolidated and company financial statements (financial statements) are prepared in accordance with and comply with International Financial Reporting Standards (IFRS). (b) Basis of measurement The financial statements have been prepared on the historical cost basis except where mentioned. (c) Functional and presentation currency Items included in the financial statements of each of the Group s entities are measured using the currency of the primary economic environment in which the entity operates ( the functional currency ). The consolidated financial statements are presented in Kenya shillings (Kshs), which is the Group s functional and presentation currency. All financial information presented in Kenya shillings (Kshs) has been rounded to the nearest thousand, except where otherwise indicated. (d) Use of estimates and judgment In preparing these consolidated financial statements, management has made judgements, estimates and assumptions that affect the application of the Group s accounting policies and the reported amounts of assets, liabilities, income and expenses. Actual results may differ from these estimates. Estimates and underlying assumptions are reviewed on an ongoing basis. Revisions to estimates are recognised prospectively. In particular, information about significant areas of estimation and critical judgments in applying accounting policies that have the most significant effect on the amounts recognised in the financial statements are described in Note Significant Accounting Policies Except for changes noted in Note 4, the Group has consistently applied the following accounting policies to all periods presented in these financial statements. References to the Group s accounting policies apply equally to the company unless otherwise specified. (a) Basis of consolidation (i) Subsidiaries Subsidiaries are investees controlled by the Group. The Group controls an investee when it is exposed to, or has rights to, variable returns from its involvement in the investee and has the ability to affect those returns through its power over the investee. The financial statements of subsidiaries are included in the consolidated financial statements from the date that control commences until the date that control ceases. Intercompany transactions, balances and unrealised gains on transactions between group companies are eliminated in preparing the consolidated financial statements. Unrealised losses are also eliminated unless the transaction provides evidence of an impairment of the transferred. Investments in subsidiaries are accounted for at cost less impairment in the separate financial statements. Accounting policies of subsidiaries have been changed where necessary to ensure consistency with the policies adopted by the Group. 108
109 Notes to the financial statements for the year ended 31 December (continued) 3. Significant Accounting Policies (Continued) (a) Basis of consolidation (continued) (ii) Changes in ownership interests in subsidiaries without change of control Transactions with noncontrolling interests that do not result in loss of control are accounted for as equity transactions that is, as transactions with the owners in their capacity as owners. The difference between fair value of any consideration paid and the relevant share acquired of the carrying value of net assets of the subsidiary is recorded in equity. Gains or losses on disposals to noncontrolling interests are also recorded in equity. (iii) Loss of control When the Group ceases to have control, any retained interest in the entity is remeasured to its fair value at the date when control is lost, with the change in carrying amount recognised in profit or loss. The fair value is the initial carrying amount for the purposes of subsequently accounting for the retained interest as an associate, joint venture or financial asset. In addition, any amounts previously recognised in other comprehensive income in respect of that entity are accounted for as if the Group had directly disposed of the related assets or liabilities. This may mean that amounts previously recognised in other comprehensive income are reclassified to profit or loss. (iv) Interests in equity accounted investees The Group s interest in equity accounted investees, comprise its interest in an associate and a joint venture. Associates are those entities in which the Group has between 20% and 50% of the voting rights and over which the Group exercises significant influence but which it does not control. A joint venture is an arrangement in which the Group has joint control, whereby the Group has rights to the net assets or obligations to the net liabilities of the arrangement. Interests in the associate and joint venture are accounted for using the equity method. They are initially recognised at cost, which includes transaction costs. Subsequent to initial recognition, the consolidated financial statements includes the Group s share of profit or loss and other comprehensive income of the equity accounted investees until the date on which significant influence or joint control ceases. Losses of an equity accounted investee in excess of the Group s interest in that entity are recognised only to the extent that the Group has incurred legal or constructive obligations to make payments on behalf of the investee. Unrealized gains arising from transaction with equity accounted investees are eliminated against the investment to the extent of the Group s interest in the investee. Unrealized losses are eliminated in the same way as unrealized gains, but only to the extent that there is no evidence of impairment. Investments in equity accounted investees are accounted at cost less impairment loss in the separate financial statements of the Company. They are initially recognised at cost which includes transaction costs. (b) Foreign currencies (i) Foreign currency transactions and balances Foreign currency transactions are translated into the functional currency of the respective entity using the exchange rates prevailing at the dates of the transactions. Foreign exchange gains and losses resulting from the settlement of such transactions and from the translation at yearend exchange rates of monetary assets and liabilities denominated in foreign currencies are recognised in profit or loss. Nonmonetary assets and liabilities that are based on historical cost in a foreign currency are not retranslated. (ii) Foreign operations The results and financial position of all Group entities (none of which has the currency of a hyperinflationary economy) that have a functional currency different from the Group s presentation currency are translated into the presentation currency as follows: (i) assets and liabilities for each statement of financial position presented are translated at the closing rate at the reporting date. (ii) income and expenses for each statement of comprehensive income are translated at average exchange rates (unless this average is not a reasonable approximation of the cumulative effect of the rates prevailing on the transaction dates, in which case income and expenses are translated at the dates of the transactions); and (iii) all resulting exchange differences are recognised in other comprehensive income. 109
110 Notes to the financial statements for the year ended 31 December (continued) 3. Significant Accounting Policies (Continued) (b) Foreign currencies (continued) (ii) Foreign operations (continued) Goodwill and fair value adjustments arising on the acquisition of a foreign entity are treated as assets and liabilities of the foreign entity and translated at the closing rate. (c) Segment reporting IFRS 8 requires operating segments to be identified on the basis of internal reports about components of the Group that are regularly reviewed by the chief operating decision maker in order to allocate resources to the segments and to assess their performance. The Group organizes its activity by business and geographical lines and these are defined as the Group s reportable segments. The four business segments are Manufacturing and distribution, Regional operations, Yana Tyre Centres and Property rentals. (d) Revenue recognition Revenue comprises of sale of tyres and related products, rental income and service income from tyre centres. Revenue is measured at the fair value of the consideration received or receivable. Revenue is shown net of Value Added Tax (VAT), customer returns, rebates and other similar allowances and discounts and after eliminating sales within the Group. (i) Sale of goods Revenue from the sale of goods is recognised when the goods have been delivered and title has passed, at which point all the following conditions are satisfied: The Group has transferred to the buyer the significant risks and rewards of ownership of the goods. The Group retains neither continuing managerial involvement to the degree usually associated with ownership nor effective control over the goods sold. The amount of revenue can be measured reliably. It is probable that the economic benefits associated with the transaction will flow to the Group. The costs incurred or to be incurred in respect to the transaction can be measured reliably (ii) Rendering of services Revenue from rendering of services is recognised when services have been rendered and when it is probable that the economic benefits associated with the transaction will flow to the Group. (iii) Rental income from investment property Rental income from investment property is recognised as revenue on a straight line basis over the period of the various leases. Rental income from other property is recognised as other income. (e) Finance income and finance costs The Group s finance income and finance costs include: Interest income; Interest expense; Dividend income; Foreign currency exchange gain or loss on financial assets and financial liabilities; Impairment losses recognised on financial assets (other than trade receivables); Reclassification of net gains previously recognised in other comprehensive income. Interest expense on borrowings is recognized in profit or loss using the effective interest rate unless they are directly attributable to the acquisition, construction or production of a qualifying asset, in which case they are capitalized to that asset. Foreign exchange gains and losses on financial assets and financial liabilities are reported on a net basis as either finance income or finance cost depending on whether foreign currency movements are in a net gain or net loss position. (f) Employee benefits (i) Staff gratuity (Defined Benefit Plan) The Group has a defined benefit plan for its unionisable employees under its Collective Bargaining Agreement. The Group s net obligation in respect of the defined benefit pension plan is calculated by estimating the amount of future benefit that employees have earned in return for their service in the current and prior periods; that benefit is discounted to determine its present value. Under the scheme, employees who retire on reaching the retirement age fixed by the Group or on grounds of ill health receive thirty two days basic pay for each completed year of service subject to an employee having worked for a minimum period of six years. The net obligation recognized in the statement of financial position is the estimated entitlement as a result of services rendered by employees up to the reporting date. The defined benefit scheme is unfunded. 110
111 Notes to the financial statements for the year ended 31 December (continued) 3. Significant Accounting Policies (Continued) (f) Employee benefits (continued) (i) Staff gratuity (Defined Benefit Plan) (continued) The calculation of the net obligation is performed annually by a qualified actuary using the projected unit credit method. The Group recognizes all expenses related to defined benefit plans in employee costs in profit or loss and all actuarial gains or losses in other comprehensive income. The Group recognizes gains or losses on the curtailment or settlement of a defined benefit plan when the curtailment or settlement occurs. The gain or loss on curtailment comprises any resulting change in the present value of defined benefit obligation and any related actuarial gains and losses and past service costs that have not previously been recognized. (ii) Defined contribution plans The Group and all its employees also contribute to the respective National Social Security Funds in the countries in which the Group operates, which are defined contribution schemes. The Group and its non unionisable employees also contribute to a defined contribution pension scheme which is managed by an independent fund manager. The postemployment benefits received by an employee from the scheme are determined by the amount of contributions by the Group and the employee, together with investment returns arising from the contributions. In consequence, both the actuarial and investment risks fall, in substance, on the employee. The Group s contributions to the defined contribution schemes are charged to the profit or loss in the year to which they relate. The company has no further obligation in respect of the defined contribution plans once the contributions have been paid. (iii) Leave accrual The monetary value of the unutilized leave by staff as at year end is recognized within Payables and accrued expenses and the movement in the year is charged to profit or loss. (iv) Termination benefits Termination benefits are recognized as an expense when the Group is demonstrably committed, without a realistic possibility of withdrawal, to a formal detailed plan to either terminate employment before the normal retirement date, or to provide termination benefits as a result of an offer made to encourage voluntary redundancy. Termination benefits for voluntary redundancies are recognized as an expense if the Group has made an offer encouraging voluntary redundancy, it is probable that the offer will be accepted, and the number of acceptances can be estimated reliably. (g) Taxation Income tax expense comprises both current tax and change in deferred tax. Income tax expense is recognised in profit or loss except to the extent that it relates to items recognised directly in equity or other comprehensive income, in which case it is recognised in equity or other comprehensive income. Current tax is the amount of income tax payable on the taxable profit for the year determined in accordance with the relevant tax legislation. The current income tax charge is calculated on the basis of the tax rates enacted or substantively enacted at the reporting date. Deferred tax is recognised on all temporary differences between the carrying amounts for financial reporting purposes and the amounts used for taxation purposes. A deferred tax asset is recognised only to the extent that future taxable profits will be available against which the asset can be utilised. Deferred tax assets are reduced to the extent that it is no longer probable that the related tax benefit will be realised. Deferred tax is measured using tax rates that are expected to be applied to the temporary differences when they reverse, based on the laws that have been enacted or substantively enacted by the reporting date. A deferred tax asset and liability are offset if there is a legally enforceable right to offset current tax liabilities and assets and they relate to taxes levied by the same tax authority on the same taxable entity, or on different tax entities, but they intend to settle current tax liabilities and assets on a net basis or their tax assets and liabilities will be realized simultaneously. (h) Property, plant and equipment (i) Recognition and measurement The cost of an item of property, plant and equipment is recognised as an asset if it is probable that future economic benefits associated with the item will flow to the Group and the cost of the item can be measured reliably. Items of property, plant and equipment are measured at cost less accumulated depreciation and impairment losses. Cost includes expenditures that are directly attributable to the acquisition or construction of the asset. 111
112 Notes to the financial statements for the year ended 31 December (continued) 3. Significant Accounting Policies (Continued) (h) Property, plant and equipment (continued) (ii) Recognition and measurement (continued) Where an item of property, plant and equipment is developed or constructed over a period of time, the costs attributable to the item are accumulated in a capital work in progress account until the item is commissioned and the cost transferred to the relevant class of property, plant and equipment. Assets under capital work in progress are not depreciated until they are commissioned or are put into active use and transferred to the relevant class of property, plant and equipment. Assets still under development or construction at the reporting date are shown under capital works in progress in the notes to the financial statements. These are capitalised when ready for intended use. (iii) Reclassification to investment property When the use of a material part of property, or part thereof, changes from owner occupied to investment property, the property is classified accordingly using the depreciated cost less impairment loss or a proportionate share of the depreciated cost less impairment loss in cases where only a portion of the property is transferred. (iv) Subsequent costs The cost of replacing a component of property, plant and equipment is recognised in the carrying amount of the item if it is probable that the future economic benefits embodied within the part will flow to the Company and its cost can be measured reliably. The costs of the daytoday servicing of property and equipment are recognised in profit or loss as incurred. (v) Depreciation Depreciation is charged on a straightline basis over the estimated useful lives of the assets. The annual rates of depreciation used are as follows: Buildings Plant and machinery Computer equipment Vehicles Furniture, fittings and equipment 25 years 3 19 years 3 years 4 years 8 years The assets residual values and useful lives are reviewed and adjusted as appropriate at each reporting date. (vi) Derecognition The carrying amount of an item of property, plant and equipment is derecognized on disposal or when no future economic benefits are expected from its use or disposal. The gain or loss arising from the derecognition is included in profit or loss. The gain or loss is determined as the difference between the net disposal proceeds, if any, and the carrying amount of the item. (i) Investment property Buildings, or part of a building, (freehold or held under a finance lease) and land (freehold or held under an operating lease) held for long term rental yields and/ or capital appreciation and are not occupied by the Group are classified as investment property under noncurrent assets. Investment property is initially measured at cost which includes transaction costs. After initial recognition, investment property is carried at historical cost less accumulated depreciation and any accumulated impairment losses. Depreciation is charged on a straight line basis at the rate of 2.5% per annum. Investment property is derecognized (eliminated from the statement of financial position) on disposal or when the property is permanently withdrawn from use and no economic benefits are expected from its disposal. (j) Intangible assets computer software Computer software development costs and the acquisition cost of software licenses are capitalized on the basis of the costs incurred to develop or acquire and bring to use the specific software. Software costs are capitalized only if the expenditure can be reliably measured, the product is technically and commercially viable, future economic benefits are probable and the Group intends to and has resources to complete development and use or sell the asset. Subsequent to initial recognition, software acquisition and development expenditure is carried at cost less accumulated amortization and any accumulated impairment losses. Computer software development and acquisition costs are amortised on a straight line basis over 8 years. (k) Inventories Inventories are stated at the lower of cost and net realisable value. Cost is determined by the weighted average method. The cost of finished goods and work in progress comprises raw materials, direct labour, other direct costs and related production overheads (based on normal operating capacity). 112
113 Notes to the financial statements for the year ended 31 December (continued) 3. Significant Accounting Policies (Continued) (k) Inventories (continued) Net realisable value is the estimate of the selling price in the ordinary course of business, less any costs of completion and selling expenses. If the purchase or production cost is higher than net realisable value, inventories are written down to net realisable value. (l) Financial instruments The Group classifies its current non derivative financial assets under loans and receivables. The Group classifies its non derivative financial liabilities into other financial liabilities category. (i) Non derivative financial assets and financial liabilities recognition and derecognition The Group recognizes loans and receivables on the date when they are originated. All other non derivative financial assets and liabilities are recognised on the trade date. The Group derecognizes a financial asset when the contractual rights to the cash flows of the asset expire, or it transfers the rights to receive the contractual cash flows in a transaction in which substantially all the risks and rewards of ownership of the financial asset are transferred, or it neither transfers or retains substantially all the risks and reward of ownership and does not retain control over the transferred asset. Any interest in such a derecognized financial asset that is created or retained by the Group is recognised as separate asset or liability. The Group derecognizes a financial liability when its contractual obligations are discharged, cancelled or expire. (ii) Nonderivative financial assets measurement Loans and receivables These assets are initially recognised at fair value plus any directly attributable transaction costs. Subsequent to initial recognition, these assets are measured at amortised cost using the effective interest method. Cash and cash equivalents In the statement of cash flows, cash and cash equivalents include overdrafts and short term facilities that are repayable on demand and form an integral part of the Group s cash management policies. (iii) Non derivative financial liabilities measurement Nonderivative financial liabilities are initially recognised at fair value less any directly attributable transaction costs. Subsequent to initial recognition, these liabilities are measured at amortised cost using the effective interest method. Financial assets and liabilities are offset and the net amount reported in the statement of financial position when there is a legally enforceable right to offset or where there is an intention to settle on a net basis, or to realize the asset and settle the liability simultaneously. (m) Impairment (i) Financial assets At each reporting date the Group assesses whether there is objective evidence that financial assets not carried at fair value through profit or loss are impaired. Financial assets are impaired when objective evidence demonstrates that a loss event has occurred after the initial recognition of the asset and that the loss event has an impact on the future cash flows of the asset than can be estimated reliably. The Group considers evidence of impairment at both a specific asset and collective level. All individually significant financial assets are assessed for specific impairment. All significant assets found not be specifically impaired are then collectively assessed for any impairment that has been incurred but not yet identified. Assets that are not individually significant are then collectively assessed for impairment by combining together financial assets with similar risk characteristics. Objective evidence that financial assets (including equity securities) are impaired can include default or delinquency by a borrower, restructuring of a loan or advance by the Group on terms that the Group would otherwise not consider, indications that a borrower or issuer will enter bankruptcy, the disappearance of an active market for a security or other observable data relating to a Group of assets such as adverse changes in the payment status of borrowers or issuers in the Group or economic conditions that correlate with defaults in the Group. In assessing collective impairment, the Group uses historical trends of the probability of default, timing of recoveries and the amount of loss incurred, adjusted for management s judgment as to whether current economic and credit conditions are such that the actual losses are likely to be greater or less than suggested by historical modelling. 113
114 Notes to the financial statements for the year ended 31 December (continued) 3. Significant Accounting Policies (Continued) (m) Impairment (continued) (i) Financial assets (continued) Default rates, loss rates and the expected timing of future recoveries are regularly benchmarked against actual outcomes to ensure that they remain appropriate. Impairment losses on assets carried at amortised cost are measured as the difference between the carrying amount of the financial assets and the present value of estimated cash flows discounted at the assets original effective interest rate. Losses are recognised in profit or loss and reflected in an allowance account against loans and advances. Interest on the impaired asset continues to be recognised through the unwinding of the discount. When a subsequent event causes the amount of impairment loss to decrease, the impairment loss is reversed through the statement of profit or loss. (ii) Nonfinancial assets The carrying amounts of the Group s nonfinancial assets, other than inventories and deferred tax assets, are reviewed at each reporting date to determine whether there is any indication of impairment. If any such indication exists then the asset s recoverable amount is estimated. An impairment loss is recognised if the carrying amount of an asset or its cashgenerating unit exceeds its recoverable amount. A cashgenerating unit is the smallest identifiable asset Group that generates cash flows that largely are independent from other assets and Groups. Impairment losses are recognised in profit or loss. Impairment losses recognised in respect of cashgenerating units reduce the carrying amount of the other assets in the unit (Group of units) on a pro rata basis. The recoverable amount of an asset or cashgenerating unit is the greater of its value in use and its fair value less costs to sell. In assessing value in use, the estimated future cash flows are discounted to their present value using a pretax discount rate that reflects current market assessments of the time value of money and the risks specific to the asset. Impairment losses recognised in prior periods are assessed at each reporting date for any indications that the loss has decreased or no longer exists. An impairment loss is reversed if there has been a change in the estimates used to determine the recoverable amount. An impairment loss is reversed only to the extent that the asset s carrying amount does not exceed the carrying amount that would have been determined, net of depreciation or amortisation, if no impairment loss had been recognised. (n) Operating leases (i) Determining whether an arrangement contains a lease. At inception of an arrangement, the Group determines whether the arrangement contains or is a lease. At inception or on reassessment of whether an arrangement contains a lease, the Group separates payments and other consideration required by the arrangement into those of the lease and those for other elements on the basis of their relative fair values. If the Group determines for a finance lease that it is impractical to separate the payments reliably, then an asset and a liability are recognised at an amount equal to the fair value of the underlying asset; subsequently, the liability is reduced as payments are made and an imputed finance cost on the liability is recognised using the Group s incremental borrowing rate. (ii) Arrangements where the Group is the lessee Assets held by the Group under leases that transfer substantially all the risk and rewards of ownership are classified under finance leases. The leased assets are measured initially at an amount equal to the lower of their fair value and present value of the minimum lease payments. Subsequent to initial recognition, the assets are accounted for in accordance with the accounting policy applicable to that asset. Assets held under other leases are classified as operating leases and are not included in the Group s statement of financial position. Lease payments made under operating leases are recognised in profit or loss on a straight line basis over the term of the lease. (iii) Arrangements where the Group is the lessor The Group lets out, on an operating lease basis, its investment property to other entities. The leases are issued under non cancellable leases of 5 years with rental escalation after every 2 years. Rental income from investment property is recognised in profit or loss on a straight line basis over the terms of the leases. 114
115 Notes to the financial statements for the year ended 31 December (continued) 3. Significant Accounting Policies (Continued) (o) Related party transactions The Group discloses the nature, volume and amounts outstanding at the end of each reporting date from transactions with related parties, which include transactions with the directors, executive officers and other or related companies. (p) Dividends Dividends are recognised as a liability in the period in which they are declared. Proposed dividends are shown as a separate component of equity, by transferring the amount from the revenue reserves, until declared. (q) Share capital Ordinary shares are classified as share capital in equity. Equity instruments issued by a Group entity are recognised at the value of proceeds received, net of direct issue costs. Incremental costs directly attributable to the issue of ordinary shares, net of any tax effects, are recognised as a reduction from equity. (r) Earnings per share The Group presents basic and diluted earnings per share (EPS) data for its ordinary shares. Basic EPS is calculated by dividing the profit or loss attributable to ordinary shareholders of the Company by the weighted average number of ordinary shares outstanding during the period. Diluted EPS is determined by adjusting the profit or loss attributable to ordinary shareholders and the weighted average number of ordinary shares outstanding for the effects of all dilutive potential ordinary shares. (s) Comparative information Where necessary, comparative figures have been adjusted to conform with changes in the current year s presentation. 4. New Standards, Amendments and Interpretations (a) New standards and interpretations not yet adopted Defined benefit plans Employee contributions (Amendments to IAS 19) The amendments introduce relief that will reduce the complexity and burden of accounting for certain contributions from employees or third parties. Such contributions are eligible for practical expedient if they are: Set out in the formal terms of the plan; Linked to service; and Independent of the number of years of service. When contributions are eligible for the practical expedient, a company is permitted (but not required) to recognise them as a reduction of the service cost in the period in which the related service is rendered. The amendments apply retrospectively for annual periods beginning on or after 1 July with early adoption permitted. The Group s defined benefits scheme does not provide for employee contributions. The adoption of these changes will, therefore, not affect the amounts and disclosures of the Group s defined benefits obligations. Sale or Contribution of Assets between an Investor and its Associate or Joint Venture (Amendments to IFRS 10 and IAS 28) The amendments require the full gain to be recognised when assets transferred between an investor and its associate or joint venture meet the definition of a business under IFRS 3 Business Combinations. Where the assets transferred do not meet the definition of a business, a partial gain to the extent of unrelated investors interests in the associate or joint venture is recognised. The definition of a business is key to determining the extent of the gain to be recognised The amendments will be effective from annual periods commencing on or after 1 January The Group s contribution of assets into the joint venture is in form of a lease whereby the Group retains ownership and control over the contributed assets. The amendments to IFRS 10 and IAS 28 would therefore have no impact on the Group s transaction with its equity accounted investees. Accounting for Acquisitions of Interests in Joint Operations (Amendments to IFRS 11) The amendments require business combination accounting to be applied to acquisitions of interests in a joint operation that constitutes a business. Business combination accounting also applies to the acquisition of additional interests in a joint operation while the joint operator retains joint control. The additional interest acquired will be measured at fair value. The previously held interest in the joint operation will not be remeasured. 115
116 Notes to the financial statements for the year ended 31 December (continued) 4. New Standards, Amendments and Interpretations (Continued) (a) New standards and interpretations not yet adopted (continued) The amendments apply prospectively for annual periods beginning on or after 1 January 2016 and early adoption is permitted. The Group has assessed its joint arrangement as a joint venture as opposed to a joint operation and accounted for it using the equity method. The adoption of amendments to IFRS 11 would therefore have no impact on the accounting treatment of its equity accounted investees. Amendments to IAS 41 Bearer Plants (Amendments to IAS 16 and IAS 41) The amendments to IAS 16 Property, Plant and Equipment and IAS 41 Agriculture require a bearer plant (which is a living plant used solely to grow produce over several periods) to be accounted for as property, plant and equipment in accordance with IAS 16 Property, Plant and Equipment instead of IAS 41 Agriculture. The produce growing on bearer plants will remain within the scope of IAS 41. The amendments apply prospectively for annual periods beginning on or after 1 January 2016 and early adoption is permitted. The adoption of these changes will/will not affect the amounts and disclosures of the Group s/ property, plant and equipment and intangible assets. The Group does not use revenue based depreciation methods. Equity Method in Separate Financial Statements (Amendments to IAS 27) The amendments allow the use of the equity method in separate financial statements, and apply to the accounting not only for associates and joint ventures but also for subsidiaries The amendments apply retrospectively for annual periods beginning on or after 1 January 2016 with early adoption permitted. The following tables illustrates the impact the amendments to IAS 27 Equity method in Separate Financial statements, would have on the separate financial statements of the company: The new requirements are effective from 1 January 2016, with earlier adoption permitted. The amendment will not have a significant impact on the Group s financial statements as the Group does not have any agricultural assets. Clarification of Acceptable Methods of Depreciation and Amortisation (Amendments to IAS 16 and IAS 38) The amendments to IAS 16 Property, Plant and Equipment explicitly state that revenuebased methods of depreciation cannot be used for property, plant and equipment. The amendments to IAS 38 Intangible Assets introduce a rebuttable presumption that the use of revenuebased amortization methods for intangible assets is inappropriate. The presumption can be overcome only when revenue and the consumption of the economic benefits of the intangible asset are highly correlated, or when the intangible asset is expressed as a measure of revenue. 116
117 Notes to the financial statements for the year ended 31 December (continued) 4. New Standards, Amendments and Interpretations (Continued) (a) New standards and interpretations not yet adopted (continued) Company statement of profit or loss and other comprehensive income for the year ended 31 December : As reported Amendments to IAS 27 Subsidiaries Amendments to IAS 27 Associate As restated Revenue Cost of sales 3,281,226 (2,706,110) 3,281,226 (2,706,110) Gross profit Operating expenses and income Share of loss in subsidiaries (net of tax) Share of profit in equity accounted investees (net of tax) Income tax 575,116 (682,077) 21,644 27,778 3, ,116 (682,077) 27,778 3,822 21,644 Profit for the year (85,317) 27,778 3,822 (53,717) Total other comprehensive income (5,247) (5,247) Total comprehensive income (90,564) 27,778 3,822 (58,964) Company statement of financial position: At 1 January Investment in subsidiaries Equity accounted investees Other assets 158, ,026 2,841, ,486 (20,953) 724, ,073 2,841,360 Total assets 3,136, ,486 (20,953) 3,682,333 Total liabilities Equity 1,031,193 2,105, ,486 (20,953) 1,031,193 2,651,140 Total equity and liabilities 3,136, ,486 (20,953) 3,682,333 At 31 December Investment in subsidiaries Equity accounted investees Other assets 158, ,026 3,025, ,774 (17,131) 765, ,895 3,025,567 Total assets 3,321, ,774 (17,131) 3,910,650 Total liabilities Equity 1,389,467 1,931, ,774 (17,131) 1,389,467 2,521,183 Total equity and liabilities 3,321, ,774 (17,131) 3,910,
118 Notes to the financial statements for the year ended 31 December (continued) 4. New Standards, Amendments and Interpretations (Continued) (a) New standards and interpretations not yet adopted (continued) Equity Method in Separate Financial Statements (Amendments to IAS 27) (continued) Company statement of cash flows The adoption of amendments to IAS 27 would have no impact on the company s statement of cash flows. IFRS 14 Regulatory Deferral Accounts IFRS 14 provides guidance on accounting for regulatory deferral account balances by firsttime adopters of IFRS. To apply this standard, the entity has to be rateregulated i.e. the establishment of prices that can be charged to its customers for goods and services is subject to oversight and/or approval by an authorised body. The standard is effective for financial reporting years beginning on or after 1 January 2016 with early adoption is permitted. The adoption of this standard is not expected to have an impact the financial statements of the Group or the Company given that the Group s business is not subject to government rate regulations. Investment Entities: Applying the Consolidation Exception (Amendments to IFRS 10, IFRS 12 and IAS 28) The amendment to IFRS 10 Consolidated Financial Statements clarifies which subsidiaries of an investment entity are consolidated instead of being measured at fair value through profit and loss. The amendment also modifies the condition in the general consolidation exemption that requires an entity s parent or ultimate parent to prepare consolidated financial statements. The amendment clarifies that this condition is also met where the ultimate parent or any intermediary parent of a parent entity measures subsidiaries at fair value through profit or loss in accordance with IFRS 10 and not only where the ultimate parent or intermediate parent consolidates its subsidiaries. The amendment to IFRS 12 Disclosure of Interests in Other Entities requires an entity that prepares financial statements in which all its subsidiaries are measured at fair value through profit or loss in accordance with IFRS 10 to make disclosures required by IFRS 12 relating to investment entities. The amendment to IAS 28 Investments in Associates and Joint Ventures modifies the conditions where an entity need not apply the equity method to its investments in associates or joint ventures to align these to the amended IFRS 10 conditions for not presenting consolidated financial statements. The amendments introduce relief when applying the equity method which permits a noninvestment entity investor in an associate or joint venture that is an investment entity to retain the fair value through profit or loss measurement applied by the associate or joint venture to its subsidiaries. The amendments apply retrospectively for annual periods beginning on or after 1 January 2016, with early application permitted. The Group or the ultimate parent do not fit within the description of investment entities neither do they account for subsidiaries at fair value through profit or loss. Consequently these changes will not affect the amounts and disclosures of the Group s interests in other entities. Disclosure Initiative (Amendments to IAS 1) The amendments provide additional guidance on the application of materiality and aggregation when preparing financial statements. The amendments apply for annual periods beginning on or after 1 January 2016 and early application is permitted. The adoption of these changes will impact on the disclosure and presentation of the Group s financial statements. In particular changes are expected in the following areas; (i) Materiality the changes may require a review of the materiality of items where standards require specific disclosure as well as the manner in which the Group aggregates material items. (ii) Disaggregation and subtotals the changes would affect aggregations in the Group and company statements of profit or loss and other comprehensive income and statements of financial position. Additional subtotals may also be required. (iii) Notes structure The amendments clarify that entities have flexibility as to the order in which they present the notes to financial statements, but also emphasize that understandability and comparability should be considered by an entity when deciding on that order. The changes may affect the way the Group structures its notes to the financial statements. 118
119 Notes to the financial statements for the year ended 31 December (continued) 4. New Standards, Amendments and Interpretations (Continued) (a) New standards and interpretations not yet adopted (continued) Disclosure Initiative (Amendments to IAS 1) (continued) (iv) Presentation of items of OCI arising from equity accounted investments the amendments in respect of items of Other Comprehensive income (OCI) would not affect the Group disclosure of interests in other entities as the Group s equity accounted investees do not have elements of OCI. IFRS 15 Revenue from Contracts with Customers This standard replaces IAS 11 Construction Contracts, IAS 18 Revenue, IFRIC 13 Customer Loyalty Programmes, IFRIC 15 Agreements for the Construction of Real Estate, IFRIC 18 Transfer of Assets from Customers and SIC31 Revenue Barter of Transactions Involving Advertising Services. The standard contains a single model that applies to contracts with customers and two approaches to recognizing revenue: at a point in time or over time. The standard specifies how and when an IFRS reporter will recognize revenue as well as requiring such entities to provide users of financial statements with more informative, relevant disclosures. The standard provides a single, principles based fivestep model to be applied to all contracts with customers in recognizing revenue being: Identify the contract(s) with a customer; Identify the performance obligations in the contract; Determine the transaction price; Allocate the transaction price to the performance obligations in the contract; and recognize revenue when (or as) the entity satisfies a performance obligation. IFRS 15 is effective for annual reporting periods beginning on or after 1 January 2017, with early adoption is permitted. The adoption this standard is unlikely to affect the way the Group recognises revenue. The nature of the company s sales of goods and services, provide for the recognition at a point in time, the transaction price is known with certainty and the performance obligations of the parties to the sale contract is clear and unambiguous. This standard introduces changes in the measurement bases of the financial assets to amortised cost, fair value through other comprehensive income or fair value through profit or loss. Even though these measurement categories are similar to IAS 39, the criteria for classification into these categories are significantly different. In addition, the IFRS 9 impairment model has been changed from an incurred loss model from IAS 39 to an expected credit loss model. The standard is effective for annual periods beginning on or after 1 January 2018 with retrospective application, early adoption is permitted. Although the Group does not envisage any major impact on its financial statements on the adoption of IFRS 9 given its limited use of complex financial instruments, the Standard is still going through major changes before it finally replaces IAS 39. The full impact of these changes cannot therefore be reliably estimated at this time. (b) New standards, amendments and interpretations effective and adopted during the year The Group has adopted the following new standards and amendments to standards, with an initial application date of 1 January : New standard or amendments Amendments to IAS 32 Offsetting Financial Assets and Financial Liabilities (2011) Investment Entities Amendments to IFRS 10, IFRS 12, and IAS 27 (2012) Amendments to IAS 36 Recoverable Amount Disclosures for NonFinancial Assets () Novation of Derivatives and Continuation of Hedge Accounting (Amendments to IAS 39) IFRIC 21 Levies () IFRS 9: Financial Instruments () On 24 July the IASB issued the final IFRS 9 Financial Instruments Standard, which replaces earlier versions of IFRS 9 and completes the IASB s project to replace IAS 39 Financial Instruments: Recognition and Measurement. 119
120 Notes to the financial statements for the year ended 31 December (continued) 4. New Standards, Amendments and Interpretations (Continued) (b) New standards, amendments and interpretations effective and adopted during the year (continued) Financial Assets and Financial Liabilities (Amendments to IAS 32) The amendments to IAS 32 clarify the offsetting criteria in IAS 32 by explaining when an entity currently has a legally enforceable right to setoff and when gross settlement is equivalent to net settlement. The Group s policy is to offset financial assets and financial liabilities when there is a legally enforceable right to offset the recognised amount and there is an intention to settle on a net basis, or to realize the asset and settle the liability simultaneously. The clarification contained in these amendments reinforces the Group s policy and would not alter the manner in which offsetting arrangements are accounted for. The additional disclosure requirements in IFRS 7 require the Group to disclose gross amounts before any offsetting arrangement. Investment entities (Amendments to IFRS 10, IFRS 12 and IAS 27) The amendments clarify that a qualifying investment entity is required to account for investments in controlled entities, as well as investments in associates and joint ventures, at fair value through profit or loss; the only exception would be subsidiaries that are considered an extension of the investment entity s investment activities. The consolidation exemption is mandatory and not optional. The parent company does not qualify to be classified as an Investment Entity as defined in the new amendments. Further the Group does not account for its investment properties at fair value through profit or loss. The adoption of this standards has no effect on the Group s financial statements or the separate financial statements of the company. Recoverable Amount Disclosures for NonFinancial Assets (Amendments to IAS 36) The amendments reverse the unintended requirement in IFRS 13 Fair Value Measurement to disclose the recoverable amount of every cashgenerating unit to which significant goodwill or indefinitelived intangible assets have been allocated. Under the amendments, the recoverable amount is required to be disclosed only when an impairment loss has been recognised or reversed. The adoption of amendments to IAS 36 has no impact on the Group s financial statements. The Group has no intangible assets or goodwill acquired in business combinations; neither does it have assets classified at fair value less costs of disposal. Novation of Derivatives and Continuation of Hedge Accounting (Amendments to IAS) The amendments permit the continuation of hedge accounting in a situation where a counterparty to a derivative designated as a hedging instrument is replaced by a new central counterparty (known as novation of derivatives ), as a consequence of laws or regulations, if specific conditions are met. The Group does not have any derivatives and is currently not employing hedge accounting. Consequently, adoption of these changes has no impact of the Group s financial statements. IFRIC 21: Levies IFRIC 21 defines a levy as an outflow from an entity imposed by a government in accordance with legislation. It confirms that an entity recognizes a liability for a levy when and only when the triggering event specified in the legislation occurs. The legislation regarding levies in the jurisdictions where the Group operates provide for specific dates when these levies are due and payable. There is no ambiguity when the liability arises. The Group therefore complies with the interpretations proposed in IFRIC Financial Instruments Risk Management and Fair Values Overview The Group s activities expose it to a variety of financial risks and those activities involve the analysis, evaluation, acceptance and management of some degree of risk or combination of risks. Taking risk is core to the Group s business, and the operational risks are an inevitable consequence of being in business. The Group s aim is therefore to achieve an appropriate balance between risk and return and minimize potential adverse effects on its financial performance. The key types of risk include: a) Credit risk b) Liquidity risk c) Market risk includes currency, interest rate and other price risks 120
121 Notes to the financial statements for the year ended 31 December (continued) 5. Financial Instruments Risk Management and Fair Values (continued) The Group s overall risk management programme focuses on the unpredictability of changes in the business environment and seeks to minimise the potential adverse effect of such risks on its performance by setting acceptable levels of risk. Risk management framework The Group recognizes that in order to pursue its objectives and take advantage of opportunities, it cannot avoid taking risks and that no risk management programme can aim to eliminate risk fully. The Group s general risk management approach is to increase the likelihood of success in its strategic activities, that is, to raise the potential reward of its activities relative to the risks undertaken. Accordingly, the Group s approach to risk management is intended to increase risk awareness and understanding, thus taking risks where appropriate, in a structured and controlled manner. The Group however recognizes that in pursuit of its mission and strategic objectives it may choose to accept a lower level of reward in order to mitigate the potential hazard of the risks involved. To assist in implementing its risk management policy, the Group has: Identified, analysed and produced a risk management strategy for those risks which might inhibit it from achieving its strategic objectives and which would threaten its ongoing survival; Raised awareness of and integrated risk management into its management policies. Promoted an understanding of the importance and value of risk management; Established risk management roles and responsibilities for its board of directors, audit, risk and corporate governance committee and the risk department. (a) Credit risk Credit risk is the risk of financial loss to the Group if a customer or counterparty to a financial instrument fails to meet its contractual obligation, and arises principally from the Group s receivables from customers. Trade and other receivables The Group s exposure to credit risk is influenced mainly by the individual characteristics of each customer, the demographics of the Group s customer base, including the default risk of the industry and country in which customers operate. The Group has established a credit policy under which each new customer is analysed individually for creditworthiness before the Group s standard payment and delivery terms and conditions are offered. Customers that fail to meet the Group s benchmark creditworthiness may transact with the Group only on a prepayment basis. The Group has a stringent debt provisioning policy that represents its estimate of incurred losses in respect of trade and other receivables. The main component of this allowance is specific loss component that relates to individually significant exposures. The Group also manages the level of credit risk by focusing on customer satisfaction as a key performance indicator. Due to the nature of the Group s activities, credit risk concentrations are high and as such close monitoring of credit relationships is carried out. The risk management function is supervised by the Audit, Risk and Corporate governance Committee. Management identifies, evaluates, hedges and manages financial risks under policies approved by the board of directors. The board provides written principles for overall risk management, as well as written policies covering specific areas such as price risk, foreign exchange risk, interest rate risk, credit risk, use of derivative and nonderivative financial instruments and investing excess liquidity. The Board has put in place an internal audit, risk and corporate governance function to assist it in assessing the risk faced by the Group on an ongoing basis and to evaluate and test the design and effectiveness of its internal accounting and operational controls. 121
122 Notes to the financial statements for the year ended 31 December (continued) 5. Financial Instruments Risk Management and Fair Values (Continued) (a) Credit risk (continued) Exposure to credit risk The carrying amount of financial assets represents the maximum exposure to credit risk. The maximum exposure to credit risk at the reporting date was: Group Company Trade receivables (net) Other receivables (including amounts due from related parties 564, , , , , , , ,529 Note , , , ,911 At 31 December, the maximum exposure to credit risk for trade and other receivables by geographic region was as follows; Group Company Kenya Uganda Tanzania Burundi 567,242 71, ,673 33, ,317 77, ,477 30, , , , ,536 13, , , , , , ,911 At 31 December, the maximum exposure to credit risk for trade and other receivables by geographic region was as follows; Group Company Fleet customers Dealers Government Oil Companies Export customers Rental customers Related parties Others 106, ,861 46,525 10,176 59,661 9,208 23, , , ,173 45,125 7,217 7,720 46,220 4, ,288 64, ,800 32,456 10,176 59,661 5, , , ,982 93,034 43,964 7,217 7,720 4, , , , , , ,
123 Notes to the financial statements for the year ended 31 December (continued) 5. Financial Instruments Risk Management and Fair Values (Continued) (a) Credit risk (continued) Guarantees The Group obtains financial guarantees in the form of customer refundable deposits and letters of credit and issues bank guarantees in the ordinary course of business for the supply of goods from certain suppliers. The analysis of customer refundable deposits and letters of credit held as at 31 December is as follows; Group Company Rental deposits Letters of credit Other trade deposits 14,789 60,942 16,333 16,903 19,550 16,333 6,065 60,942 16,333 5,855 19,550 16,333 92,064 52,786 83,340 41,738 The Group had issued the following financial guarantees as at 31 December. Group Company Customs bonds Other guarantees 10,000 9,987 10,000 5,852 10,000 9,693 10,000 5,330 19,987 15,852 19,693 15,330 Impairment losses The aging of trade receivables at the reporting date was: Group Company Not past due Past due but not impaired :by 31 to 60 days :by 61 to 90 days :by 91 to 180 days :over 181 days 147, , , ,645 54, , ,320 56,024 57,199 67,153 78, ,634 65,619 52,558 30, ,589 89,017 21,547 34,040 16,189 Total past due but not impaired 417, , , ,793 Total unimpaired 564, , , ,382 Impaired 33,179 80,287 7,209 15,491 Total trade receivables 597, , , ,873 The management believes that the unimpaired amounts that are past due by more than 30 days are still collectible in full based on payment behaviour and extensive analysis of customer credit risk, including underlying customer credit ratings if they are available. 123
124 Notes to the financial statements for the year ended 31 December (continued) 5. Financial Instruments Risk Management and Fair Values (Continued) (a) Credit risk (continued) Impairment losses (continued) As at 31 December, the analysis of the credit quality of trade receivables that are neither past due nor impaired was as follows. Group Company Secured Externally credit rated Over 4 years trading history with the Group 24 years trading history with the Group 12 years trading history with the Group Higher risk 17, ,824 3,026 21,181 18,708 22,664 5, ,233 12,684 7,591 17,300 57, ,076 18,247 5,408 86,525 4,925 5, , ,119 78, ,589 The movement in allowance for impairment in respect of trade receivables is as follows; Balance at 1 January 80,287 63,228 15,491 21,423 Impairment loss recognised during the year 25,459 57,666 6,974 7,669 Recoveries made (8,208) (32,871) (3,215) (9,750) Amounts written off (64,359) (7,736) (12,041) (3,851) Balance at 31 December 33,179 80,287 7,209 15,491 Cash and cash equivalents The Group held cash and cash equivalents of 361,616 (: 482,833). The cash and cash equivalents were held with reputable banks and financial institutions. (b) Liquidity risk Liquidity risk is the risk that the Group will not be able to meet its financial obligations as they fall due. The Group s approach to managing liquidity is to ensure, as far as possible, that it will always have sufficient liquidity to meet its liabilities when due, under both normal and stressed conditions, without incurring unacceptable losses or risking damage to the Group s reputation. The Group also monitors the level of expected cash flows from trade and other receivables together with expected cash outflows on trade and other payables. 124
125 Notes to the financial statements for the year ended 31 December (continued) 5. Financial Instruments Risk Management and Fair Values (Continued) (b) Liquidity risk (continued) The following are the contractual maturities of financial liabilities at the reporting date. The amounts are gross and undiscounted and include expected interest payments. (i) Group Contractual cash flows 31 December : Carrying months 1 2 0ver 2 Amount months 1 year years years Total Non derivative financial liabilities Finance lease liabilities Short term facilities 611, , ,485 Trade and other payables 526, , ,003 At 31 December ,137,261 1,234,653 1,234, December : Non derivative financial liabilities Finance lease liabilities 1, , ,196 Short term facilities 569, , ,560 Unclaimed dividends 6,776 6,776 6,776 Trade and other payables 257, , ,933 At 31 December 836, ,000 8, ,465 (ii) Company Contractual cash flows 31 December : Carrying months 1 2 0ver 2 Amount months 1 year years years Total Non derivative financial liabilities Short term facilities 611, , ,485 Trade and other payables 600, , ,015 At 31 December 1,211,123 1,308,500 1,308, December : Non derivative financial liabilities Short term facilities 569, , ,560 Unclaimed dividends 6,776 6,776 6,776 Trade and other payables 306, , ,049 At 31 December 882, ,609 6, ,
126 5. Financial Instruments Risk Management and Fair Values (Continued) (c) Market risk Notes to the financial statements for the year ended 31 December (continued) Market risk is the risk that changes in market prices such as foreign exchange and interest rates will affect the Group s income or value of its holding of financial instruments. The objective of market risk management is to manage and control market risk exposures within acceptable parameters, while optimizing return. (i) Foreign exchange risk Group exchange risk from recognised financial assets and liabilities The Group operates internationally and is exposed to foreign exchange risk arising from various currency exposures. Foreign exchange risk arises from recognised foreign currency assets and liabilities and net investments in foreign operations. Exposure to currency risk The summary quantitative data about the Group and company s exposure to currency risk as reported to the management of the Group is as follows; Financial instruments 31 December 31 December Financial assets Cash and cash equivalents Trade receivables USD 000 2,282 1,029 TZS 000 1,172,109 59,433 UGX ,940 1,990,868 BIF , ,230 USD 000 3, TZS 000 1,126,968 29,297 UGX , ,762 BIF , ,779 3,311 1,231,542 2,311, ,466 4,212 1,156, , ,509 Financial liabilities Finance lease liabilities Short term facilities Trade and other payables 2 (4,414) (1,410) (57,368) 7,745 (2,573) (21) (6,948) (660) (84,018) (187,761) (10,144) (5,822) (57,368) 7,745 (2,573) (7,629) (84,018) (187,761) (10,144) Net financial exposure (2,511) 1,174,174 2,319, ,893 (3,417) 1,072, , ,365 The following significant exchange rates have been applied during the year. Average rate Yearend spot rate USD TZS UGX BIF Sensitivity analysis A reasonably possible strengthening (weakening) of the key currencies against the Kenya shilling, would have affected the measurement of financial instruments denominated in foreign currency and affected the profit or loss by the amounts shown below. The analysis assumes that all other variables remain constant and ignores the impact of forecast sales and purchases. Profit or loss Effect in % movement Strengthening Weakening 31 December Currency USD TSH UGX BIF 3% 10% 5% 3% (4,782) 4,304 5,311 3,415 4,782 (4,304) (5,311) (3,415) December USD TSH UGX BIF 3% 10% 5% 3% (6,161) 4, ,010 6,161 (4,001) (755) (1,010)
127 Notes to the financial statements for the year ended 31 December (continued) 5. Financial Instruments Risk Management and Fair Values (Continued) (c) Market risk (continued) (i) Foreign exchange risk (continued) The Group does not hold any derivative financial instruments or financial assets measured at fair value through other comprehensive income. All exchange gains and losses arising from exposure to foreign exchange risks on its nonderivative financial instruments, are charged to profit or loss. The above sensitivity analysis would therefore have no direct effect on equity. Exchange risk from net investments in foreign operations The Group has subsidiaries in Uganda, Burundi and Tanzania. Therefore, the net investments in these subsidiaries are exposed to foreign exchange risk upon consolidation of the financial statements and any losses/ (gains) are charged / (credited) to other comprehensive income. The effect of changes in the exchange rates as at 31 December would have had on the translation reserve are shown below: Uganda At 31 December, if the Ugandan Shilling had weakened/strengthened by 5% (: 5%) against the Kenyan Shilling with all other variables held constant, the net (charge)/credit to the other comprehensive income would have been Kshs 8,074,470 (: Kshs 7,136,324) higher/lower. Burundi At 31 December, if the Burundi Franc had weakened/strengthened by 3% (: 3%) against the Kenyan Shilling with all other variables held constant, the net (charge)/credit to other comprehensive income would have been Kshs 847,661 (: Kshs 4,765,553) higher/lower. Tanzania At 31 December, if the Tanzanian Shilling had weakened/strengthened by 10% (: 10%) against the Kenyan Shilling with all other variables held constant, the net (charge)/credit to other comprehensive income would have been Kshs 22,282,478 (: Kshs 12,872,151) higher/lower. Company exchange risk from recognised financial assets and liabilities At 31 December, if the Kenya Shilling had weakened/strengthened by ( : 3%) against the US dollar with all other variables held constant, company profit for the year would have been Kshs 4,782,032 (: Kshs 7,163,539) higher/lower, mainly as a result of US dollar denominated financial instruments. The company does not hold any derivative financial instruments or financial assets measured at fair value through other comprehensive income. All exchange gains and losses arising from exposure to foreign exchange risks on its nonderivative financial instruments, are charged to profit or loss. The above sensitivity analysis would therefore have no direct effect on equity. (ii) Interest rate risk The Group s only interest bearing assets are fixed deposits, all of which are at a fixed rate. Cash and bank balances do not yield any interest. The Group also has borrowings at fixed rates. No limits are placed on the ratio of variable rate borrowing to fixed rate borrowing. Exposure to interest rate risk The interest rate profile of the Group s fixed interestbearing financial instruments as reported to management of the Group is as follows; Group Company Fixed rate instruments: Financial assets (note 22) Financial liabilities (note 24(a)) 170,403 (611,258) 260,685 (571,378) 170,403 (611,108) 260,685 (569,538) Exposure (440,855) (310,693) (440,705) (308,853) 127
128 Notes to the financial statements for the year ended 31 December (continued) 5. Financial Instruments Risk Management and Fair Values (Continued) (c) Market risk (continued) (ii) Interest rate risk (continued) Fair value sensitivity analysis on fixed rate instruments The Group does not account for its fixedrate financial assets and financial liabilities at fair value through profit or loss. Therefore a change in interest rates at the reporting date would have no effect on profit or loss or equity. (d) Capital management The board s policy is to maintain a strong capital base so as to maintain creditor and market confidence and to sustain future development of the business. The Group sets the amount of capital in proportion to risk. The Group manages the capital structure and makes adjustments to it in the light of changes in economic conditions and the risk characteristics of the underlying assets. In order to maintain or adjust the capital structure, the Group may adjust the amount of dividends paid to shareholders or adjust the amount of capital expenditure. The Group monitors capital on the basis of the debttoadjusted capital ratio, calculated as net debt to capital. Net debt is calculated as total debt (as shown in the statement of financial position) less cash and cash equivalents. Capital comprises all components of equity (i.e. share capital, retained earnings, and other reserves). The board s target is to maintain a gearing ratio not exceeding 10% for the Group and 20% for the company. Group Company Total borrowings (Note 23) Less: Cash and cash equivalents (Note 21) 611,258 (361,616) 571,378 (482,833) 611,108 (233,667) 569,538 (338,396) Net debt Total equity 249,642 2,536,644 88,545 2,679, ,441 1,931, ,142 2,105,605 Total capital 2,786,086 2,768,158 2,308,981 2,336,747 Gearing ratio 8.96% 3.20% 16.35% 9.89% (e) Fair values None of the Group s financial instruments are measured at fair value. The Group has not disclosed fair values for financial instruments not measured at fair value, such as shortterm trade receivables and payables and borrowings, because their carrying amounts are a reasonable estimation of their fair values. 6. Operating Segments (a) Basis of segmentation The Group identifies primary segments based on the dominant source, nature of risks and returns, geographical distribution and internal organization and management structure. The operating segments are the segments for which separate financial information is available and for which operating profit / loss is evaluated regularly by the Group CEO and executive management in deciding how to allocate resources and assess performance. The following summary describes the operations of each segment. Reportable segment Manufacturing and distribution Regional operations Yana Tyre Centre Rental business Operations Manufacture, buying and distribution of tyres, tubes and flaps Buying and distribution of tyres, tubes and flaps in the Eastern Africa Region Retailing of tyres, tubes and flaps and provision of tyre related services Letting of investment properties There is a significant level of integration between the Manufacturing and distribution and the Regional operations and Yana Tyre Centre segments. This includes inter segment sales of products as well as shared marketing and sales services. 128
129 Notes to the financial statements for the year ended 31 December (continued) 6. Operating Segments (Continued) (b) Information about reportable segments Information relating to each reportable segment is set out below; Reportable segments Manufacturing & distribution Regional operations Yana Tyre Centres Rental business Total External revenues Intersegment revenues 2,324, ,736 2,640, , , , , , , ,163 3,777, ,736 4,029, ,002 Segment revenue 3,184,980 3,408, , , , , , ,163 4,637,882 4,797,843 Segment profit/ (loss) before tax Income tax (198,558) 48, ,095 (23,512) (78,512) 22,513 8,746 1,283 95,516 (30,536) 109,947 (34,318) 118,045 (32,562) 110,748 (4,424) (63,509) 8, ,536 (60,971) Segment (loss)/ profit after tax (149,753) 263,583 (55,999) 10,029 64,980 75,629 85, ,324 (55,289) 455,565 Interest income Interest expense Depreciation and amortization Share of profit /(loss) of equity accounted investees. Other material non cash items Reversal of impairment losses 8,487 (52,155) (121,526) 3,822 7,790 (29,134) (78,951) , (403) (14,629) 136 (352) (3,932) 611 (10,382) (4,118) (5,962) (5,206) (6,271) 9,578 (52,558) (151,743) (296) 7,926 (29,486) (95,116) ,181 Segment assets Equity accounted investees Capital expenditure 3,442, ,026 (142,964) 3,370, ,026 (112,213) 747,079 (22,719) 752,366 (46,959) 379,619 (60,158) 148,312 (23,097) 238,743 (5,853) 336,201 (7,518) 4,807, ,026 (231,694) 4,606, ,026 (189,787) Segment liabilities (1,472,212) (1,166,483) (363,546) (322,521) (168,108) (169,779) (494) (10,107) (2,005,360) (1,668,890) 129
130 Notes to the financial statements for the year ended 31 December (continued) 6. Operating Segments (Continued) (c) Reconciliation of information on reportable segments to IFRS measures The Group s internal accounting policies and measures are consistent with IFRS. Therefore, the reconciling items are limited to items that are not allocated to reportable segments and intersegment eliminations, as opposed to a difference in the basis of preparation of the information. (i) Revenues Total revenues for reportable segments 4,637,882 4,797,842 Elimination of intersegment revenues (860,736) (768,001) Consolidated revenue (Note 8) 3,777,146 4,029,841 (ii) Profit before tax Segments profit before tax (63,509) 516,536 Profit not attributable to specific segments 256,503 Share of (loss)/ profit on equity accounted investee (296) 943 Intersegment dividend income (316,000) Intersegment unrealized profits (5,652) (1,461) Consolidated profit before tax (69,457) 456,521 (iii) Assets Total segment assets 4,807,442 4,606,961 Elimination of intersegment; Net unrealized profits on inventories (16,035) (9,152) Receivables (690,353) (685,956) Investment in subsidiaries (222,414) (222,414) Share of loss of equity accounted investees (21,248) (20,952) Consolidated total assets 3,857,392 3,668,487 (iv) Liabilities Total segment liabilities 2,005,360 1,668,890 Elimination of intersegment payables (684,412) (680,016) Consolidated total liabilities 1,320, ,874 (d) Geographic information The Group operates in various markets within the greater Eastern and Southern Africa markets. The manufacturing plant is domiciled in Kenya with other markets involved in distribution, retail and trading. The geographic information below analyses the Group s revenues and noncurrent assets by the country of domicile and other countries. In preparing the following information, segment revenue has been based on geographic location of customers and segment noncurrent assets were based on the geographic location of the assets. Noncurrent assets excludes financial instruments, employee benefits assets and deferred tax assets. 130
131 Notes to the financial statements for the year ended 31 December (continued) 6. Operating Segments (Continued) (d) Geographic information (continued) (i) Revenues Country of domicile Kenya 2,420,490 2,731,483 All foreign countries Uganda 227, ,403 Tanzania 520, ,137 Burundi 98,440 37,466 Others 510, ,352 Consolidated revenue 3,777,146 4,029,841 (ii) Noncurrent assets Country of domicile Kenya 773, ,224 All foreign countries Uganda 6,041 7,688 Tanzania 51,323 39,913 Burundi 42,650 23,040 Consolidated total noncurrent assets 873, ,865 (d) Major customer The Group and its entities do not place reliance on any particular customer for its operations. None of the Group s individual customers transacts revenues of 10% or more of the Group s turnover. 7. Critical Accounting Estimates and Judgements (a) Critical accounting estimates and assumptions In preparing the annual financial statements management is required to make estimates and assumptions that affect the amounts presented in the annual financial statements and related disclosures. Use of available information and application of judgement is inherent in the formation of estimates. Actual results in the future could differ from these estimates which may be material to the annual financial statements. Significant estimates and judgements include: Impairment The Group assesses its trade receivables and other financial and nonfinancial assets for impairment at each reporting date. In determining whether an impairment loss should be recorded in the profit or loss, the Group makes assumptions underlying recoverable amounts as to whether there is observable data indicating a measurable decrease in the estimated future cash flows from the asset. Measurement of fair values A number of the Group s accounting policies and disclosures require the measurement of fair values for both financial and nonfinancial assets and liabilities. The Group has established a framework with respect to measurement of fair values. The finance team regularly reviews significant unobservable inputs and valuation adjustments. If third party information is used to measure fair values, the team assesses the evidence obtained from third parties to support the conclusion that such valuations meet the requirements of IFRS including the fair value hierarchy in which such valuation should be classified. 131
132 Notes to the financial statements for the year ended 31 December (continued) 7. Critical Accounting Estimates and Judgements (Continued) (a) Critical accounting estimates and assumptions (continued) Taxation Judgement is required in determining the liability for income taxes due to the complexity of tax legislations. There are many transactions and calculations for which ultimate tax determination is uncertain during the ordinary course of business. The company recognises liabilities for anticipated tax audit issues based on estimates of whether additional taxes will be due. Where the final tax outcome of these matters is different from the amounts that were initially recorded, such differences will impact the income tax and deferred tax liability in the period in which such determination is made. The company recognises the net future tax benefit relating to deferred tax assets to the extent that it is probable that the deductible temporary differences will reverse in the foreseeable future. Assessing the recoverability of deferred tax assets requires the company to make significant estimates related to expectations of future taxable income. Estimates of future taxable income are based on forecast cash flows from operations and the application of existing tax laws in each jurisdiction. To the extent that future cash flows and taxable income differ significantly from estimates, the ability of the company to realise the net deferred tax assets recorded at the reporting date could be impacted. Useful lives and residual values of property, plant and equipment The company tests annually whether the useful life and residual value estimates were appropriate and in accordance with its accounting policy. Useful lives and residual values of property and equipment have been determined based on previous experience and anticipated disposal values when the assets are disposed. Investment property Critical estimates are made by the directors in determining depreciation rates for investment property. (b) Critical Judgements in applying the Group s accounting policies In the process of applying the company s accounting policies, management has made judgements which are noted in the following notes: (i) Note 3 (a): Consolidation whether the Group has de facto control over an investee; (ii) Note 29; Leases establishing whether an arrangement contains a lease as well as the lease classification. 8. Revenue Group Company Sales of manufactured goods Sales of imported goods Rendering of services Discounts, claims and warranties Investment property rentals 3,082, ,347 14,218 (31,527) 148,928 3,355, ,200 10,283 (21,374) 136,163 2,862, , (22,747) 96,247 3,135, , (18,140) 93,856 3,777,146 4,029,841 3,281,226 3,502,
133 Notes to the financial statements for the year ended 31 December (continued) 9. Other Income and Expenses (a) Other income Group Company Gain on sale of leasehold land Gain on sale of property, plant and equipment Other income 3,002 41, ,282 1,221 41,047 2,998 34, ,282 1,221 19,895 44, ,550 37, ,398 The gain on sale of leasehold land in, of 255,282 represents gains arising from the disposal of part of the Group s holding in leasehold land to a third party. (b) Expenses by function (i) Cost of sales Group Company Prime costs Cost of raw materials used Changes in inventories of finished goods Direct labour 1,371,496 (113,855) 146,954 1,590,010 (99,531) 137,218 1,371,496 (113,855) 146,954 1,590,010 (99,531) 137,218 1,404,595 1,627,697 1,404,595 1,627,697 Factory overheads Indirect labour Factory maintenance Energy Depreciation Consumables Transport and insurance Others 263, , , , ,688 22,049 15, , , ,179 59, ,766 23,325 26, , , , , ,688 22,049 15, , , ,179 49, ,766 23,325 26,676 1,053, ,338 1,040, ,752 Cost of imported trading goods sold 382, , , ,689 Total cost of sales 2,840,635 2,951,719 2,706,110 2,809,
134 Notes to the financial statements for the year ended 31 December (continued) (b) Expenses by function (continued) (ii) Operating expenses Group Company Selling and distribution expenses Distribution costs Selling expenses Marketing and sales promotions 33, , ,444 26, , ,892 30,385 95,919 76,165 25, ,480 84, , , , ,261 Administrative expenses Indirect staff costs Other administrative expenses 298, , ,510 98, , , ,533 71, , , , ,252 Other operating expenses Legal and professional fees Travel and vehicle maintenance Establishment expenses Bank charges and fees 72,901 27,240 80,383 20,265 53,375 51,290 75,930 25,485 51,752 17,725 53,974 17,268 38,352 26,670 39,311 23, , , , ,870 (c) Expenses by nature Group Company Cost of raw materials used Changes in inventories of finished goods Cost of imported trading goods sold Employee benefits expense (note 9(d)) Audit fees Bank charges Consumables Depreciation and amortization Assets write back General expenses Legal and professional fees Advertising and promotions Electricity, water and fuel Repairs and maintenance Sales commissions and bonuses Rent and rates Telephone and postage Transport, travelling and insurance Others 1,371,496 (113,855) 382, ,202 5,900 20, , ,743 97,585 50, , , ,735 49,802 79,416 30, ,036 55,114 1,590,010 (99,531) 356, ,531 5,730 25, ,361 95,116 (13,181) 116,505 35, , , , ,070 72,046 24, ,923 13,683 1,371,496 (113,855) 260, ,305 3,840 17, , ,614 71,702 36,783 75, , ,337 29,510 5,879 19,251 88,684 54,806 1,590,010 (99,531) 222, ,945 3,800 23, ,352 79,138 (13,181) 95,303 25,243 85, , ,364 79,000 5,663 17,302 92,714 19,254 3,847,704 3,866,692 3,387,023 3,444,
135 Notes to the financial statements for the year ended 31 December (continued) 9. Other Income and Expenses (Continued) (d) Employee benefits expense Group Company Salaries and wages Allowances and other benefits Movement in leave pay accrual Defined Contribution scheme National Social Security Fund Expenses related to defined benefit plans (Note 25) 450, ,299 (1,176) 11,682 4,974 31, , ,213 (4,801) 11,004 3,938 26, , ,218 (1,584) 10,922 1,744 31, , ,162 (3,806) 10,301 1,103 26,308 Note 9 (c) 700, , , , Net Finance (Cost)/ Income Group Company Finance income Interest income Dividend receivable Foreign exchange gains 9,578 31,938 7,926 29,379 8,487 20,276 7, ,000 11,653 Finance cost Foreign exchange losses Interest expense on borrowings 41,516 32,495 52,558 37,305 12,940 29,486 28,763 15,298 52, ,443 10,190 29,134 85,053 42,426 67,453 39,324 Net finance (cost)/ income (43,537) (5,121) (38,690) 200, Income Taxes (a) Amounts recognised in profit or loss Group Company Current tax expense Current income tax Under/ (over) provision of current tax in prior years 55,921 (1,285) 62,114 (5,474) 19,076 (1,322) 20,027 54,636 56,640 17,754 20,027 Deferred tax expense: (Note 24) Deferred income tax Over provision of deferred tax in prior years (57,587) 423 7,623 (8,931) (39,398) 6,151 (126) (57,164) (1,308) (39,398) 6,025 Income tax (credit)/ expense (2,528) 55,332 (21,644) 26,
136 Income tax expense Notes to the financial statements for the year ended 31 December (continued) The Group income tax expense excludes the Group s share of income tax expense/ (credit) of its equity accounted investees of (1,894) : : (660), which has been included in share of profit/(loss) of equity accounted investees, net of tax. (b) Amounts recognised in other comprehensive income 31 December 31 December Group Before income tax Income tax charge Net of income tax Before income tax Income tax charge Net of income tax Currency Translation differences for foreign operations 12,510 12,510 29,147 29,147 Remeasurements of defined benefits liability (7,496) 2,249 (5,247) (11,228) 3,368 (7,860) 5,014 2,249 7,263 17,919 3,368 21,287 Company Remeasurements of defined benefits liability (7,496) 2,249 (5,247) (11,228) 3,368 (7,860) (c) Reconciliation of effective tax rate The tax on the Group s and the company s (loss)/ profit before income tax differs from the theoretical amount that would arise using the statutory income tax rate as follows: Group Rate % Rate % (Loss) / profit before income tax (69,457) 456,521 Tax calculated at domestic rates applicable to profits in the respective countries 30% ( 30%) Tax effect of: Income not subject to income tax Share of (profit)/loss of equity accounted investee Expenses not deductible for income tax purposes Investment property transfer writeback Over provision of current income tax in prior years Under/(over) provision of deferred income tax in prior years Effect of lower tax rates in Sameer EPZ Ltd 30.00% 0.00% 2.52% (31.95%) 0.53% 1.85% (0.61%) 1.30% (20,837) (1,748) 22,192 (371) (1,285) 423 (902) 30.00% (17.38%) (0.06%) 3.31% 0.00% (1.20%) (1.96%) (0.59%) 136,956 (79,342) (283) 15,100 (5,474) (8,931) (2,694) Income tax (credit)/ expense 3.64% (2,528) 12.12% 55,
137 Notes to the financial statements for the year ended 31 December (continued) 11. Income Taxes (Continued) (c) Reconciliation of effective tax rate (continued) Company Rate % Rate % (Loss)/ profit before income tax Tax calculated at domestic rates applicable to profits in the respective countries 30% ( 30%) Tax effect of: Income not subject to income tax Expenses not deductible for income tax purposes Over provision of current income tax in prior years Over provision of deferred income tax in prior years 30.00% 0.00% (11.00)% 1.24% 0.00% (106,961) (32,088) 11,766 (1,322) 30.00% (27.20)% 2.10% 0.00% (0.02)% 534, ,289 (145,342) 11,231 (126) Income tax (credit)/ expense 20.24% (21,644) 4.88% 26,052 (d) Reconciliation of carrying amounts Group Company Net (asset)/liability at start of year Charge for the year profit or loss (note 11(a)) other comprehensive (note 11(b)) Income tax paid (74,555) 54,636 (2,249) (33,201) (6,783) 56,640 (3,368) (121,044) (35,052) 17,754 (2,249) (2,322) 8,302 20,027 (3,368) (60,013) Net asset at end of year (55,369) (74,555) (21,869) (35,052) Represented by: Income tax assets Income tax liabilities (56,103) 734 (75,171) 616 (21,869) (35,052) (55,369) (74,555) (21,869) (35,052) The Group believes that its accruals for current tax liabilities / assets are adequate for all open tax years based on its assessment of various factors, including interpretations of tax laws and prior experience. 12. Earnings Per Share (a) Basic earnings per share Basic earnings per share are calculated by dividing the profit attributable to equity holders of the Company by the weighted average number of ordinary shares in issue during the year. (Loss)/ profit attributable to equity holders of the Company () Weighted average number of ordinary shares in issue ( 000) Basic earnings per share (Kshs) (66,929) 278,342 (0.24) 401, , (b) Diluted earnings per share The calculation of diluted earnings per share is based on profit attributable to ordinary shareholders and the weighted average number of shares outstanding after adjustment for the effect of all dilutive potential ordinary shares. There were no potentially dilutive shares outstanding at 31 December or. Diluted earnings per share are therefore the same as basic earnings per share. 137
138 Notes to the financial statements for the year ended 31 December (continued) 13. Property, Plant and Equipment (a) Reconciliation of carrying amount (i) Group : Cost At 1 January Additions Assets not previously recognised Transfers from capital work in progress Transfers from intangibles (Note 14) Currency translation Disposals Buildings 310,234 30,765 Plant & machinery 2,275, ,993 13,758 1,429 Motor vehicles 62,890 11, (746) (8,858) Furniture, &fittings 258,635 35,162 10,995 15, Capital work in, progress 22,079 5,559 (24,753) (185) Total 2,929, , ,315 1,111 (8,858) At 31 December 340,999 2,426,955 66, ,720 2,700 3,157,425 Accumulated depreciation At 1 January Charge for the year Assets not previously recognized Transfers from intangibles (Note 14) Currency translation Disposals 206,608 10,659 2,068,899 85,744 1,263 34,922 9, (919) (8,858) 183,217 22,675 12, ,493, , , (8,858) At 31 December 217,267 2,155,906 35, ,777 2,627,766 Net book value at 31 December 123, ,049 30, ,943 2, ,659 : Cost At 1 January Additions Assets not previously recognised Transfers Currency translation Disposals 310,234 2,168,978 71,282 10,475 25,539 (499) 44,778 21,265 1,865 2,422 (7,440) 222,372 27,795 2,706 3,209 2,553 10,954 41,438 (30,613) 328 (28) 2,757, ,780 13,181 4,804 (7,468) At 31 December 310,234 2,275,775 62, ,635 22,079 2,929,613 Accumulated depreciation At 1 January Charge for the year Currency translation Disposals 195,855 10,753 2,029,242 40,538 (881) 34,137 4,368 1,437 (5,020) 163,823 18,252 1,142 2,423,057 73,911 1,698 (5,020) At 31 December Net book value at 31 December 206, ,626 2,068, ,876 34,922 27, ,217 75,418 22,079 2,493, ,
139 Notes to the financial statements for the year ended 31 December (continued) 13. Property, Plant and Equipment (a) Reconciliation of carrying amount (ii) Company : Cost At 1 January Additions Transfers from capital work in progress Transfers from intangibles (Note 14) Disposals Buildings 310,234 8,297 Plant & machinery 2,177, ,749 8,237 Motor vehicles 23,491 2,685 (8,858) Furniture, &fittings 212,611 5, ,315 Capital work in, progress 3,270 5,559 (8,829) Total 2,727, ,021 15,315 (8,858) At 31 December 318,531 2,299,485 17, ,249 2,869,583 Accumulated depreciation At 1 January Charge for the year Transfers from intangibles (Note 14) Disposals 206,608 10,432 2,009,470 76,020 20,602 1,043 (8,858) 164,058 16,042 12,570 2,400, ,537 12,570 (8,858) At 31 December 217,040 2,085,490 12, ,670 2,507,987 Net book value at 31 December 101, ,995 4,531 41, ,596 : Cost At 1 January Additions Write offs/ assets not previously recognised Transfers Intercompany transfer Disposals 310,234 2,093,102 46,518 10,475 27,404 27,821 3,110 (7,440) 195,624 11,621 2,706 3,209 (549) 10,925 22,958 (30,613) 2,637,706 84,207 13,181 (549) (7,440) At 31 December 310,234 2,177,499 23, ,611 3,270 2,727,105 Depreciation At 1 January Charge for the year Intercompany transfers Disposals 195,855 10,753 1,975,563 33,907 24, (5,020) 149,082 15,041 (65) 2,345,233 60,590 (65) (5,020) At 31 December Net book value at 31 December 206, ,626 2,009, ,029 20,602 2, ,058 48,553 3,270 2,400, ,
140 Notes to the financial statements for the year ended 31 December (continued) 13. Property, Plant and Equipment (Continued) (b) Change in estimates The policy of the Group is to review accounting estimates annually or when circumstances on which estimates used changes or as a result of new information or more experience. A team of technical experts within the Group reviewed the useful lives and residual values of certain items of property, plant and equipment as at 31st December. As a result of this review the Group revised the useful lives of those assets. A review by the team in confirmed that no additional information was gained during the year to warrant any revisions. (c) Impairment loss and subsequent reversal In 2012, during a physical verification and tagging exercise involving items of property, plant and equipment, items which could not be physically accounted for, were written off. During the year, some of the assets previously written off amounting to 13,181 were identified in various locations and were subsequently verified and tagged. Additional assets with a cost of Ksh though fully depreciated were capitalised in the current year. These assets have been reinstated in the respective periods as the amounts were not considered material to warrant retrospective application. (d) Reclassification In, the Group in accordance with its accounting policies reclassified intangible assets previously accounted for under property, plant and equipment to the correct asset class. 14. Intangible Assets Computer software (a) Reconciliation of carrying amount Group Company Cost At 1 January Transfer to property, plant and equipment (note 13 (a) & (b)) Additions 136,163 (15,315) 6, ,156 28, ,163 (15,315) 6, ,156 28,007 At 31 December 127, , , ,163 Amortization At 1 January Transfer to property, plant and equipment (note 13 (a) & (b)) 74,468 (12,570) 59,526 74,468 (12,570) 59,526 Charge for the year 18,778 14,942 18,768 14,942 At 31 December 80,676 74,468 80,666 74,468 Carrying amount at 31 December 47,115 61,695 46,777 61,695 (b) Classification The Group accounts for computer software development and licenses costs that are not an integral part of the related hardware as intangible assets, which are amortized over their useful lives. All other computer software that form an integral part of the related hardware, are included in property plant and equipment. Up to financial year, computer software development and licenses costs were included in property, plant and equipment and not disclosed separately. This was changed in to comply with disclosure requirements under IAS
141 Notes to the financial statements for the year ended 31 December (continued) 15. Investment Property (a) Reconciliation of carrying amount Group Company At start of year Transfer from leasehold land (Note 16) Additions Disposals Depreciation 179,197 5,466 (4,172) 185, (18) (6,260) 102,424 (1,306) 105, (18) (3,603) At end of year 180, , , ,424 Comprising Cost Accumulated depreciation 256,295 (75,804) 250,829 (71,632) 144,772 (43,654) 144,772 (42,348) At end of year 180, , , ,424 Investment property comprises: (i) Leasehold land held for future development or capital appreciation; (ii) Residential houses (iii) Commercial properties Residential and commercial properties are leased to third parties. Each of the leases contains an initial lease period of 5 years with rent escalation provided for every 2 years. No contingent rents are charged. Further details on leases are included in Note 29. Undeveloped land is held for value appreciation or for future development of investment properties. During the year to 31 December, a portion of the leasehold land interest was sold to a third party for a consideration of Kshs million. The profit from the sale was included in other income (See Note 9(a)). (b) Rental income and operating expenses The analysis of rental income and operating expenses, including repairs and maintenance, attributable to investment property is shown below: Group Company Rental income 148, ,163 96,247 93,856 Operating expenses Staff costs Administrative expenses Security expenses Legal and professional fees Repairs and maintenance Depreciation Net other expenses/ (income) 4,398 12,131 6,571 2,693 1,744 5,206 (1,860) 4,201 2,687 4,379 3,379 2,920 6,656 4,286 2,538 1,973 4, ,459 2,429 1,578 2,573 1,985 1,715 3,910 (30) 30,883 28,508 10,653 14,160 Net rental Income 118, ,655 85,594 79,
142 Notes to the financial statements for the year ended 31 December (continued) 15. Investment Property (Continued) (c) Measurement of fair value (i) Fair value hierarchy The fair value of investment property is determined by external, independent property valuers, having appropriate recognised professional qualifications every 3 years. In the intervening periods between valuations, management adjusts fair values on the basis of annual housing index reports provided by professional consultants. During the year, management used the The Hass Property Index report provided by Hass Consult a Real Estate Consultancy firm in association with Investment Managers Stanlib. The annual growth rate used to value the Group s investment properties as at 31 December, was 8.4%. The fair value measurement of Group 3,895 ( 3,593); Company 3,340 ( Kshs 000 3,127); has been categorized as level 3 fair value based on the inputs to the valuation techniques used. (ii) Level 3 fair value The Group accounts for its investment property at cost less accumulated depreciation and any impairment losses. The fair value gains which would have been recognised in profit or loss had the Group accounted for its investment property at fair values would have been as follows: Group Company Fair values Commercial properties Leasehold land 1,599,984 2,294,828 1,476,000 2,117,000 1,094,840 2,294,828 1,010,000 2,117,000 Carrying amounts Commercial properties Leasehold land 3,894, , ,593, , ,389, , ,127, , , , , ,424 Fair value gains not recognised in profit or loss 3,714,321 3,413,803 3,288,550 3,024,
143 Notes to the financial statements for the year ended 31 December (continued) 15. Investment Property (Continued) (c) Measurement of fair value (continued) (iii) Valuation techniques and significant unobservable inputs. The table below shows the valuation techniques used in measuring fair vales as well as significant unobservable inputs used. Valuation technique (a) Investment property Discounted cash flows: The valuation model considers the present value of net cash flows to be generated from the property taking into account expected rental growth, occupancy rates and other costs not paid by tenants. The net cash flows are discounted using the risk adjusted discount rate. Significant unobservable inputs 1. Expected market rental growth 3.75% 6% 2. Occupancy rates (90% 95%) 3. Riskadjusted discount rate (9%) Interrelationships between unobservable inputs and fair value measurements The estimated fair values would increase / ( decrease) if:; 1. Expected rental growth were higher /(lower) 2. Occupancy rates were higher / (lower) 3. Riskadjusted discount rate was lower / (higher) (b) Leasehold land held for value appreciation and development. Market approach: The valuation model uses prices and other relevant information generated by market transactions involving identical or similar assets. The fair value is determined as the price that would be paid to sell the land in an orderly transaction to market participants. 1. Property prices in the locality 2. Infrastructure developments The estimated fair values would increase / (decrease); 1. If property prices were higher / (lower) 2. Increase with improvements in infrastructure. 16. Prepaid Operating Lease Rentals (a) Reconciliation of carrying amount Group and Company At start of year Transfer to investment property Amortization charge for the year At end of year 364 (3) (368) (4) 364 (b) Classification The Group classifies leasehold under development of factory buildings, administration block, roads and other buildings as prepaid operating leases. Undeveloped leasehold land held for future development or value appreciation is accounted for under investment property. 143
144 Notes to the financial statements for the year ended 31 December (continued) 17. Investment in Subsidiaries Company (a) Investment and structure The company s interest in its subsidiaries, all of which are unlisted and all of which have the same year end as the parent company, were as follows: Country of incorporation % interest held Sameer Africa (Uganda) Limited Sameer Africa (Tanzania) Limited Yana Tyre Centre Limited Sameer Industrial Park Limited Sameer Africa (Burundi) Limited Taqwa Trading Limited Uganda Tanzania Kenya Kenya Burundi Kenya 100% 100% 100% 100% 100% 100% 26, , ,000 1,728 35,000 26, , ,000 1,728 35, , ,414 Less: Provision for impairment ( 35,000) ( 35,000) Carrying amount 158, ,414 (b) Incorporation of new subsidiary In, the Group invested in a new subsidiary Sameer Africa (Burundi) Limited domiciled in the Republic of Burundi. The subsidiary principal business is the sales of tyres, tubes and flaps in the Burundi market as well as the neighbouring Rwanda and Eastern Congo markets. The subsidiary reported a loss before tax equivalent to 20,635 ( : 22,649) The set up costs charged to profit or loss are shown below: Pre operation staff costs Pre operation rentals Legal, regulatory and company registration Other setup expenses Total set up costs 1,425 6,178 1,555 4,160 13,318 (c) Nature and extent of significant restrictions The company does not have any significant restrictions on any of its subsidiary companies, whether contractual, statutory or regulatory that limits its ability to access or use the assets and settle liabilities of the Group. (d) Nature of risks associated with subsidiaries The Group has no contractual arrangements that require the parent or its subsidiaries to provide financial support to a consolidated structured entity. In incorporating the new subsidiary Sameer Africa (Burundi) Limited, in addition to its initial investment, the parent company provided initial working capital support as follows: Setup expenses Deposits paid Noncurrent assets purchased Total financial support 13,318 2,755 17,304 33,
145 Notes to the financial statements for the year ended 31 December (continued) 18. Equity Accounted Investees The following table summarizes the carrying amounts and the Group s share of profit or loss and other comprehensive income of its equity accounted investees as well as the carrying amounts in the financial statements of the company. Group Company Carrying amount Interest in associates (Note 18a) Interest in joint venture (Note 18b) 119,895 (4,118) 116, , , , , , ,026 Reconciliation of carrying amount Group Associate Joint venture Total Total At 1 January Share of profit/ (loss) 116,073 3,822 (4,118) 116,073 (296) 115, At end of year 119,895 (4,118) 115, ,073 (a) Associate The Group s has an interest of 25% in the equity and voting rights of its principal associate Sameer Business Park Limited. Sameer Business Park Limited is incorporated in Kenya and is unlisted. The principal place of business is along Mombasa Road, Nairobi. The principal business of the associate is the letting of investment properties to third parties. The Group accounts for its investment in associate using the equity method. The investment in associate is measured at cost less any impairment losses in the separate financial statements of the company. (i) Carrying amount and share of profit or loss and other comprehensive income Group Company At start of year Share of profit from continuing operations (net of tax) 116,073 3, , , ,026 At end of year 119, , , ,
146 Notes to the financial statements for the year ended 31 December (continued) 18. Equity Accounted Investees (Continued) (a) Associate (continued) (ii) Summarised financial information The summarized financial information of the associate is set out below; Financial position Noncurrent assets Current assets Current Liabilities Noncurrent liabilities Net assets Profit or loss and other comprehensive income Revenues Expenses Profit after tax Other comprehensive income Total comprehensive income 2,237, ,553 (141,766) (2,000,934) 479, ,931 (195,641) 15,290 15,290 2,216, ,358 (109,006) (2,004,446) 464, ,808 (134,036) 3,772 3,772 (b) Joint venture Yana Tyre Centre Galleria is the only joint arrangement in which the Group participates. The Group s subsidiary, Yana Tyre Centre Limited and Discount Tyres Limited entered into a joint arrangement to operate a tyre centre within Galleria Mall in the upmarket area of Karen, Nairobi County. The joint venture is structured as a separate business in which the Group has residual interest in the net assets and / or obligations to the residual liabilities of the joint arrangement. In accordance with the agreement, both the Group and the other investor leased initial building structures and operating equipment to the joint venture at an annual rental charge of 20% of the value of the assets. There was no initial direct capital investment by either party and the agreed interest in the joint venture by either party is 50%. The daytoday management and operation of the joint venture business is vested on the Group at an agreed management fee pegged on sales. Profits before tax are shared equally between the parties but only after recouping any prior period losses. Any losses are absorbed by the Group except losses incurred in the first six (6) months of operation which are shared equally. Any working capital requirements by the joint venture are financed by the Group at interest rates equivalent to rates charged to the Group by third party lenders. The joint venture operated for 11 months during the year. The following table summarizes the financial information of the joint venture as included in its own financial statements as well as the Group s residual interest in the joint venture and of its share of profit or loss. 146
147 Notes to the financial statements for the year ended 31 December (continued) 18. Equity Accounted Investees (Continued) (b) Joint venture (continued) Group Percentage of ownership Financial position Non current assets Current assets (including cash and cash equivalents : 3,204) Noncurrent Liabilities (borrowings from the Group) Current liabilities Net liabilities 100% Group s share of net obligations in the joint venture 50% 3,858 9,056 (10,317) (8,873) (6,276) (4,118) Profit or loss and other comprehensive income Sales Cost of sales Staff costs Depreciation Interest expense Lease charges Management fees Other expenses Income tax credit Loss and total comprehensive income 100% Group s share of loss and total comprehensive income 26,681 (13,922) (4,574) (143) (611) (2,833) (1,868) (11,674) 2,668 (6,276) (4,118) 147
148 Notes to the financial statements for the year ended 31 December (continued) 19. Inventories Group Company Raw materials Stores and supplies Work in progress Finished goods 270, ,741 30, , , ,202 32, , , ,532 30, , , ,139 32, ,213 1,512,888 1,268,150 1,238,627 1,059,011 The amounts of inventories recognised as expense during the period are as shown below: Group Company Cost of raw materials used Changes in inventories of work in progress and finished goods Cost of trading goods sold 1,371,496 (113,855) 382,168 1,590,010 (99,531) 354,684 1,371,496 (113,855) 260,947 1,590,010 (99,531) 222,689 1,639,809 1,845,163 1,518,588 1,713,168 The Company s borrowings are secured through a first ranking debenture over the trade receivables and inventories of the company for 926,100 shared pari passu between the company s principal bankers (Note 23). 20. Receivables and Prepayments Group Company Trade receivables Less: Provision for impairment 597,908 (33,179) 602,102 (80,287) 339,735 (7,209) 296,873 (15,491) Amounts due from related companies (Note 32) Other receivables Receivables from subsidiaries (Note 32) 564,729 23, , ,815 4, , ,526 6, , , ,382 3, , ,020 Trade and other receivables Prepayments 806, , , , , , , ,005 Receivables and prepayments 941, , , ,916 The Company s borrowings are secured through a first ranking debenture over the trade receivables and inventories of the company for 926,100 shared pari passu between the company s principal bankers (Note 23). 148
149 Notes to the financial statements for the year ended 31 December (continued) 21. Cash and Cash Equivalents Cash and cash equivalents as shown in the statements of financial position and statements of cash flows comprise the following; Group Company Cash at bank and in hand Call deposits 191, , , ,685 63, ,403 77, ,685 Cash and bank balances in statements of financial position 361, , , ,396 Short term facilities used for cash management (Note 23) (611,108) (569,538) (611,108) (569,538) Cash and cash equivalents in the statements of cash flows (249,492) (86,705) (377,441) (231,142) 22. Capital and Reserves (a) Ordinary share capital Holders of ordinary shares are entitled to dividends as declared from time to time and are entitled to one vote per share at the General Meetings of the company. All ordinary shares rank pari passu with regard to the company s residual assets. Authorised ordinary shares Authorised par value ( Kshs each) Authorised share capital () Issued and fully paid up capital Issued ordinary shares Issued par value ( Kshs each) Issued and fully paid up capital () 300,000, ,500, ,342, ,391, ,000, ,500, ,342, ,391,712 (b) Nature and purpose of reserves (i) Translation reserve The translation reserve comprise all foreign currency differences arising from the translation of financial statements of foreign operations as well as the effective portion of foreign currency arising from hedges of a net investment in a foreign operation. (ii) Retained earnings Retained earnings comprises accumulated profit or loss from continuing operations and other comprehensive income net of any dividends declared and paid out to ordinary shareholders. Retained earnings represent amounts available to the shareholders of the Group and are usually utilised to finance business activity. (iii) Proposed dividends Proposed dividends are classified as a separate component of equity in the statement of changes in equity through a transfer from retained earnings. They are transferred to the dividends payable account once approved by shareholders in a general meeting. 149
150 Notes to the financial statements for the year ended 31 December (continued) 22. Capital and Reserves (Continued) (c) Dividends The following dividends were declared and paid by the company during the year. Declared and paid Kshs 0.30 per qualifying ordinary share (: Kshs 0.25) 83,503 69,586 After the reporting date, the following dividends were proposed by the board of directors. Proposed Kshs Nil per qualifying ordinary share (: Kshs 0.30) 83,503 Payment of dividends is subject to withholding tax at a rate of 5% for resident individuals and companies and 10% for nonresident individuals and companies. Dividends paid to resident shareholders who hold equity interest of 12.5% or more in the company are not subject to withholding tax on payment. 23. Borrowings (a) Carrying amounts Group Company Noncurrent Finance lease liabilities 142 Current Short term facilities Import loans Finance lease liabilities 611, ,538 1, , , , , , ,538 Total borrowings 611, , , ,
151 Notes to the financial statements for the year ended 31 December (continued) 23. Borrowings (Continued) (b) Terms and repayment schedule 31 December 31 December Group Currency Nominal interest Maturity Face value Carrying amount Face value Carrying amount Import Financing loan NIC Import Financing loan NIC Import Financing loan SCB Import Financing loan CfC Stanbic Bank ovedraft NIC Finance lease liabilities EUR USD USD USD USD USD 9.63% 8.11% 7.60% 5.32% 8.00% 10% , , , , , , , , , , ,243 2,196 4, , ,204 1, , , , , December 31 December Company Currency Nominal interest Maturity Face value Carrying amount Face value Carrying amount Import Financing loan NIC Import Financing loan NIC Import Financing loan SCB Import Financing loan CfC Stanbic Bank overdraft NIC EUR USD USD USD USD 9.63% 9.63% 7.60% 5.32% 8.00% , , , ,650 96, , , ,336 4, , ,243 4, , , , , , ,538 (c) Finance lease liabilities Group Finance lease liabilities are payable as follows; Future minimum lease payments Interest Present value of future minimum lease payments Less than 1 year Between 1 and 2 years 165 2, , , ,840 The Company s borrowings are secured through a first ranking debenture over the trade receivables and inventories of the company for 926,100 shared pari passu between NIC bank limited and Standard Chartered Bank of Kenya Limited. The weighted average effective interest rates at the yearend were: Bank overdrafts USD Bank borrowings Kshs % % In the opinion of the directors, the carrying amounts of borrowings approximate to their fair values. Fair values are based on discounted cash flows using a discount rate based upon the borrowing rate that directors expect would be available to the Group at the statement of financial position date. 151
152 Notes to the financial statements for the year ended 31 December (continued) 24. Deferred Income Tax (a) Carrying amounts Deferred income tax is calculated using the enacted income tax rates of 25% and 30% that apply to the different Group companies. The movement on the deferred income tax account is as follows: Group Company At start of year (Charge)/ credit to statement of profit or loss (Note 11(a)) Prior year (over)/ under provision Currency translation differences (49,319) (57,587) 423 (786) (47,478) 7,623 (8,931) (533) (30,135) (39,398) (36,160) 6,151 (126) At end of year (107,269) (49,319) (69,533) (30,135) As disclosed on the statement of financial position: Deferred income tax assets Deferred income tax liabilities (111,878) 4,609 (52,660) 3,341 (69,533) (30,135) (107,269) (49,319) (69,533) (30,135) (b) Movement in deferred Income tax balances Group Deferred income tax asset Property, plant and equipment and intangibles Investment property Provisions Tax losses Exchange differences Balance at 1 January 15,127 49,893 (64,218) (53,436) (26) Recognised in profit or loss (16,890) 14,035 (11,506) (46,795) 2,726 Prior year (over)/ under provisions (2) Exchange differences 70 (228) (652) 24 Balance at 31 December (1,695) 63,928 (75,952) (100,883) 2,724 (52,660) (58,430) (2) (786) (111,878) Deferred income tax liability Investment property Provisions Exchange differences 3, ,494 (768) 117 (129) , , ,609 Net deferred income tax asset (49,319) (57,587) 423 (786) (107,269) Group Deferred income tax asset Property, plant and equipment and intangibles Investment property Provisions Tax losses Exchange differences 16,622 (71,114) (727) 4, ,592 4,863 (20,385) (4,800) (19) 23, (32,377) (2,469) 1, ,127 49,893 (64,218) (53,436) (26) (50,459) 7,263 (8,931) (533) (52,660) Deferred income tax liability Investment property Provisions Exchange differences 3,006 (25) , , ,341 Net deferred income tax asset (47,478) 7,623 (8,931) (533) (49,319) 152
153 Notes to the financial statements for the year ended 31 December (continued) 24. Deferred Income Tax (Continued) (b) Movement in deferred tax balances (continued) Company Deferred income tax asset Property, plant and equipment and intangibles Investment property Provisions Tax losses Exchange differences Balance at 1 January 14,526 14,049 (57,541) (1,169) Recognised in profit or loss (18,714) 1,204 (13,060) (9,931) 1,103 Prior year under/ (over) provisions Balance at 31 December (4,188) 15,253 (70,601) (9,931) (66) Deferred income tax asset Property, plant and equipment and intangibles Investment property Provisions Exchange differences (30,135) 15,079 (55,725) 4,486 (39,398) (553) 14,049 (1,690) (5,655) (126) (69,533) 14,526 14,049 (57,541) (1,169) (36,160) 6,151 (126) (30,135) (c) Unrecognised deferred tax liabilities The Group has recognised all deferred tax liabilities arising from temporary differences associated with the Group s investments in subsidiaries and equity accounted investees. (d) Unrecognised deferred tax assets Included in the consolidated deferred tax asset, is the Group s share of deferred tax asset of its associate amounting to 6,821 ( 8,569). With improved occupancy rates of the investee s investment property, the directors are confident that future taxable profits will be generated by the investee to offset the tax losses. The Group has recognised all deferred tax assets attributable to its subsidiaries. 25. Retirement Benefit Obligations Group and Company (a) Carrying amount Present value of unfunded obligations: Active members Transferred to management Outstanding benefits Net defined benefit liability 165,250 13, , ,833 12,236 1, ,830 (b) Description of the plan The Group operates a gratuity scheme for its unionisable employees. The scheme is provided under a Collective Bargaining Agreement (CBA). The benefits are defined on retirement, death, withdrawal and illhealth retirement. The gratuity arrangement is a defined benefit scheme in nature with benefits linked to past service and salary at time of exit. Generally, on retirement, the benefit provided to members would be 22 days pay for each complete year worked subject to an employee having worked for at least 6 years. The key risks associated with the scheme are as follows: (i) The benefits are linked to salary and consequently have an associated risk to increases in salary. (ii) The benefits are defined as per the Collective Bargaining Agreement (CBA), normally effective for two years. Negotiations with the trade union could change these benefits and materially change the costs to the company. (iii) The scheme is unfunded with no separate assets. Investment risk would therefore not arise on the arrangement. (iv) Benefits in the scheme are payable on retirement, resignation, death or illhealth retirement. The actual cost to the Company of the benefits is therefore subject to the demographic movements of employees. 153
154 Notes to the financial statements for the year ended 31 December (continued) 25. Retirement Benefit Obligations Group and Company (Continued) (c) Movement in defined benefits obligation Balance at 1 January Included in profit or loss Current service cost net of employees contributions Interest on obligation Included in other comprehensive income Net actuarial losses in the net liability recognised in the year: experience adjustments arising from changes in demographic assumptions experience adjustments arising from changes in financial assumptions Other movements Contributions paid by the employer Balance at 31 December 148,830 13,236 18,351 31,587 4,053 3,443 7,496 (9,569) 178, ,440 10,117 16,191 26,308 3,199 8,029 11,228 (16,146) 148,830 (d) Actuarial assumptions Discount rate (% p.a) Expected return on scheme assets (% p.a) Future salary increases (% p.a) Future pension increases (% p.a) Mortality assumptions Males Mortality assumptions Females Weighted average duration of defined benefit obligations (years) % 0.0% 9.0% N/A A A % 0.0% 8.0% N/A A A The key actuarial assumptions used in valuation of the defined benefit obligation include the following; (i) The valuation method used is the Projected Unit Credit Method (PUC); (ii) The discount rate taken at % is the estimated yield on the auction results of the 10year Treasury Bond dated 26 January Management considers this rate to be appropriate for the purposes of the valuation of the defined benefits obligation; (iii) Mortality has been expressed as the probability of death occurring with the next year for an individual at a specific age. The mortality rate used for current employees was A1949/52 as published by the Institute of Actuaries; and (iv) Withdrawal rates have been assumed on the basis of past trends and experience with similar schemes. 154
155 Notes to the financial statements for the year ended 31 December (continued) 25. Retirement Benefit Obligations Group and Company (Continued) (e) Impact on future cash flows (i) Sensitivity analysis Base Discount rate increased by 1% Salary escalation increased by 1% Discount rate decreased by 1% Salary escalation decreased by 1% Demographic assumptions increased by 10% Demographic assumptions as increased by 10% Discount Rate Salary Increases Demographic Assumptions 12.94% 9.00% No change 13.94% 9.00% No change 12.94% 10.00% No change 11.94% 9.00% No change 12.18% 7.00% No change 12.18% 8.00% + 10% 12.18% 8.00% 10% Net liability at start of period Net expense recognised in profit or loss Net actuarial losses/ (gains) recognised in the other comprehensive income Employer contributions 148,830 31,587 7,496 (9,569) 148,830 30,645 (3,377) (9,569) 148,830 32,711 20,254 (9,569) 148,830 32,678 19,893 (9,569) 148,830 30,604 (3,846) (9,569) 148,830 32,018 8,382 (9,569) 148,830 31,553 6,998 (9,569) Net liability at end of period 178, , , , , , ,812 (ii) Funding arrangements The current arrangements are unfunded with no predetermined contributions. The Company however meets benefit payments on a pay asyougo basis. The company s benefit outgo as at 31 December was 9,569 (: 16,146) (iii) Expected contribution for the financial year 2015 Management estimate that contributions to the scheme in the next financial year will be 13,029. (iv) Maturity profile of the defined benefits obligation Maturity profile Active members Time to maturity of members Less than 1 year Between 1 year and 5 years More than 5 years 15,434 31, , ,250 14,833 27,758 92, ,833 At 31 December, the weighted average duration of the Defined Benefits Obligation was 13.9 years (: 13.9 years) 26. Payables and Accrued Expenses Group Company (a) Carrying amount Trade payables Amounts due to related companies (Note 32(d)) Amounts due to subsidiaries (Note 32(d)) Accrued expenses and other payables 301,562 13, , ,521 4,543 81, ,197 13, , , ,651 4,543 94,338 45, , , , ,
156 Notes to the financial statements for the year ended 31 December (continued) 26. Payables and Accrued Expenses (Continued) (b) Leave pay accrual Included in accrued expenses and other payables is the provision for leave pay. The Group s provision for leave pay represents leave earned by its employees but not taken as at the reporting date. The policy of the Group is to allow a maximum carryover of 7 days leave per employee at the end of each financial year. The movement in the leave accrual account at 31 December was as follows: Group Company Balance at 1 January Additional provisions Utilised in the year 7,260 38,800 (39,976) 12,061 28,416 (33,217) 5,500 34,077 (35,661) 9,306 25,200 (29,006) Balance at 31 December 6,084 7,260 3,916 5, Unclaimed Dividends (a) Carrying amount Group and Company Unclaimed dividends 6,776 The Group pays dividends to shareholders through its share Registrars. In the past the Group would recall amounts from the Registrars which have remained unclaimed for a considerable period of time. The balances so recalled represent the carrying amounts. (b) Analysis of total unclaimed dividends In addition to amounts already recalled by the Group noted above, there are also unclaimed dividends held by the Registrars. The analysis of the total unclaimed dividends for the Group is as follows; Amounts held by the company Amounts held by the Registrars Total unclaimed dividends 6,536 6,536 6,776 10,355 17,131 (c) Unclaimed Financial Assets Act The Unclaimed Financial Assets Act was enacted as an Act of Parliament in Kenya in December The Act provides for the reporting and dealing with unclaimed financial assets and the establishment of the Unclaimed Financial Assets Authority (UFAA) and the Unclaimed Financial Assets Trust Fund. Under the provisions of the Act, unclaimed dividends payable by the Group and the associated ordinary shares are considered to be unclaimed assets. The Group made its report to the Authority in respect of unclaimed assets on 1 November. The Unclaimed Financial Assets Authority has set a cutoff of 3 years dormancy for unclaimed assets. By the reporting date, the Group had forwarded unclaimed dividends of Kshs 9,140,821 to the Authority. Once unclaimed assets are paid to the Authority, the Authority assumes custody and responsibility for the safekeeping of the assets and indemnifies the payee against any future liability in respect of those assets. 156
157 Notes to the financial statements for the year ended 31 December (continued) 28. Statement of Cash Flows Reconciliation of Receipts and Payments Group Company Cash receipts from customers Revenue (Note 8) Other income (Note 9(a)) Net foreign exchange gains/ (losses) Translation differences Share of profit in equity investees Movement in trade and other receivables 3,777,146 41,932 (1,918) 12,510 54,873 4,029,841 41,047 13,735 25, ,513 3,281,226 34,528 3,944 (64,103) 3,502,301 19,895 4, ,153 Cash collections from customers 3,884,543 4,369,645 3,255,595 3,666,650 Cash payments for purchases Opening inventory stock (Note 19) Cost of sales (Note 9(b)(i)) Closing inventory stock ((Note 19) Retirement benefits paid (Note 25(c)) Movement in trade payables (1,268,150) 2,840,635 1,512,888 9,569 (130,041) (1,086,087) 2,951,719 1,268,150 16,146 59,900 (1,059,011) 2,706,110 1,238,627 9,569 (107,546) (960,859) 2,809,138 1,059,011 16,146 51,963 2,964,901 3,209,828 2,787,749 2,975,399 Adjustments for noncash expenses Depreciation and amortization (Note 9(c)) Expenses related to defined benefit plans (Note 25(c)) Asset write back (Note 9 (c)) 151,743 31,587 95,116 26,308 (13,181) 123,614 31,587 79,138 26,308 (13,181) 183, , ,201 92,265 Cash payment for purchases 2,781,571 3,101,585 2,632,548 2,883,134 Cash payments for expenses Other operating expenses (Note 9(b)(ii)) Movement in accruals and other payables 1,007,069 (138,029) 914, , ,913 (186,420) 635, ,514 Cash payments for expenses 869,040 1,034, , , Operating Leases (a) Lease as lessee The Group leases business premises and warehouses in various locations where it carries out its business. It also leases residential premises for its senior management in countries outside the domicile country. The leases typically run for a period of 5 years with an option to renew after the expiry date. Lease payments are negotiated either annually or after every 2 years. One of the leased premises is sublet by the Group to third parties for lease periods coinciding with the principal lease term. 157
158 Notes to the financial statements for the year ended 31 December (continued) 29. Operating Leases (Continued) (a) Lease as lessee (continued) The Group also leases commercial vehicles for use by its sales force in selling and marketing activities. Vehicle leases run for a period of 4 years with no option for renewal. (i) Future minimum lease payments At 31 December, the future minimum lease payments under current leases are as follows. Group Company Motor vehicles Not later than 1 year Later than 1 year and not later than 5 years 43,741 30,465 43,738 66,030 43,741 30,465 43,738 66,030 74, ,768 74, ,768 Leases for premises Not later than 1 year Later than 1 year and not later than 5 years Later than 5 years 69, ,834 60, ,040 1,748 1, , ,386 1,748 1,496 (ii) Amounts recognised in profit or loss The net lease expense recognised in profit or loss was as follows: Group Company Lease expense Sublease income 67,286 (5,910) 101,040 (443) 1,984 1,745 61, ,597 1,984 1,745 (b) Lease as lessor The Group leases out its investment properties to third parties. Most of the leases are for a period of five years with an option for renewal and rent escalation every 2 years. (i) Future minimum lease rentals Group Company Leases for investment properties Not later than 1 year Later than 1 year and not later than 5 years 133, , , , , ,309 92, , , , , ,169 (ii) Amounts recognised in profit or loss Rental income from investment properties and maintenance expenses included in operating expenses are shown on Note 15(b). 158
159 Notes to the financial statements for the year ended 31 December (continued) 30. Commitments Capital expenditure contracted for as at the reporting date but not recognised in the financial statements was as follows: Group Company Property, plant and equipment 68,689 61,890 61,249 61, Contingent Liabilities There are various pending tax matters relating to assessments by the revenue authorities in the countries that the Group operates in. The Group has disputed these assessments. In the opinion of the directors, the outcome of these matters is not expected to have a material effect on the financial position or profits of the Group. 32. Related Party Transactions (a) Parent and ultimate controlling party The Group s majority shareholding is held by Sameer Investments Limited a company incorporated in Kenya. The parent company held equity interest and voting rights in the company of 72.15% (: 72.15%). The ultimate controlling party is Yana Towers Limited; a company incorporated in Kenya. Neither the parent nor the ultimate controlling party nor any intermediary parents produces consolidated financial statements available for public use. (b) Transactions with key management personnel (i) Key management compensation Key management compensation comprised the following; Group Company Basic pay Other allowances Pension / gratuity Leave pay 59,600 13,037 11,891 1,326 52,293 14, ,287 54,506 11,658 11,638 1,071 48,601 12, ,153 85,854 69,911 78,873 64,358 Key management compensation comprises compensation for the Executive Director, Executive Committee and Country Managers in regional operations. Details of the Executive director and Executive committee remuneration is shown under the Directors remuneration report on page 95. (ii) Directors shareholding At 31 December directors shareholding in the company was as follows: Peter Gitonga Akif H. Butt Issa A. Timamy (Resigned 1 November ) Sameer N. Merali Akif H. Butt (jointly with another party) 12, N/A 15,000 20,000 12, ,000 20,
160 Notes to the financial statements for the year ended 31 December (continued) 32. Related Party Transactions (Continued) (b) Transactions with key management personnel (iii) Directors remuneration Group and Company Fees as directors Other emoluments( included under key management compensation above) Total remuneration of directors of the company 4,860 30,048 34,908 5,747 21,296 27,043 Further details of directors remuneration are shown on page 95. (c) Transactions with other related parties In addition to the parent and the ultimate controlling party, the Group also has other companies that are related through common shareholdings or common directorships. Transactions with related parties included the following: (i) Sale of goods and services Group Company Subsidiaries Sameer Africa (Tanzania) Limited Sameer Africa (Uganda) Limited Sameer Africa (Burundi) Limited Yana Tyre Centre Limited 372, ,301 66, , , ,783 63, , , ,002 Associate Sameer Business Park Limited Joint Venture Yana Tyre Centre Galleria 20,163 16,832 Other related parties Ryce East Africa Limited Ryce Southern Sudan Sameer Agriculture & Livestock Eveready Batteries (K) Limited Liquid Telekom (formerly Altech Kenya Data Networks) Sasini Limited 12,304 3, ,764 1,431 14,654 15, ,429 1,377 12, ,764 14,654 15, ,429 19,869 41,590 14,430 39,
161 Notes to the financial statements for the year ended 31 December (continued) 33. Related Party Transactions (Continued) (c) Transactions with other related parties (continued) (ii) Purchase of goods and services Group Company Parent Sameer Investments Limited Other related parties Ryce East Africa Limited First Assurance Company Limited Airtel Kenya Limited Sameer Management Limited Liquid Telekom (formerly Altech Kenya Data Networks) Sasini Limited Sameer Agriculture & Livestock 51,586 21,935 10,779 5,000 3, ,454 20,117 7,528 5,000 2,230 1, ,586 21,935 10,779 5,000 3, ,454 20,117 7,528 5,000 2,230 1, ,258 82,617 93,258 82,617 (iii) Other related party transactions Dividends paid to parent company The Group pays dividends to its parent company as approved by shareholders in general meetings. Dividends paid to the parent company Sameer investments Limited during the year amounted to 60,247 (: 39,833) Banking facilities A related party Equatorial Commercial Bank provides banking facilities to the Group. The facilities which have been utilized by the Group from the bank include; Banking services Import letters of credit Spot and forward exchange transactions The outstanding balances included in cash and cash equivalents as at 31 December as are follows. Group Company Bank Balances Term deposits ,403 2, , ,403 2, , , , , ,907 Working capital support In line with the joint venture agreement, the Group provided working capital support to Yana Tyre Centre Galleria joint venture arrangement. Details of amounts loaned and interest earned are shown below: Group Total amount advanced Interest income earned 10,
162 Notes to the financial statements for the year ended 31 December (continued) 32. Related Party Transactions (Continued) (d) Outstanding balances At 31 December, outstanding balances with related parties comprised the following; Group Company (i) Amounts due from Subsidiaries Taqwa Trading Limited Sameer Africa(Tanzania) Limited Sameer Africa(Uganda) Limited Sameer Africa(Burundi) Limited 28, , ,729 28, ,682 13, ,120 Total due from subsidiaries 312, ,020 Associate Sameer Business Park Limited 1,465 1,465 Joint venture Yana Tyre Centre Galleria 15,629 1,370 Other related parties Ryce East Africa Limited Ryce Southern Sudan Eveready Batteries (K) Limited Sasini Limited 3,056 2, , , ,440 6,798 4,139 3,245 3,440 Total due from other related parties 23,892 4,139 6,080 3,440 (ii) Amounts due to Subsidiaries Yana Tyre Centre Limited Sameer Industrial Park Limited Sameer Africa (Uganda) Limited Sameer EPZ Limited 60,822 14,983 23,563 83,055 40, ,916 Total due to subsidiaries 182,423 94,338 Parent Sameer Investments Limited Other related parties Ryce East Africa Limited First Assurance Company Limited Ryce Southern Sudan Sasini Limited Sameer Agriculture & Livestock 12, , , , Total due to other related parties 13,334 13,334 4,474 4,543 13,334 13,334 4,474 4,543 (e) Bad debts provisions No doubtful debts provision or expense has been made in respect of receivables outstanding from related parties. The Group has reviewed individually the outstanding balances for impairment loss and based on the review considers the amounts to be recoverable. 162

163 163

164 164
165 Contents SECTION 5: OTHER RELEVANT INFORMATION PAGE Notice of the 46th Annual General Meeting Ilani ya Mkutano Mkuu wa 45 wa Kila Mwaka Form of proxy Sameer Africa sales depot contacts 174 Yana Tyre Centre locations and addresses


166 Notice of the 46 th Annual General Meeting Notice is hereby given that the 46th Annual General Meeting of the members will be held at the company s premises off Mombasa Road, Nairobi on Friday May 29th 2015 at am to conduct the following business: Agenda 1. Constitution of the Meeting The secretary to read the notice convening the meeting, table the proxies and determine if a quorum is present. 2. Confirmation of Minutes To confirm the minutes of the 45th Annual General Meeting held on Friday May 23rd. 3. Financial Statements and Reports To receive, consider and if deemed fit, adopt the financial statements for the year ended 31st December together with the reports thereon of the directors and the auditors. 4. Election of directors To elect a director: i) In accordance with Article 94 of the company s Articles of Association, Mr Stephen Maina Githiga retires at this meeting by rotation and being eligible offers himself for reelection. 5. Directors emoluments To approve the directors emoluments. 6. Appointment of auditors To reappoint KPMG as auditors of the company in accordance with the provisions of section 159 (2) of the Companies Act (Cap 486) of the Laws of Kenya and to authorize the directors to fix their remuneration for the ensuing financial year. 7. Special business To consider and if thought fit, to pass the following resolutions as a special resolution Alteration of the Articles of Association of the company The Articles of Association of the company be amended as follows: (a) That Article 6 of the Articles of Association, as reproduced here below, be deleted in its entirety Edgar J. Imbamba Company Secretary 166
167 Notice of the 46 th Annual General Meeting CHANGE OF NAME In the event of termination of the Use of Name Agreement dated 26th August, 1994 made between the Company and Bridgestone/Firestone Inc the said Bridgestone/Firestone Inc shall be entitled, at any time thereafter by written notice to the Company, to require the name of the Company to be changed so as not to include the word Firestone. Not later than Thirty days after receipt by the Company of such notice the Board shall convene a General Meeting of the Company at which there shall be proposed, as a Special Resolution, a resolution to change the name of the Company, as required by this Article and the said notice, to a name already authorized by the Registrar of Companies under the provisions of Section 20(1) of the Act. At such General Meeting every member present in person or by proxy or attorney or, being a corporation, present by a representative appointed in accordance with Article 75 or by proxy or attorney, and entitled to vote shall vote in favour of such resolution and, in the case of a poll, in respect of such Member s total shareholding. Notwithstanding but without prejudice to the provisions of Article 50, in default of the Board convening a General Meeting as required by this Article any one Member or Bridgestone/Firestone Inc. whether or not it shall then be a Member shall be entitled to convene a Meeting for such purpose. (b) To renumber the remaining articles and paragraphs of the Articles of Association, accordingly. 8. Any other business To transact any other business that may be transacted at an Annual General Meeting By Order of the Board Edgar J. Imbamba Company Secretary 25 March 2015, Nairobi Please Note: 1. A member entitled to attend and vote at this meeting may appoint a proxy to attend and vote on his/her behalf and such proxy need not be a member of the company. 2. The form of proxy is provided with this report. 3. If the appointer is a corporation, the proxy must be executed under its common seal or under the hands of an officer or attorney duly authorized in writing. 4. To be valid, a form of proxy must be duly completed, signed, and either deposited at the offices of the company s share registrars, Custody and Registrar Services Limited, 6th Floor, Bruce House, Standard Street, P.O. Box 8484, Nairobi or be posted to the said address to reach the share registrars not less than 24 hours before the time appointed for holding the meeting. 167


168 Ilani ya Mkutano Mkuu wa 46 wa Kila Mwaka Ilani inatolewa hapa kuwa mkutano mkuu wa kila mwaka wa arobaini na Sita (46) wa wanachama utafanyika katika majengo ya kampuni kando ya barabara ya Mombasa, Nairobi, ijumaa tarehe 29 Mei 2015 saa tano na nusu asubuhi kuendesha shughuli zifuatazo: Ajenda 1. Kuitisha mkutano Katibu kusoma ilani ya kuitisha mkutano,kuwasilisha fomu za wakala na kutambua kuepo kwa idadi ya wanahisa wakutosha. 2. Kuthibitisha kumbukumbu Kuthibitisha kumbukumbu za mkutano mkuu wa pamoja wa kila mwaka wa arobaini na tano 45 uliofanyika Ijumaa tarehe 23 Mei. 3. Taarifa na ripoti za fedha Kupokea,kuchunguza na ikithibitishwa sawa, kukubali taarifa ya matumizi ya fedha ya mwaka ulioishia 31 Desemba, pamoja na taarifa za wakurugenzi na wakaguzi. 4. Uchaguzi wa mkurugenzi Kumchagua mkurugenzi: i.) chini ya kifungu 94 cha makala ya chama ya kampuni, Bwana Stephen Maina Githiga anastaafu kwa zamu na kuwa anastahili anajitolea kuchaguliwa tena. 5. Malipo ya wakurugenzi Kuidhinisha malipo ya wakurugenzi. 6. Kuteua Wakaguzi Kuwateua tena KPMG kama wakaguzi wa kampuni kulingana na masharti ya kifungu 159(2) ya sheria za kampuni (Sura 486, Sheria za Kenya) na kuwaidhinisha wakurugenzi kuamua malipo yao ya mwaka wa kifedha unaofuata. 7. Shughuli Maalum Kuchunguza na ikidhaniwa sawa kupitisha maazimio yafuatayo kama azimo maalum. Kubadilisha makala ya chama ya kampuni makala ya chama ya kampuni kubadilishwa ifuatavyo: (a) Kifungu cha 6 cha makala ya chama ya kampuni,kama kilivyochapishwa hapa chini, kifutwe chote. Edgar J. Imbamba Company Secretary 168
169 Ilani ya Mkutano Mkuu wa 46 wa Kila Mwaka KUBADILISHA JINA Ikitokea kusitishwa Mkataba wa Utumiaji wa Jina wa tarehe 26 Agosti 1994 uliokubaliwa kati ya Kampuni na Bridgestone/Firestone Inc, Bridgestone/Firestone Inc itakuwa na haki, katika wakati wowote ule baadaye ya kuandikia Kampuni ilani, kuwajibisha kubadilisha jina la kampuni ili kuto jumlisha jina Firestone. Kabla kupita siku thelathini baada ya kampuni kupokea ilani hiyo halmashauri itaita mkutano mkuu wa kampuni ambapo itapendendekezwa, ikiwa ni azimio maalum,azimio la kubadili jina la kampuni,kama inavyo agizwa na makala ya chama ya kampuni na ilani iliotajwa hapo awali,kubadilisha na kuita jina ambalo limeidhinishwa na msajili wa kampuni chini ya masharti ya kifungu 20(1) cha sheria.katika mkutano huo mkuu kila mwanachama aliyeko au anae wakilishwa au wakili au ikiwa ni shirika, likihudhuria kwa kupitia mwakilishi alieteuliwa kulingana na ibara 75 au kwa uwakilishi au wakili na mwenye haki ya kupiga kura, atapiga kura kuidhinisha azimio hilo na ikiwa ni kwa uamuzi wa kura basi itakua kulingana na jumla ya hisa anazomiliki mwanachama huyo. Pasi na kutia manani na bila ya kuathiri masharti ya ibara 50, ikiwa halmashauri haitaitisha mkutano mkuu kwa muujibu wa ibara hii mwanachama yeyote au Bridgestone/Firestone Inc. ikiwa ni mwanachama au si mwanachama wakati huo itakuwa na haki ya kuitisha mkutano kwa madhumuni hayo. (b) Kuvipatia vifungu na aya zilizobakia za Makala ya chama ya kampuni nambari mpya ipasavyo. 8. Shughuli nyengine yoyote Kushughulikia shughuli nyengine yoyote inayoweza kushughulikiwa katika mkutano mkuu wa pamoja wa kila mwaka. Kwa Amri ya Halmashauri Edgar J. Imbamba Katibu wa Kampuni. 25 Machi 2015, Nairobi Tafadhali fahamu 1. Mwanachama mwenye haki ya kuhudhuria na kupiga kura katika mkutano huu anaweza kumteua wakala kuhudhuria na kupiga kura kwa niaba yake na wakala huyo silazima awe mwanachama wa kampuni. 2. Fomu ya wakala imo kwenye ripoti hii. 3. IKiwa anaeteua wakala ni shirika,wakala lazima ufanyike kwa kutumia muhuri wa shirika wakawaida na kutiwa sahihi na afisa au wakili alieidhinishwa kwa maandishi. 4. Ili kuwa halali fomu ya wakala lazima ijazwe kikamilifu na kutiwa sahihi na mwanachama na ama ifikishwe katika ofisi za wasajili wa hisa za kampuni, Custody and Registrars Services Limited, ghorofa ya 6 jumba la Bruce, barabara ya Standard S.L.P Nairobi au Kutumwa kwa njia ya posta kutumia anuani iliyotajwa kuwafikia wasajili wa hisa kwa muda usiopungua masaa 24 kabla ya wakati uliowekwa wa kufanyika mkutano. 169
170 TYRE CARE TIPS FROM SAMEER AFRICA LIMITED The functions of tyres Supporting the weight of the vehicle Absorbing road shocks Transmitting traction and braking forces Changing an maintaining direction of travel What tires are right for your vehicle? Consider: Manufacturer s recommendation on tyre size and inflation pressure. The load, speed and driving habits. The most common terrain / road conditions. The tyre design & construction in all aspects. Seek expert advice before choosing a tyre Dangers of low inflation pressure Overheating of tyres leading to bursts Irregular tyre wear Reduced tyre life 10% pressure reduction causes 510% less life Reduced fuel economy 10% pressure reduction can cause 1.4% extra fuel consumption Always use the recommended inflation pressure Dangers of excessive inflation pressure Reduced riding comfort Irregular wear concentrated at the centre Reduced tyre life Tyre bursts hence accidents Always use the recommended inflation pressure Proper tyre rotation Is critical since it ensures even wearing of all tyres Can increase tyre life by up to 20% Newer tyres require frequent rotation Rotate tires regularly : tyres should be rotated every 5000kms, to prevent irregular wear and prolonged tyre life Ask your Yana Tyre Centre experts for more advice on tyre rotation Important tyre care tips for Africa Ensure correct inflation pressure Rotate your tyres regularly Check your wheel alignment often Avoid speeding Seek expert advice on specific tyre care problems Benefits of wheel alignment Increased wear resistance longer tyre life Better vehicle control and braking Softer steering Safer cornering What to check before you drive Correct air pressure Sufficient tread depth Any irregular wear Any tear or crack 170 What unique tyre features are suitable for African road conditions? Reinforced side walls to resist damage caused by pot holes, objects, sharp road edges, curbs and rough terrain Reinforced bead and tread area to withstand varied load, unique usage habits and possible abuse Warranty/guarantee on purchase of new tyres Reliable, durable and relevant tyres
171 Form of Proxy I/We of Being (a) member(s) of Sameer Africa Limited, do hereby appoint Or failing him/her, the duly appointed Chairman of the meeting to be my/our proxy, to vote for me/us at the Annual General Meeting of the company to be held at the Company s premises off Mombasa Road, Nairobi on the 29 May 2015 at am and any adjournment thereof. As witness my/our hand(s) this day 2015 Signature Unless otherwise indicated, the proxy will vote as he/she thinks fit. Notes: 1. If the appointer is a corporation, the proxy must be executed under its common seal or under the hands of an officer or attorney duly authorized in writing. 2. To be valid, a form of proxy must be duly completed and signed by the member and must be lodged at the offices of the Company s share registrars, Custody and Registrars Services Limited, 6th Floor Bruce House Standard Street, P.O, Box 8484, Nairobi or be posted to reach the share registrars not less than 24 hours before the time appointed for holding the meeting. Fomu ya Uwakilishi Mimi/Sisi wa nikiwa/tukiwa mwanachama/wanachama wa Sameer Africa Limited, namteua/tunamteua Au akikosa yeye, alieteuliwa kama mwenyekiti wa mkutano kuwa mwakilishi wangu/wetu, kupiga kura kwa niaba yangu/yetu katika Mkutano Mkuu wa kila Mwaka wa kampuni utakaofanyika katika majengo ya Kampuni kando ya barabara ya Mombasa, Nairobi tarehe 29 Mei, mwaka 2015, saa tano na nusu asubuhi na kwenye uahirishwaji wake wowote. Kama ushahidi wangu/wetu siku hii ya Mwezi wa 2015 Sahihi Isipokuwa ikishauriwa vingine,mwakilishi atapiga kura anavyofikiria ni sawa. Maelezo: 1. Ikiwa anaeteua ni shirika, lazima uwakilishi ufanywe kwa kutumia muhuri wake wa kawaida au kwa kutiwa sahihi na afisa au wakili alieidhinishwa kwa maandishi. 2. Ili kuwa halali fomu ya uwakilishi lazima ijazwe kikamilifu na kutiwa sahihi na mwanachama na lazima ifikishwe katika ofisi za wasajili wa hisa za kampuni,custody and Registrars Services Limited, ghorofa ya 6 jumba la Bruce, barabara ya Standard S.L.P Nairobi au Kutumwa kwa njia ya posta kuwafikia wasajili wa hisa kwa muda usiopungua masaa 24 kabla ya wakati uliowekwa wa kufanyika mkutano. 171
172 FOLD 2 To The Company Secretary Sameer Africa Limited P.O.Box Nairobi, Kenya Affix Stamp Here FOLD 1 FOLD 3 Insert Flap Inside 172

173 173
174 Kenya Sameer Africa Sales Depot Addresses Nairobi Mombasa Road P.O. Box , Nairobi Tel: Fax: Nakuru Timber Mill Road P.O Box 15998, Nakuru Tel: / 8 Fax: nkr.manager@sameerafrica.com Mombasa Machakos Road P.O. Box 90491, Mombasa Tel: / 1 Fax: msa.manager@sameerafrica.com Nyeri Nyahururu Road P.O Box 321, Nyeri Tel: / Fax: nyr.manager@sameerafrica.com Eldoret Old Uganda Road P.O Box 8413, Eldoret Tel: / Fax : eld.manager@sameerafrica.com Kisumu Obote Road P.O Box 1497, Kisumu Tel: / Fax: ksm.manager@sameerafrica.com Tanzania Uganda Dar es Salaam Sameer Africa (T) Ltd Nyerere Road P.O Box14849, Dar es Salaam, Tanzania Tel: Fax: info@sameerafrica.co.tz Kampala Sameer Africa (U) Ltd Plot 96/98, 5th street Industrial Area P.O. Box 8972, Kampala, Uganda Tel: / 667/ 635 Fax: info@sameerafrica.co.ug Arusha P.O. Box 14238, Arusha, Tanzania Tel: Fax: Mobile: Mwanza Kenyatta Road P.O Box 11047, Mwanza South, Tanzania Tel: Burundi Bujumbura Sameer Africa (Burundi) Ltd Kanindo, Plot 2750, Boulevard 1 er Novembre P.O. Box 5840 Kanindo, Telephone (Telephone): /
175 Yana Tyre Centres Addresses Kenya Koinange Street Uniafric House P.O Box , Nairobi, Kenya Tel: /34, Mobile: / Fax: Embakasi Kobil Service Station, Airport North Road, P.O Box , Nairobi, Kenya Tel: , Mobile: , Fax: Langata Kenol Kobil Service Station, Opp. Carnivore Road P.O Box , Nairobi, Kenya Tel: , Mobile: , Fax: Waiyaki Way Total Service Station, Next to ABC Place P.O Box , Nairobi Kenya Tel: Mobile: Galleria Shopping Mall Junction of Magadi and Langata Road P.O Box , Nairobi Kenya Mobile: Nakuru Kolem House, NakuruKisumu Highway Jirani Road Junction P.O. Box 15998, Nakuru, Kenya Mobile: Kisumu Obote Road P.O. Box 1497 Kisumu, Kenya Tel: / / , Mobile: / yana.kisumu@sameerafrica.com Eldoret Old Uganda Road P.O Box 8413, Eldoret Tel: / Mobile: / Fax: eldoret@sameerafrica.com Mombasa Island Tangana Road/ Pandya Road Junction P.O. Box 90491, Mombasa, Kenya Mobile: Tel: yana.msa@sameerafrica.com Yana Tyre Centre SBP Sameer Business Park Mombasa road P.O. Box Nairobi,Kenya Mobile: /39 yana.sbp@sameerafrica.com Yana Tyre Centre Mtwapa Kenol service station (next to Tuskys supermarket) P.O. Box Mtwapa, Kilifi Mobile: yana.mtwapa@sameerafrica.com Tanzania Uganda Burundi Dar es Salaam Sameer Africa (T) Ltd Nyerere Road P.O. Box14849, Dar es Salaam, Tanzania Tel: Fax: info@sameerafrica.co.tz Dar es Salaam Sameer Africa (T) Ltd Buguruni Ilala District P.O. Box14849, Dar es Salaam, Tanzania Tel: Fax: yana.ilala@sameerafrica.co.tz Kampala Sameer Africa (U) Ltd Plot 96/98, 5th street Industrial Area P.O. Box 8972, Kampala, Uganda Tel: / 667/ 635 Fax: info@sameerafrica.co.ug Bujumbura Sameer Africa (Burundi) Ltd Kanindo, Plot 2750, Boulevard 1 er Novembre P.O. Box 5840 Kanindo, Telephone: / Website 175

176 Head Office Sameer Africa Ltd. Mombasa/Enterprise Road Junction, P.O. Box , Nairobi, Kenya Tel: Mobile: / 9, /5 Call Centre Number: Fax: or Website: 176
2013 ANNUAL REPORT AND FINANCIAL STATEMENTS
 ANNUAL REPORT AND FINANCIAL STATEMENTS DEVELOPMENT GROWTH INNOVATION Annual Report and Financial Statements for the year ended 31 December Vision To be the ultimate provider of innovative and reliable
2012 ANNUAL REPORT AND FINANCIAL STATEMENTS
 ANNUAL REPORT AND FINANCIAL STATEMENTS GROWTH INNOVATION RESEARCH Vision To be the ultimate provider of innovative and reliable tyre solutions. Mission To provide safe mobility with unparalleled experience.
Endless Possibilities
 Endless Possibilities 2015 Annual Report & Financial Statements Milestones Pan Africa Insurance Holdings Limited was incorporated on 26th October 1946, then known as Indo Africa Insurance Company Limited
Annual Report and Financial Statements
 2013 Annual Report and Financial Statements 2 2013 Annual Report and Financial Statements Our Vision To be a dynamic company committed to exceeding customer expectation and increasing our market share
Financial Year Ended 30 June Kenya Electricity Generating Company Limited 2013 Annual Report & Financial Statements
 61 st Annual Report & Financial Statements Financial Year Ended 30 June 2013 i 2013 Annual Report & Financial Statements Ngong Wind Farm ii 2013 Annual Report & Financial Statements Significant Facts Profile
CARBACID INVESTMENTS LIMITED REPORT AND FINANCIAL STATEMENTS 2012
 CARBACID INVESTMENTS LIMITED REPORT AND FINANCIAL STATEMENTS 2012 contents PAGES Corporate information 2 Board of directors 3 Notice of meeting 4 Chairman s statement 5-6 Taarifa ya mwenyekiti 7-8 Report
Annual Report for the year ended December 31, 2017
 Annual Report for the year ended December 31, 2017 Contents 01. Financial highlights 4 02. TCC at a glance 8 Our vision and mission 9 Our values 10 Our history 11 03. To our stakeholders 16 Message from
Our Vision Enabling people to advance with confidence and success.
 Pg 1 DIAMOND TRUST BANK KENYA LIMITED ANNUAL REPORT & FINANCIAL STATEMENTS 2011 CORPORATE PHILOSOPHIES Our Vision Enabling people to advance with confidence and success. Our Mission To make our customers
Standard Chartered Bank Kenya Limited Annual Report Driving investment, trade and the creation of wealth in Kenya
 Standard Chartered Bank Kenya Limited Annual Report 2013 Driving investment, trade and the creation of wealth in Kenya Standard Chartered Bank Kenya Limited Annual Report 2013 1 Contents Business Review
THE KENYA POWER & LIGHTING COMPANY LIMITED STAFF RETIREMENT BENEFITS SCHEME 2013 ANNUAL REPORT
 2013 ANNUAL REPORT CONTENTS PAGE Trustees and Professional Advisors 4 About the Fund 6 Fund Highlights 8 Five Year Summary 8 Chairman s Report 11 Trust Secretary s Report 17 Board of Trustees 25 Management
VISION AND MISSION STATEMENT
 VISION AND MISSION STATEMENT OUR VISION To be the preferred Bank in the provision of comprehensive financial solutions in the region. OUR MISSION At National Bank, we are dedicated to excellence in providing
Bank on better. National Bank. Integrated Report & Financial Statements
 Bank on better National Bank Integrated Report & Financial Statements 2016 Bank on better Jijenge Na National Bank Borrow from as little as Kshs. 5,000/- to Kshs. 5 Million to grow your business. Free
REGULATIONS. Made under section 28 THE NATIONAL INDUSTRIES (LICENSING AND REGISTRA- TION) ACT, 1967
 ACT, 1967") THE NATIONAL INDUSTRIES (LICENSING AND REGISTRA- TION) ACT, 1967 (No. 10 OF 1967) REGULATIONS Made under section 28 THE NATIONAL INDUSTRIES REGULATIONS, 2000 Short title Interpretation Act No. 10 of 1967
THE NATIONAL INDUSTRIES (LICENSING AND REGISTRA- TION) ACT, 1967 (No. 10 OF 1967) REGULATIONS Made under section 28 THE NATIONAL INDUSTRIES REGULATIONS, 2000 Short title Interpretation Act No. 10 of 1967
annual report & accounts
 2 0 annual report & accounts 1 1 contents Contents Our Vision To be a dynamic company committed to exceeding customer expectation and increasing our market share through the provision of high quality products
Tanzania Cigarette Company Ltd. Annual report for the year ended December 31, 2014
 Tanzania Cigarette Company Ltd Annual report for the year ended December 31, 2014 2 Contents 01. Financial highlights 4 02. TCC at a glance 8 Our vision and mission 9 Our values 10 Our History 11 03. To
Annual Report 2002/2003. Corporate Information 2 Maelezo juu ya Kampuni. Board of Directors 3 Halmashauri ya Wakurugenzi
 1 CONTENTS YALIYOMO Page Ukurasa Corporate Information 2 Maelezo juu ya Kampuni Board of Directors 3 Halmashauri ya Wakurugenzi Management Team 4 Timu ya Wasimamizi Notice of Meeting 5 Ilani ya Mkutano
CARBACID INVESTMENTS LIMITED REPORT AND FINANCIAL STATEMENTS 2014 CO2
 CARBACID INVESTMENTS LIMITED REPORT AND FINANCIAL STATEMENTS 2014 CO2 contents PAGES Corporate information 2 Board of directors 3 Notice of meeting 4 Chairman s statement 5-6 Taarifa ya mwenyekiti 7-8
Vodacom Tanzania Public Limited Company. Annual report for the year ended 31 March 2017
 Vodacom Tanzania Public Limited Company Annual report for the year ended 31 March 2017 Monetise data and digital opportunities Vodacom Tanzania Public Limited Company ( Vodacom Tanzania or the Company
SAFARI LODGES AND CAMPS HOTELS RESORTS
 SAFARI LODGES AND CAMPS HOTELS RESORTS ANNUAL REPORT & FINANCIAL STATEMENTS Content Page Directors and Administration 2-3 Operating Subsidiaries and Properties 4 Other Corporate Information 5 Notice of
Tanzania Cigarette Company Limited (TCC) Annual Report for the year ended December 31,2016
 Annual Report for the year ended December 31,2016") Tanzania Cigarette Company Limited (TCC) Annual Report for the year ended December 31,2016 2 Tanzania Cigarette Company Limited (TCC) Contents 01. Financial highlights 4 02. TCC at a glance 10 Our vision
Tanzania Cigarette Company Limited (TCC) Annual Report for the year ended December 31,2016 2 Tanzania Cigarette Company Limited (TCC) Contents 01. Financial highlights 4 02. TCC at a glance 10 Our vision
SAFARI LODGES AND CAMPS HOTELS RESORTS ANNUAL REPORT & FINANCIAL STATEMENTS
 SAFARI LODGES AND CAMPS HOTELS RESORTS ANNUAL REPORT & FINANCIAL STATEMENTS Content Page Directors and Administration 2-3 Operating Subsidiaries and Properties 4 Other Corporate Information 5 Notice of
TANGA CEMENT PLC ANNUAL REPORT TAARIFA YA MWAKA.
 TANGA CEMENT PLC 2016 ANNUAL REPORT TAARIFA YA MWAKA www.simbacement.co.tz ANNUAL REPORT 2016 Contents Financial Summary 1 Directors Profiles 3 Chairperson s Statement 7 Managing Director s Report 11 Corporate
ISO 9001: 2015 Certified
 ISO 9001: 2015 Certified TABLE OF CONTENTS Corporate Information 1 Members of The Board of Trustees 3 Senior Management Team 5 Chairman's Statement 6 Taarifa ya Mwenyekiti 7 Report of the Managing Trustee
 8-13 Chairman s Report 14-19 Managing Director s Report 20-21 Senior Management 33-34 Statement of Directors Responsibilities 41-42 Consolidated Statement of Changes in Equity 35-36 Report of the Independent
What s inside this report
 CONTENTS 1 What s inside this report 2-7 50th Anniversary Highlights HIGHLIGHTS 8-9 Notice of Annual General Meeting Tangazo la Mkutano Mkuu wa Mwaka 10 Corporate Governance 11 Performance Highlights 12-18
Kawaida Mpya Kukuhudumia popote ulipo. New Normal Serving you wherever you are
 Kawaida Mpya Kukuhudumia popote ulipo New Normal Serving you wherever you are 01 01 01 Yaliyomo 04 Azma Dira Misingi Yetu 06 Angalizo Kuhusu Taarifa Zitakazotazama Mbele 26 08 Wasifu wa Kampuni 20 10 Vielelezo
Annual Report 2009 Taarifa ya Mwaka
 Annual Report 2009 Taarifa ya Mwaka Taarifa ya Mwaka 2009 1 Contents Yaliyomo Financial Summary 2 Board of Directors and Profiles 4 Chairperson s Statement 8 Managing Director s Report 10 Corporate Social
2016 Annual Report & Financial Statements. Annual Report and Financial Statements
 2016 Annual Report and Financial Statements 1 Contents Notice of the Annual General Meeting... 5 Board of Directors... 7 Management Team...10 Directors, Offices and Statutory Information...12 Report of
CONTENTS. Directors, Officers and Administration 2. Board of Directors 4. Notice of Annual General Meeting 6. Chairman s Statement 10
 REPORT AND FINANCIAL STATEMENTS AT 31 DECEMBER 2015 CONTENTS Directors, Officers and Administration 2 Board of Directors 4 Notice of Annual General Meeting 6 Chairman s Statement 10 Group Managing Director
Annual Report Bringing together world class capabilities
 Annual Report 2016 Bringing together world class capabilities 1 Table of contents 1. 10 Year Review...18 2. Cash value added statement...19 3. Chairman s statement...22 4. Taarifa ya Mwenyekiti...26 5.
TWENTY TWELVE annual report& financial statements we re transforming. National Bank of Kenya Ltd 2012 annual report.
 TWENTY TWELVE 2 0 1 2 annual report& financial statements we re transforming www.nationalbank.co.ke Vision and Mission Statement OUR VISION To be the Bank of Choice in the provision of Financial Solutions
CARBACID INVESTMENTS LIMITED REPORT AND FINANCIAL STATEMENTS 2015 CO2
 CARBACID INVESTMENTS LIMITED REPORT AND FINANCIAL STATEMENTS 2015 CO2 contents PAGES Corporate information 2 Board of directors 3 Notice of meeting 4 Chairman s statement 5-6 Taarifa ya mwenyekiti 7-8
ANNUAL REPORT TAARIFA YA MWAKA. Demonstrate environmental stewardship and promote sustainability in communities.
 ANNUAL REPORT TAARIFA YA MWAKA 2013 Demonstrate environmental stewardship and promote sustainability in communities. TAARIFA YA MWAKA 2013 ANNUAL REPORT 2013 Demonstrate environmental stewardship and promote
SAFARICOM LTD ANNUAL REPORT 2014
 SAFARICOM LTD ANNUAL REPORT 2014 A ONE // HIGHLIGHTS 04 PERFORMANCE AT A GLANCE 06 CHAIRMAN S STATEMENT 10 CEO S STATEMENT TWO // BUSINESS REVIEW 16 WHAT WE DO 18 THE VALUE WE CREATE 20 HOW WE ARE MANAGED
ANNUAL CENTUM INVESTMENT COMPANY PLC ABRIDGED ANNUAL REPORT AND FINANCIAL STATEMENTS YEAR ENDED 31 MARCH 2018 REPORT
 ANNUAL CENTUM INVESTMENT COMPANY PLC ABRIDGED ANNUAL REPORT AND FINANCIAL STATEMENTS YEAR ENDED 31 MARCH 2018 REPORT 2018 TANGIBLE PROGRESS 04 NOTICE OF THE 51ST ANNUAL GENERAL MEETING 06 NOTISI JUU YA
CARBACID INVESTMENTS LIMITED REPORT AND FINANCIAL STATEMENTS 2013 CO2
 CARBACID INVESTMENTS LIMITED REPORT AND FINANCIAL STATEMENTS 2013 CO2 contents PAGES Corporate information 2 Board of directors 3 Notice of meeting 4-6 Chairman s statement 7-8 Taarifa ya mwenyekiti 9-10
THE UNITED REPUBLIC OF TANZANIA
 THE UNITED REPUBLIC OF TANZANIA ISSN 0856-034X BILL SUPPLEMENT No.5 8 th June, 2018 to the Gazette of the United Republic of Tanzania No.23. Vol.99 dated 8 th June, 2018 Printed by the Government Printer,
Annual Report and Accounts. with. Tanzania
 2011 Annual Report and Accounts with Tanzania Its been 81 years since the opening of our first brewery Tanzania Breweries began as Tanganyika Breweries in 1930. The company was renamed to Tanzania Breweries
Achieving more together
 2017 Annual Report Achieving more together A proud part of the family Performance in a snapshot For the year ended 31 March 2017 10 Years review 2017 2016 2015 2014 2013 2012 2011 2010 2009 2008 Sales
THE OIL AND GAS REVENUES MANAGEMENT ACT, 2015 ARRANGEMENT OF SECTIONS PART I PRELIMINARY PROVISIONS PART II ADMINISTRATIVE PROVISIONS
 ISSN 0856-035X THE UNITED REPUBLIC OF TANZANIA BILL SUPPLEMENT No. 10 29 th May, 2015 to the Gazette of the United Republic of Tanzania No. 22 Vol. 96 dated 29 th May, 2015 Printed by the Government Printer,
SPECIAL BILL SUPPLEMENT THE FINANCE ACT, 2015 ARRANGEMENT OF PARTS PART II AMENDMENT OF THE BANK OF TANZANIA, (CAP. 197)
") ISSN 0856-035X THE UNITED REPUBLIC OF TANZANIA SPECIAL BILL SUPPLEMENT No. 1 11 th June, 2015 to the Gazette of the United Republic of Tanzania No. 24 Vol. 96 dated 12 th June, 2015 Printed by the Government
ISSN 0856-035X THE UNITED REPUBLIC OF TANZANIA SPECIAL BILL SUPPLEMENT No. 1 11 th June, 2015 to the Gazette of the United Republic of Tanzania No. 24 Vol. 96 dated 12 th June, 2015 Printed by the Government
ANNUAL REPORT AND FINANCIAL STATEMENTS
 ANNUAL REPORT AND FINANCIAL STATEMENTS OUR VISION To be the Media of Africa for Africa OUR To create value for our stakeholders and to positively influence society by providing media that informs, educates
PACKAGING LINE UPGRADE
 PACKAGING LINE UPGRADE The brand new state-of-the-art bottling line at TBL was officially opened on 22 May 2009 and is rated at 48,000 bottles per hour. The bottle washer reduces water usage by 50%. Contents
KENYA POWER ANNUAL REPORT AND FINANCIAL STATEMENTS FINANCIAL YEAR ENDED 30 JUNE
 KENYA POWER ANNUAL REPORT AND FINANCIAL STATEMENTS FINANCIAL YEAR ENDED 30 JUNE 2012 ANNUAL REPORT AND FINANCIAL STATEMENTS 2011/12 THE KENYA POWER & LIGHTING COMPANY LIMITED 1 2 THE KENYA POWER & LIGHTING
2015 Annual Report and Financial Statements. Bank on better
 2015 Annual Report and Financial Statements Bank on better Introduction Our History National Bank was incorporated on 19th June 1968. At the time it was fully owned by the Government. The objective for
2012 Annual Report & Financial Statements
 2012 Annual Report & Financial Statements OUR CORPORATE VISION To be the reinsurer of choice in our chosen markets OUR CORPORATE MISSION To provide quality reinsurance services to our clients in Africa,
of contents table Tanzania Portland Cement Company Ltd, Annual Report 2010 Figures in TZS Letter of Transmittal 2
 ANNUAL FinancialHighlights table of contents Letter of Transmittal 2 Barua ya kuwasilisha 3 Chairman s Statement 6 Figures in TZS 000 2005 2006 2007 2008 Number of employees (yearly average) 292 304 312
JAMHURI YA MUUNGANO WA TANZANIA WIZARA YA FEDHA NA UCHUMI
 JAMHURI YA MUUNGANO WA TANZANIA WIZARA YA FEDHA NA UCHUMI HOTUBA YA WAZIRI WA FEDHA NA UCHUMI, MHESHIMIWA MUSTAFA HAIDI MKULO (MB.), AKIWASILISHA BUNGENI TAARIFA YA HALI YA UCHUMI WA TAIFA KWA MWAKA 2007
Highlights TZS Billion. TZS Billion. Total income. Net profit. TZS Billion. Total Assets 1,384 1, ,039 1,862 1,780
 Annual Report / Taarifa ya Mwaka 2008 Highlights 2008 160 154 50 49 140 120 100 135 101 40 30 39 35 80 60 20 TZS Billion 40 20 0 2008 2007 2006 TZS Billion 10 0 2008 2007 2006 Total income Net profit 160
TANGA CEMENT PLC ANNUAL REPORT
 TANGA CEMENT PLC ANNUAL REPORT TAARIFA YA MWAKA 2015 ANNUAL REPORT 2015 Contents Financial Summary 1 Directors Profiles 3 Chairperson s Statement 7 Managing Director s Report 11 Corporate Social Investments
British American Tobacco Kenya plc. Annual Report Cautionary statement
 We are a strong Company with over 10 brands sold in the Kenyan market. We employ directly and indirectly over 1,800 people and we make cigarettes chosen by a majority of Kenya s adult smokers. BAT Kenya
Annual Report. and. Financial Statements
 ANNUAL REPORT AND FINANCIAL STATEMENTS 2014 Annual Report and Financial Statements for the Year Ended 30th June, 2014 KENYA LITERATURE BUREAU PUBLISHERS AND PRINTERS Popo Road, Belle-Vue Area, Off Mombasa
INTEGRATED ANNUAL REPORT & FINANCIAL STATEMENTS FOR THE YEAR ENDED 30 JUNE Part of everyday life
 INTEGRATED ANNUAL REPORT & FINANCIAL STATEMENTS FOR THE YEAR ENDED 30 JUNE 2016 Part of everyday life Our Value Statements Vision To be the market leader in the provision of reliable, safe, quality and
REPORT AND FINANCIAL STATEMENTS for the year
 REPORT AND for the year Chai Tausi, Bidhaa bora kutoka TATEPA na Wakulima wa Chai Rungwe 2014 2015 Table of Contents Contents...2 Pictures...3 Chairman s Statement (swahili & english)... 4 Financial
Freequently Asked Question Maswali na Majibu
 www.amanabank.co.tz Freequently sked Question Maswali na Majibu mana Bank Operations Q1 Why does your bank have many branches in Dar es Salaam? Dar es Salaam is a business city with high population compared
UMOJA BRIDGE (UNITY BRIDGE) - MTWARA The Umoja Bridge is a 720 meter long structure that connects Tanzania and Mozambique across the Ruvuma river.
 - MTWARA The Umoja Bridge is a 720 meter long structure that connects Tanzania and Mozambique across the Ruvuma river.") UMOJA BRIDGE (UNITY BRIDGE) - MTWARA The Umoja Bridge is a 720 meter long structure that connects Tanzania and Mozambique across the Ruvuma river. It was inaugurated on 15 May 2010 by the presidents of
UMOJA BRIDGE (UNITY BRIDGE) - MTWARA The Umoja Bridge is a 720 meter long structure that connects Tanzania and Mozambique across the Ruvuma river. It was inaugurated on 15 May 2010 by the presidents of
BUILDING INTO THE FUTURE Tanzania Portland Cement Company Limited Annual Report 2011
 BUILDING INTO THE FUTURE Tanzania Portland Cement Company Limited Annual Report 2011 FINANCIAL HIGHLIGHTS 2007-2011 2007 TZS 000 2008 TZS 000 2009 TZS 000 2010 TZS 000 2011 TZS 000 Number of employees
KENYA RE FINANCIAL YEAR ENDED 31 DECEMBER 2016
 1 2 KENYA RE FINANCIAL YEAR ENDED 31 DECEMBER 2016 Page Group Information 4-15 Notice of the 2017 AGM 6-7 Chairman s Overview 12-15 Report of the Directors 16-17 Managing Director s Statement 18-25 Statement
The Kenya Power & Lighting Co. Ltd.
 The Kenya Power & Lighting Co. Ltd. Our Vision To achieve world class status as a quality service business enterprise so as to be the first choice supplier of electrical energy in a competitive environment.
CRDB BANK PLC. Taarifa ya Mwaka. Annual Report
 CRDB BANK PLC Yaliyomo Content 01 Angalizo Kuhusu Taarifa Zitakazotazama Mbele 02 Taarifa za Kampuni 03 Wasifu wa Kampuni 04 Vielelezo vya Kifedha 07 Taarifa ya Ziada 08 Taarifa ya Mwenyekiti 18 Taarifa
TABLE OF CONTENTS BUSINESS REVIEW CORPORATE GOVERNANCE FINANCIAL STATEMENTS OTHER INFORMATION
 TABLE OF CONTENTS BUSINESS REVIEW 2 Who we are 7 Five year Financial Review 8 Delivering on our Strategic Objectives 12 Chairman s Statement 18 Taarifa ya Mwenyekiti CORPORATE GOVERNANCE 24 The Board of
Table of Contents Year Review. 4 Group Cash Value Added Statement. 5 Chairman s Statement. 9 Vision, Mission & Company Values
 In celebration of the successful partnership between the Tanzanian government and SABMiller over the last 20 years, we introduce to you the legends that walked this journey and their stories. With SABMiller
front cover.pdf 1 4/3/14 5:38 PM
 front cover.pdf 1 4/3/14 5:38 PM 1 Our Vision Enabling people to advance with confidence and success. Our Mission To make our customers prosper, our staff excel and create value for our stakeholders. Our
2012/2013 Annual Report and Financial Statements
 2012/2013 Annual Report and Financial Statements Cable protection cover tiles laid, awaiting completion of backfilling for the 220kV underground cable to Embakasi Substation, part of lot 3- Mombasa- Nairobi
MONETARY POLICY MANAGEMENT
 TABLE OF CONTENTS LETTER OF TRANSMITTAL... ii PREFACE... iii UTANGULIZI... v BOARD OF DIRECTORS... viii SENIOR MANAGEMENT... ix MEMBERS OF THE MONETARY POLICY COMMITTEE... xi BANK REORGANISATION... xii
Contents BUSINESS & PERFORMANCE HIGHLIGHTS
 BUSINESS & PERFORMANCE HIGHLIGHTS 6,000 PROFIT BEFORE TAX* 5,633 Profit (KShs Million) 4,000 2,000 2,498 2,648 2,738 4,782 2006 2007 2008 2009 2010 0 Contents SALES BY REGIONS, EXPORTS AND REP Business
ANNUAL REPORT & FINANCIAL STATEMENTS
 2015 ANNUAL REPORT & FINANCIAL STATEMENTS Achieve More i VISION Enabling people to advance with confidence and success. MISSION To make our customers prosper, our staff excel and create value for our
REPUBLIC OF KENYA COUNTY ASSEMBLY OF KILIFI THE HANSARD. Wednesday, 29 th June, (The Deputy Speaker (Hon. Mwambire) in the Chair) PRAYERS
 in the Chair) PRAYERS") June 29, 2015 COUNTY ASSEMBLY DEBATES 1 REPUBLIC OF KENYA COUNTY ASSEMBLY OF KILIFI THE HANSARD Wednesday, 29 th June, 2016 The House met at the County Assembly Chambers, Malindi Town, at 2.30 p.m. (The
June 29, 2015 COUNTY ASSEMBLY DEBATES 1 REPUBLIC OF KENYA COUNTY ASSEMBLY OF KILIFI THE HANSARD Wednesday, 29 th June, 2016 The House met at the County Assembly Chambers, Malindi Town, at 2.30 p.m. (The
Our Mission. Our Values. Our Vision. To be Africa s foremost investment channel
 Centum Investment Company Limited Annual Report and Financial Statements Year ended 31 March 2016 Our Vision To be Africa s foremost investment channel Our Mission To create real, tangible wealth by providing
THE FINANCE ACT, 2017 ARRANGEMENT OF PARTS AMENDMENT OF THE EXCISE (MANAGEMENT AND TARIFF) ACT, (CAP.147)
 ACT, (CAP.147)") THE UNITED REPUBLIC OF TANZANIA BILL SUPPLEMENT No.3 2 nd June, 2017 to the Gazette of the United Republic of Tanzania No.24. Vol.91 dated 2 nd June, 2017 Printed by the Government Printer, Dar es Salaam
THE UNITED REPUBLIC OF TANZANIA BILL SUPPLEMENT No.3 2 nd June, 2017 to the Gazette of the United Republic of Tanzania No.24. Vol.91 dated 2 nd June, 2017 Printed by the Government Printer, Dar es Salaam
TOTAL KENYA LIMITED 2012 ANNUAL REPORT & FINANCIAL STATEMENTS
 TOTAL KENYA LIMITED 2012 ANNUAL REPORT & FINANCIAL STATEMENTS Total Kenya Limited Annual Report and Financial Statements 10 1 CONTENTS 01 Value Statements 02 Notice of the Annual General Meeting 03 Directors
Government registers success in financial reforms
 ISSN: 1821-6021 Vol VIII - No. 42 October 20, 2015 Free with Daily News every Tuesday? According to the public procurement law, any suspension or debarment of a tenderer shall not affect any existing contracts
SEPTEMBER 29, 2015 COUNTY ASSEMBLY DEBATES 1 REPUBLIC OF KENYA COUNTY ASSEMBLY OF KILIFI THE HANSARD
 SEPTEMBER 29, 2015 COUNTY ASSEMBLY DEBATES 1 REPUBLIC OF KENYA COUNTY ASSEMBLY OF KILIFI THE HANSARD Tuesday, 29 th September, 2015 The House met at the Temporary Chambers at the defunct Malindi Municipal
THE UNITED REPUBLIC OF TANZANIA
 THE UNITED REPUBLIC OF TANZANIA STATEMENT OF REALLOCATION REALLOCATION WARRANT NO.1 OF 2010/2011 VIREMENT BETWEEN VOTES STATEMENT OF REALLOCATION REALLOCATION WARRANT NO.1 OF 2010/2011 SCHEDULE VIREMENT
REPUBLIC OF KENYA WEST POKOT COUNTY ASSEMBLY THE HANSARD. Monday, 25 th June, The County Assembly Members met at Kanyarkwat at 2.
 REPUBLIC OF KENYA WEST POKOT COUNTY ASSEMBLY THE HANSARD Monday, 25 th June, 2018 The County Assembly Members met at Kanyarkwat at 2.30 pm SECOND ASSEMBLY, SECOND SESSION BUNGE MASHINANI AT KANYARKWAT
7. Swali: Kama sio mwalimu, ninaruhusiwa kufungua akaunti katika benki ya MCB?
 MASWALI YANAYOULIZWA MARA KWA MARA. 1. Swali: Ninawezaje kufungua akaunti binafsi ya benki? Jibu: Jaza fomu ya kufungulia akaunti ambapo utachagua akaunti binafsi. Fomu zinapatikana katika tawi letu lililopo
EAST AFRICAN COMMUNITY REPUBLIC OF UGANDA PASSPORT
 EAST AFRICAN COMMUNITY REPUBLIC OF UGANDA PASSPORT UGANDA MANAGEMENT INSTITUTE ANTI-PLAGIARISM POLICY FREQUENTLY ASKED QUESTIONS on the EAC e-passport Uganda Ordinary EAC e-passport Outer Cover EAST AFRICAN
Centum Investment Company Limited Annual Report & Financial Statements fy 12/13
 Annual Report & Financial Statements fy 12/13 We are an investment channel Providing investors with access to a portfolio of inaccessible quality and diversified investments The partner of choice... OUR
COUNTY ASSEMBLY OF KILIFI
 June 26, 2014 COUNTY ASSEMBLY DEBATES 1 COUNTY ASSEMBLY OF KILIFI THE HANSARD Thursday, 26 th June, 2014 The House met at the County Assembly Chambers, Malindi Town, 2.30 p.m. [The Temporary Speaker (Hon.
INTEGRATED REPORT AND FINANCIAL STATEMENTS
 INTEGRATED REPORT AND FINANCIAL STATEMENTS 2017 REGIONAL BRANCH NETWORK NAIROBI 1. Buru Buru Branch, off Mumias Road 2. Capital Centre Branch, Mombasa Road 3. Courtyard Branch, along General Mathenge Drive
Standard Chartered Bank Kenya Limited 2011 Full Year Results Announcement
 Standard Chartered Bank Kenya Limited 2011 Full Year Results Announcement Introduction The Standard Chartered Bank story is one of consistent delivery and sustained growth. We have the right strategy,
Address by THE NATIONAL BANK OF KENYA
 CENTRAL BANK OF KENYA Address by PROF. NJUGUNA NDUNG U GOVERNOR CENTRAL BANK OF KENYA at the OFFICIAL LAUNCH OF THE NATIONAL BANK OF KENYA SHARIA COMPLIANT BANKING THE NATIONAL AMANAH Sarova Stanley Hotel
Appendices. 1. Letter of Introduction. 2. Letter of acceptance. 3. Project Implementation plan. 4. Information for Monitoring. 5. Evaluation Summaries
 Appendices 1. Letter of Introduction 2. Letter of acceptance 3. Project Implementation plan 4. Information for Monitoring 5. Evaluation Summaries 6. Questions to UWATU members 7. Questions to Stakeholders
Page 1. Kenya Commercial Bank Limited
 Page 1 Peter W. Muthoka, MBS, BA (Hons), MA, FKIB, FKIM GROUP CHAIRMAN Kenya Commercial Bank Limited Head Office Kencom House, Moi Avenue P.O. Box 53290-00200 Nairobi, Kenya Telephone: +254 20 3270210/2851210
Fellow Revenue Administrators, Ladies and Gentlemen,
 SPEECH BY MR. M. G. WAWERU, COMMISSIONER GENERAL, KENYA REVENUE AUTHORITY DURING THE OPENING OF THE JOINT IMF EAST AFRITAC/KRA WORKSHOP ON THE CHALLENGES OF ADMINISTERING SMALL AND MEDIUM TAXPAYERS HELD
JUDGMENT OF THE COURT. This is an appeal against the decision of Mlay, J. in Civil Case No.
 IN THE COURT OF APPEAL OF TANZANIA AT DAR ES SALAAM (CORAM: MUNUO, J.A., RUTAKANGWA, J.A., And MJASIRI, J.A.) CIVIL APPEAL NO. 119 OF 2009 NAIMA IBRAHIM AS A TRUSTEE OF MAHAMUD ABDURASUL ISMAIL...APPELLANT
Audited Summarised Financial Results and Dividend Announcement for the year ended 30 June 2014
 Audited Summarised Financial Results and Dividend Announcement for the year ended 3 2 Key performance indicators for the year ended 3 2 The Directors have pleasure in announcing the audited financial results
9/22/2010. Growing outside South Africa Clive Tasker, Chief Executive: Standard Bank Africa. Strategy
 Standard d Bank Group Growing outside South Africa Clive Tasker, Chief Executive: Standard Bank Africa Strategy 1 What is our strategy? To build a leading emerging markets financial services organisation
BUSINESS ADDRESS BY THE SOUTH AFRICAN MINISTER OF TRADE AND INDUSTRY HONOURABLE DR ROB DAVIES SWITZERLAND ZURICH 21 JUNE 2O12
 BUSINESS ADDRESS BY THE SOUTH AFRICAN MINISTER OF TRADE AND INDUSTRY HONOURABLE DR ROB DAVIES SWITZERLAND ZURICH 21 JUNE 2O12 1 Program Director Federal Council Didier Burkhalter President Swiss Mem Industry
BUILDING THE FUTURE A LOOK AT THE ECONOMIC POTENTIAL OF EAST AFRICA
 BUILDING THE FUTURE A LOOK AT THE ECONOMIC POTENTIAL OF EAST AFRICA REPORT HIGHLIGHTS: BUILDING THE FUTURE A LOOK AT THE ECONOMIC POTENTIAL OF EAST AFRICA Building the Future: A Look at the Economic Potential
REMARKS GOVERNOR CENTRAL BANK OF KENYA
 REMARKS BY PROF. NJUGUNA NDUNG U GOVERNOR CENTRAL BANK OF KENYA at the BANK OF INDIA S 105 TH FOUNDATION DAY CELEBRATIONS Hotel Panafric, Nairobi Tuesday, September 07, 2010 Your Excellency Sibabrata Tripathi,
2018 NATIONAL BUSINESS CONFERENCE DINNER. Transition to High Income Status The Role of Monetary Policy and Communication
 2018 NATIONAL BUSINESS CONFERENCE DINNER Transition to High Income Status The Role of Monetary Policy and Communication Welcome Remarks by Moses D Pelaelo Governor, Bank of Botswana September 9, 2018 Distinguished
Emirates NBD Announces First Half 2015 Results
 For immediate release Emirates NBD Announces First Half 2015 Results Net profits up 41% to AED 3.3 billion on higher income and lower provisions Total Income up 7% to AED 7.6 billion as net interest income
CENTRAL BANK OF KENYA CREDIT SURVEY REPORT APRIL - JUNE 2017
 1 (CBK) COMMERCIAL BANKS CREDIT SURVEY APRIL - JUNE 2017 1. BACKGROUND 1.1 COMMERCIAL BANKS CREDIT OFFICER SURVEY 1.3 KENYAN BANKING SECTOR PERFORMANCE Credit risk is the single largest factor affecting
For personal use only
 19 February 2014 Company Announcements Platform Australian Securities Exchange Limited 20 Bridge Street Sydney NSW 2000 Dear Sir/Madam Aristocrat Leisure Limited 2014 Annual General Meeting In accordance
South African Reserve Bank STATEMENT OF THE MONETARY POLICY COMMITTEE. Issued by Lesetja Kganyago, Governor of the South African Reserve Bank
 South African Reserve Bank PRESS STATEMENT EMBARGO DELIVERY 18 January 2018 STATEMENT OF THE MONETARY POLICY COMMITTEE Issued by Lesetja Kganyago, Governor of the South African Reserve Bank In recent weeks,
COUNTY ASSEMBLY OF NYAMIRA
 JANUARY 14 th, 2016 COUNTY ASSEMBLY OF NYAMIRA DEBAT 1 REPUBLIC OF KENYA COUNTY ASSEMBLY OF NYAMIRA THE HANSARD Thursday, 14 th January, 2016 Special Sitting (Convened via Notice ) The House met at the
Ratification of the Agreement establishing the AfCFTA. Select Committee on Trade and International Relations 07 November 2018
 Ratification of the Agreement establishing the AfCFTA Select Committee on Trade and International Relations 07 November 2018 Outline of Presentation 1) SA approach to Trade Negotiations 2) SA Trade Policy
Statement by. Vera Songwe, Under-Secretary-General of the United Nations. Executive Secretary of the Economic Commission for Africa
 Statement by Vera Songwe, Under-Secretary-General of the United Nations Executive Secretary of the Economic Commission for Africa Fifty-second session of the Conference of African Ministers of Finance,
Standard Chartered banks on Mauritius: gateway to Africa
 EMBARGOED UNTIL 3 JUNE, 6PM SGT Standard Chartered banks on Mauritius: gateway to Africa Hosts first Singapore business delegation in Mauritius and launches Transaction Banking services 3 June 2011, Singapore