Press Release BANK OF BARODA ANNOUNCES FINANCIAL RESULTS FOR Q2 AND H1, (FY 2017) Highlights (Standalone Basis) Operating profit of INR 2,690
|
|
|
- Robyn Black
- 5 years ago
- Views:
Transcription
1
2
3
4

5

6
7 Press Release BANK OF BARODA ANNOUNCES FINANCIAL RESULTS FOR Q2 AND H1, (FY 2017) Highlights (Standalone Basis) Operating profit of INR 2,690 crore, up by 15.10% YoY; the highest in the last 6 quarters. Profit after Tax of INR 552 crore up by 345% y-o-y and 30% q-o-q Gross NPA at INR 42,949 crore remains stable while Net NPA at INR 19,342 crore down on Q-o-Q basis. GNPA at 11.35% and Net NPA at 5.46%. Provision Coverage Ratio (PCR) improved to 62.95% as on September 30, 2016 from 60.17% as on June 30, 2016 and 60.09% & 52.70% as on March 31, 2016 and December 31, 2015 respectively. Domestic CASA grew on an average by 14.95% (on y-o-y basis) and 3.34% (on q-o-q basis) driven by Savings bank deposit growth of 16.06% and 3.91% (on y- o-y and q-o-q basis respectively). Domestic CASA as %age of domestic deposits on average basis stood at 33.63% as compared to 29.16% as at September 30, 2015 and 30.62% as at March 31, On terminal basis, Domestic CASA percentage stood at 34.23%. Continued focus on recovery and collections, portfolio rebalancing and improving profitability. CRAR (Basel III) stood at 12.94% with Tier I ratio of 10.59% and CET 1 of 10.09%, excluding profits of current half year FY17. 1
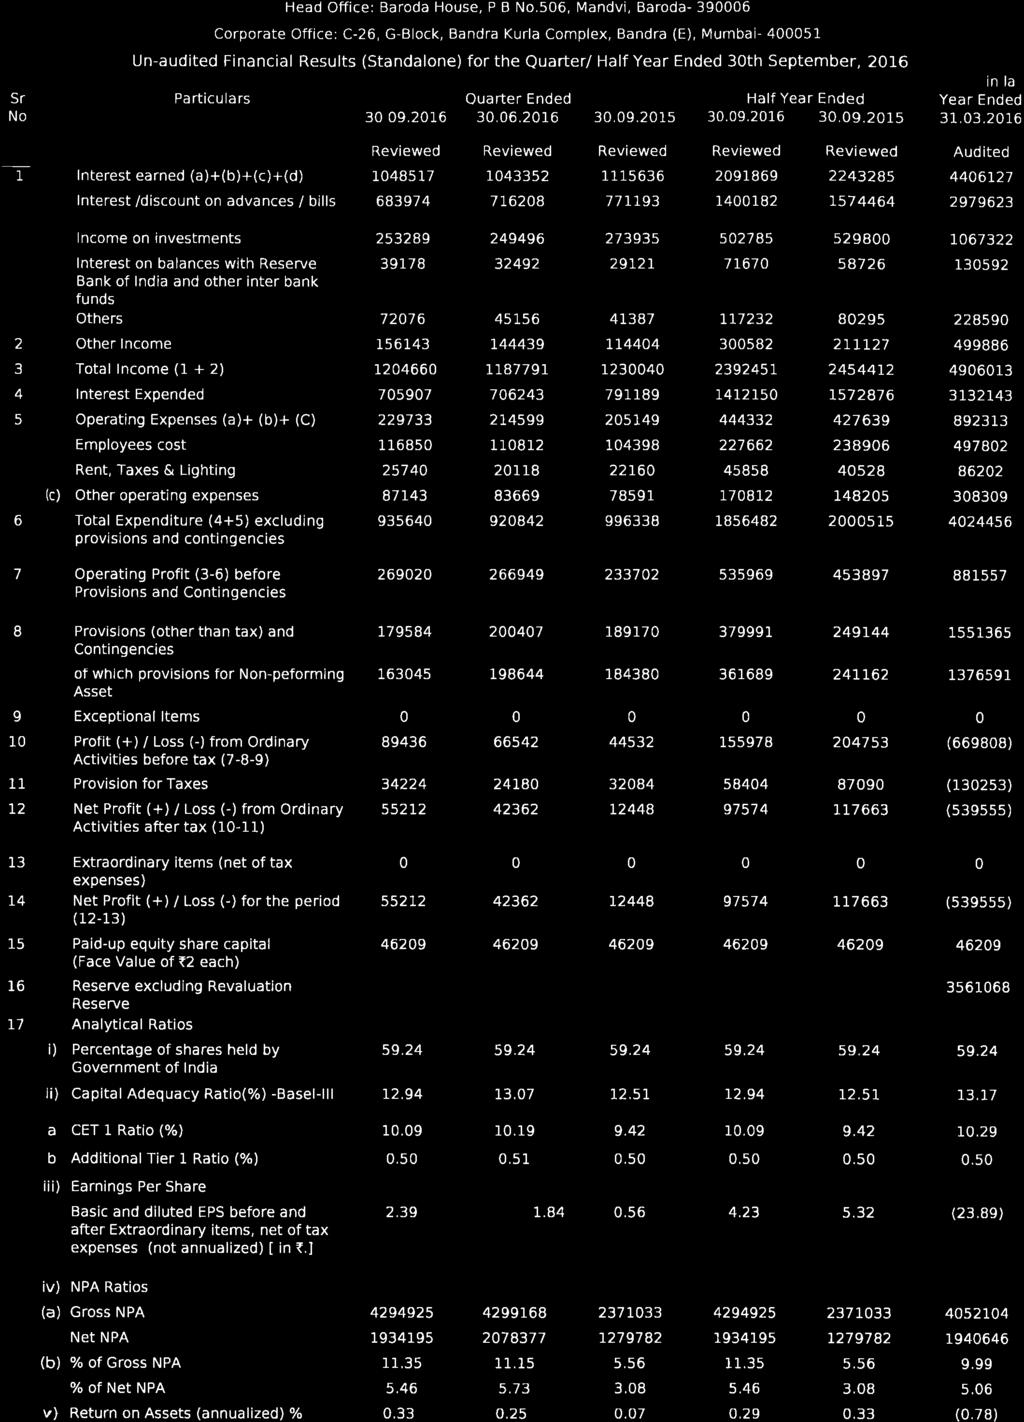
8 Bank of Baroda announced its audited results for the Q2 of FY 2017, following the approval of its Board of Directors on November 11, Particulars Total Income Results at a Glance (Standalone Basis) Quarterly Results Q2 FY 17 Q2 FY 16 All figures in INR crore Half-Yearly Results % Change H1 FY 17 H1 FY 16 % Change 12,047 12,300 (2.06) 23,925 24,544 (2.52) Interest Income 10,485 11,156 (6.01) 20,919 22,433 (6.75) Interest Expenses 7,059 7,912 (10.78) 14,121 15,729 (10.22) Net Interest Income 3,426 3, ,798 6, Other Income 1,562 1, ,006 2, Total Expenses 9,356 9,963 (6.09) 18,564 20,005 (7.20) Operating Expenses 2,297 2, ,443 4, of which, Employee Cost 1,169 1, ,277 2,389 (4.69) Operating Profit 2,690 2, ,360 4, Provision for NPA 1,630 1,844 (11.61) 3,617 2, Provision for Tax (32.95) Net Profit ,177 (17.08) BUSINESS The Bank s Total Business stood at INR 9,21,681 crore as at September 30, 2016 down from INR 10,27,358 crore as at September 30, 2015 on account of planned and structured rundown of assets and liabilities. Total Deposits stood at INR 5,67,531 crore as at September 30, 2016 as against INR 6,12,458 crore as at September 30, Corresponding figures for Average Deposits (based on daily averages) were INR 5,52,714 crore and INR 5,83,650 crore. 2
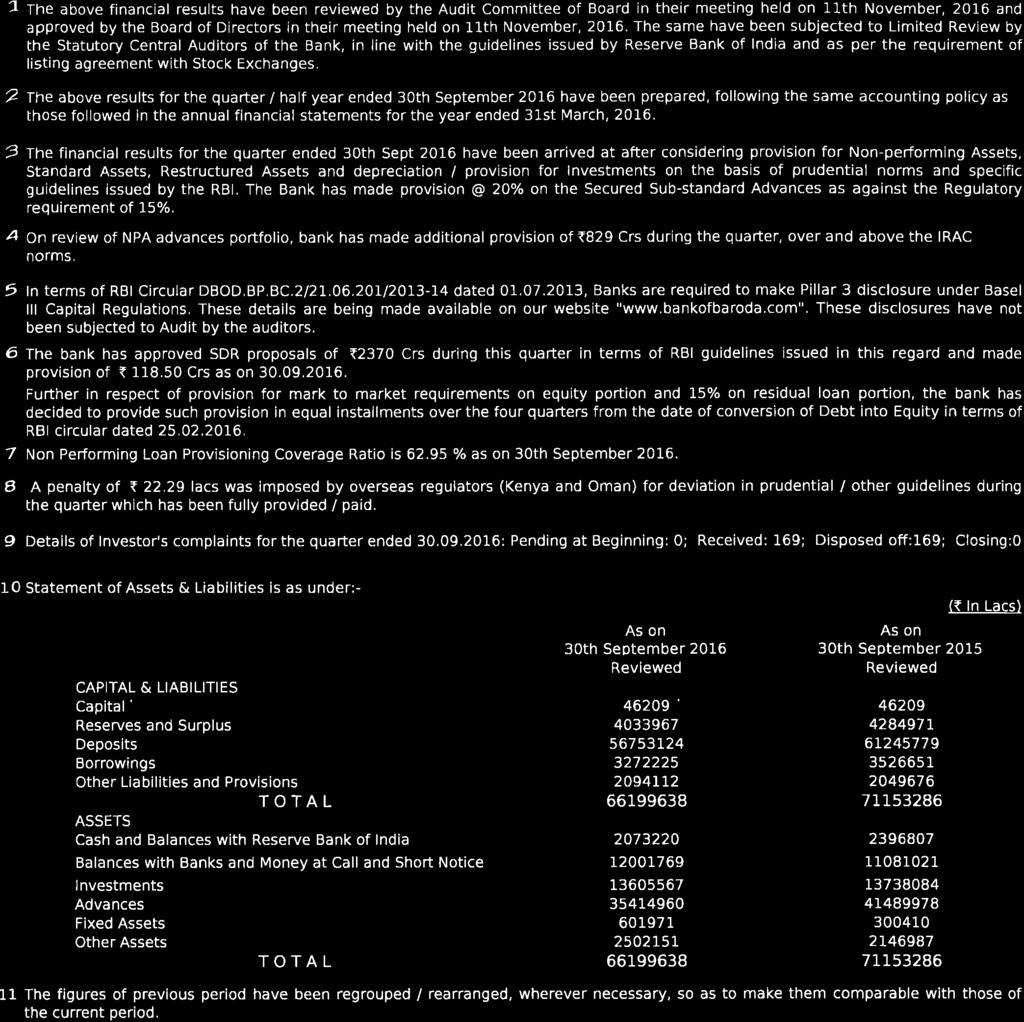
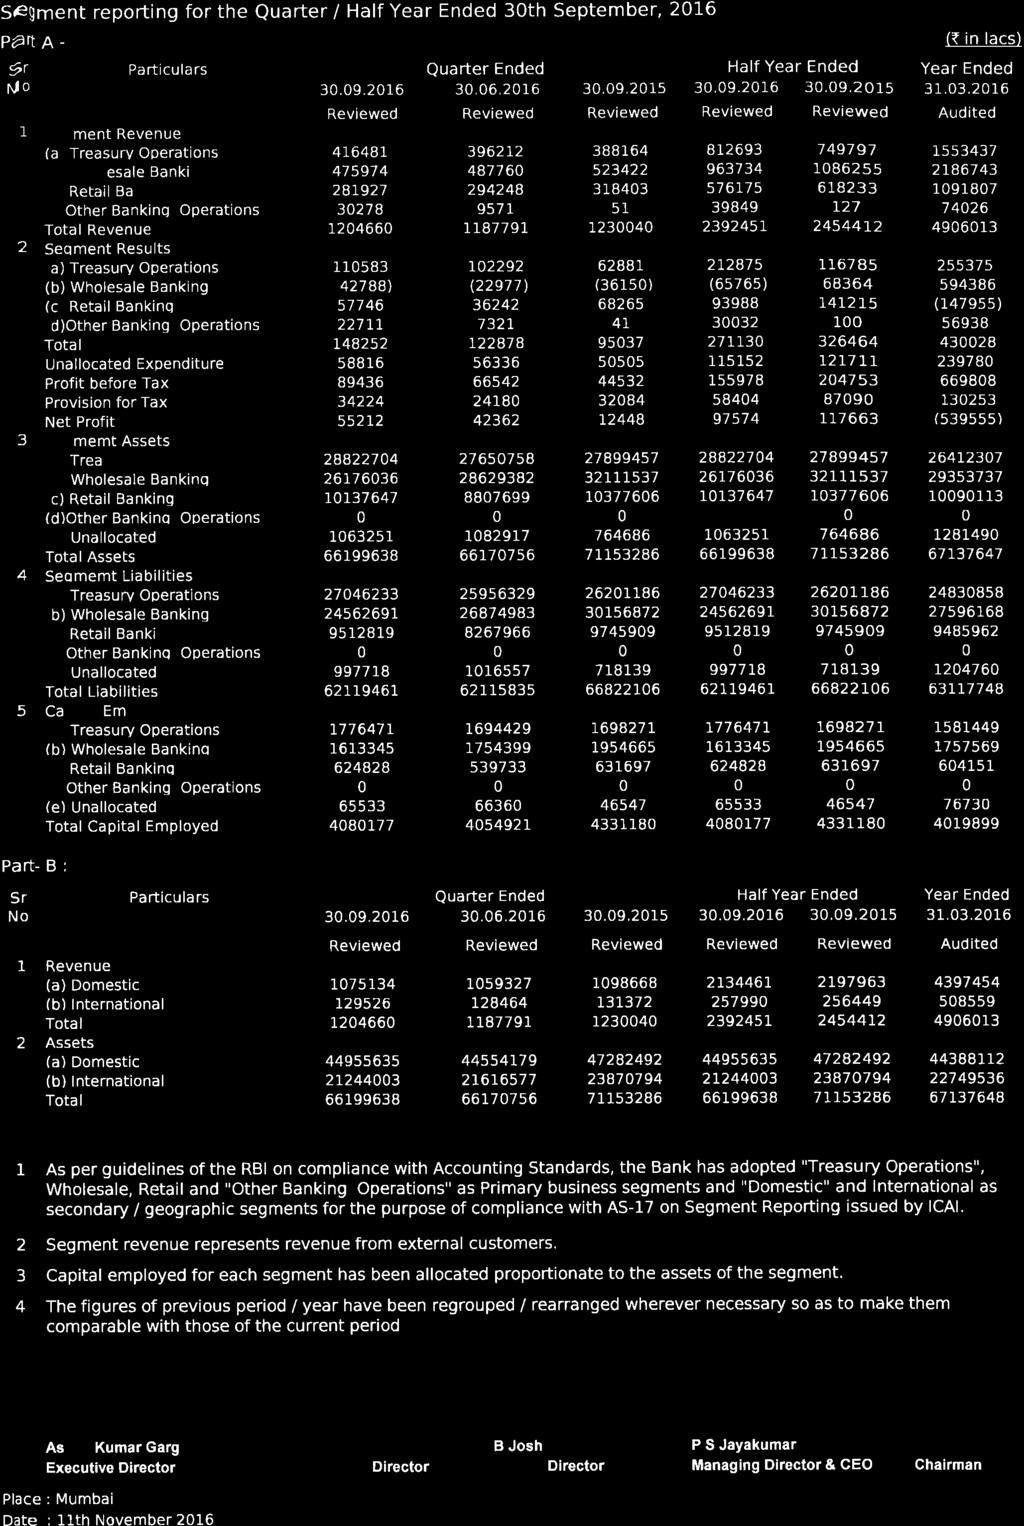
9 The Bank has rundown high cost liabilities to improve the deposit mix leading to reduction in cost of domestic deposits from 6.61% as at March 31, 2016 to 6.20% as at September 30, 2016 and also improvement in ratio of domestic CASA deposits to domestic deposits on average basis at 33.63% as compared to an average of 29.16% as at September 30, 2015 and 30.62% as at March 31, On a terminal basis, Domestic CASA percentage was at 34.23%. Domestic Savings bank deposit saw a robust growth of 16.06% y-o-y on an average basis. Total Advances (Net) were INR 3,54,150 crore as at September 30, 2016 against INR 4,14,900 crore as at September 30, 2015 and Average Advances (Gross - based on daily averages) were INR 3,76,955 crore and INR 4,06,391 crore respectively. The Bank s International Business continues to occupy a significant position. As at September 30, 2016, the International Operations contributed 29.34% to the Bank s Total Business. As a part of rebalancing of the International book, a portion of low yielding assets have been substituted with higher yielding local credit. INCOME The Bank s Total Income stood at INR 12,047 crore in Q2 FY17. Net Interest Income stood at INR 3,426 crore up by 5.61% y-o-y. Other Income increased by 36.54% on y- o-y basis to INR 1,562 crore, driven by improved core fee income as well as trading gains. EXPENSES The Bank s Total Expenses declined by 6.09% (y-o-y basis) to INR 9,356 crore in Q2 FY 17 driven primarily by reduction in cost of deposits. The interest expenses reduced by 10.78% (y-o-y basis) from INR 7,912 crore as at September 30, 2015 to INR 7,059 crore as at September 30, PROFIT Prudent management of assets and liabilities as detailed above has led to improvement in profitability. The Bank s Operating Profit was INR 2,690 crore in Q2 FY17 (as against INR 2,337 crore in Q2 FY 16), which is the highest in the last six quarters. The Bank posted a Net Profit of INR 552 crore for Q2 FY 17. NET INTEREST MARGIN The Net Interest Margin (NIM) for Domestic operations has improved from 2.80% to 2.85% while global margin improved to 2.29% from 2.23% last quarter. 3
10 ASSET QUALITY Gross NPA (GNPA) of the Bank remained stable at INR 42,949 crore as on September 30, 2016 as compared to INR 42,991 crore as at June 30, The Gross NPA ratio stood at 11.35% as compared to 11.15% as at June 30, The corresponding figures of the Net NPA ratio stood at 5.46% and 5.73% respectively. Total Restructured Standard Assets of the Bank were INR 13,860 crore as on September 30, The total Stressed Assets (GNPA + Restructured Standard Assets) were 15.02% of the Gross Advances. PROVISIONS AND CONTINGENCIES Provisions and Contingencies (excluding tax provisions) made by the Bank stood at INR 1,796 crore in Q2 FY17. Provisions against NPAs/ Bad Debts written off stood at INR 1,630 crore in Q2 FY17. The Provision Coverage Ratio (PCR) improved to 62.95% as at September 30, 2016 as compared to 60.17% last quarter and 60.09% & 52.70% as on March 31, 2016 and December 31, 2015 respectively. Provision for tax was INR 342 crore. CAPITAL ADEQUACY The CRAR on standalone basis (Basel III) is 12.94% as at September 30, Out of this, the Tier 1 capital was 10.59% and CET 1 Capital was 10.09%. TRANSFORMATION OF THE BANK The Bank is progressing on the execution of Project Navoday - a comprehensive business transformation that seeks to deliver a differentiated world-class customer experience enabled by an energised and engaged team. The Bank has set up a stateof-the-art War Room and constituted a dedicated team for monitoring the progress of Project Navoday. The Bank has re-organized the Corporate Banking vertical with a dedicated team of Relationship Managers and a Centralized Credit Processing team with sector specialization. Various digitization initiatives are underway such as: Testing of digitally enabled account opening which significantly reduces turnaround time (TAT); Self-service account opening kiosks based on Aadhar validation, which facilitates instant customer account opening; and 4
11 Disbursement of loans and deposits with reduced TAT. The Bank has also launched innovative solutions such as Digital Portable Branches in rural areas, which has the state-of-the art digital technology for the residents in the hinterland. The Bank is working on the execution of Project WeLead a comprehensive leadership development program and Project Anubhuti to boost employee engagement. The Bank is also putting in place partnerships in multiple areas such as for Startup financing, MUDRA loans, E-Commerce & Fintech firms. Bank of Baroda s efforts around brand building continue with the Bank being ranked 21 st amongst Best Indian Brands 2016 in Brand Equity. The Bank has announced a brand endorsement with ace Indian Badminton players P V Sindhu and K Srinath who represented on the international stage at the Rio 2016 Olympics. The association reaffirms the Bank s commitment to the promotion of sports and young sporting talent in India. The transformation will enable the Bank to realize improved market share, quality growth of balance sheet, diversified portfolio, enhanced fee income, strengthened internal controls and compliance, and on the back of implementing cutting-edge digital technology solutions. While this transformation exercise will be undertaken over a period of 18 months, the early benefits have started flowing from Q2 FY November 11, 2016 Mumbai 5
, in Gujarat, India.")
12 About Bank of Baroda Bank of Baroda ( The Bank ) established on July 20, 1908 is an Indian state-owned banking and financial services organization, headquartered in Vadodara (earlier known as Baroda), in Gujarat, India. Bank of Baroda is one of India s largest banks with a strong domestic presence spanning 5,368 branches and 10,441 ATMs and Cash Recyclers supported by self-service channels. The Bank has a significant international presence with a network of 107 branches/ offices subsidiaries, spanning 24 countries. The Bank has wholly owned subsidiaries including BOBCARDS and BOB Capital Markets. Bank of Baroda also has joint ventures for life insurance with IndiaFirst Life Insurance and for asset management with Baroda Pioneer Asset Management. The Bank owns 98.57% in Nainital Bank. The Bank has also sponsored three Regional Rural Banks namely Baroda Uttar Pradesh Gramin Bank, Baroda Rajasthan Gramin Bank and Baroda Gujarat Gramin Bank. Visit us at Facebook: YouTube: 6
BANK OF BARODA ANNOUNCES FINANCIAL RESULTS FOR QUARTER 1 OF FY Press Release. Highlights (Standalone Basis)
") BANK OF BARODA ANNOUNCES FINANCIAL RESULTS FOR QUARTER 1 OF FY 2017 Press Release Highlights (Standalone Basis) Operating profit of INR 2,669 crore, the highest in the last 5 quarters. Profit after Tax
BANK OF BARODA ANNOUNCES FINANCIAL RESULTS FOR QUARTER 1 OF FY 2017 Press Release Highlights (Standalone Basis) Operating profit of INR 2,669 crore, the highest in the last 5 quarters. Profit after Tax
 Press Release BANK OF BARODA ANNOUNCES FINANCIAL RESULTS FOR Q1 FY 2018 Highlights (Standalone Basis) Bank posted Operating Profit of INR 2,648 crore during Q1 FY18. Profit after Tax (PAT) at INR 203 crore
Press Release BANK OF BARODA ANNOUNCES FINANCIAL RESULTS FOR Q4 FY 2017 AND FY Highlights (Standalone Basis)
") Press Release BANK OF BARODA ANNOUNCES FINANCIAL RESULTS FOR Q4 FY 2017 AND FY 2016-17 Highlights (Standalone Basis) Operating profit of INR 3,020 crore in Q4 FY 17, up by 17.42% y-o-y. Full year FY 17
Press Release BANK OF BARODA ANNOUNCES FINANCIAL RESULTS FOR Q4 FY 2017 AND FY 2016-17 Highlights (Standalone Basis) Operating profit of INR 3,020 crore in Q4 FY 17, up by 17.42% y-o-y. Full year FY 17
Press Release. BANK OF BARODA ANNOUNCES FINANCIAL RESULTS FOR Q2 and H1 of FY Highlights (Standalone Basis)
") Press Release BANK OF BARODA ANNOUNCES FINANCIAL RESULTS FOR Q2 and H1 of FY 2017-18 Highlights (Standalone Basis) Improved Operating Performance: Operating Profit of INR 3,042 crore during Q2 FY18 registering
Press Release BANK OF BARODA ANNOUNCES FINANCIAL RESULTS FOR Q2 and H1 of FY 2017-18 Highlights (Standalone Basis) Improved Operating Performance: Operating Profit of INR 3,042 crore during Q2 FY18 registering
Press Release BANK OF BARODA ANNOUNCES FINANCIAL RESULTS FOR Q4 FY 2018 AND FY Highlights (Standalone Basis)
") Press Release BANK OF BARODA ANNOUNCES FINANCIAL RESULTS FOR Q4 FY 2018 AND FY 2017-18 Highlights (Standalone Basis) Domestic credit registered YoY growth of 17.97% within which the retail loans growth
Press Release BANK OF BARODA ANNOUNCES FINANCIAL RESULTS FOR Q4 FY 2018 AND FY 2017-18 Highlights (Standalone Basis) Domestic credit registered YoY growth of 17.97% within which the retail loans growth
BANK OF INDIA ANNOUNCES FINANCIAL RESULTS FOR QUARTER JUNE, 2016 (Q1, FY 17) PRESS RELEASE. Highlights (on Standalone basis)
 PRESS RELEASE. Highlights (on Standalone basis)") BANK OF INDIA ANNOUNCES FINANCIAL RESULTS FOR QUARTER JUNE, 2016 (Q1, FY 17) PRESS RELEASE Highlights (on Standalone basis) Total business of the Bank stood at Rs.885,573 crore as of June 2016 as compared
BANK OF INDIA ANNOUNCES FINANCIAL RESULTS FOR QUARTER JUNE, 2016 (Q1, FY 17) PRESS RELEASE Highlights (on Standalone basis) Total business of the Bank stood at Rs.885,573 crore as of June 2016 as compared
Performance Analysis:
 Performance Analysis: Q3 FY 2016 (April December 2015) February 13, 2016 2016 Bank of Baroda. All Rights Reserved 1 Bank of Baroda: Our Key Strengths Bank of Baroda is a 107 years old State-owned Bank
August 11, 2016 Performance Analysis
 August 11, 2016 Performance Analysis Q1, FY 2017 Performance Highlights: Q1 FY 17 1 Operating Profit at INR 2,669 crore, the highest in 5 quarters 2 Profit after Tax at INR 424 crore from a loss position
February 10, 2017 Performance Analysis
 February 10, 2017 Performance Analysis Q3, FY 2017 Performance Highlights: Q3 FY 17 1 2 3 Operating Profit at INR 2,595 crore, up by 52.29% Y-o-Y. Profit after Tax at INR 253 crore CASA deposits grew by
May 18, 2017 Performance Analysis
 May 18, 2017 Performance Analysis Q4 & Full Year FY 2017 Performance Highlights: Q4 & Full Year FY 17 1 2 3 4 Operating Profit at INR 3,020 crore, up by 17.42% YOY. Profit after Tax (PAT) at INR 155 crore.
Results at a Glance Q % Change
 Bank of Baroda Financial Results FY 2013-14 (FY14) and Q4: FY14 May 13, 2014 Global Business touched Rs 9.66 lakh crore level (up 20.4%, yoy) Operating Profit for Q4, FY14 at Rs 2,580 crore (up 18.2%,
Results at a Glance Q % Change
 Bank of Baroda Financial Results FY 2014-15 (FY15) and Q4: FY15 May 11, 2015 Global Business touched Rs 10.46 lakh crore level (up 8.25%, yoy) Operating Profit for Q4, FY15 at Rs 2693.52 crore (up 4.42%,
Performance Review Quarter ended June 30, 2013
 News Release July 31, 2013 Performance Review Quarter ended June 30, 2013 32% year-on-year increase in consolidated profit after tax to ` 2,747 crore (US$ 463 million) for the quarter ended June 30, 2013
News Release July 29, Performance Review: Quarter ended June 30, 2016
 News Release July 29, 2016 Performance Review: Quarter ended June 30, 2016 22% year-on-year growth in retail portfolio; domestic advances grew by 17% year-on-year at June 30, 2016 18% year-on-year growth
News Release November 7, Performance Review: Quarter ended September 30, 2016
 News Release November 7, 2016 Performance Review: Quarter ended September 30, 2016 21% year-on-year growth in retail portfolio; domestic advances grew by 16% year-on-year at September 30, 2016 18% year-on-year
Performance Review Quarter ended September 30, 2013
 News Release October 25, 2013 Performance Review Quarter ended September 30, 2013 20% year-on-year increase in standalone profit after tax to ` 2,352 crore (US$ 376 million) for the quarter ended September
ICICI Group: Performance & Strategy. May 2015
 ICICI Group: Performance & Strategy May 2015 Certain statements in these slides are forward-looking statements. These statements are based on management's current expectations and are subject to uncertainty
News Release January 31, Performance Review: Quarter ended December 31, 2016
 News Release January 31, 2017 Performance Review: Quarter ended December 31, 2016 30% year-on-year growth in savings account deposits; Current and savings account (CASA) ratio at 49.9% at December 31,
H1:FY14 % (Rs cr) (Rs cr) Change Total Income Interest Income
 (Rs cr) Change Total Income Interest Income") Bank of Baroda Financial Results Q2 and H1, 2014-15 (FY15) November 7, 2014 Operating Profit at Rs 2,403 crore in Q2, FY15, up 13.1% (y-o-y) Net Interest at Rs 3,401 crore in Q2, FY15, up 17.5% (y-o-y)
Bank of Baroda Financial Results Q2 and H1, 2014-15 (FY15) November 7, 2014 Operating Profit at Rs 2,403 crore in Q2, FY15, up 13.1% (y-o-y) Net Interest at Rs 3,401 crore in Q2, FY15, up 17.5% (y-o-y)
Press Release
 ---------------------------------------------------------------------------------------------------- Press Release Financial Results for the Quarter and Financial Year ended March 31, 2017 The Board of
The Bank that begins with. Financial Results Q3 ( )
") The Bank that begins with Financial Results Q3 (2013-14 ) HIGHLIGHTS 31.12.2013. Total Business at Rs.188867 crore, with a y-o-y growth of 19.78%. Highlights Total Deposits increased to Rs.109891 crore,
The Bank that begins with Financial Results Q3 (2013-14 ) HIGHLIGHTS 31.12.2013. Total Business at Rs.188867 crore, with a y-o-y growth of 19.78%. Highlights Total Deposits increased to Rs.109891 crore,
News Release October 30, Performance Review: Quarter ended September 30, 2015
 News Release October 30, Performance Review: Quarter ended September 30, 12% year-on-year increase in standalone profit after tax to ` 3,030 crore (US$ 462 million) for the quarter ended September 30,
ICICI Group. Performance and Strategy. February 2016
 ICICI Group Performance and Strategy February 2016 Certain statements in these slides are forward-looking statements. These statements are based on management's current expectations and are subject to
Press Release
 ---------------------------------------------------------------------------------------------------- Press Release Financial Results for the quarter and half year ended September 30, 2017 The Board of
News Release October 26, Performance Review: Quarter ended September 30, 2018
 News Release October 26, 2018 Performance Review: Quarter ended September 30, 2018 The core operating profit (profit before provisions and tax, excluding treasury income) grew by 10% year-on-year to 5,285
November 14, 2017 Performance Analysis
 November 14, 2017 Performance Analysis Q2 FY 2018 Contents Performance Highlights Business Performance Financial Performance Capital Adequacy & Shareholding Asset Quality Strengths & Initiatives Balance
Press Release
 ---------------------------------------------------------------------------------------------------- Press Release Financial Results for the Quarter and Nine Months Ended December 31, 2017. The Board of
News Release October 30, Performance Review: Quarter ended September 30, 2014
 News Release October 30, Performance Review: Quarter ended September 30, 15% year-on-year increase in standalone profit after tax to ` 2,709 crore (US$ 439 million) for the quarter ended September 30,
PRESS RELEASE. Results at a Glance
 PRESS RELEASE AXIS BANK ANNOUNCES FINANCIAL RESULTS FOR THE QUARTER AND NINE-MONTHS ENDED 31 st DECEMBER 2017 Results at a Glance Financial performance: o Q3FY18 PAT up 25% YOY & 68% QOQ to `726 crores;
154 years in service of the Nation and going strong
 Financial Results Q4 & Welcome Board of Directors 11 th May 2018 154 years in service of the Nation and going strong The Bank s Key Strengths Robust CASA Stable Operating Profit Young & energetic workforce
State Bank of India PRESS RELEASE Q1FY Operating Profit recorded a YOY growth of 18.06% Q1FY11, while sequentially it is up by 19.12%.
 SBI STAND ALONE RESULTS HIGHLIGHTS State Bank of India PRESS RELEASE Q1FY 2011-12 Operating Profit recorded a YOY growth of 18.06% Q1FY11, while sequentially it is up by 19.12%. in Q1FY12 over Net Profit
News Release January 31, Performance Review Quarter ended December 31, 2012
 News Release January 31, 2013 Performance Review Quarter ended December 31, 2012 Consolidated return on equity (annualised) of 15.7% for the quarter ended December 31, 2012 (Q3-2013) 30% year-on-year increase
Standalone profit crosses ` 10,000 crore
 News Release April 27, 2015 Standalone profit crosses ` 10,000 crore 14% year-on-year increase in standalone profit after tax to ` 11,175 crore (US$ 1.8 billion) for the year ended March 31, 2015 (FY2015)
Performance Highlights
 Indian Overseas Bank Central Office Chennai Press Release 26.10.2018 Performance Highlights - 30.09.2018 Net Loss is due to provisions on bad debts and investment and not due to operations. Performance
Q2 FY17 Q2 FY16 YOY Q1 FY17
 For immediate release RBL Bank H1 Net Profit up by 61.76% at Rs.205.85 crore (before exceptional item) on a YoY basis Operating Profit up by 73.63% to Rs.403.55 crore on a YoY basis Capital Adequacy Ratio
PRESS RELEASE. Results at a Glance
 PRESS RELEASE AXIS BANK ANNOUNCES FINANCIAL RESULTS FOR THE QUARTER AND YEAR ENDED 31 st MARCH 2017 Results at a Glance Quarterly Earnings register strong sequential growth: o Net Profit for Q4FY17 grew
News Release May 3, Performance Review: Quarter ended March 31, 2017
 News Release May 3, 2017 Performance Review: Quarter ended March 31, 2017 189% increase in standalone profit after tax from ` 702 crore (US$ 108 million) for the quarter ended March 31, 2016 (Q4-2016)
FINANCIAL HIGHLIGHTS FOR THE QUARTER ENDED
 FINANCIAL HIGHLIGHTS FOR THE QUARTER ENDED 30 th JUNE 2015 PERFORMANCE HIGHLIGHTS- FY 20 Total Business of the Bank increased to Rs. 4,51,739 crore from Rs. 4,26,829 crore in June 2014, recording Y-o-Y
PROGRESS AT A GLANCE (Rs. in Crore)
") PRESS RELEASE 16.05.2017 MARCH 17 QUARTER PERFORMANCE HIGHLIGHTS Business Performance Growth in Key Parameters (Mar 16 Mar 17) Business grew by 9.3% - from Rs. 310673 Cr to Rs. 339673 Cr. Total Deposits
PRESS RELEASE 16.05.2017 MARCH 17 QUARTER PERFORMANCE HIGHLIGHTS Business Performance Growth in Key Parameters (Mar 16 Mar 17) Business grew by 9.3% - from Rs. 310673 Cr to Rs. 339673 Cr. Total Deposits
PRESS RELEASE. Federal Bank Delivers Highest Ever Operating Profit of Rs.589 Cr in Q4
 May 9, 2018 PRESS RELEASE Federal Bank Delivers Highest Ever Operating Profit of Rs.589 Cr in Q4 Federal Bank announced its audited financial results for the quarter and year ended 31 st March 2018 today
Growth Powered by Technology, Driven by Customers. Financial Results 31 st March 2017
 Financial Results 31 st March 2017 Performance Highlights Q4 FY 2016-17 NET INTEREST INCOME ` 989.49 cr NON INTEREST INCOME ` Rs.450.16 cr OPERATING PROFIT ` Rs.703.12 cr NET PROFIT ` 203.99 cr NET INTEREST
Continued to perform on core operating parameters
 News Release May 7, 2018 Performance Review: Quarter ended March 31, 2018 Strong balance sheet growth Total domestic loan growth at 15% year-on-year at March 31, 2018 driven by retail Retail loans grew
ICICI Group: Performance & Strategy. May 2016
 ICICI Group: Performance & Strategy May 2016 Agenda Indian economy ICICI Group Key International regulatory business developments 2 India: strong long term fundamentals Key drivers of growth Favourable
Performance Highlights
 INDIAN OVERSEAS BANK CENTRAL OFFICE CHENNAI PRESS RELEASE 13.02.2018 Performance Highlights 31.12.2017 Top Line Milestones (Rs. Crores) Deposits Rs. 2,16,592 Advances Rs. 1,51,536 Business Mix Rs. 3,68,128
Capital Adequacy Ratio (Basel III) Earnings Per share, Book Value Per Share & Share Holdings Pattern
 Earnings Per share, Book Value Per Share & Share Holdings Pattern") 1 Sl. No. Areas of Presentation Slide No 1 Highlights 3 2 Business Cross Section 4 3 Domestic CASA 5 4 Domestic Advances 6 5 Retail Credit Components 7 6 Industry & NBFC Exposure 8 7 Restructured Advances,
1 Sl. No. Areas of Presentation Slide No 1 Highlights 3 2 Business Cross Section 4 3 Domestic CASA 5 4 Domestic Advances 6 5 Retail Credit Components 7 6 Industry & NBFC Exposure 8 7 Restructured Advances,
Performance Highlights for the year ended 31 st March, 2017.
 Sector Bank A Premier Public Sector Bank Performance Highlights for the year ended 31 st March, 2017. 1. Performance highlights of the Bank March 17 [Q4] over March 16[Q4]: [Rs. in Crore] As at As at Parameter
2. PROFIT & LOSS (P&L): Operating and Net Profitability Sustained Delivery
: Operating and Net Profitability Sustained Delivery") Press Release January 18, 2018 YES BANK announces Financial Results for the Quarter and Nine Months ended December 31, 2017 1. KEY HIGHLIGHTS FOR Q3FY18 Balance Sheet crossed ` 2.5 Lakh Crores and Advances
Press Release January 18, 2018 YES BANK announces Financial Results for the Quarter and Nine Months ended December 31, 2017 1. KEY HIGHLIGHTS FOR Q3FY18 Balance Sheet crossed ` 2.5 Lakh Crores and Advances
Financial Results Q2 & H1 FY November 06, 2015
 Financial Results Q2 & H1 FY 2015-16 November 06, 2015 Highest Gainer in Brand Value Brand value rises 72% on accelerated digitalization efforts. 2 Structural Transformation Initiative 3 Performance Highlights
News Release July 31, 2014
 News Release July 31, 2014 Performance Review: Quarter ended June 30, 2014 17% year-on-year increase in standalone profit after tax to ` 2,655 crore (US$ 441 million) for the quarter ended June 30, 2014
State Bank of India PRESS RELEASE H1FY
 SBI STAND ALONE RESULTS HIGHLIGHTS State Bank of India PRESS RELEASE H1FY 2011-12 Net Profit of the Bank is up by 12.36% YOY from Rs.2501 crores in Q2 FY11 to Rs.2810 crores in Q2FY12. Sequentially it
: Rs % Performance Highlights for the Q3 FY 12 and 9M FY 12 ended December 2011
 Press Release TOTAL BUSINESS CROSSES Rs 6,00,000 CRORE. CASA DEPOSITS CROSS Rs 1,25,000 CRORE TOTAL ASSETS CROSS Rs. 4,21,000 CRORE. NET INTEREST MARGIN REMAINS HIGH AT 3.85% BOOK VALUE PER SHARE ABOVE
HIGHLIGHTS OF WORKING RESULTS
 1 HIGHLIGHTS OF WORKING RESULTS 2 Business Global Business at ` 4,96,122 Crore. Grew by 6% (Y-o-Y) Global Advances at ` 2,23,346 Crore. Grew by 8%(Y-o-Y) Income Net - Interest Income increased by 4% (Y-o-Y)
FINANCIAL HIGHLIGHTS FOR THE 1 ST QUARTER ENDED 30 TH JUNE 2018
 FINANCIAL HIGHLIGHTS FOR THE 1 ST QUARTER ENDED 30 TH JUNE 2018 PERFORMANCE HIGHLIGHTS- FY 20 Total Business of the Bank increased to Rs. 4,68,535 crore as at June 30, 2018 compared to Rs. 4,66,360 crore
FINANCIAL RESULTS HY 1 / Q2 FY 18
 1 FINANCIAL RESULTS HY 1 / Q2 FY 18 2 EMERGING ECONOMIC & BANKING SCENARIO Domestic Economy Reset in New Normal Govt s Mega Recapitalization Plan Improved Economic Macros Credit Growth shows green shoots
News Release July 27, 2018
 News Release July 27, 2018 Performance Review: Quarter ended June 30, 2018 The core operating profit (profit before provisions and tax, excluding treasury income) grew by 17% year-on-year to 5,042 crore
Press Release YES BANK announces Q2FY15 and H1FY15 (Audited) Financial Results
 Financial Results") Press Release YES BANK announces Q2FY15 and H1FY15 (Audited) Financial Results Net Profit of ` 482.5 crore in Q2FY15; y-o-y growth of 30.0% based on robust growth in Net Interest Income. Net Interest Income
Press Release YES BANK announces Q2FY15 and H1FY15 (Audited) Financial Results Net Profit of ` 482.5 crore in Q2FY15; y-o-y growth of 30.0% based on robust growth in Net Interest Income. Net Interest Income
FINANCIAL HIGHLIGHTS FOR THE QUARTER / NINE MONTHS ENDED
 FINANCIAL HIGHLIGHTS FOR THE QUARTER / NINE MONTHS ENDED 31 ST DECEMBER 2015 PERFORMANCE HIGHLIGHTS- / 20 Total Business of the Bank increased to Rs. 4,59,266 crore from Rs. 4,41,510 crore in December
PRESS RELEASE. Results at a Glance
 PRESS RELEASE AXIS BANK ANNOUNCES FINANCIAL RESULTS FOR THE QUARTER AND HALF YEAR ENDED 30 th SEPTEMBER 2017 Results at a Glance Strong Retail franchise continues to gain strength: o CASA deposits grew
ICICI Group: Performance & Strategy. November 2015
 ICICI Group: Performance & Strategy November 2015 Certain statements in these slides are forward-looking statements. These statements are based on management's current expectations and are subject to uncertainty
News Release October 27, Performance Review: Quarter ended September 30, 2017
 News Release October 27, 2017 Performance Review: Quarter ended September 30, 2017 Decline in gross NPA additions to 4,674 crore (US$ 716 million) in the quarter ended September 30, 2017 (Q2-2018) compared
News Release January 21, Performance Review Quarter ended December 31, 2009
 News Release January 21, 2010 Performance Review Quarter ended December 31, 6% sequential increase in standalone profit after tax to Rs. 1,101 crore for the quarter ended December 31, from Rs. 1,040 crore
News Release January 30, Performance Review: Quarter ended December 31, 2018
 News Release January 30, 2019 Performance Review: Quarter ended December 31, 2018 Core operating profit (profit before provisions and tax, excluding treasury income) grew by 14% year-on-year to 5,667 crore
The Bank that begins with. Financial Results Q-3 / FY
 The Bank that begins with Financial Results Q-3 / FY 2017-18. Results at a Glance Q-3(FY 2017-18). Performance Parameter (Rs/Cr) Q3-18 Ratio for Q-3 (in %) Q3-18 Operating Profit 182 Return on Assets -1.82
Q3-2018: Performance review. January 31, 2018
 Q3-2018: Performance review January 31, 2018 Certain statements in these slides are forward-looking statements. These statements are based on management's current expectations and are subject to uncertainty
HIGHLIGHTS OF WORKING RESULTS
 1 HIGHLIGHTS OF WORKING RESULTS 2 Business Global Business at ` 4,67,626 Crore Savings Deposits grew by 23% (Y-o-Y) Income Non - Interest Income increased by 38% (Y-o-Y) Profit Advances Consistent and
FINANCIAL HIGHLIGHTS FOR THE QUARTER / NINE MONTHS ENDED
 FINANCIAL HIGHLIGHTS FOR THE QUARTER / NINE MONTHS ENDED 31 ST DECEMBER 2014 PERFORMANCE HIGHLIGHTS- / 20 Total Business of the Bank increased to Rs. 4,41,510 crore from Rs. 4,12,164 crore in December
Performance Review Quarter ended December 31, 2011
 News Release January 31, 2012 Performance Review Quarter ended December 31, 2011 29% year-on-year increase in consolidated profit after tax to ` 5,833 crore (US$ 1.1 billion) for the nine months ended
FY2018: Performance review. May 7, 2018
 FY2018: Performance review May 7, 2018 Certain statements in these slides are forward-looking statements. These statements are based on management's current expectations and are subject to uncertainty
Q1-2018: Performance review. July 2017
 Q1-2018: Performance review July Certain statements in these slides are forward-looking statements. These statements are based on management's current expectations and are subject to uncertainty and changes
Q2-2019: Performance review. October 26, 2018
 Q2-2019: Performance review October 26, 2018 Except for the historical information contained herein, statements in this release which contain words or phrases such as 'will', expected to, etc., and similar
Brickwork Ratings upgrades the ratings from BWR BBB+ to BWR A- for Lakshmi Vilas Bank s Long Term Bonds Issue of `250 Crore
 Rating Rationale Brickwork Ratings upgrades the ratings from BWR BBB+ to BWR A- for Lakshmi Vilas Bank s Long Term Bonds Issue of `250 Crore Brickwork Ratings revises the Ratings 1 for Long Term Bonds
State Bank of India PRESS RELEASE FY 2016
 State Bank of India PRESS RELEASE FY 2016 SBI STAND ALONE RESULTS HIGHLIGHTS Q4FY16 OVER Q4FY15 Interest Income on Advances increased from Rs.28,269 Crores in Q4FY15 to Rs.29,242 Crores in Q4FY16 (3.45%
FY Annual Results. Investor Presentation
 FY 2011-12 Annual Results Investor Presentation Performance Highlights Q4FY12 12M FY12 Net Profit 25% YOY 25% YOY Net Interest Income 26% YOY 22% YOY Fee Income 8% YOY 25% YOY Operating Revenue 18% YOY
The Bank that begins with Financial Results Q1, F.Y
 The Bank that begins with Financial Results Q1, F.Y. 2012-13 Analyst Meet August 8 th, 2012 Performance Highlights Jun - 2011 Jun - 2012 Percent 153264 Total Business 130201 17.7 Deposit 77104 89639 16.3
The Bank that begins with Financial Results Q3 & 9-Months
 The Bank that begins with Financial Results Q3 & 9-Months 2011-12 Tele-Conference with Analysts February 7 th, 2012; 3.30 P.M. Performance Highlights Dec - 2010 Dec - 011 Percent 141915 Total Business
Annual Results FY 08. May 02, 2008
 Annual Results May 02, 2008 1 BUSINESS HIGHLIGHTS SBI Group net profit crosses USD 2.24 Billion (Rs 8,960 crore) SBI Stand-alone Net Profit crosses Rs 6,700 crore Net Profit for at Rs 6,729 crore, up by
IndusInd Bank. Analysts Meet FY
 IndusInd Bank Analysts Meet FY 2006-07 Disclaimer This presentation and subsequent discussions may contain forward-looking statements with respect to IBL s financial condition, objectives and strategies.
Financial Results Q4-10 & FY Analyst Presentation
 Financial Results Q4-10 & FY 2010 Analyst Presentation 6th May, 2010 HIGHLIGHTS OF BUSINESS GROWTH Total Business increased from Rs.236968 Cr. to Rs.291289 Cr. an increase of 22.92% Total Deposits registered
News Release July 29, 2011
 News Release July 29, 2011 Performance Review Quarter ended June 30, 2011 53% year-on-year increase in consolidated profit after tax to ` 1,667 crore (US$ 373 million) for the quarter ended June 30, 2011
Audited Quarterly & Full-Year Results March 31, 2015
 Earnings Update Audited Quarterly & Full-Year Results March 31, 2015 The Board of Directors of The Jammu & Kashmir Bank Ltd. at their meeting held on May 16, 2015 took on record the Audited Financial Results
Presentation on Performance
 Presentation on Performance Q1 (2017 18) August 14, 2017 1 Turnaround Strategy of the Bank Focus Areas Improving CRAR in the short and medium term through fresh resource raising from the government as
Press Release. For Immediate Release. Consolidated Audited Financial Results for Q4 and FY Ended 31 st March, 2018
 Press Release For Immediate Release 03 rd May, 2018, New Delhi Consolidated Audited Financial Results for Q4 and FY 2017-18 Ended 31 st March, 2018 The Board of Directors of PNB Housing Finance Limited
Investor Presentation MARCH-2013
 Investor Presentation MARCH-2013 IMPORTANT NOTICE No representation or warranty, express or implied is made as to, and no reliance should be placed on, the fairness, accuracy, completeness or correctness
(_NI r- elki 1 iii)05li V. 3TaTTH?V, R 0? C
05li V. 3TaTTH?V, R 0? C") CIN: L65190MH2004G01148838 31> 3l tmf21d6 ti ft-a 0,1eliCle4 : 311 z- e-iii oid-,actd, colo tre`u, 311 CT,R, t4-400 005. 47W : (+91 22) 6655 3355, 2218 9111 : (+91 22) 2218 0411 t-4t11-"c: www.idbi.com
CIN: L65190MH2004G01148838 31> 3l tmf21d6 ti ft-a 0,1eliCle4 : 311 z- e-iii oid-,actd, colo tre`u, 311 CT,R, t4-400 005. 47W : (+91 22) 6655 3355, 2218 9111 : (+91 22) 2218 0411 t-4t11-"c: www.idbi.com
Investor Presentation Q2 FY November 2017
 Investor Presentation Q2 FY 2017-18 November 2017 Disclaimer 2 This presentation is confidential and may not be copied, published, distributed or transmitted. The information in this presentation is being
The Bank that begins with Financial Results Q3 & 9Months, F.Y
 The Bank that begins with Financial Results Q3 & 9Months, F.Y. 2012-13 Concall with Analysts 4 th March, 2013 Performance Highlights Mar - 2012 Dec - 2011 Dec - 2012 Percent 152989 157682 Total Business
State Bank of India Q2FY09 RESULTS ANALYSTS MEET
 State Bank of India Q2FY09 RESULTS ANALYSTS MEET 27.10.2008 Operating and Net Profit 4193 Q2FY08 Q2FY09 Rs. In Crs 2714 28.43% 54.52% 1611 36.04% 2260 40.23% Operating Profit Net Profit 1 34454 Deposit
Movement of business parameters
 2 Movement of business parameters. [ Amt. in Rs. Crore ] During Qtr./ As on QE Q3 vs Q4 Change (%) Performance Highlights During FY/ As on END YoY Change (%) Q3 FY'17 Q4FY'17 2015-16 2016-17 209572 201285-3.95
Analyst Presentation Q2 FY16 2
 Q2 FY 2016 Disclaimer: Certain statements contained in this presentation may be statements of future expectations and other forward-looking statements that are based on third party sources and involve
YES BANK announces Q4FY10 and FY10 Financial Results
 Press Release YES BANK announces Q4FY10 and FY10 Financial Results Net Profit of Rs. 140.0 crore in Q4FY10; highest ever since inception Net Profit of Rs. 477.7 crore in FY10 ; y-o-y growth of 57.2% Loan
Performance review. May 2016
 Performance review May 2016 Certain statements in these slides are forward-looking statements. These statements are based on management's current expectations and are subject to uncertainty and changes
DENA BANK. WELCOMES YOU AT ANALYST MEET 6 th November Un-Audited [Reviewed] Quarterly/Half Yearly Financial Results For September 30, 2012
![DENA BANK. WELCOMES YOU AT ANALYST MEET 6 th November Un-Audited [Reviewed] Quarterly/Half Yearly Financial Results For September 30, 2012](/thumbs/88/115527137.jpg "DENA BANK. WELCOMES YOU AT ANALYST MEET 6 th November Un-Audited [Reviewed] Quarterly/Half Yearly Financial Results For September 30, 2012") DENA BANK WELCOMES YOU AT ANALYST MEET 6 th November 01 Un-Audited [Reviewed] Quarterly/Half Yearly Financial Results For September 30, 01 KEY INDICATORS [` cr] Full Year Quarter March 1 Sept 11 Sept 1
DENA BANK WELCOMES YOU AT ANALYST MEET 6 th November 01 Un-Audited [Reviewed] Quarterly/Half Yearly Financial Results For September 30, 01 KEY INDICATORS [` cr] Full Year Quarter March 1 Sept 11 Sept 1
Investor Presentation March-2014
 Investor Presentation March-2014 1 IMPORTANT NOTICE No representation or warranty, express or implied is made as to, and no reliance should be placed on, the fairness, accuracy, completeness or correctness
Quarterly Results Q3FY15
 Quarterly Results Q3FY15 13 th February 2015 Safe Harbor Certain statements in these slides are forward-looking statements. These statements are based on management's current expectations and are subject
India & ICICI Group. Trends & Outlook. November 2015
 India & ICICI Group Trends & Outlook November 2015 Certain statements in these slides are forward-looking statements. These statements are based on management's current expectations and are subject to
Q1-2019: Performance review. July 27, 2018
 Q1-2019: Performance review July 27, Except for the historical information contained herein, statements in this release which contain words or phrases such as 'will', expected to, etc., and similar expressions
Financial Results Q1 FY July 28, 2015
 Financial Results Q1 FY 2015-16 July 28, 2015 A Step Towards Digitalization 2 Performance Highlights Business Opex Profitability Global Business increased by 8.6% to ` 582817 crore Savings Deposits grew
ICICI Group: Performance & Strategy. September 2017
 ICICI Group: Performance & Strategy September 2017 Agenda Indian economy and banking sector ICICI Group Key International regulatory business developments 2 India: strong long term fundamentals Key drivers
Investor Presentation Q3 FY2013
 Investor Presentation Q3 FY2013 IMPORTANT NOTICE No representation or warranty, express or implied is made as to, and no reliance should be placed on, the fairness, accuracy, completeness or correctness
FINANCIAL HIGHLIGHTS FOR THE 4 TH QUARTER & FINANCIAL YEAR ENDED 31 ST MARCH 2018
 FINANCIAL HIGHLIGHTS FOR THE 4 TH QUARTER & FINANCIAL YEAR ENDED 31 ST MARCH 2018 PERFORMANCE HIGHLIGHTS- & 20 Total Business of the Bank improved to Rs. 4,72,323 crore in March 31, 2018 as against Rs.