Supplemental Document for 3 rd Quarter of Fiscal Year February 3, 2017 Nippon Suisan Kaisha, Ltd.
|
|
|
- Tyrone Wiggins
- 5 years ago
- Views:
Transcription
1 Supplemental Document for 3 rd Quarter of Fiscal Year 2016 February 3, 2017 Nippon Suisan Kaisha, Ltd.
2 Overview of the 3 rd Quarter of FY2016 Revised up annual forecast In addition to the recovery of Salmon/Trout market price, domestic Marine Products and Food Products Business went strong due to a strong yen and an advantage in price of major raw materials. Despite a decrease in sales revenue by foreign exchange movement, operating income increased approximately 8% from the previous year. Since this trend has been continuing in 4 th quarter, we have revised up annual forecast <Operating Income> Result of 15/ Result of 16/ Marine Products Fine Chemicals Food Products Logistics Others Common Costs 3Q of FY2015 3Q of FY2016 Increase/Decrease (Y-on-Y) (Amount) (%) Net Sales 4,867 4,688 (178) 96.3 Operating Income (50) Result of 3Q of FY2015 Result of 3Q of FY2016 2
3 Forecast for FY2016 (Consolidated) Net Profit is expected to be record-high three years in a row During consolidated cumulative 3 rd quarter, drastic recovery of Salmon/Trout market price in Marine Products Business and strong sales and lower costs of imported materials in Food Products Business resulted in a more than expected increase in profit. Therefore, we have revised up annual forecast on November 4, On a full year basis, it is expected that operating income exceeds that of previous year and ordinary income posts recordhigh. In addition, net profit is expected to be record-high three years in a row. Revised Plan Revised Plan Increase as of Nov. 4 as of Feb. 3 /Decrease Annual Annual Annual Result of FY2015 (Annual) Net Sales 6,050 6, ,371 Operating Income Ordinary Income Profit attributable to onwers of parent Exchange rate among overseas subsidiaries Estimated exchange rate for FY2016 (Original) Estimated exchange rate for revised plan for FY2016 (As of Nov. 4) Actual rate for 3Q of FY2016 (As of Sep. 30) Estimated exchange rate for revised plan for FY2016 (As of Feb. 3) US Dollars yen yen yen Euro yen yen yen Denmark Kronne yen yen yen yen yen yen 3
4 Overview of 3 rd Quarter of FY2016 by Segment Decrease in sales but significant increase in profit in both Marine and Food Products Business Result of 3Q of FY2016 Result of 3Q of FY2015 Increase/Decrease (Amount) (%) Revised plan for FY2016 as of Nov. 4 Progress rate Net Sales 4,688 4,867 (178) , Marine Products 1,952 2,106 (153) , Food Products 2,257 2,305 (47) , Fine Chemicals (1) Logistics Others Operating Income Marine Products Food Products Fine Chemicals (6) Logistics (0) Others 3 5 (1) Common Costs (21) (18) (2) (30) 70.6 Ordinary Income Profit attributable to owners of parent EPS(Net Profit per share)(unit : yen) yen yen yen - From this fiscal year, fish roe business shifted from Food Products Business to Marine Products Business. Previous year s data was adjusted accordingly. (Previous year Sales : 2,373 million yen and Operating Income : 355 million yen) 4
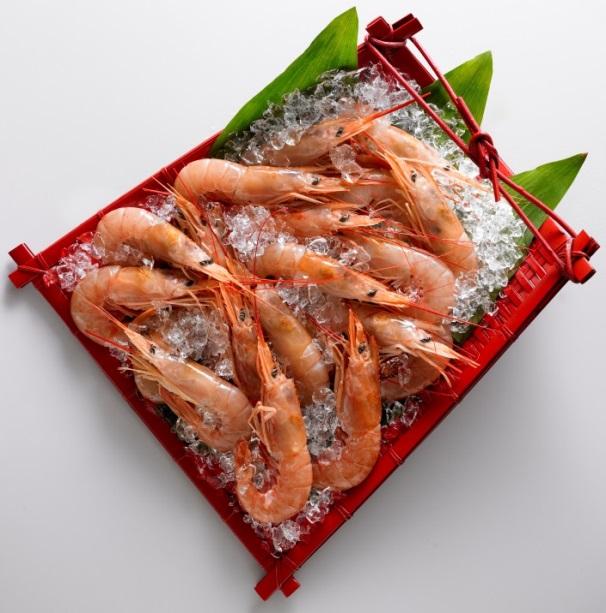
5 Main Causes of fluctuations In North America, both Marine and Food Products Business struggled but in South America, Salmon/Trout business recovered due to the recovery of market price. In Japan, both Marine and Food Products Business kept strong and profit increased year-on-year Marine Products (Main Causes of fluctuations) 3Q of FY2015 (16) <North America> Overseas Marine : Decrease in Pollock roe production, weak fillet market Food : Struggle in frozen food business for retail due to tougher competition (3) <Europe> Increase in raw material costs due to weaker Euro (6) Domestic <Fine Chemicals> Decrease in production of medical materials and increase in selling cost Overseas <South America> Recovery of Salmon/Trout market price and increase in the value of the fish in the pond covered the loss of toxic tide Food Products Fine Chemicals <Marine> Nissui nonconsolidated secured the profit in various species including shrimp. Domestic fishing kept strong. Domestic <Food> Nissui nonconsolidated kept strong in frozen food for retail and food service. Chilled business kept strong as well. 3Q of FY2016 5
6 Comparison of Net Sales by Segment Matrix (Y-on-Y) Decrease in sales revenue due to slumps in North American Marine and Food Products Business and negative foreign exchange effect. Japan North America South America Asia Europe Sub Total Consolidated Adjustment Grand Total Marine Products Food Products Fine Chemicals Logistics Others Sub Total Consolitaed Adjustment 1,653 (50) 331 (91) 123 (43) 48 (15) 307 (54) 2,464 (255) (511) 101 1,952 (153) 1, ,719 (613) 2,106 2, (121) 52 (4) ,101 (50) (844) 2 2,257 (47) 2, ,151 (846) 2, (2) 2 (0) 203 (2) (15) (1) (16) (99) (7) (92) (2) (2) (37) (58) 149 4, (213) 123 (43) 103 (20) 469 (54) 6,197 (297) 4, ,494 (1,224) 8 (124) 55 (85) 41 (68) 12 (5) 0 (1,508) 118 (1,232) (180) (127) (80) (6) (1,627) Grand Total 3, (158) 38 (1) 35 (7) 463 (54) 4,688 (178) 1 3, ,867 (Unit :100 million yen) Impact of Other than impact Currency exchange rate of exchange rate The upper columns indicates the result of 3Q of FY2016 and the lower columns indicates that of FY2015. The Italic and bold figures mean increase/decrease. Consolidated adjustment include elimination between the group companies. The breakdown of the decrease in income (Y-on-Y)(Note: 1) : - 25,200 million yen (Note 2 : Decrease due to appreciating yen on USD, EUR and DKK) - 7,900 million yen (Note:2 Decrease due to other than impact of exchange rate) 3,400 million yen ( Increase in Japan), +11,800 million yen (Consolidated adjustment) Total USD (155) (112) (267) EUR (31) 31 (0) DKK (58) 4 (55) Others (8) (2) (10) Total (252) (79) (331) (Note: 2) 6
7 Comparison of Operating Income by Segment Matrix (Y-on-Y) Increase in profit as a whole due to the recovery in South America and strong business in Japan despite slumps in North America Marine Products Food Products Fine Chemicals Logistics Others Common Costs Sub Total Consolidated Adjustment Grand Total Consolidated Japan North America South America Asia Europe Common Costs Sub Total Grand Total Adjustment (9) (1) (17) (7) 5 (2) 12 (1) (1) (6) (6) (6) 15.1 (3.4) (1) 14 (1) (0) 12.2 (1.4) (0) (2) (0) (0) 3 (2) (1) 2.1 (1.5) 6 (0) 6 (0) (21) (2) (21) (2) 0 (0) (21) (2) (19) (19) 0 (18) (16) (3) (21) (2) (17) 8 21 (19) (1) (4) (0) (0) (0) 0 0 (0) 3 4 (0) (0) 2 (0) (1) 0 (0) (11) (0) (2) (21) (2) (15) 7 19 (18) The upper columns indicates the result of 3Q of FY2016 and the lower columns indicates that of FY2015. The Italic and bold figures mean increase/decrease. Consolidated adjustment includes amortization of goodwill and unrealized income in inventory. Ratio of Operating Income to Net Sales 7
8 Consolidated Income Statement (Y-on-Y) Ratio of Operating income to Net Sales improved to 4% Result of 3Q of FY2016 % Result of 3Q of FY2015 % Increase/ Decrease Net Sales 4,688 4,867 (178) (3.7) Gross Profit 1, , (15) (1.5) SGA Expenses (28) Operating Income Non-Operating Income (1) Non-Operating Expenses (5) Ordinary Income Extraordinary Income 1 16 (14) Extraordinary Expenses 8 11 (3) Income before taxes Income taxes - current (7) Income taxes - deferred Profit Prof it attributable to non-controlling interest 7 9 (2) Profit attributable to owners of parent % Breakdown of SGA expenses and others (Y-on-Y) <SGA Expenses> Result of 3Q of FY2016 Result of 3Q of FY2015 Selling Expenses (455) (467) 11 General administrative Expenses (351) (364) 12 Advertisement Expenses (20) (25) 4 <Non-Operating Income/Expenses> Total (828) (857) 28 Gain on sales of investment securities 4 11 (6) Share of profit of entities accounted for using equity method Interest expenses (After deduction of interest income) (14) (17) 3 Others 4 4 (0) <Extraordinary Income/Expenses> Increase /Decrease Total Gain on sales of investment securities 0 14 (14) Loss on disaster (Toxic tide in Chile, 2016 Kumamoto Earthquake) (2) - (2) Others (4) (9) 5 Total (6) 4 (11) 8
9 Consolidated Balance Sheet (Y-on-Y) Equity ratio improved drastically due to public stock offering Current Assets 2, Non-current Assets 2,210 (71) Total Assets 4, Current Liabilities 2, Non-current Liabilities 826 (366) Net Assets 1, Shareholder s equity 1, The Italic and bold figures means increase/decreased, compared to 4Q of FY2015. Equity Ratio 16/3 21.3% 16/ % Main Causes of Fluctuations (Unit :100 million yen) Assets 92 Current Assets 164 Cash and Deposit Accounts Receivable Inventories Non-current Assets Liabilities (92) Current Liabilities Non-current Liabilities (71) Property, plant & equipment Intangible Assets Investments and other assets 273 Accounts Payable Short-term loans payable (366) Long-term loans payable Net defined benefit liability Net Assets 185 Capital Capital Surplus Retained Earnings Valuation difference on securities Foreign Currency Adjustment (75) 23 (16) (78) (347) (16) (Note1) : Decrease in investment securities : - 6,500 million yen (Note 2) : Increase by public stock offering : 13,900 million yen (Effect to equity ratio by public stock offering : 3.1%) (Note 3) : Decrease in other comprehensive income by decreasing foreign currency adjustment : -6,600 million yen (89) (Note 1) (Note 2) (Note 3) 9
10 Consolidated Cash Flow Statement (Y-on-Y) Operating cash flows stays the same year-on-year. Repayment of borrowings by the part of capital increase based on public stock offering. Result of 3Q of FY2016 Result of 3Q of FY2015 Increase /Decrease Income before income taxes Depreciation & Amortization (5) Working Capital (66) (64) (1) Income taxes paid (43) (41) (2) Others (45) (44) (0) Net cash provided by operating activities (3) Investment on (purchase of) plant and equipment (193) (130) (62) Others 40 (40) 80 Net cash provided by investment activities (152) (171) 18 Increase(Decrease) in short-term lonas payable 112 (13) 126 Increase(Decrease) in long-term loans payable (200) (16) (183) Income by issuing new stocks Others (22) (21) (0) Net cash provided by financial activities 29 (52) 81 (Note :1) (Note :2) (Note :3) (Note :3) (Note :4) Main Causes of Increase/Decrease <Provided by investment activities> (Note 1) Construction of the plant for medicine Construction of ancillary facilities (dock) of seafood processing company in North America Construction of carrier of a fisheries company (Note 2) Decrease in purchase of securities <Provided by financial activities> (Note 3) Repayments of long-term loans payable, etc. (Note 4) Increase by public stock offering 10
11 Consolidated Loan Payable and Net Interest Cost Decrease interest-bearing-loan by producing operating cash flow same level as previous year. Overseas Subsidiaries Domestic Subsidiaries Non-consolidated 2,500 2,000 1, ,840 1, ,738 1,671 Comparison with 4Q of FY2015 (81) 3 (67) 1,000 '15/3 '15/12 '16/3 '16/12 Total Debt 2,543 2,510 2,326 2,181 Short-term loans payable 1,399 1,452 1,375 1, Long-term loans payable 1,143 1, (347) Average interest of short-term loans payable 0.6% 0.6% 0.6% 0.5% (0.1)% Averate interset of long-term loans payable 1.3% 1.3% 1.3% 1.3% (0.1)% Net Interest Ratio of Net Interest Cost on Operating Income Interest Expenses Interest Income Divident Income Exchange rate (=US$1.00) % 7% 7% 5% of of of of Sep.) (144) Impact of exchange conversion Comparison with 4Q of FY2015 : -5,100 million yen Comparison with 3Q of FY2015 : -5,500 million yen 11
 92.7 18 138.1 Rev ised plan f or FY2016 as of Nov.")
 <Domestic Market Condition of marine products (salmon/trout) (Unit : yen/kg) Net Sales Operating Income")
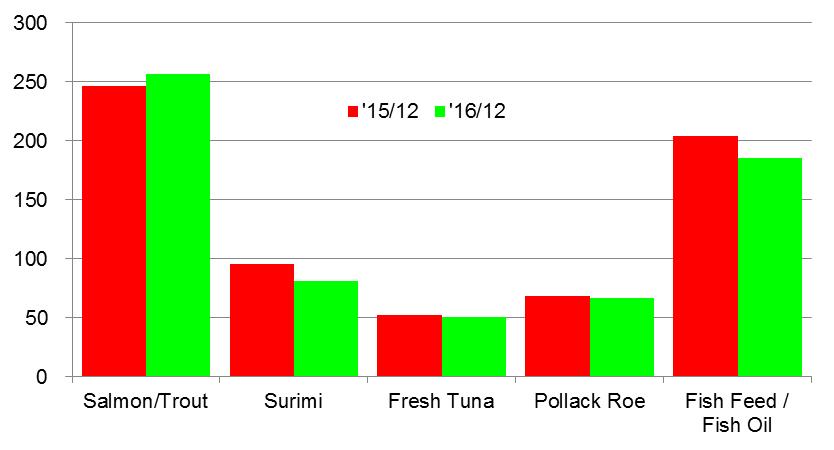
12 Marine Products Business Substantial increase in profit due to the significant recovery of sales price in Salmon/Trout farming business in South America. Net Sales Operating Income Result of 3Q of FY2016 1, Result of 3Q of FY2015 2, Increase/Decrease Amount % (153) Rev ised plan f or FY2016 as of Nov.4 2,447 Progress rate From this fiscal year, fish roe business was shifted from Food Products Business to Marine Products Business. (Net Sales : 2,373 million yen and Operating Income 355 million yen in FY2015) <Domestic Market Condition of marine products (salmon/trout) (Unit : yen/kg) Net Sales Operating Income <Price trends for Pollack fillet (Calculated from data by NMFS) (Unit : USD/kg) 12
 1,031 1,010 Consolidated Adjustment 1 (6) 25 27 29 <Salmon/Trout '15/12 '16/12 '15/12 '16/12 '15/12 '16/12 '15/12")
13 Marine Products Business Net Sales & Operating Income (Y-on-Y) Net Sales (Line Chart) 1,500 1,250 1, (250) (500) (750) Fishery Aquaculture Processing /Trading 1,263 1,065 Total Operating Income Non- Consolidated Operating Income (Bar Chart) 1,031 1,010 Consolidated Adjustment 1 (6) <Salmon/Trout '15/12 '16/12 '15/12 '16/12 '15/12 '16/12 '15/12 '16/12 '15/12 '16/12 The Italic figures in the lower part of this chart shows the accumulation of the bar (operating income) Consolidated Adjustment of net sales and operating income includes the amortization of goodwill and unrealized income in inventory. Valuation of fish in the ponds is calculated every quarter based on IFRS, included in Marine Products Business operating income (10) (20) (30) Major Causes of Fluctuation <Fisheries> (Both revenue and income increased) Japan Good catch in bonito and yellow tail as well as decrease in repair cost and fuel cost due to low cost of crude oil <Aquaculture>(Revenue decreased but income increased) Salmon/Trout business in Chile While sales volume decreased due to toxic tide, sales price improve dramatically and the valuation of fish in the aquaculture pond improved. Domestic aquaculture Tuna : Sales price turned down Yellow tail : Decrease in sales volume Salmon/Trout : Farming cost increased <Processing/Trading>(Both revenue and income decreased) Alaskan Pollock Operation Decrease in roe ration and continuing stagnant fillet market. Sales price of surimi went down. aquaculture business in Chile> Profit or loss on business Valuation of fish in the ponds (Valuation by IFRS) (17) 15/ /12 13


14 Marine Products Business Non-Consolidated (Y-on-Y) Secured income increase as the gross margin ratio improved while sales volume stay the same level. <Net Sales (Monthly)> <Sales by Main Species (Y-on-Y)> <Operating Income (Quarterly)> 14


 From this fiscal year, fish roe business was")

 Domestic : Oct.-Dec., Overseas : Jul.-Sep.")
15 Food Products Business Despite sluggish business in North America, non-consolidated Food Business went strong including chilled business. Net Sales Operating Income Result of 3Q of FY2016 Result of 3Q of FY2015 Increase/Decrease Amount % Rev ised plan f or FY2016 as of Nov.4 2,257 2,305 (47) ,945 Progress rate (Unit :100 million yen) From this fiscal year, fish roe business was shifted from Food Products Business to Marine Products Business. (Net Sales : 2,373 million yen and Operating Income 355 million yen in FY2015) Net Sales Operating Income 0 <Increase/Decrease of Operating Income in 3Q(Y-on-Y) Domestic : Oct.-Dec., Overseas : Jul.-Sep. (Unit :100 million yen) (Unit : %) 15
16 Food Products Business Sales & Operating Income (Y-on-Y) Net Sales (Line Chart) 2,500 Processing 2,000 1, , Chilled Processing Non Consolidated 1,639 1,673 Operating Income (Bar Chart) Consolidated Adjustment Main Causes of Fluctuations <Processing>(Revenue decreased but income increased) North America Retail ; Not able to cover significant decrease in sales and profit in the 1 st quarter due to slow sales of key products Food Service : Income increased as price of shrimp (raw material) is keeping low price. Europe Income decreased due to weak Euro while sales volume increased Japan Sales of frozen foods for retail and frozen food for food services were strong, in addition to cost reduction such as decrease in import cost because of strong yen which resulted in keeping revenue and income increased. (500) Total Operating Income (10) <Chilled Business>(Both revenue and income increased) Increase both in sales and profit thanks to strong sales of salads and deli foods to convenience store. (1,000) (20) (1,500) '15/12 '16/12 '15/12 '16/12 '15/12 '16/12 '15/12 '16/12 Each graph (excluding Non-consolidated and Consolidated adjustment) shows the total of consolidated subsidiaries. The Italic figures in the lower part of this chart shows the accumulation of the bar (operating income). Consolidated Adjustment of operating income includes the amortization of goodwill and unrealized income in inventory. (30) 16
 Revenue increased with frozen")

> <Net")
> <Frozen Surimi Importing")
17 Food Products Business Non-consolidated (Y-on-Y) Revenue increased with frozen prepared foods, fish paste products including fish sausage and other processed foods while income increased due to the effort to cut down cost and strong yen <Net Sales (Monthly)> <Net Sales by Categories (Y-on-Y)> <Operating Income (Quarterly)> <Frozen Surimi Importing Price> (Unit : yen/kg) 17


18 Fine Chemicals Business Sales slightly decreased due to the remaining generic drug promotion effect Net Sales Operating Income Net Sales Result of 3Q of FY2016 Result of 3Q of FY2015 Increase/Decrease Amount % Rev ised plan f or FY2016 as of Nov.4 Progress rate (1) <Non-Consolidated> (6) Major Causes of Fluctuation Sales volume decreased due to measures to promote the use of generic drugs Functional material : Decrease in sales volume of IMARK S on mail order system. <Group Companies> While sale of clinical diagnostic medicine and industrial test reagent went well, production cost increased. 0 Operating Income 1Q 2Q 3Q 4Q Clinical Diagnostic Medicine : Bacteria test reagent 18


 Major Causes of Increase/Decrease Increase in sales due to the")
19 Logistics Secured the same level of income as previous year, while the initial cost of the opening of Oosaka- Maishima Logistics center occurred. Net Sales Operating Income Result of 3Q of FY2016 Result of 3Q of FY2015 Increase/Decrease Amount % Rev ised plan f or FY2016 as of Nov.4 Progress rate (0) (Unit :100 million yen) Major Causes of Increase/Decrease Increase in sales due to the opening of Oosaka-Maishima Logistics center. Net Sales Operating Income 0 (Unit :100 million yen) Depreciation and initial cost occurred. 19
20 FY2016 Revised Plan by Business Segment (Compared with the revised plan as of Nov. 4) Estimate revenue and income increased in both Marine Products and Food Products Business. Revised plan for FY2016 as of Feb. 3 Revised Plan for FY2016 as of Nov. 4 Increase/Decrease (Compared with revised plan as of Nov. 4) (Amount) (%) Result of FY2015 Net Sales 6,280 6, ,371 Marine Products 2,607 2, ,727 Food Products 3,022 2, ,023 Fine Chemicals (8) Logistics Others Operating Income Marine Products Food Products Fine Chemicals (1) Logistics Others Common Cost (30) (30) (23) Ordinary Income Revised Point Marine Products Maintain healthy business in Salmon/Trout aquaculture business in South America Food Products Non-consolidated Revenue increase as frozen foods for retail and frozen foods for food service are strong and thorough control on selling cost while foreign exchange risk Chilled Business Salads and deli foods results in income increase Profit attributable to owners of parent EPS (Net Profit per share) (Unit : yen) yen yen yen 20
 Sausages, canned foods and soups, as well")


 products")
 summer. 3.")

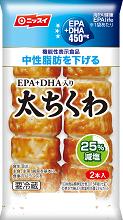
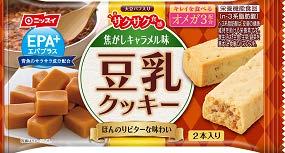
21 Merge Food Products Business and Fine Chemicals Business (Foods with function claims) Sausages, canned foods and soups, as well as frozen foods, were accepted as foods with function claims. Appealing an effort of decreasing serum triglyceride levels, as the system of food with function claim. Acceptance status of foods with function claims : 30 products have been accepted (as of January 16) 1. Processed foods: (9 products : 6 fish paste (surimi) products and 3 soups) 22 products will be on the market by 2. Frozen Prepared Foods (6 products) summer. 3. Shelf-stable and others (7 products) Nissui s efforts toward the future: Enhance customer appeal for products not only limited to neutral lipids by using the versatility of EPA (eicosapentaenoic acid) 21


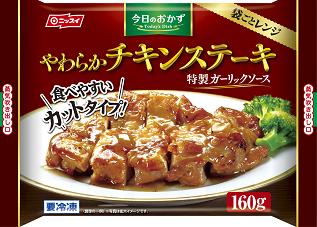
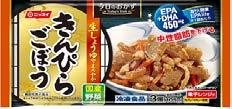

22 (Ref.) New and renewal items Line-up A help with Family Meal Time High Quality Domestically-Produced Ingredients A Feast at Home with Ready-made Everyday Dishes Healthy Living with a Healthy Diet 22

23 Disclaimer regarding forward-looking statements This presentation contains forward-looking statements regarding Nissui s business projections for the current term and future terms. All forward-looking statements are based on rational judgment of management derived from the information currently available to it, and the Company provides no assurances that these projections will be achieved. Please be advised that the actual business performance may differ from these business projections due to changes of various factors. Significant factors which may affect the actual business performance includes but are not limited to the changes in the market economy and product demand, foreign exchange rate fluctuations, and amendments to various international and Japanese systems and laws. Accordingly, please use the information contained in this presentation at your own discretion. The Company assumes no liability for any losses that may arise as a result through use of this presentation. Nippon Suisan Kaisha., Ltd. February 3, 2017 Code: 1332 Contact: Corporate Strategic Planning & IR Office Public & Investor Relations Section
Supplemental Document for 2 nd Quarter of Fiscal Year November 4, 2016 Nippon Suisan Kaisha, Ltd.
 Supplemental Document for 2 nd Quarter of Fiscal Year 2016 November 4, 2016 Nippon Suisan Kaisha, Ltd. Overview of the 2 nd Quarter of FY2016 Despite the grim profit forecast in 1 st half, operating income
Supplemental Documents for 1 st Quarter of FY2017. August 4, 2017 Nippon Suisan Kaisha, Ltd.
 Supplemental Documents for 1 st Quarter of FY2017 August 4, 2017 Nippon Suisan Kaisha, Ltd. Overview of the 1 st Quarter of FY2017 Increase both in revenue and income thanks to significant recovery of
Financial Result for 2 nd Quarter of Fiscal Year 2016
 Financial Result for 2 nd Quarter of Fiscal Year 2016 Nippon Suisan Kaisha,Ltd. November 11, 2016 TSE Cord: 1332 Contact: Corporate Strategic Planning & IR Office Public & Investor Relations Section +81-3-6206-7044
Supplemental Documents for Fiscal Year May 15, 2015 Nippon Suisan Kaisha, Ltd.
 Supplemental Documents for Fiscal Year 214 May 15, 215 Nippon Suisan Kaisha, Ltd. Overview of FY214 Both revenue and income increased in Marine Products and Food Products. Revenue and income decreased
Supplemental Documents for 1 st Quarter of FY2018. August 3, 2018 Nippon Suisan Kaisha
 Supplemental Documents for 1 st Quarter of August 3, 2018 Nippon Suisan Kaisha Overview of the 1 st Quarter of Both revenue and income increased year-on-year. Off to a good start as the first year of mid-term
Financial Result for the year Ended March 31, 2017
 Financial Result for the year Ended March 31, 2017 Nippon Suisan Kaisha, Ltd. May 22, 2017 TSE Cord: 1332 Contact: Corporate Strategic Planning & IR Dept. Corporate Strategic Planning Section +81-3-6206-7044
Summary of 1st Quarter Report for Fiscal Year 2017 (April 1, 2017 through June 30, 2017)
") Summary of 1st Quarter Report for Fiscal Year 2017 (April 1, 2017 through June 30, 2017) Qualification: This is directly translated into English for the convenience of readers, and all financial results
Summary of 1st Quarter Report for Fiscal Year 2017 (April 1, 2017 through June 30, 2017) Qualification: This is directly translated into English for the convenience of readers, and all financial results
516, , , , ,821 (3.7) 18, , , Diluted income per share.
 18, , , Diluted income per share.") Summary of 3rd Quarter Report for Fiscal Year 2017 (April 1, 2017 through December 31, 2017) Qualification: This is directly translated into English for the convenience of readers, and all financial results
Summary of 3rd Quarter Report for Fiscal Year 2017 (April 1, 2017 through December 31, 2017) Qualification: This is directly translated into English for the convenience of readers, and all financial results
Financial Result for the year Ended March 31, 2016
 Financial for the year Ended March 31, 216 Nippon Suisan Kaisha,Ltd. May 2, 216 TSE Cord: 1332 Contact: Corporate Strategic Planning & IR Office Public & Investor Relations Section +81-3-626-744 http://www.nissui.co.jp/english/index.html
Summary of 2nd Quarter Report for Fiscal Year 2017 (April 1, 2017 through September 30, 2017)
") Summary of 2nd Quarter Report for Fiscal Year 2017 (April 1, 2017 through September 30, 2017) Qualification: This is directly translated into English for the convenience of readers, and all financial results
Summary of 2nd Quarter Report for Fiscal Year 2017 (April 1, 2017 through September 30, 2017) Qualification: This is directly translated into English for the convenience of readers, and all financial results
Summary of 1st Quarter Report for Fiscal Year 2018 (April 1, 2018 through June 30, 2018)
") Summary of 1st Quarter Report for Fiscal Year 2018 (April 1, 2018 through June 30, 2018) Qualification: This is directly translated into English for the convenience of readers, and all financial results
Summary of 1st Quarter Report for Fiscal Year 2018 (April 1, 2018 through June 30, 2018) Qualification: This is directly translated into English for the convenience of readers, and all financial results
Summary of Financial Statements for the Year ended March 31, 2018 (April 1, 2017 through March 31, 2018)
") Summary of Financial Statements for the Year ended March 31, 2018 (April 1, 2017 through March 31, 2018) Qualification: This is directly translated into English for the convenience of readers, and all
Summary of Financial Statements for the Year ended March 31, 2018 (April 1, 2017 through March 31, 2018) Qualification: This is directly translated into English for the convenience of readers, and all
Million yen. % Million yen % 271, , , , ,228 (1.7) 3,314 (12.9) 684 (77.5) (1,321) - Equity ratio 5.
 3,314 (12.9) 684 (77.5) (1,321) - Equity ratio 5.") Summary of 2nd Quarter Report for Fiscal Year 2011 (April 1, 2011 through September 30, 2011) Qualification: This is directly translated into English for the convenience of readers, and all financial results
Summary of 2nd Quarter Report for Fiscal Year 2011 (April 1, 2011 through September 30, 2011) Qualification: This is directly translated into English for the convenience of readers, and all financial results
Summary of Financial Statements for the Year ended March 31, 2017 (April 1, 2016 through March 31, 2017)
") Summary of Financial Statements for the Year ended March 31, 2017 (April 1, 2016 through March 31, 2017) Qualification: This is directly translated into English for the convenience of readers, and all
Summary of Financial Statements for the Year ended March 31, 2017 (April 1, 2016 through March 31, 2017) Qualification: This is directly translated into English for the convenience of readers, and all
Summary of Financial Statements for the Year ended March 31, 2016 (April 1, 2015 through March 31, 2016)
") Summary of Financial Statements for the Year ended March 31, 2016 (April 1, 2015 through March 31, 2016) Qualification: This is directly translated into English for the convenience of readers, and all
Summary of Financial Statements for the Year ended March 31, 2016 (April 1, 2015 through March 31, 2016) Qualification: This is directly translated into English for the convenience of readers, and all
% Million yen % 277, ,912 (54.2) 754 (85.7) (1,216) - 271, , , ,073 - Equity ratio %
 754 (85.7) (1,216) - 271, , , ,073 - Equity ratio %") Summary of 2nd Quarter Report for Fiscal Year 2012 (April 1, 2012 through September 30, 2012) Qualification: This is directly translated into English for the convenience of readers, and all financial results
Summary of 2nd Quarter Report for Fiscal Year 2012 (April 1, 2012 through September 30, 2012) Qualification: This is directly translated into English for the convenience of readers, and all financial results
Millions of yen Millions of yen % Millions of yen % Millions of yen % Millions of yen % Cash from 9,802 3,675 (6,663) 3,802
 3,802") Qualification: From April 1, 2006 to June 30, 2006 Company: Nippon Suisan Kaisha, Ltd. Listed on Tokyo and Osaka Stock Exchange with the register code 1332 http://www.nissui.co.jp 1. Notes for Reporting
Qualification: From April 1, 2006 to June 30, 2006 Company: Nippon Suisan Kaisha, Ltd. Listed on Tokyo and Osaka Stock Exchange with the register code 1332 http://www.nissui.co.jp 1. Notes for Reporting
Supplemental Document for 3 rd Quarter of FY2017. February 5, 2018 Nippon Suisan Kaisha, Ltd.
 Supplemental Document for 3 rd Quarter of FY2017 February 5, 2018 Nippon Suisan Kaisha, Ltd. Overview of the 3 rd Quarter of FY2017 Net Profit increased by 32% year-on-year, which resulted in record profit
1st quarter of FY , st quarter of FY , , , Million yen. Yen Yen Yen Yen Yen
 August 5, 2008 Summary of 1 st Quarter Report for Fiscal Year 2008 *Qualification: This is directly translated into English for the convenience of readers, and all financial results conform with the accounting
Consolidated Financial Results For 1Q of the Year Ending March, 2019
 Consolidated Financial Results For 1Q of the Year Ending March, 2019 August, 2018 Copyright 2018 Maruha Nichiro Corporation 1. Consolidated Statement of Income June, 2018 June, 2017 Change Mar'19 Forecast
Highlights of Consolidated Results for Fiscal Year ended March 31, 2016
 May 9, 2016 Highlights of Consolidated Results for Fiscal Year ended March 31, 2016 (except for per share amounts) Year ended Year ended March 31, March 31, 2016 2015 Change Y 745,888 Y 707,237 5.5 Operating
Highlights of Consolidated Results for the First Half and the Second Quarter of Fiscal Year ending March 31, 2016
 Highlights of Consolidated Results for the First Half and the Second Quarter of Fiscal Year ending March 31, 2016 (except for per share amounts) November 2, Six months ended Six months ended September
Net sales Operating profit Ordinary profit. Million yen Million yen Million yen Million yen Six months ended
 Consolidated Financial Statements Summary November 6, 2018 (For the six months ended ) English translation from the original Japanese-language document (All financial information has been prepared in accordance
July 29, 2016 Summary of Consolidated Earnings Report for the First Quarter of Fiscal Year Ending March 31, 2017 (Japanese GAAP)
") English Translation July 29, 2016 Summary of Consolidated Earnings Report for the First Quarter of Fiscal Year Ending March 31, 2017 (Japanese GAAP) Name of listed company: Nippon Express Co., Ltd. Listed
English Translation July 29, 2016 Summary of Consolidated Earnings Report for the First Quarter of Fiscal Year Ending March 31, 2017 (Japanese GAAP) Name of listed company: Nippon Express Co., Ltd. Listed
Million yen 14,872 13,119. Net income E.P.S. Diluted E.P.S. Million yen. Yen. Yen 10, ,
 Consolidated Financial Statements Summary February 6, 2007 (For FY 2007 3rd Quarter ended December 31, 2006) English translation from the original Japaneselanguage document (All financial information has
(Correction) Concerning the revision to the Interim Report for the Year ending March 31, 2008 resulting from the announcement of irregular tradings
 Concerning the revision to the Interim Report for the Year ending March 31, 2008 resulting from the announcement of irregular tradings") 19 th December, (Correction) Concerning the revision to the Interim Report for the Year ending March 31, 2008 resulting from the announcement of irregular tradings Revisions will be made to the Interim
19 th December, (Correction) Concerning the revision to the Interim Report for the Year ending March 31, 2008 resulting from the announcement of irregular tradings Revisions will be made to the Interim
CONSOLIDATED FINANCIAL RESULTS FOR THE THREE MONTHS ENDED JUNE 30, 2012 (J-GAAP)
") CONSOLIDATED FINANCIAL RESULTS FOR THE THREE MONTHS ENDED JUNE 30, 2012 (J-GAAP) Name of listed company: Toyo Suisan Kaisha, Ltd. Securities code: 2875 (URL: http://www.maruchan.co.jp/) Representative:
CONSOLIDATED FINANCIAL RESULTS FOR THE THREE MONTHS ENDED JUNE 30, 2012 (J-GAAP) Name of listed company: Toyo Suisan Kaisha, Ltd. Securities code: 2875 (URL: http://www.maruchan.co.jp/) Representative:
Summary of Consolidated Earnings Report for the Fiscal Year Ended March 31, 2017 (Japanese GAAP)
") English Translation Summary of Consolidated Earnings Report for the Fiscal Year Ended March 31, 2017 (Japanese GAAP) May 9, 2017 Name of listed company: Nippon Express Co., Ltd. Listed stock exchanges:
English Translation Summary of Consolidated Earnings Report for the Fiscal Year Ended March 31, 2017 (Japanese GAAP) May 9, 2017 Name of listed company: Nippon Express Co., Ltd. Listed stock exchanges:
Third Quarter Results (ended December 31, 2015) Brother Industries, Ltd.
 Brother Industries, Ltd.") Fiscal Year 2015 (ending March 31, 2016) Third Quarter Results (ended December 31, 2015) Brother Industries, Ltd. February 2, 2016 Information on this report, other than historical facts, refers to future
Fiscal Year 2015 (ending March 31, 2016) Third Quarter Results (ended December 31, 2015) Brother Industries, Ltd. February 2, 2016 Information on this report, other than historical facts, refers to future
11-Year Consolidated Financial Highlights
 11-Year Consolidated Financial Highlights As of March 31, 2017 2007.3 2008.3 2009.3 2010.3 Net Sales ( million) 1,376,958 1,487,496 1,660,162 1,415,718 Operating Profit ( million) 162,315 70,048 65,204
FINANCIAL HIGHLIGHTS. Brief report of the Three months ended June 30, Kawasaki Kisen Kaisha, Ltd. [Two Year Summary]
![FINANCIAL HIGHLIGHTS. Brief report of the Three months ended June 30, Kawasaki Kisen Kaisha, Ltd. [Two Year Summary]](/thumbs/95/124379722.jpg "FINANCIAL HIGHLIGHTS. Brief report of the Three months ended June 30, Kawasaki Kisen Kaisha, Ltd. [Two Year Summary]") FINANCIAL HIGHLIGHTS Brief report of the Three months ended June 30, 2013 [Two Year Summary] Kawasaki Kisen Kaisha, Ltd. Three months Three months Three months June 30, 2012 June 30, 2013 June 30, 2013
FINANCIAL HIGHLIGHTS Brief report of the Three months ended June 30, 2013 [Two Year Summary] Kawasaki Kisen Kaisha, Ltd. Three months Three months Three months June 30, 2012 June 30, 2013 June 30, 2013
2Q of FY ended December 31, 2015 Restated basis *1. Year-on year change (Restated basis) 2Q of FY ending December 31, 2016 Forecast
 2Q of FY ending December 31, 2016 Forecast") August 10, 2016 ISEKI & CO., LTD. Supplementary Information to Consolidated Financial Results (January 1, 2016 June 30, 2016) I. Consolidated business results for the six months ended June 30, 2016 (Billions
August 10, 2016 ISEKI & CO., LTD. Supplementary Information to Consolidated Financial Results (January 1, 2016 June 30, 2016) I. Consolidated business results for the six months ended June 30, 2016 (Billions
Summary of Consolidated Earnings Report for the Second Quarter of FY2018 (Japanese GAAP)
") English Translation Summary of Consolidated Earnings Report for the Second Quarter of FY2018 (Japanese GAAP) October 31, 2018 Name of listed company: Nippon Express Co., Ltd. Listed stock exchanges: Tokyo
English Translation Summary of Consolidated Earnings Report for the Second Quarter of FY2018 (Japanese GAAP) October 31, 2018 Name of listed company: Nippon Express Co., Ltd. Listed stock exchanges: Tokyo
Net sales Operating profit Ordinary profit
 Consolidated Financial Statements Summary May 8, 2018 (For the year ended March 31, 2018) English translation from the original Japanese-language document (All financial information has been prepared in
163, , , , , , , ,
 Summary of Consolidated Financial Results For the Second Quarter of the Fiscal Year Ending March 31, 2012 (Six Months Ended September 30, 2011) November 7, 2011 Company name: Nippon Shokubai Co., Ltd.
Millions of yen. (except for per share amounts) Change (%) Millions of yen (except for per share amounts)
 Change (%) Millions of yen (except for per share amounts)") August 3, Highlights of Consolidated Results for the 1st Quarter of Fiscal Year ending 2016 (except for per share amounts) 2014 Y 177,050 Y 160,436 10.4 Operating income 15,273 16,490-7.4 Current profits
August 3, Highlights of Consolidated Results for the 1st Quarter of Fiscal Year ending 2016 (except for per share amounts) 2014 Y 177,050 Y 160,436 10.4 Operating income 15,273 16,490-7.4 Current profits
Summary of Consolidated Financial Statements for the Third Quarter of the Fiscal Year Ending November 30, 2017 [JAPAN GAAP]
![Summary of Consolidated Financial Statements for the Third Quarter of the Fiscal Year Ending November 30, 2017 [JAPAN GAAP]](/thumbs/84/89328856.jpg "Summary of Consolidated Financial Statements for the Third Quarter of the Fiscal Year Ending November 30, 2017 [JAPAN GAAP]") Summary of Consolidated Financial Statements for the Third Quarter of the Fiscal Year Ending November 30, [JAPAN GAAP] October 2, Listed company name: Kewpie Corporation Listed exchange: Tokyo Stock Exchange
Summary of Consolidated Financial Statements for the Third Quarter of the Fiscal Year Ending November 30, [JAPAN GAAP] October 2, Listed company name: Kewpie Corporation Listed exchange: Tokyo Stock Exchange
January 31, 2017 Summary of Consolidated Earnings Report for the Third Quarter of Fiscal Year Ending March 31, 2017 (Japanese GAAP)
") English Translation January 31, 2017 Summary of Consolidated Earnings Report for the Third Quarter of Fiscal Year Ending March 31, 2017 (Japanese GAAP) Name of listed company: Nippon Express Co., Ltd.
English Translation January 31, 2017 Summary of Consolidated Earnings Report for the Third Quarter of Fiscal Year Ending March 31, 2017 (Japanese GAAP) Name of listed company: Nippon Express Co., Ltd.
Supplementary Data for FY2013 Business Results (From
 Supplementary Data for Business Results (From April 1,2012 to March 31, 2013 ) * "FY ended March 31" "JSR's accounting period (fiscal year) is defined as the period from April 1 to March 31 of the following
Maruha Nichiro Group Mid-Term Management Plan Innovation toward 2021
 Maruha Nichiro Group Mid-Term Management Plan Innovation toward 2021 March 5, 2018 Copyright 2018 Maruha Nichiro Corporation Index 1. Summary of Former Mid-Term Management Plan Challenge toward 2017 2.
Net income per Diluted net income. per share Millions of yen % Yen Yen 1Q Fiscal , Q Fiscal ,
 Disclaimer: This is a Japanese-English translation of the summary of financial statements of the company produced for your convenience. Since no auditor audited this report, officially only the Japanese
Q1 Results for FY 2017 Earnings Results July 1, September 30, 2016
 Don Quijote Holdings. Co., Ltd. Q1 Results for FY 2017 Earnings Results July 1, 2016 - September 30, 2016 November 4, 2016 0 Earnings summary 3 months to Sep. 2016 3 months to Sep. 2015 (Millions of yen)
FY2012 Financial Review
 FY2012 Financial Review May 30, 2013 Nippon Paper Industries Co., Ltd. Contents FY2012 Review (April 1, 2012 March 31, 2013) 1. Business environment 2. Financial results 3. Topics 4. Earnings forecast
FY2016 Financial Results Briefing Material February 20, 2017 The Yokohama Rubber Co., Ltd.
 FY2016 Financial Results Briefing Material February 20, 2017 The Yokohama Rubber Co., Ltd. As introduced, I am Gota Matsuo, Head of the Corporate Finance & Accounting Department. I would like to provide
Summary of Consolidated Financial Statements for the Nine Months ended September 30,2012 (Japanese GAAP)
") Summary of Consolidated Financial Statements for the Nine Months ended September 30,2012 (Japanese GAAP) November 6, 2012 Company name HORIBA, Ltd. Listed stock exchanges: Tokyo, Osaka Listing code 6856
Summary of Consolidated Financial Statements for the Nine Months ended September 30,2012 (Japanese GAAP) November 6, 2012 Company name HORIBA, Ltd. Listed stock exchanges: Tokyo, Osaka Listing code 6856
242, , , , , , , ,
 Summary of Consolidated Financial Results For the Third Quarter of the Fiscal Year Ending March 31, 2012 (Nine Months Ended December 31, 2011) February 3, 2012 Company name: Nippon Shokubai Co., Ltd. Listing:
Consolidated Financial Statements (For the Second Quarter of FY2017)
") Consolidated Financial Statements (For the Second Quarter of FY2017) Consolidated Balance Sheets FY2016 Current Second Quarter As of March 31, 2016 As of Assets Current assets: Cash and deposits 15,353
Consolidated Financial Statements (For the Second Quarter of FY2017) Consolidated Balance Sheets FY2016 Current Second Quarter As of March 31, 2016 As of Assets Current assets: Cash and deposits 15,353
Business Results for The First Quarter of FY2018 (Three-month period ended June 30, 2018) July 31, 2018
 July 31, 2018") Business Results for The First Quarter of FY218 (Three-month period ended June 3, 218) July 31, 218 Please be aware of the following: * The financial information provided on this material has been prepared
Business Results for The First Quarter of FY218 (Three-month period ended June 3, 218) July 31, 218 Please be aware of the following: * The financial information provided on this material has been prepared
Consolidated Results for the First Three Quarters of the Fiscal Year Ending March 20, 2013
 Consolidated Results for the First Three Quarters of the Fiscal Year Ending March 20, 2013 [Japan GAAP] January 23, 2013 Listed company name: YASKAWA Electric Corporation http://www.yaskawa.co.jp/en/ President:
GS Yuasa Corporation Consolidated Earnings Report for the. (Japanese GAAP)
") GS Yuasa Corporation Consolidated Earnings Report for the December 31, 2017 (Japanese GAAP) February 2, 2018 Stock listing: Tokyo Stock Exchange Securities code: 6674 URL: http://www.gs-yuasa.com/en Representative:
GS Yuasa Corporation Consolidated Earnings Report for the December 31, 2017 (Japanese GAAP) February 2, 2018 Stock listing: Tokyo Stock Exchange Securities code: 6674 URL: http://www.gs-yuasa.com/en Representative:
Highlights of Consolidated Results for the Nine Months and the Third Quarter of Fiscal Year ending March 31, 2017
 February 8, 2017 Highlights of Consolidated Results for the Nine Months and the Third Quarter of Fiscal Year ending March 31, 2017 (except for per share amounts) Nine months ended Nine months ended December
CONSOLIDATED FINANCIAL STATEMENTS FOR THE SIX MONTHS ENDED SEPTEMBER 30, 2018
 Page 1/14 November 13, 2018 CONSOLIDATED FINANCIAL STATEMENTS FOR THE SIX MONTHS ENDED SEPTEMBER 30, 2018 Financial Highlights For the six months ended September 30, 2018 (2Q FY2018) 2Q FY2018 2Q FY2017
Consolidated Financial Results for the Six Months Ended June 30, 2018 [Japanese GAAP]
![Consolidated Financial Results for the Six Months Ended June 30, 2018 [Japanese GAAP]](/thumbs/90/102822270.jpg "Consolidated Financial Results for the Six Months Ended June 30, 2018 [Japanese GAAP]") NOTICE: For the convenience of capital market participants, NIPPON PAINT HOLDINGS CO., LTD. makes efforts to provide English translations of the information disclosed in Japanese, provided that the original
NOTICE: For the convenience of capital market participants, NIPPON PAINT HOLDINGS CO., LTD. makes efforts to provide English translations of the information disclosed in Japanese, provided that the original
Consolidated Financial Statements (For the First Quarter of FY2013)
") Consolidated Financial Statements (For the First Quarter of FY2013) Consolidated Balance Sheets Assets Current assets: Cash and deposits Notes receivable, accounts receivable from completed contracts and
Consolidated Financial Statements (For the First Quarter of FY2013) Consolidated Balance Sheets Assets Current assets: Cash and deposits Notes receivable, accounts receivable from completed contracts and
Q1 Results for FY 2018 Earnings Results July 1, September 30, 2017
 Don Quijote Holdings. Co., Ltd. Q1 Results for FY 2018 Earnings Results July 1, - September 30, November 6, 0 Earnings summary 3 months to Sep. 3 months to Sep. 2016 (Millions of yen) Actual Share YoY
Summary of Consolidated Financial Results for Second Quarter of FY2017
 Summary of Consolidated Financial Results for Second Quarter of FY2017 Nov 1, 2017 Mitsui Chemicals, Inc. 1. Summary of Income Statement Net sales Operating income Ordinary income Profit attributable to
Consolidated Financial Report for the First Quarter of the FY 2016
 Consolidated Financial Report for the First Quarter of the FY 2016 July 29, 2016 Company name: Ube Industries, Ltd. Representative: Yuzuru Yamamoto, President and Representative Director Security code:
Consolidated Financial Report for FY2000 Half-Year (April 1, 2000 September 30, 2000)
") Consolidated Financial Report for FY2000 Half-Year (April 1, 2000 September 30, 2000) October 26, 2000 Fuji Electric Co., Ltd. Summary of Consolidated Financial Results 1. Summary of consolidated statements
Consolidated Financial Report for FY2000 Half-Year (April 1, 2000 September 30, 2000) October 26, 2000 Fuji Electric Co., Ltd. Summary of Consolidated Financial Results 1. Summary of consolidated statements
Quarterly consolidated financial statements
 Quarterly consolidated financial statements (First Quarter of Fiscal Year 2011) Takasago International Corporation Accounting Period Period 1. (Changes in Principle Financial Data) 85 th Year (2011) 1
Summary of Consolidated Financial Statements for the Second Quarter of the Fiscal Year Ending March 31, 2019 (Japanese Standards)
") November 5, 2018 Summary of Consolidated Financial Statements for the Second Quarter of the Fiscal Year Ending March 31, 2019 (Japanese Standards) This document is an English translation of the Japanese-language
November 5, 2018 Summary of Consolidated Financial Statements for the Second Quarter of the Fiscal Year Ending March 31, 2019 (Japanese Standards) This document is an English translation of the Japanese-language
Consolidated Financial Results For the Second Quarter of the Fiscal Year Ending March 31, 2019 (For the First Six Months Ended September 30, 2018)
") Consolidated Financial Results For the Second Quarter of the Fiscal Year Ending March 31, 2019 (For the First Six Months Ended September 30, 2018) Prepared in Conformity with Generally Accepted Accounting
Consolidated Financial Results For the Second Quarter of the Fiscal Year Ending March 31, 2019 (For the First Six Months Ended September 30, 2018) Prepared in Conformity with Generally Accepted Accounting
Operating Results. Analysis of Operating Results (Operating Results in the Consolidated Fiscal Year 2008)
") Operating Results Analysis of Operating Results (Operating Results in the Consolidated Fiscal Year 2008) As for the global economy in the consolidated 2008, the global financial crisis resulting from subprime
Operating Results Analysis of Operating Results (Operating Results in the Consolidated Fiscal Year 2008) As for the global economy in the consolidated 2008, the global financial crisis resulting from subprime
First Quarter Results (3-month results ended June 30, 2013)
") Fiscal Year 213 (ending March 31, 214) First Quarter Results (3-month results ended June 3, 213) Brother Industries, Ltd. August 6, 213 Information on this report, other than historical facts, refers to
Fiscal Year 213 (ending March 31, 214) First Quarter Results (3-month results ended June 3, 213) Brother Industries, Ltd. August 6, 213 Information on this report, other than historical facts, refers to
FY2006 Results & Actions for proper business operations May 2007 Millea Holdings, Inc.
 FY2006 Results & Actions for proper business operations May 2007 Millea Holdings, Inc. Millea Holdings Key statistics FY2002 FY2003 FY2004 FY2005 FY2006 FY2007 projections Ordinary income 2,929.0 bn yen
Financial Report for 3 rd Quarter of FY (April 2010 December 2010)
") Financial Report for 3 rd Quarter of FY2011.3 (April 2010 December 2010) January 2011 Osaka Gas Co., Ltd. 1 1 I. Business Results for 3 rd Quarter of FY2011.3 Management information is available on Osaka
Financial Report for 3 rd Quarter of FY2011.3 (April 2010 December 2010) January 2011 Osaka Gas Co., Ltd. 1 1 I. Business Results for 3 rd Quarter of FY2011.3 Management information is available on Osaka
Consolidated Financial Results for the Six Months Ended September 30, 2018 <under J-GAAP>
 Translation Consolidated Financial Results for the Six Months Ended September 30, 2018 October 31, 2018 Company name: Toyo Suisan Kaisha, Ltd. Listing: First Section of the Tokyo Stock Exchange
FY2011 Consolidated Financial Results (Japan GAAP)
") Consolidated Financial Results (Japan GAAP) (April 1, 2010 through March 31, 2011) English Translation of the Original Japanese-Language Document May 11, 2011 Company name : ISUZU MOTORS LIMITED Stock
Consolidated Financial Results (Japan GAAP) (April 1, 2010 through March 31, 2011) English Translation of the Original Japanese-Language Document May 11, 2011 Company name : ISUZU MOTORS LIMITED Stock
Fiscal year ending December 31, 2017 (Forecast) Change from the previous fiscal year. Ratio against net sales
 Change from the previous fiscal year. Ratio against net sales") September 29, 2017 To whom it may concern: Company name: Nishimoto Co., Ltd. Representative: Takayuki Kanai, President (Code No.: 9260 First Section of the Tokyo Stock Exchange) Contact: Atsuhiko Kimura,
September 29, 2017 To whom it may concern: Company name: Nishimoto Co., Ltd. Representative: Takayuki Kanai, President (Code No.: 9260 First Section of the Tokyo Stock Exchange) Contact: Atsuhiko Kimura,
SUMMARY OF CONSOLIDATED FINANCIAL STATEMENTS FOR THE SECOND QUARTER OF THE FISCAL YEAR ENDING NOVEMBER 30, 2015 [JAPAN GAAP]
![SUMMARY OF CONSOLIDATED FINANCIAL STATEMENTS FOR THE SECOND QUARTER OF THE FISCAL YEAR ENDING NOVEMBER 30, 2015 [JAPAN GAAP]](/thumbs/93/114398783.jpg "SUMMARY OF CONSOLIDATED FINANCIAL STATEMENTS FOR THE SECOND QUARTER OF THE FISCAL YEAR ENDING NOVEMBER 30, 2015 [JAPAN GAAP]") SUMMARY OF CONSOLIDATED FINANCIAL STATEMENTS FOR THE SECOND QUARTER OF THE FISCAL YEAR ENDING NOVEMBER 30, [JAPAN GAAP] July 1, Listed company name: Kewpie Corporation Listed exchange: Tokyo Stock Exchange
SUMMARY OF CONSOLIDATED FINANCIAL STATEMENTS FOR THE SECOND QUARTER OF THE FISCAL YEAR ENDING NOVEMBER 30, [JAPAN GAAP] July 1, Listed company name: Kewpie Corporation Listed exchange: Tokyo Stock Exchange
Summary of Consolidated Earnings Report for the Third Quarter of FY2017 (Japanese GAAP)
") English Translation Summary of Consolidated Earnings Report for the Third Quarter of FY2017 (Japanese GAAP) January 31, 2018 Name of listed company: Nippon Express Co., Ltd. Listed stock exchanges: Tokyo
English Translation Summary of Consolidated Earnings Report for the Third Quarter of FY2017 (Japanese GAAP) January 31, 2018 Name of listed company: Nippon Express Co., Ltd. Listed stock exchanges: Tokyo
FY ending. 3Q of FY ended December 31, 2015 Restated basis *1. Year-on-year change (Restated basis) 3Q of FY ending
 3Q of FY ending") November 11, 2016 ISEKI & CO., LTD. Supplementary Information to Consolidated Financial Results (January 1, 2016 September 30, 2016) I. Consolidated business results for the nine months ended September
November 11, 2016 ISEKI & CO., LTD. Supplementary Information to Consolidated Financial Results (January 1, 2016 September 30, 2016) I. Consolidated business results for the nine months ended September
Highlights of Consolidated Results for the First Half and the Second Quarter of Fiscal Year ending March 31, 2018
 This document is a summary translation of the Japanese language original version. In the event of any discrepancy, errors and/or omissions, the Japanese language version shall prevail. November 7, 2017
Q1 Results for FY 2016 Earnings Results July 1 - September 30, 2015
 Don Quijote Holdings. Co., Ltd. Q1 Results for FY 2016 Earnings Results July 1 - September 30, 2015 November 5,2015 0 Earnings summary 3 months to Sep. 2015 3 months to Sep. 2014 Actual Share YoY Actual
FY2018 Financial Result <Supplement>
 FY2018 Financial Result February 13, 2019 Round off to the first decimal place (the same shall apply hereafter) Summary Higher net sales but lower net income Net sales: Steady expansion of
Bando Chemical Industries, Ltd.
 Consolidated Business Results for the First Half of Fiscal 2011 November 4, 2011 Bando Chemical Industries, Ltd. 0 First Half Financial Summary for the Fiscal Year Ending March 31, 2012 1 (1)Settlement
FY ended December 31, 2015 Restated basis *1. Year-on-year change. FY ended December 31, 2016 Forecast *2. Difference (forecast/ actual)
") February 14, 2017 ISEKI & CO., LTD. Supplementary Information to Consolidated Financial Results (January 1, ) I. Consolidated business results for the fiscal year ended (Billions of yen, %) 2015 Restated
February 14, 2017 ISEKI & CO., LTD. Supplementary Information to Consolidated Financial Results (January 1, ) I. Consolidated business results for the fiscal year ended (Billions of yen, %) 2015 Restated
Consolidated Financial Highlights. Fiscal Year Ended Mar 31, 2006
 Consolidated Financial Highlights Fiscal Year Ended Mar 31, 2006 Table of Contents 1. Consolidated Statements of Income 2. Consolidated Balance Sheets 3. Selling, general and administrative expenses 4.
Q1/FY2017 Supplemental IR information
 Q1/FY2017 Supplemental IR information (FYE March 2018) August 7, 2017 FUJI OIL HOLDINGS INC. Table of Contents 1 Q1/FY2017 profit and loss summary 3 2 Q1/FY2017 Key points of financial accounting 3 3 Q1/FY2017
Consolidated Financial Results for the 3rd Quarter of the Fiscal Year Ending March 31, 2010
 February 5, 2010 Consolidated Financial Results for the 3rd Quarter of the Fiscal Year Ending March 31, 2010 NIHON KOHDEN CORPORATION (6849) Stock Exchange Listing: Head Office: Representative: Contact:
Company Name: Shimano Inc. Stock Exchange: Tokyo, First Section Code Number: 7309 URL:
 This document has been translated from the Japanese original for reference purposes only. In the event of any discrepancy between this translated document and the Japanese original, the original shall
Six months of FY ending December 31, (0.4) (1.9) 22.5 (0.4) (0.3) (0.4) (0.1) (0.4) (0.7) (2.0) 0.9 (1.
 (1.9) 22.5 (0.4) (0.3) (0.4) (0.1) (0.4) (0.7) (2.0) 0.9 (1.") November 11, ISEKI & CO., LTD. Supplementary Information to Consolidated Financial Results (April 1, September 30, ) I. Consolidated business results for the six months ended September 30, (Billions of
November 11, ISEKI & CO., LTD. Supplementary Information to Consolidated Financial Results (April 1, September 30, ) I. Consolidated business results for the six months ended September 30, (Billions of
Q3 FY3/09 Financial Statements
 Q3 FY3/09 Financial Statements February 13, 2009 Company Name: Matsuda Sangyo Co., Ltd. Exchanges listed on: Tokyo Stock Exchange (First Section) Company code: 7456 URL: http://www.matsuda-sangyo.co.jp
Consolidated Business Results For the Fiscal Year Ending March 31, 2012 Bando Chemical Industries, Ltd.
 Consolidated Business Results For the Fiscal Year Ending March 31, 2012 Bando Chemical Industries, Ltd. Financial Summary Fiscal Year Ending March 31, 2012 (1)Settlement of Accounts The production rates
Highlights of Consolidated Results for the Nine Months and the Third Quarter of Fiscal Year ending March 31, 2018
 This document is a summary translation of the Japanese language original version. In the event of any discrepancy, errors and/or omissions, the Japanese language version shall prevail. February 7, 2018
Financial Results for the Second Quarter Fiscal Year Ending March 2015 Investor Relations Presentation Materials ISEKI & CO., LTD.
 Financial Results for the Second Quarter Fiscal Year Ending March 2015 Investor Relations Presentation Materials ISEKI & CO., LTD. Noriyuki Kimura, President November 14, 2014 Index 1. Outline of Financial
Financial Summary. Mitsui Chemicals, Inc. February 5, Results for 3 rd Quarter of FY2018 & Outlook for FY2018
 Financial Summary Results for 3 rd Quarter of FY2018 & Outlook for FY2018 Mitsui Chemicals, Inc. February 5, 2019 FY2018 indicates the period from April 1, 2018 to March 31, 2019. Contents 1.
Company Name: Shimano Inc. Stock Exchange: Tokyo, First Section Code Number: 7309 URL: Diluted earnings per share
 This document has been translated from the Japanese original for reference purposes only. In the event of any discrepancy between this translated document and the Japanese original, the original shall
GS Yuasa Corporation Consolidated Earnings Report for the. (Japanese GAAP)
") GS Yuasa Corporation Consolidated Earnings Report for the (Japanese GAAP) August 9, 2018 Stock listing: Tokyo Stock Exchange Securities code: 6674 URL: http://www.gs-yuasa.com/en/ Representative: Osamu
GS Yuasa Corporation Consolidated Earnings Report for the (Japanese GAAP) August 9, 2018 Stock listing: Tokyo Stock Exchange Securities code: 6674 URL: http://www.gs-yuasa.com/en/ Representative: Osamu
Earnings Presentation for 3Q FY2012
 Earnings Presentation for 3Q FY2012 Feb 13, 2013 The estimates and projection in this presentation are forward-looking statements based on the information available at the time of the announcement. Actual
FY 2017 First-Half Financial Results Briefing Material August 10, 2017 The Yokohama Rubber Co., Ltd.
 FY 2017 First-Half Financial Results Briefing Material August 10, 2017 The Yokohama Rubber Co., Ltd. As just introduced, I am Goto Matsuo, head of the Corporate Finance & Accounting Dept. Thank you for
Summary of Consolidated Financial Results for the First Nine Months of FY2009 (Unaudited) (January 1, September 30, 2009)
 (January 1, September 30, 2009)") This document has been translated from the Japanese original for reference purposes only. In the event of any discrepancy between this translated document and the Japanese original, the original shall
This document has been translated from the Japanese original for reference purposes only. In the event of any discrepancy between this translated document and the Japanese original, the original shall
3. Forecast for the Fiscal Year Ending March 31, 2019 Revenues Operating profit Ordinary profit Profit attributable to owners of parent Net income per
 Financial Highlights: The Second Quarter Ended September 30, 2018 1. Consolidated Financial Highlights ( from April 1, 2018 to September 30, 2018 ) (All financial information has been prepared in accordance
Summary of Consolidated Financial Statements for the Six Months ended June 30, 2012 (Japanese GAAP)
") Summary of Consolidated Financial Statements for the Six Months ended June 30, 2012 (Japanese GAAP) August 6, 2012 Company name HORIBA, Ltd. Listed stock exchanges: Tokyo, Osaka Listing code 6856 URL:
Summary of Consolidated Financial Statements for the Six Months ended June 30, 2012 (Japanese GAAP) August 6, 2012 Company name HORIBA, Ltd. Listed stock exchanges: Tokyo, Osaka Listing code 6856 URL:
Consolidated Summary Report <under Japanese GAAP>
 Consolidated Summary Report for the nine months ended December 31, 2013 January 27, 2014 Company name : KAGOME CO., LTD Stock exchange listings: Tokyo and Nagoya Code number : 2811
Summary of First Quarter Business Results and Financial Report / FY2019
 Summary of First Quarter Business Results and Financial Report / Balance Sheets Page 1 Balance Sheets (Quarterly Trend) Page 2 Statements of Income Page 3 Statements of Income (Quarterly Trend) Page 4
Q3 Results for FY 2016 Earnings Results July 1, March 31, 2016
 Don Quijote Holdings. Co., Ltd. Q3 Results for FY 2016 Earnings Results July 1, 2015 - March 31, 2016 May 9,2016 0 Earnings summary 9 months to Mar. 2016 9 months to Mar. 2015 (Millions of yen) Actual
Consolidated Results for the First Three Quarters of the Fiscal Year Ending March 20, 2014
 Consolidated Results for the First Three Quarters of the Fiscal Year Ending March 20, 2014 [Japan GAAP] January 23, 2014 Listed company name: YASKAWA Electric Corporation http://www.yaskawa.co.jp/en/ Representative
Briefing Material for 1Q Results of the Fiscal Year Ending March 2014
 Briefing Material for 1Q Results of the Fiscal Year Ending March 2014 NIPPON EXPRESS CO., LTD. IR Group, Corporate Planning Division July 31, 2013 A. of 1Q C. Ratio of sales from International operation
Brief report of the six months ended September 30, 2014 Kawasaki Kisen Kaisha, Ltd. [Two Year Summary] Six months
![Brief report of the six months ended September 30, 2014 Kawasaki Kisen Kaisha, Ltd. [Two Year Summary] Six months](/thumbs/96/127740495.jpg "Brief report of the six months ended September 30, 2014 Kawasaki Kisen Kaisha, Ltd. [Two Year Summary] Six months") FINANCIAL HIGHLIGHTS Brief report of the six months September 30, 2014 Kawasaki Kisen Kaisha, Ltd. [Two Year Summary] September 30, 2013 September 30, 2014 September 30, 2014 Consolidated Operating revenues
FINANCIAL HIGHLIGHTS Brief report of the six months September 30, 2014 Kawasaki Kisen Kaisha, Ltd. [Two Year Summary] September 30, 2013 September 30, 2014 September 30, 2014 Consolidated Operating revenues
Consolidated Financial Statements (For the Third Quarter of FY2017)
") Consolidated Financial Statements (For the Third Quarter of FY2017) Consolidated Balance Sheets FY2016 Current Third Quarter As of March 31, 2016 As of December 31, 2016 Assets Current assets: Cash and
Consolidated Financial Statements (For the Third Quarter of FY2017) Consolidated Balance Sheets FY2016 Current Third Quarter As of March 31, 2016 As of December 31, 2016 Assets Current assets: Cash and