Business Performance in FY2015 and Outlook for FY2016. April 28, 2016
|
|
|
- Noreen Dalton
- 5 years ago
- Views:
Transcription

1 Business Performance in FY2015 and Outlook for FY2016 April 28, 2016 HP
2 Contents FY2015 Full-year Results [Consolidated] 2 Outline of FY2015 Full-year Results [Consolidated] 4 FY2016 Full-year Forecast [Consolidated] 6 Key Points of FY2016 Full-year Forecast [Consolidated] 8 Outline of Business Structural Reforms 10 FY2016 Business Performance: Variable Factors from the Previous Year 12 FY 2016 Single-year Management Plan 14 [Supplement #1-8] 18 Note1: Fiscal Year = from April 1 to March 31 Q1 = April to June Q2 = July to September Q3 = October to December Q4 = January to March Note2: Figures less than JPY 0.1 billion are rounded down. Note3: Net income/loss = Profit/loss attributable to owners of parent
3 FY2015 Full-year Results [Consolidated] *as of January 29, 2016 FY2015 Result FY2014 FY2015 Result Previous forecast* (billion yen) Q1 Q2 Q3 Q4 Full-year Full-year YoY Full-year Variance Revenue , , % +1, Operating income/loss % Ordinary income/loss % Net income/loss Average exchange rate /$ /$ /$ /$ /$ /$ /$ /$ /$ Average bunker price $369/MT $286/MT $235/MT $173/MT $265/MT $503/M T -$238/MT $264/M T +$1/MT Ordinary income/loss YoY Comparison (Major factors) ( billion) Fluctuation of Foreign Exchange YoY 12.28/$ \ Weaker Fluctuation of Bunker Price YoY $238/MT Lower Fluctuation of Cargo Volume/Freight Rates, Others (Total)
4 [By segment] Upper Lower Ordinary income/loss *as of January 29, 2016 FY2014 FY2015 Result Previous forecast* (billion yen) Q1 Q2 Q3 Q4 Full-year Full-year YoY Full-year Variance Bulkships Containerships Ferry& Domestic transport Associated businesses Others Adjustment Consolidated Revenue FY2015 Result % % % % % % % % % , , % 1, % Note 1: Revenues from customers, unconsolidated subsidiaries and affiliated companies. Note 2:Bulkships =Dry bulkers, T ankers, LNG carriers/offshore businesses, Car carriers Note 3:Associated Businesses =Real estate, Cruise ships, T ug boats, T rading, T emporary staffing, etc. 3
5 Outline of FY2015 Full-year Results (I) [Consolidated] [Overall] Ordinary income decreased by 29% from the previous year. Q4 (three months) showed deficits despite securing higher profits for the first nine months (Q1-3) in a year-on-year comparison, resulting in decrease for the full year. Deterioration in the containership and dry bulker markets outstripped any gains from low bunker prices, the weaker yen, and the rising tanker market. Downturn in foreign exchange gain on a non-consolidated basis generated in the previous year. Ordinary income ended slightly above the previous outlook (January 29) due to a difference in the number of voyages completed and other factors. Recorded billion in net loss due to recording of extraordinary loss ( billion) related to business structural reforms in the dry bulker and containership businesses in Q4. [By segment] [Ordinary income/loss for FY2015 (year-on-year comparison)] Bulkships [ 54.8 billion (+ 0.7 billion)] Dry bulkers: Vessels on spot contracts: The Capesize market remained lackluster as it was unable to recover even in the peak season as originally expected. Bearish market momentum contributed to the deepening slump, with increasing anxieties over the slowdown of China s economy. Markets for all ships types deteriorated, and the Baltic Dry Index continuously marked new lows since fall. Vessels on mid- and long-term transport contracts: Continued to secure stable profits through long-term transport contracts (iron ore, steaming coal, woodchips, etc.) Substantially deteriorated compared to the previous year. Recorded a slight deficit for the full year as a result of negative margins on spot operations, which offset stable profits from mid- and long-term cargo contracts. Tankers: Crude oil tankers: The market was vigorous due to the increase in actual demand resulting from low crude oil prices and increases in strategic reserves. The market remained firm throughout the year. A large increase in profits compared to the previous year. Product tankers remained generally firm due to new operations at Middle East refineries, etc. Profits improved significantly from deficits recorded in the previous year. Both the LPG carrier and chemical tanker markets remained firm. Ordinary income increased significantly. 4
6 Outline of FY2015 Full-year Results (II) [Consolidated] LNG carriers/offshore businesses: Steadily posted profits within the scope of the initial outlook. New projects, which started in FY2015, contributed to profits. Significant increase in ordinary income compared to the previous year, when drydocking, etc., generated one-time expenditures. Car carriers: While trade from Japan mainly to North America was firm, cargo volume to resource-producing countries declined. Ordinary income decreased compared to the previous year. Containerships [ billion (- 5.6 billion)] Asia-North America route: Demand/supply environment deteriorated due to increase in fleet supply although cargo traffic remained generally firm, and freight rates have fallen to historically low levels since the winter season. Asia-Europe route, Asia-South America route: Cargo traffic decreased, and freight rates were at historically low levels. Despite an aggressive reduction in sailings on those routes, the lack of any increase in demand precluded a rate increase. Route rationalization: Implemented a large rationalization including suspension of services, mainly on the North-South route. Reduced capacity on the Asia-South America East Coast route by half, starting in February. Larger fall in freight rates offset the positive impacts of low bunker prices and route rationalization, resulting in increased losses compared to the previous year. Ferry & domestic transport [ 4.4 billion (±0)] Secured the same level of income as the previous year despite the impact of an accidental fire aboard a ferry that occurred in July Associated businesses [ 10.1 billion (- 0.7 billion)] Income decreased due to temporary costs related to the completion of the Shin-Daibiru Building (recorded in Q1). Others + Adjustment [- 3.4 billion (- 9.3 billion)] Foreign exchange gain on a non-consolidated basis (+ 6.1 billion) turned to a loss in this fiscal year. [Dividend] 5 per share for the full year (interim 3.5 already paid + year-end 1.5) (Same as the previous announcement) 5
7 FY2016 Full-year Forecast [Consolidated] FY2016 Forecast FY2015 Result YoY (billion ye n) H1 H2 Full-year H1 H2 Full-year (Full-year) Revenue , , % Operating income/loss % Ordinary income/loss % Net income/loss % Average exchange rate /$ /$ /$ /$ /$ /$ /$ Average bunker price $220/MT $240/MT $230/MT $328/M T $204/M T $265/M T -$35/MT Note:"Average bunker Price" Consumption price for fiscal results (FY2014), purchase price for the fiscal projection (FY2015): (cf)sensitivity against Ordinary income FY2016 FX Rate : Bunker Price : (Full-year/M ax) ± 1.0 bn/ 1/$ ± 0.17 bn/$1/mt 6
8 [By segment] Upper Revenue Lower Ordinary income/loss FY2016 Forecast FY2015 Result YoY (billion yen) H1 H2 Full-year H1 H2 Full-year Bulkships Containerships Ferries & Coastal RoRo Ships Associated businesses Others Adjustment Consolidated % % % % % % % % % , , % % Note 1:Revenues from customers, unconsolidated subsidiaries and affiliated companies. Note 2:Bulkships =Dry bulkers, T ankers, LNG carriers/offshore businesses, Car carriers Note 3:Associated Businesses =Real estate, Cruise ships, T ug boats, T rading, T emporary staffing, etc. (Full-year) 7
9 Key Points of FY2016 Full-year Forecast (I) [Overall] Accomplish Single-year Management Plan/Business Structural Reforms Dry bulkers: Significantly scale down market exposure. Containerships: Enhance rationalization of unprofitable services, dispose of excess tonnage Enhance the quality of businesses, accelerate business development in key strategic countries Assume ongoing severe conditions in the dry bulker and containership markets, and anticipate a certain level of softening from the booming market in the previous year even in the tanker market. Long-term stable profits: 55.0 billion [By segment] [FY2016 forecast for ordinary income/loss (year-on-year comparison)] Bulkships [ 35.0 billion ( billion)] Dry bulkers: Market: The market will not fully recover from stagnated demand due to the deceleration of China s economy, despite accelerated scrapping of vessels, mainly Capesize ships. Anticipate the market will remain at low levels throughout the year. Forge ahead to improve profitability by acquiring profitable cargoes and developing businesses in growing regions, while significantly reducing market exposure through business structural reforms. Significantly improve from deficits recorded in the previous year and secure profits, although the impact of business structural reforms have diminished to some extent. Tankers: Forecast softening from the booming market in the previous year despite firm fundamentals overall. Crude oil tankers: Supply pressure from the delivery of newbuilding vessels will increase, especially in the second half, though China s strategic reserve will continue to expand and demand in other Asian countries is expected to grow. Forecast softening in the market compared to the previous year. Increase stable profits through mid- and long-term contracts. 8
10 Key Points of FY2016 Full-year Forecast (II) Forecast that product tankers and chemical tankers will show firm cargo trade due to continued high operating rate at oil refineries due to low crude oil prices. The market level for LPG carriers will drop significantly from the previous year due to supply pressure from newbuilding vessels. Continually secure high profits despite forecast that profits will decrease from particularly high levels in the previous year. LNG carriers/offshore business: 14 new projects will start operation in this fiscal year (incl. 6 Very Large Ethane Carriers (VLEC)). Steadily record stable profits. Secure profits at the same level as the previous year despite the impact of the strong yen. Car carriers: Continued slow trade to resource-dependent countries, although trade to North America is expected to remain firm. Anticipate that ordinary income will decrease from the previous year, due to impact of the strong yen, etc. Containerships [ billion (- 2.1 billion)] Asia-North America route: Anticipate freight rates will be lower due to renewal of annual contracts in addition to deteriorating spot market, though cargo traffic is expected to be firm backed by the strong U.S. economy. Seeking higher efficiency by launching larger vessels on routes bound for the North America East Coast after expansion of the Panama Canal. Asia-Europe route: Still no sign for recovery in Asia-Europe cargo traffic, and freight rates are stagnant. Plan reduction of demand and supply imbalance by further rationalization. North-South East Coast route: Conducted rationalization in the previous year. Profits improved significantly. Increase in profits of container terminal business: Steadily increase profits by promoting automated operation of Los Angeles terminal. Impact of deteriorated market will offset the positive impact of the business structural reforms and route rationalization implemented in the previous year, resulting in a further increase in losses from the previous year. Ferries & Coastal RoRo (Roll-on/Roll-off) Ships [ 5.5 billion (+1.0 billion)] Ordinary income will increase from the previous year as the ferry business returns to normal operation. Associated businesses [ 12.0 billion (+ 1.8 billion)] Ordinary income will increase by reaction to recorded initial costs of the Shin-Daibiru Building in the previous year. [Dividend] Plan to play 4 per share for the full year (Interim 2 + year end 2) (Dividend payout ratio 24%) 9
11 Outline of Business Structural Reforms (I) Dry bulkers (Mid and small size) (1) Return vessels serving in spot cargo transport (and largely responsible for negative margins) to shipowners, and significantly scale down market exposure. (2) Reduce ship costs of the core fleet, which is engaged in cargo transport based on long-term stable relationships with customers, to market levels. Current situation <Operation> <Procurement> Spot cargoes A large deficit as a result of negative margins After business structural reforms (1) Return to Shipowners (cancellation fees incurred) COA(*) and longterm contract cargoes, etc. Core fleet (Longterm chartered-in vessels from shipowners) Accumulate COA and longterm contract cargoes, etc. Spot Procurement Core fleet (2) Reduce ship costs to market levels. (*) COA : Contract of affreightment 10
12 Outline of Business Structural Reforms (II) Dry bulkers (Large size = Capesize) Dispose of about a half of the vessels on spot contracts (currently about 20 vessels) in the Capesize fleet, in which a higher percentage operate on long-term cargo contracts (80 among about 100 vessels) (Return chartered-in vessels to shipowners + sell owned vessels) Containerships Claim relatively high-cost mid-size owned containerships as impairment loss. Dispose of vessels that became surplus after route rationalization was implemented throughout FY2015 (sale and return). As a result of these efforts: Dry bulker-related billion (including chartered-in contract cancellation fees: about 50 billion) Containership-related 61.9 billion (most are costs for impairment) Total of billion in costs for business structural reforms was recorded (FY2015 Q4) 11
13 FY2016 Business Performance: Variable Factors from the Previous Year (I) Dry bulkers Turn to profitability thanks to impact of business structural reforms. Decrease in income due to COA renewal and maturity of long-term cargo contracts under current market conditions will reduce the impact of reforms to some extent. FY2015 FY2016 [Unit:billion] Impact of business sructural reforms Impact of spot market 3.0 Impact of maturity of long-term contaracts /COA renewal FY Impact of foreign exchange, etc 4.0 Increase in ship costs (before business structural reforms) Others 2.0 FY
14 FY2016 Business Performance: Variable Factors from the Previous Year (II) Containerships Freight levels of both spot markets and annual cargo contracts declined significantly. Profits could not be improved from the previous year because the deterioration of the market will offset the positive impact of business structural reforms, route rationalization, and low bunker prices. FY2015 FY2016 [Unit:billion] FY2015 Impact of route/ fleet rationalization Impact of business sructural reforms Impact of market, etc FY Impact of bunker prices
15 FY2016 Single-year Management Plan Progress of Midterm Management Plan (FY2014~2016) Steady progress on Innovation of Business Portfolio in addition to: Significant progress on Innovation of Business Model through business structural reforms Accelerate Innovation of Business Domain in the future 3 Innovations Business Portfolio Allocate management resources to businesses where we anticipate high growth and stable long-term profits Business Model Transform fleet for higher market tolerability and greater competitiveness Focus onbusinessed that offer added values and meet customer needs Business Domain Create value chains by expanding business domain both upstream and downstream of ocean shipping transport Focus investment on LNG carrier and offshore businesses, and steadily accumulate stable profits By implementing business structural reforms: (1) Reduce market exposure (2) Enhance fleet competitiveness (3) Enhance quality of business to meet customers' transport needs Further accelerate in the future Domestic logistics business including ferries Logistics and terminal business Real estate business Need a large modification in profit and financial plans Highest priority in FY2016 is accomplishment of Business Structural Reforms Establish and execute the single-year management plan 14
16 FY2016 Single-year Management Plan Goal: Accomplish Business Structural Reforms toward Recovery of Profits Profit Recovery Plan Dry bulker business 1. Mid- and small-size bulkers Withdraw excess tonnage from the free-vessel market, which is not backed by cargo demand, focus on cargo transport based on stable, long-term relationships with customers. Complete early return of surplus charter-in vessels other than the necessary core fleet. 2. Capesize bulkers Complete early return and sale of surplus fleet, while reducing free vessels and meeting customers needs. Containerships 1. Complete early return of surplus fleet as a result of route rationalization 2. Further enhance rationalization of unprofitable routes 3. Conduct a drastic review of yield management and enhance quality of businesses Review ownership of non-core assets Promote recovery of equity ratio by sale of non-core assets (extraordinary gain) 15
17 FY2016 Single-year Management Plan Build foundation toward future growth (with core competency in shipping) Enhance quality of businesses (1) Restructured organization by business unit <Dry Bulk Business Unit> Optimize portfolio of the dry bulker fleet and more efficiently allocate management resources. <Energy Transport Business Unit> Integrate business policies for energy-related customers, and appropriately meet diversified customer needs. (2) Enhance cross-divisional and global cooperation as One MOL. Effective utilization of Chief Executive Representatives and Chief Country Representatives. Create business models to meet a changing business climate (1) Speed up Innovation of Business Domain Integrate allocation of management resources for domestic logistics including ferries, in addition to logistics, terminal and real estate businesses in key strategic areas. (2) Meet customer needs through IT and the environmental technologies 16

18 Management Plan for 2016 Fleet scale 17
![Cash Flows [Supplement #1] ( billion) -250 FY2015-2016 Total 212.0 ( billion) 250 CFs from Investing Activities (left axis) CFs from Operating Activities (right axis) -200-150 -100-119.8-159.1 94.](/docs-images/90/103694412/images/19-0.jpg "2 92.4-113.0 200 150 100-50 -56.5 106.")
19 Cash Flows [Supplement #1] ( billion) -250 FY Total ( billion) 250 CFs from Investing Activities (left axis) CFs from Operating Activities (right axis) FY Average -0 FY2013 FY2014 FY (2 fiscal years) Result Result Forecast 0 Ordinary Income/Loss( bn) Profit/Loss Attributable to Owners of Parent( bn) Ave. Exchange Rate /$ /$ - Forecast is shown for two years total/average based on cash-in/out for business structural reforms to be generated over FY Note1:Free Cash Flows (FCFs) = CFs from Operating Activities CFs from Investing Activities Note2:CFs from Investing Activities are net figures. (Gross Investments Sales of Assets, etc) 18
20 Financial Plan [Supplement #2] Shareholders' equity Interest-bearing debt Net Interest-bearing debt(*1) 1,400 1,200 1, ( billion) 1, , , , Gearing ratio(*2) Net Gearing ratio(*3) Equity ratio(*4) (*1) Interest-bearing debt Cash & cash equivalents (*2) Interest-bearing debt / Shareholders s equity (*3) Net interest-bearing debt / Shareholders s equity (*4) Shareholders s equity / Total assets (Term-end Exchange Rate) [(Net)Gearing ratio] 250% 200% 150% 100% 30% 151% 135% FY2014 Result 193% 164% 24% FY2015 Result MOL /$ /$ Overseas Subsidiaries /$ /$ [Equity ratio] 40% 202% 173% 25% FY2016 Year-end Forecast /$ /$ 30% 20% 19
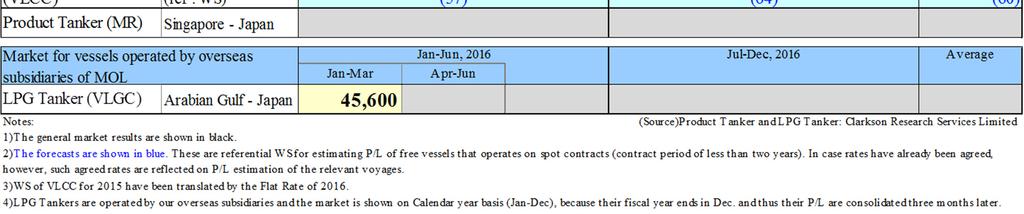
21 Dry Bulker Market (Spot Charter Rate) [Supplement #3] 1. FY2015 (Result) Size Market for vessels operated by MOL Apr-Sep, 2015 Oct, Mar, 2016 Apr-Jun Jul-Sep Oct-Dec Jan-Mar (US$/day) Full-year Average Capesize 5,800 12,600 9,200 8,200 2,700 5,500 7,300 Market for vessels operated by overseas subsidiaries of MOL 1st Half FY2015 2nd Half Jan-Jun, 2015 Jul-Dec, 2015 Jan-Mar Apr-Jun Jul-Sep Oct-Dec Average Capesize 5,700 5,800 5,800 12,600 8,200 10,400 8,100 Panamax 4,800 5,200 5,000 7,600 4,500 6,100 5,500 Handymax 6,400 6,800 6,600 8,800 5,800 7,300 6,900 Small handy 5,300 5,100 5,200 6,300 4,700 5,500 5, FY2016 (Result/Forecast) Size Market for vessels operated by MOL Apr-Sep, 2016 Oct, Mar, 2017 Apr-Jun Jul-Sep Oct-Dec Jan-Mar (US$/day) Full-year Average Capesize 0 7,000 9, ,000 #DIV/0! 7,000 Panamax 0 4, , ,800 Handymax 0 4, , ,500 Small handy 0 4, , ,000 Market for vessels operated by overseas subsidiaries of MOL 1st Half FY2016 2nd Half Jan-Jun, 2016 Jul-Dec, 2016 Jan-Mar Apr-Jun Jul-Sep Oct-Dec Average Capesize 2,700 5,000 3,900 9,000 9,000 9,000 6,400 Market for vessels operated by overseas subsidiaries of MOL Jan-Jun, 2016 Jul-Dec, 2016 Jan-Mar Apr-Jun Jul-Sep Oct-Dec Average Panamax 3,100 4,400 3,700 4,800 4,100 Handymax 3,800 4,800 4,300 5,000 to be transferred to Tokyo 4,500 Small handy 3,400 4,200 3,800 4,500 4,000 Notes: 1) The general market results are shown in black. (Source )Product Tanker and LPG Tanker: Clarkson Research Services Limited Sales activities and ship operation after Oct, ) The forecasts are shown in blue. These are referential charter rates for estimating P/L of free vessels that operates on spot contracts (contract period of less than two years). In case rates have already been agreed, however, such agreed rates are reflected on P/L estimation of the relevant voyages. 3) Market for vessels operated by our overseas subsidiaries is shown on Calendar year basis (Jan-Dec), because their fiscal year ends in Dec. and thus their P/L are consolidated three months later. 4) Market for Capesize=5TC Average(changed on and after FY2014 financial announcement), Panamax= 4TC Average, Handymax= 5TC Average, Small handy= 6TC Average. 20

")
22 Tanker Market (Spot Earnings) [Supplement #4] 21
23 Car Carrier Loading Volume [Supplement #5] 1. FY2015(Result) (Completed-voyage basis / including voyage charter) 1st Half FY2015 Q1 Q2 Q3 Q4 2nd Half (1,000 units) Total Total ,908 1, ,000 3, FY2016(Forecast) (Completed-voyage basis / including voyage charter) 1st Half FY2016 2nd Half (1,000 units) Total Total 0 2, , ,047 *The forecasts are shown in blue. 22
24 Containership Major Trades Utilization/Freight Rate [Supplement #4] 1. Utilization Transpacific Outbound (E/B) Inbound (W/B) Asia-Europe Outbound (W/B) Inbound (E/B) (1,000TEU) FY2014 FY2015 Q1 Q2 Q3 Q4 Total Q1 Q2 Q3 Q4 Total Capacity Lifting Utilization 100% 96% 93% 97% 97% 92% 95% 88% 92% 92% Capacity Lifting Utilization 53% 42% 50% 56% 50% 53% 46% 50% 55% 51% FY2014 FY2015 Q1 Q2 Q3 Q4 Total Q1 Q2 Q3 Q4 Total Capacity Lifting Utilization 102% 104% 96% 93% 99% 83% 90% 93% 89% 88% Capacity Lifting Utilization 65% 61% 65% 60% 63% 67% 64% 74% 69% 68% All Trades Capacity Lifting Utilization FY2014 FY2015 Q1 Q2 Q3 Q4 Total Q1 Q2 Q3 Q4 Total 1,450 1,545 1,502 1,502 5,999 1,538 1,521 1,395 1,345 5,799 1,124 1,153 1,098 1,045 4,420 1,036 1, ,994 78% 75% 73% 70% 74% 67% 67% 70% 71% 69% 2. Average Freight Rates (Index: Q1-FY2008=100) All Trades FY2014 FY2015 Q1 Q2 Q3 Q4 Full-year Q1 Q2 Q3 Q4 Full-year Freight rate index (Ref.) Bunker price(/mt) $607 $597 $469 $335 $529 $369 $286 $235 $173 $265 23
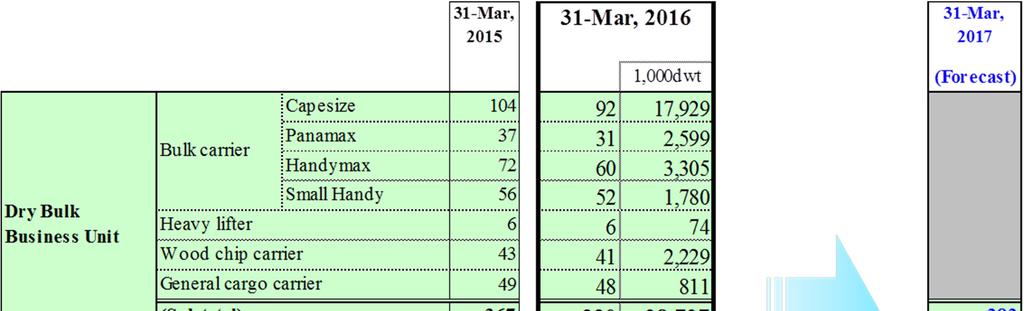
25 Fleet Composition(incl. Offshore businesses) [Supplement #7] 24


 Bold is")
26 LNG Carriers and Offshore businesses: Signed Contracts [Supplement #8] (to be started after Apr onward) Bold is under operation 25
Business Performance in
 Business Performance in 3 rd Quarter January 31, 2018 HP 0 Contents 3 rd Quarter Results [Consolidated] 2 Outline of 3 rd Quarter Results [Consolidated] 4 Full-year Forecast [Consolidated] 6 Key Points
Business Performance in FY2014 and Outlook for FY2015. April 2015
 Business Performance in and Outlook for FY2015 April 2015 HP Contents Full-year Results [Consolidated] 2 Outline of Full-year Results [Consolidated] 4 FY2015 Full-year Forecast [Consolidated] 6 Key Points
1. Supplementary Explanation of FY2015 Q1 Financial Results [Overall] [By segment] <Bulkships> Dry bulkers
![1. Supplementary Explanation of FY2015 Q1 Financial Results [Overall] [By segment] <Bulkships> Dry bulkers](/thumbs/95/122612945.jpg "1. Supplementary Explanation of FY2015 Q1 Financial Results [Overall] [By segment] <Bulkships> Dry bulkers") Aug 2015 1. Supplementary Explanation of FY2015 Q1 Financial Results [Overall] Ordinary income for the first quarter (Q1) was 10.8 billion, marking 37% progress toward the target of 29.0 billion set in
Aug 2015 1. Supplementary Explanation of FY2015 Q1 Financial Results [Overall] Ordinary income for the first quarter (Q1) was 10.8 billion, marking 37% progress toward the target of 29.0 billion set in
3. Forecast for the Fiscal Year Ending March 31, 2019 Revenues Operating profit Ordinary profit Profit attributable to owners of parent Net income per
 Financial Highlights: The Second Quarter Ended September 30, 2018 1. Consolidated Financial Highlights ( from April 1, 2018 to September 30, 2018 ) (All financial information has been prepared in accordance
(Unaudited translation of Kessan Tanshin, provided for reference only) January 31, 2019 Financial Highlights: The Third Quarter Ended December 31, 201
 January 31, 2019 Financial Highlights: The Third Quarter Ended December 31, 201") Financial Highlights: The Third Quarter Ended December 31, 2018 1. Consolidated Financial Highlights ( from April 1, 2018 to December 31, 2018 ) (All financial information has been prepared in accordance
Financial Highlights: The Third Quarter Ended December 31, 2018 1. Consolidated Financial Highlights ( from April 1, 2018 to December 31, 2018 ) (All financial information has been prepared in accordance
Financial Highlights: The Second Quarter Ended September 30, Consolidated Financial Highlights ( from April 1, 2015 to September 30, 2015 )
") (Unaudited translation of Kessan Tanshin, provided for reference only) Financial Highlights: The Second Quarter Ended September 30, 2015 1. Consolidated Financial Highlights ( from April 1, 2015 to September
(Unaudited translation of Kessan Tanshin, provided for reference only) Financial Highlights: The Second Quarter Ended September 30, 2015 1. Consolidated Financial Highlights ( from April 1, 2015 to September
Financial Highlights: The Second Quarter Ended September 30, 2010
 October 29, 2010 Financial Highlights: The Second Quarter Ended September 30, 2010 1. Consolidated Financial Highlights ( from April 1, 2010 to September 30, 2010 ) (All financial information has been
Financial Highlights: The Second Quarter Ended September 30, Consolidated Financial Highlights ( from April 1, 2017 to September 30, 2017 )
") Financial Highlights: The Second Quarter Ended September 30, 2017 1. Consolidated Financial Highlights ( from April 1, 2017 to September 30, 2017 ) (All financial information has been prepared in accordance
Financial Highlights: The Second Quarter Ended September 30, 2017 1. Consolidated Financial Highlights ( from April 1, 2017 to September 30, 2017 ) (All financial information has been prepared in accordance
Financial Highlights: The First Quarter Ended June 30, Consolidated Financial Highlights ( from April 1, 2018 to June 30, 2018 )
") Financial Highlights: The First Quarter Ended June 30, 2018 1. Consolidated Financial Highlights ( from April 1, 2018 to June 30, 2018 ) (All financial information has been prepared in accordance with
Financial Highlights: The First Quarter Ended June 30, 2018 1. Consolidated Financial Highlights ( from April 1, 2018 to June 30, 2018 ) (All financial information has been prepared in accordance with
(Unaudited translation of Kessan Tanshin, provided for reference only) January 31, 2017
 January 31, 2017") Financial Highlights: TheThird Quarter Ended December 31, 2016 1. Consolidated Financial Highlights ( from April 1, 2016 to December 31, 2016 ) (All financial information has been prepared in accordance
Financial Highlights: TheThird Quarter Ended December 31, 2016 1. Consolidated Financial Highlights ( from April 1, 2016 to December 31, 2016 ) (All financial information has been prepared in accordance
1. Supplemental explanation of FY2014 Q2 financial results
 1. Supplemental explanation of FY2014 Q2 financial results [Overall view] During the first half (H1) (April-September) of FY2014, we saw the yen s depreciation driving up revenue and income on a year-on-year
Explanation by the CEO and Major Q&A
 October 31, 2016 Explanation by the CEO and Major Q&A [Overall View] The second quarter of FY2016 ended with a slight upturn from the previous outlook, despite a continued severe business environment.
1. Consolidated Financial Highlights ( from April 1, 2017 to December 31, 2017 )
") Financial Highlights: The Third Quarter Ended December 31, 2017 1. Consolidated Financial Highlights ( from April 1, 2017 to December 31, 2017 ) (All financial information has been prepared in accordance
Financial Highlights: The Third Quarter Ended December 31, 2017 1. Consolidated Financial Highlights ( from April 1, 2017 to December 31, 2017 ) (All financial information has been prepared in accordance
FINANCIAL HIGHLIGHTS. Brief report of the three months ended June 30, Kawasaki Kisen Kaisha, Ltd. [Two Year Summary]
![FINANCIAL HIGHLIGHTS. Brief report of the three months ended June 30, Kawasaki Kisen Kaisha, Ltd. [Two Year Summary]](/thumbs/90/102652505.jpg "FINANCIAL HIGHLIGHTS. Brief report of the three months ended June 30, Kawasaki Kisen Kaisha, Ltd. [Two Year Summary]") FINANCIAL HIGHLIGHTS Brief report of the three months ended June 30, 2014 [Two Year Summary] Kawasaki Kisen Kaisha, Ltd. Three months Three months Three months June 30, 2013 June 30, 2014 June 30, 2014
FINANCIAL HIGHLIGHTS Brief report of the three months ended June 30, 2014 [Two Year Summary] Kawasaki Kisen Kaisha, Ltd. Three months Three months Three months June 30, 2013 June 30, 2014 June 30, 2014
(Unaudited translation of Kessan Tanshin, provided for reference only) April 27, ( Million) FY2017 FY2016 1,652,393 1,504,373 22,684
 April 27, ( Million) FY2017 FY2016 1,652,393 1,504,373 22,684") Financial Highlights: Fiscal Year 2017 Ended March 31, 2018 1. Consolidated Financial Highlights ( from April 1, 2017 to March 31, 2018) (All financial information has been prepared in accordance with
Financial Highlights: Fiscal Year 2017 Ended March 31, 2018 1. Consolidated Financial Highlights ( from April 1, 2017 to March 31, 2018) (All financial information has been prepared in accordance with
Brief report of the six months ended September 30, 2014 Kawasaki Kisen Kaisha, Ltd. [Two Year Summary] Six months
![Brief report of the six months ended September 30, 2014 Kawasaki Kisen Kaisha, Ltd. [Two Year Summary] Six months](/thumbs/96/127740495.jpg "Brief report of the six months ended September 30, 2014 Kawasaki Kisen Kaisha, Ltd. [Two Year Summary] Six months") FINANCIAL HIGHLIGHTS Brief report of the six months September 30, 2014 Kawasaki Kisen Kaisha, Ltd. [Two Year Summary] September 30, 2013 September 30, 2014 September 30, 2014 Consolidated Operating revenues
FINANCIAL HIGHLIGHTS Brief report of the six months September 30, 2014 Kawasaki Kisen Kaisha, Ltd. [Two Year Summary] September 30, 2013 September 30, 2014 September 30, 2014 Consolidated Operating revenues
MOL Group Midterm Management Plan FY2007-FY2009
 MOL Group Midterm Management Plan FY2007-FY2009 March 22, 2007 Mitsui O.S.K. Lines, Ltd. Contents MOL Group Midterm Management Plan FY2007-FY2009 2 Overall Strategies 3 Measures to Reinforce Safe Operation
Mitsui O.S.K. Lines, Ltd. Financial Highlights: Fiscal Year 2004 ended March 31, 2005
 Mitsui O.S.K. Lines, Ltd. Financial Highlights: Fiscal Year 2004 ended March 31, 2005 1. Consolidated Financial Highlights (from April 1, 2004 to March 31, 2005) (All financial information has been prepared
IINO KAIUN KAISHA, LTD. (IINO LINES)
") October 30, 2015 Consolidated Financial Results For the Six Months Ended September 30, 2015 - under Japanese GAAP IINO KAIUN KAISHA, LTD. (IINO LINES) Stock code: 9119 URL: http://www.iino.co.jp/kaiun/english/
October 30, 2015 Consolidated Financial Results For the Six Months Ended September 30, 2015 - under Japanese GAAP IINO KAIUN KAISHA, LTD. (IINO LINES) Stock code: 9119 URL: http://www.iino.co.jp/kaiun/english/
FINANCIAL HIGHLIGHTS. Brief report of the Three months ended June 30, Kawasaki Kisen Kaisha, Ltd. [Two Year Summary]
![FINANCIAL HIGHLIGHTS. Brief report of the Three months ended June 30, Kawasaki Kisen Kaisha, Ltd. [Two Year Summary]](/thumbs/95/124379722.jpg "FINANCIAL HIGHLIGHTS. Brief report of the Three months ended June 30, Kawasaki Kisen Kaisha, Ltd. [Two Year Summary]") FINANCIAL HIGHLIGHTS Brief report of the Three months ended June 30, 2013 [Two Year Summary] Kawasaki Kisen Kaisha, Ltd. Three months Three months Three months June 30, 2012 June 30, 2013 June 30, 2013
FINANCIAL HIGHLIGHTS Brief report of the Three months ended June 30, 2013 [Two Year Summary] Kawasaki Kisen Kaisha, Ltd. Three months Three months Three months June 30, 2012 June 30, 2013 June 30, 2013
FINANCIAL HIGHLIGHTS Brief report of the six months ended September 30,2009.
 FINANCIAL HIGHLIGHTS Brief report of the six months ended September 30,2009. [Two Year Summary] Kawasaki Kisen Kaisha, Ltd. Six months Six months Six months ended ended ended Sep.30, 2008 Sep.30, 2009
Nippon Yusen Kabushiki Kaisha (NYK Line)
") Consolidated Financial Results for Three Months Ended June 30, 2015 (Japanese GAAP) (Unaudited) July 31, 2015 Nippon Yusen Kabushiki Kaisha (NYK Line) Security Code: 9101 Listings: The First Section of
Consolidated Financial Results for Three Months Ended June 30, 2015 (Japanese GAAP) (Unaudited) July 31, 2015 Nippon Yusen Kabushiki Kaisha (NYK Line) Security Code: 9101 Listings: The First Section of
FINANCIAL HIGHLIGHTS. Brief report of the three months ended June 30, Kawasaki Kisen Kaisha, Ltd. [Two Year Summary] Consolidated
![FINANCIAL HIGHLIGHTS. Brief report of the three months ended June 30, Kawasaki Kisen Kaisha, Ltd. [Two Year Summary] Consolidated](/thumbs/80/80446923.jpg "FINANCIAL HIGHLIGHTS. Brief report of the three months ended June 30, Kawasaki Kisen Kaisha, Ltd. [Two Year Summary] Consolidated") FINANCIAL HIGHLIGHTS Brief report of the three months ended June 30, 2016 [Two Year Summary] Consolidated Kawasaki Kisen Kaisha, Ltd. Three months Three months Three months June 30, 2016 June 30, 2015
FINANCIAL HIGHLIGHTS Brief report of the three months ended June 30, 2016 [Two Year Summary] Consolidated Kawasaki Kisen Kaisha, Ltd. Three months Three months Three months June 30, 2016 June 30, 2015
Iino Kaiun Kaisha, Ltd. (Iino Lines)
") Consolidated Financial Results (Summary) For the Six Months Ended September 30, 2011 - under Japanese GAAP October 31, 2011 Iino Kaiun Kaisha, Ltd. (Iino Lines) Stock code: 9119 URL: http://www.iino.co.jp/kaiun/english/
Consolidated Financial Results (Summary) For the Six Months Ended September 30, 2011 - under Japanese GAAP October 31, 2011 Iino Kaiun Kaisha, Ltd. (Iino Lines) Stock code: 9119 URL: http://www.iino.co.jp/kaiun/english/
FINANCIAL HIGHLIGHTS. Brief report of the nine months ended December 31, Kawasaki Kisen Kaisha, Ltd. [Two Year Summary] Consolidated
![FINANCIAL HIGHLIGHTS. Brief report of the nine months ended December 31, Kawasaki Kisen Kaisha, Ltd. [Two Year Summary] Consolidated](/thumbs/95/124150087.jpg "FINANCIAL HIGHLIGHTS. Brief report of the nine months ended December 31, Kawasaki Kisen Kaisha, Ltd. [Two Year Summary] Consolidated") FINANCIAL HIGHLIGHTS Brief report of the nine months ended December 31, 2018 [Two Year Summary] Consolidated Kawasaki Kisen Kaisha, Ltd. Nine months Nine months Nine months December 31, 2018 December 31,
FINANCIAL HIGHLIGHTS Brief report of the nine months ended December 31, 2018 [Two Year Summary] Consolidated Kawasaki Kisen Kaisha, Ltd. Nine months Nine months Nine months December 31, 2018 December 31,
Nippon Yusen Kabushiki Kaisha (NYK Line)
") Consolidated Financial Results for Six Months Ended September 30, 2017 (Japanese GAAP) (Unaudited) October 31, 2017 Nippon Yusen Kabushiki Kaisha (NYK Line) Security Code: 9101 Listings: The First Section
Consolidated Financial Results for Six Months Ended September 30, 2017 (Japanese GAAP) (Unaudited) October 31, 2017 Nippon Yusen Kabushiki Kaisha (NYK Line) Security Code: 9101 Listings: The First Section
IINO KAIUN KAISHA, LTD. (IINO LINES)
") Consolidated Financial Results For the Three Months Ended June 30, 2014- under Japanese GAAP IINO KAIUN KAISHA, LTD. (IINO LINES) Stock code: 9119 URL: http://www.iino.co.jp/kaiun/english/ Representative:
Consolidated Financial Results For the Three Months Ended June 30, 2014- under Japanese GAAP IINO KAIUN KAISHA, LTD. (IINO LINES) Stock code: 9119 URL: http://www.iino.co.jp/kaiun/english/ Representative:
1. Consolidated Financial Highlights ( from April 1, 2012 to March 31, 2013 )
") (Unaudited translation of kessan tanshin, provided for reference only) April 30, 2013 Financial Highlights: Fiscal Year 2012 Ended March 31, 2013 1. Consolidated Financial Highlights ( from April 1, 2012
(Unaudited translation of kessan tanshin, provided for reference only) April 30, 2013 Financial Highlights: Fiscal Year 2012 Ended March 31, 2013 1. Consolidated Financial Highlights ( from April 1, 2012
Mitsui O.S.K. Lines New Expansion Target [ MOL next ] Review on the Second Year (FY2002) Mitsui O.S.K. Lines, Ltd. May 2003
![Mitsui O.S.K. Lines New Expansion Target [ MOL next ] Review on the Second Year (FY2002) Mitsui O.S.K. Lines, Ltd. May 2003](/thumbs/81/83800029.jpg "Mitsui O.S.K. Lines New Expansion Target [ MOL next ] Review on the Second Year (FY2002) Mitsui O.S.K. Lines, Ltd. May 2003") Mitsui O.S.K. Lines New Expansion Target [ MOL next ] Review on the Second Year (FY2002) Mitsui O.S.K. Lines, Ltd. May 2003 Contents Consolidated MOL next Review 2 FY2001/2002 Results and FY2003 Forecast
Mitsui O.S.K. Lines New Expansion Target [ MOL next ] Review on the Second Year (FY2002) Mitsui O.S.K. Lines, Ltd. May 2003 Contents Consolidated MOL next Review 2 FY2001/2002 Results and FY2003 Forecast
Capital expenditures 50,548 49,493 Depreciation and amortization 55,334 60,710. *Estimation for FY2004: Exchange rate 1US$= 110.0,
 Mitsui O.S.K. Lines, Ltd. Financial Highlights: Fiscal Year 200 ended March 1, 2004 1. Consolidated Results for fiscal year 200 (from April 1, 200 to March 1, 2004) (All financial information has been
Hyundai Merchant Marine. December 2013
 Hyundai Merchant Marine December 2013 Table of Contents 1. Company Overview 1.1 Business Portfolio 1.2 Fleet Portfolio 1.3 Fleet Expansion Plan 2. Performance Review 3. Divisional Data 4. Financial Data
Nippon Yusen Kabushiki Kaisha (NYK Line)
") Consolidated Financial Results for the Year Ended (Japanese GAAP) (Unaudited) April 28, 2017 Nippon Yusen Kabushiki Kaisha (NYK Line) Security Code: 9101 Listings: The First Section of Tokyo and Nagoya
Consolidated Financial Results for the Year Ended (Japanese GAAP) (Unaudited) April 28, 2017 Nippon Yusen Kabushiki Kaisha (NYK Line) Security Code: 9101 Listings: The First Section of Tokyo and Nagoya
NORDEN RESULTS. Annual Report Copenhagen, Denmark. 1 March 2017 NORDEN ANNUAL REPORT 2016 RESULTS 1. Custodians of smarter global trade
 NORDEN RESULTS Annual Report 216 Copenhagen, Denmark 1 March 217 NORDEN ANNUAL REPORT 216 RESULTS 1 AGENDA Group highlights Financials Dry Cargo Tankers 217 expectations Q & A NORDEN ANNUAL REPORT 216
Hyundai Merchant Marine Co., Ltd. August 2010
 Hyundai Merchant Marine Co., Ltd. August 2010 Important Notice This presentation contains forward looking statements, that are based on Hyundai Merchant Marine s current expectations, prospects, assumptions,
IINO KAIUN KAISHA, LTD. (IINO LINES)
") October 31, 2018 Consolidated Financial Results For the Six Months Ended September 30, 2018 - under Japanese GAAP IINO KAIUN KAISHA, LTD. (IINO LINES) Stock code: 9119 URL: http://www.iino.co.jp/kaiun/english/
October 31, 2018 Consolidated Financial Results For the Six Months Ended September 30, 2018 - under Japanese GAAP IINO KAIUN KAISHA, LTD. (IINO LINES) Stock code: 9119 URL: http://www.iino.co.jp/kaiun/english/
Nippon Yusen Kabushiki Kaisha (NYK Line)
") For immediate release Consolidated Financial Results for the Year Ended (Japanese GAAP) (Unaudited) April 28, 2016 Nippon Yusen Kabushiki Kaisha (NYK Line) Security Code: 9101 Listings: The First Section
For immediate release Consolidated Financial Results for the Year Ended (Japanese GAAP) (Unaudited) April 28, 2016 Nippon Yusen Kabushiki Kaisha (NYK Line) Security Code: 9101 Listings: The First Section
presentation shall not be construed as recommendations for buying or selling shares of China COSCO. China COSCO shall not be responsible for any
 1Q2015 Results 30 April 2015 China COSCO Holdings Company Limited Disclaimer This presentation contains certain forward-looking statements with respect to the financial condition, results of operations
FINANCIAL HIGHLIGHTS. Brief report of the six months ended September 30, Kawasaki Kisen Kaisha, Ltd. [Two Year Summary] Consolidated
![FINANCIAL HIGHLIGHTS. Brief report of the six months ended September 30, Kawasaki Kisen Kaisha, Ltd. [Two Year Summary] Consolidated](/thumbs/77/76303683.jpg "FINANCIAL HIGHLIGHTS. Brief report of the six months ended September 30, Kawasaki Kisen Kaisha, Ltd. [Two Year Summary] Consolidated") FINANCIAL HIGHLIGHTS Brief report of the six months ended September 30, 2017 [Two Year Summary] Consolidated Kawasaki Kisen Kaisha, Ltd. Six months Six months Six months ended ended ended September 30,
FINANCIAL HIGHLIGHTS Brief report of the six months ended September 30, 2017 [Two Year Summary] Consolidated Kawasaki Kisen Kaisha, Ltd. Six months Six months Six months ended ended ended September 30,
1Q 2013 Performance Review. 14 May 2013
 1Q 2013 Performance Review 14 May 2013 Forward Looking Statements The following presentation includes forward-looking statements, which involve known and unknown risks and uncertainties, that could cause
PRESENTATION OF NORDEN
 PRESENTATION OF NORDEN Jyske Bank Company Day 27 November 214 CFO Michael Tønnes Jørgensen Presentation of NORDEN 1 AGENDA NORDEN at a glance Group highlights Financials Dry Cargo Tankers 214 expectations
Brief report of the six months ended September 30, 2017 Kawasaki Kisen Kaisha, Ltd. [Two Year Summary] Six months Six months Six months
![Brief report of the six months ended September 30, 2017 Kawasaki Kisen Kaisha, Ltd. [Two Year Summary] Six months Six months Six months](/thumbs/77/76303680.jpg "Brief report of the six months ended September 30, 2017 Kawasaki Kisen Kaisha, Ltd. [Two Year Summary] Six months Six months Six months") FINANCIAL HIGHLIGHTS Brief report of the six months ended September 30, 2017 Kawasaki Kisen Kaisha, Ltd. [Two Year Summary] Six months Six months Six months ended ended ended September 30, 2017 September
FINANCIAL HIGHLIGHTS Brief report of the six months ended September 30, 2017 Kawasaki Kisen Kaisha, Ltd. [Two Year Summary] Six months Six months Six months ended ended ended September 30, 2017 September
NORDEN RESULTS. Third quarter of Hellerup, Denmark. 12 November Our business is global tramp shipping
 NORDEN RESULTS Third quarter of 214 Hellerup, Denmark 12 November 214 NORDEN Third quarter of 214 results 1 AGENDA Group highlights Financials Dry Cargo Tankers 214 expectations Q & A NORDEN Third quarter
NORDEN RESULTS. Annual Report Copenhagen, Denmark 14 March Annual report 2017 CUSTODIANS OF SMARTER GLOBAL TRADE
 NORDEN RESULTS Annual Report 217 Copenhagen, Denmark 14 March 218 1 Annual report 217 CUSTODIANS OF SMARTER GLOBAL TRADE AGENDA The NORDEN DNA Business update Market Review Latest developments Outlook
Hyundai Merchant Marine Co., Ltd. Company overview
 Hyundai Merchant Marine Co., Ltd. Company overview November 2009 Hyundai Merchant Marine Co.,Ltd. 1 Important Notice This presentation contains forward-looking statements, that are based on Hyundai Merchant
Stock Code: HSBC Shipping Day 2009, Hong Kong
 Stock Code: 2343 HSBC Shipping Day 2009, Hong Kong Roadshow - 18 March 2009 Pacific Basin Overview World s leading dry bulk owner/operator of modern handysize vessels and a top 10 handymax operator, principally
The Great Eastern Shipping Co. Ltd.
 The Great Eastern Shipping Co. Ltd. 1 Forward looking information This presentation contains certain forward looking information through statements, which are based on management s current expectations
Hyundai Merchant Marine Co., Ltd. Company overview
 Hyundai Merchant Marine Co., Ltd. Company overview May 21 Hyundai Merchant Marine Co.,Ltd. 1 Important Notice This presentation contains forward-looking statements, that are based on Hyundai Merchant Marine
was RESULTS Q May 30, 2018
 was RESULTS Q1-2018 May 30, 2018 FORWARD-LOOKING STATEMENTS Matters discussed in this presentation may constitute forward-looking statements. The Private Securities Litigation Reform Act of 1995 provides
FINANCIAL HIGHLIGHTS Brief report of the year ended March 31,2008.
 FINANCIAL HIGHLIGHTS Brief report of the year ended March 31,2008. [Two Year Summary] Consolidated Kawasaki Kisen Kaisha, Ltd. Year Year Year ended ended ended Mar.31, 2007 Mar.31, 2008 Mar.31, 2008 Operating
U.S Export Market Update
 U.S Export Market Update Robert F. Sappio Senior Vice President Pan-American Trade, APL JOC TPM, Long Beach, CA March 1, 2010 Page 1 Agenda Trade Growth Drivers of Surging Exports US Terminal & Intermodal
Iino Kaiun Kaisha, Ltd. (Iino Lines)
") Consolidated Financial Results For the Six Months Ended September 30, 2010 - under Japanese GAAP October 29, 2010 Iino Kaiun Kaisha, Ltd. (Iino Lines) Stock code: 9119 URL: http://www.iino.co.jp/kaiun/english/
Consolidated Financial Results For the Six Months Ended September 30, 2010 - under Japanese GAAP October 29, 2010 Iino Kaiun Kaisha, Ltd. (Iino Lines) Stock code: 9119 URL: http://www.iino.co.jp/kaiun/english/
Full-Year Results 2006 and 2007 outlook
 Full-Year Results 26 and 27 outlook Carsten Mortensen, CEO Jens Fehrn-Christensen, CFO Copenhagen, ch 27, 27 1 TODAY S AGENDA 26 in highlights Dry Cargo Tanker Guidance for 27 Q&A Session THE PREFERRED
PRESENTATION OF NORDEN
 PRESENTATION OF NORDEN EVP Martin Badsted SEB Nordic Seminar 8 January 2014 Copenhagen SEB Nordic Seminar 8 January 2014 1 A LEADING GLOBAL TRAMP OPERATOR Dry cargo Capesize Post-Panamax Panamax Handymax
5th Annual Shipping, Logistics & Offshore Services Conference
 5th Annual Shipping, Logistics & Offshore Services Conference New York City, September 16, 2008 Disclosures Statements in this presentation which are not statements of historical fact are forward-looking
GRINDROD LIMITED UNAUDITED INTERIM RESULTS AND DIVIDEND ANNOUNCEMENT for the six months ended 30 June 2017
 www.grindrod.com GRINDROD LIMITED UNAUDITED INTERIM RESULTS AND DIVIDEND ANNOUNCEMENT for the six months ended 30 June 2017 Wifi access guest@sun Presentation and Announcement download www.grindrod.com
Genco Shipping & Trading Limited
 Genco Shipping & Trading Limited Q1 2006 Earnings Call May 4, 2006 Forward Looking Statements "Safe Harbor" Statement Under the Private Securities Litigation Reform Act of 1995 This presentation contains
RISING ABOVE ADVERSITY
 Message from the President RISING ABOVE ADVERSITY PAST PRESENT FUTURE In fiscal 211, we experienced our largest loss since our foundation. Today, we continue to manage the company to rise above adversity.
Conference call Presentation of Q results 1 March 2012
 Conference call Presentation of Q4 11 results 1 March 12 Safe Harbour Statement Matters discussed in this presentation may constitute forward-looking statements. Such statements reflect TORM's current
Third Quarter 2012 Earnings Presentation October 23, 2012
 Third Quarter 2012 Earnings Presentation October 23, 2012 Statements in this presentation which are not statements of historical fact are forward-looking statements (as such term is defined in Section
Forward Looking Statements
 Eagle Bulk Shipping Inc. 3Q 2005 Results Presentation November 14, 2005 Forward Looking Statements This presentation contains certain statements that may be deemed to be forward-looking statements within
Genco Shipping & Trading Limited
 Genco Shipping & Trading Limited Q3 2005 Earnings Call November 3 rd, 2005 Forward Looking Statements "Safe Harbor" Statement Under the Private Securities Litigation Reform Act of 1995 This presentation
First Quarter 2012 Earnings Presentation April 26, 2012
 First Quarter 2012 Earnings Presentation April 26, 2012 Statements in this presentation which are not statements of historical fact are forward-looking statements (as such term is defined in Section 21E
Q Results August 29, 2012
 Q2 2012 Results August 29, 2012 Forward looking statements MATTERS DISCUSSED IN THIS DOCUMENT MAY CONSTITUTE FORWARD-LOOKING STATEMENTS. THE PRIVATE SECURITIES LITIGATION REFORM ACT OF 1995 PROVIDES SAFE
The Great Eastern Shipping Company Ltd. A Review of Financial Year
 The Great Eastern Shipping Company Ltd. A Review of Financial Year 04 April 30, 2004 Forward Looking Statement This presentation contains certain forward looking information through statements, which are
Third quarter of 2016
 ANNOUNCEMENT NO. 22 9 NOVEMBER INTERIM REPORT Third quarter of Adjusted result for the period* : USD -12 million ( : USD 18 million). EBIT : USD -13 million (USD 21 million), of which vessel sales make
World s Largest Handysize Bulker Owner/Operator
 1 23 Sep 213 World s Largest Handysize Bulker Owner/Operator Pacific Basin Dry Bulk Fleet Development No. of vessels on the water Handysize Handymax Post-Panamax 155 224 8 9 1 11 12 13 (As at 22 July)
Iino Kaiun Kaisha, Ltd. (Iino Lines)
") Financial Results For the Year Ended March 31, 2011- Consolidated Iino Kaiun Kaisha, Ltd. (Iino Lines) Stock code: 9119 URL: http://www.iino.co.jp/kaiun/english/ Representative: Tomoyuki Sekine President
Financial Results For the Year Ended March 31, 2011- Consolidated Iino Kaiun Kaisha, Ltd. (Iino Lines) Stock code: 9119 URL: http://www.iino.co.jp/kaiun/english/ Representative: Tomoyuki Sekine President
Golden Ocean Group Limited. Preliminary Results for the Financial Year Introduction
 Golden Ocean Group Limited Preliminary Results for the Financial Year 2004 Introduction Golden Ocean Group Limited ( Golden Ocean or the Company ) was incorporated as a wholly owned subsidiary of Frontline
Seeking Alpha Maritime Investor Forum Presentation. 19 June 2017
 Seeking Alpha Maritime Investor Forum Presentation 19 June 2017 Disclaimer This presentation contains certain statements that may be deemed to be forward-looking statements within the meaning of Section
For the Third Quarter ended December 31, NYK Fact Book Ⅱ 2017
 217 For the Third Quarter ended December 31, 217 NYK Fact Book Ⅱ 217 Contents page 1 Comparison of Consolidated Performance to Forecasts 2 Consolidated Financial Highlights and Indicators 4 Financial Information
Presentation of Q results
 Presentation of Q1 2010 results 1 Highlights Results Tanker Division Bulk Division Fleet value Greater Efficiency Power Financial position 2010 guidance Coverage of earning days Profit before tax of USD
Mitsui O.S.K. Lines, Ltd. - Financial Results: Fiscal Year 2001 ended March 31,
 Mitsui O.S.K. Lines, Ltd. Financial Results: Fiscal Year 2001 ended March 31, 2002 1. Consolidated Results for fiscal year 2001 (from April 1, 2001 to March 31, 2002) * The translation of Japanese yen
Price Developments Evaluating Sector Attractiveness
 Price Developments Evaluating Sector Attractiveness Dr Adam Kent - Maritime Strategies International (MSI) 7th Annual Marine Money London Ship Finance Forum 27 th Jan 2016 Agenda Price Developments Evaluating
NORDEN RESULTS. First quarter of Hellerup, Denmark. 13 May Our business is global tramp shipping. NORDEN - First quarter of 2014 results 1
 NORDEN RESULTS First quarter of 214 Hellerup, Denmark 13 May 214 NORDEN - First quarter of 214 results 1 AGENDA Group highlights Financial Dry Cargo Tankers 214 expectations Q & A NORDEN - First quarter
9 th Global Shipping & Logistics Conference
 9 th Global Shipping & Logistics Conference NASDAQ: SBLK September 2012 Safe Harbor Statement Except for the historical information contained herein, this presentation contains among other things, certain
Strategy and Market Update Analyst Day
 14 Oct 2015 Strategy and Market Update 2015 Analyst Day 2 Our Increased Focus on Dry Bulk Early 2012 2015 US$m Four business units Fully dry bulk focused ME Towage Terminals, etc 17 Newbuildings Minor
Navios Maritime Containers Inc. Navios Maritime Containers Inc. Q Earnings Presentation
 Navios Maritime Containers Inc. Q4 2017 Earnings Presentation January 29, 2018 Forward Looking Statements This presentation contains forward-looking statements concerning future events, including future
Freight Market Improves From Very Low Base
 6 Oct 2016 Freight Market Improves From Very Low Base Baltic Handysize Index (BHSI) & Baltic Supramax Index (BSI) US$/day net* $10,000 $9,000 $8,000 $7,000 $6,000 $5,000 $4,000 BHSI: $2,563 30 Sep 2016:
BW LPG Limited con. Condensed Consolidated Interim Financial Information Q3 2017
 Q2 BW LPG Limited con Condensed Consolidated Interim Financial Information This report is not for release, publication or distribution (directly or indirectly) in or to the United States, Canada, Australia
J. Lauritzen A/S Investor Update Interim Financial Report 2016 Q2
 J. Lauritzen A/S Investor Update Interim Financial Report 216 Q2 August 216 Please read the disclaimer placed as the last slide in this presentation. Thank you. www.j-l.com Oceans of know-how 216 H1: As
1Q 2014 Performance Review. 14 May 2014
 1Q 2014 Performance Review 14 May 2014 Forward Looking Statements The following presentation includes forward-looking statements, which involve known and unknown risks and uncertainties, that could cause
Interim report first half-year 2009
 NASDAQ OMX Copenhagen A/S Nikolaj Plads 6 DK-1067 Copenhagen K Announcement no. 26 19 August 2009 Interim report first half-year 2009 First half-year highlights The profit for the first half-year of 2009
Eagle Bulk Shipping Inc. 4Q 2005 Results Presentation
 Eagle Bulk Shipping Inc. 4Q 2005 Results Presentation March 7, 2006 Forward Looking Statements This presentation contains certain statements that may be deemed to be forward-looking statements within the
YTD13 & 3Q 2013 Performance Review. 30 October 2013
 YTD13 & 3Q 2013 Performance Review 30 October 2013 Forward Looking Statements The following presentation includes forward-looking statements, which involve known and unknown risks and uncertainties, that
2012 Annual Results 28 February Script for Results Presentation
 2012 Annual Results 28 February 2013 Script for Results Presentation Speaker: Mats Berglund Slide 1 Cover Good afternoon ladies and gentlemen, and thank you for attending Pacific Basin s 2012 Annual Results
Business & Financial Presentation FY
 The Great Eastern Shipping Company Ltd. Business & Financial Presentation FY 2004-05 April 29, 2005 1 Forward Looking Statements Except for historical information, the statements made in this presentation
The Great Eastern Shipping Co. Ltd. Investors Meet 17 th November, 2006
 The Great Eastern Shipping Co. Ltd. Investors Meet 17 th November, 2006 Forward Looking Statements Except for historical information, the statements made in this presentation constitute forward looking
DryShips Inc. Informational Roadshow November/December 2005 NASDAQ: DRYS
 DryShips Inc. Informational Roadshow November/December 2005 NASDAQ: DRYS Disclaimer Forward-Looking Statements This presentation contains forward-looking statements within the meaning of applicable federal
Pacific Basin Shipping Limited
 2010 Interim Results Presentation Slide 1 Cover Spoken by: David Turnbull Good afternoon ladies and gentlemen, and thank you very much for attending Pacific Basin s 2010 half year results presentation.
Pacific Basin. 1 March Analyst
 Pacific Basin 1 March 2011 - Analyst 2010 Annual Results 2010 Annual Results 1 2010 Group Highlights g Net Profit, Underlying Profit Net Profit: US$m & Cash Flow Underlying Profit: Basic EPS: Cash flow
Interim report - third quarter 2007
 OMX Nordic Exchange Copenhagen A/S Nikolaj Plads 6 1067 Copenhagen K Announcement no. 39 29 November 2007 Interim report - third quarter 2007 The first three quarters - highlights The profit for the third
Handelsbanken s Transport Seminar September 2011 THE PREFERRED PARTNER IN GLOBAL TRAMP SHIPPING. UNIQUE PEOPLE. OPEN MINDED TEAM SPIRIT. NUMBER ONE.
 Handelsbanken s Transport Seminar September 2011 THE PREFERRED PARTNER IN GLOBAL TRAMP SHIPPING. UNIQUE PEOPLE. OPEN MINDED TEAM SPIRIT. NUMBER ONE. Dampskibsselskabet Handelsbanken s Transport NORDEN
NORDEN RESULTS. Full year results of Hellerup, Denmark 7 March Our business is global tramp shipping. NORDEN Full year result of
 NORDEN RESULTS Full year results of 2011 Hellerup, Denmark 7 March 2012 NORDEN Full year result of 2011 1 AGENDA Group highlights Strategy Financial highlights Market expectations Dry Cargo Tanker 2012
PRELIMINARY FIGURES 2002
 PRELIMINARY FIGURES 2002 REPORT 4TH QUARTER 2002 4TH QUARTER 2002 FINANCIAL PERFORMANCE Belships recorded an operating income of USD 7,839,000 (2001: USD 6,652,000) and an operating result of USD -1,080,000
A.P. Møller Mærsk A/S
 Conference call 9.30 am CET Webcast available at www.maersk.com A.P. Møller Mærsk A/S Interim Management Statement 11 May 2011 Forward-looking Statements This presentation contains forward-looking statements.
Handelsbanken Transport Seminar. Martin Badsted Senior Vice President. Copenhagen, October 2009
 Handelsbanken Transport Seminar Martin Badsted Senior Vice President Copenhagen, October 2009 THE PREFERRED PARTNER IN GLOBAL TRAMP SHIPPING. UNIQUE PEOPLE. OPEN MINDED TEAM SPIRIT. NUMBER ONE. Dampskibsselskabet
First quarter of 2016
 ANNOUNCEMENT NO. 11 4 MAY INTERIM REPORT First quarter of Adjusted result for the period : USD -5 million. ( Results for the period adjusted for Profits from the sale of vessels etc. and Fair value adjustment
Navios Partners Ownership Structure
 First Quarter 2010 Earnings Presentation April 28, 2010 Agenda Company Overview Company Developments Review of Q1 2010 Financial Results Quarterly Cash Distribution Fleet and Operations Overview Industry
Information is based on: i) 1Q12 trading update ii) RoRo Announcement 18 June 2012
 1Q12 trading update ii) RoRo Announcement 18 June 2012") Standard Chartered Earths Resources Conference Hong Kong, June 212 Information is based on: i) 1Q12 trading update ii) RoRo Announcement 18 June 212 18 Jun 212 Pacific Basin Dry Bulk - Earnings Coverage
Standard Chartered Earths Resources Conference Hong Kong, June 212 Information is based on: i) 1Q12 trading update ii) RoRo Announcement 18 June 212 18 Jun 212 Pacific Basin Dry Bulk - Earnings Coverage
2017 Annual Results - Highlights
 28 Feb 2018 Highlights 1 2017 Annual Results - Highlights US$m 2017 2016 Change EBITDA 133.8 22.8 +111.0 Net profit 3.6 (86.5) +90.1 Cash 244.7 269.2 Net gearing 35% 34% Owned fleet / Total fleet * 105