NETSCOUT SYSTEMS Reports Financial Results for Third Quarter Fiscal Year 2018
|
|
|
- Oswald Cook
- 5 years ago
- Views:
Transcription

1 Contacts: Investors Media Andrew Kramer Donna Candelori Vice President of Investor Relations Senior Public Relations Manager NETSCOUT SYSTEMS Reports Financial Results for Third Quarter Fiscal Year 2018 WESTFORD, Mass., January 30, 2018 NETSCOUT SYSTEMS, INC. (NASDAQ: NTCT), a leading provider of business assurance, a powerful combination of service assurance, cybersecurity, and business intelligence solutions, today announced financial results for its third quarter of fiscal year 2018 ended December 31, As previously disclosed on January 10, NETSCOUT s third-quarter fiscal year 2018 results were primarily impacted by unanticipated reductions in spending by North American carriers, funding delays for a range of Federal projects and longer-than-expected sales cycles for our enterprise offerings, stated Anil Singhal, NETSCOUT s president and CEO. Although we expect these dynamics will continue to create revenue challenges in the fourth quarter, we move forward with a strong competitive position underpinned by a compelling value proposition, an expansive global customer base and many promising new, high-margin products progressing through our sales funnels. We are advancing our planning processes for fiscal year 2019 with a focus on initiatives that we believe will help us strengthen our revenue performance, support continued gross margin gains, improve operating profitability and drive EPS expansion. Notable developments and highlights: On January 16, 2018, NETSCOUT entered into an amended Credit Agreement, which provides for a new five-year $1 billion senior secured revolving credit facility (increased from $800 million under the Original Credit Agreement), as well as better pricing and more favorable terms and conditions compared with the original agreement. This amended Credit Agreement will support the Company s previously disclosed intentions to execute an Accelerated Share Repurchase (ASR) of up to $300 million within the next several days. The planned ASR will be initiated under the Company s previously disclosed 25 million share repurchase program.
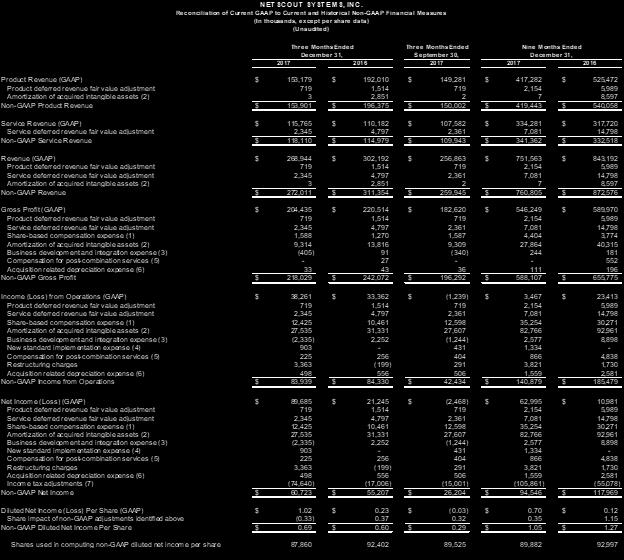
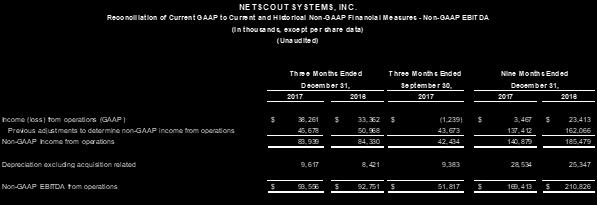
2 NETSCOUT is continuing to advance its planning processes for fiscal year As part of this activity, the Company is focused on initiatives that are aimed at strengthening its revenue performance, supporting continued gross margin gains, improving overall operating profitability and driving EPS expansion. The Company is advancing plans to hold its annual Engage Technology and User Summit from May in Dallas, Texas. Q3 FY18 Financial Results Total revenue (GAAP) for the third quarter of fiscal year 2018 was $268.9 million, compared with $302.2 million in the same quarter one year ago. Non-GAAP total revenue for the third quarter of fiscal year 2018 was $272.0 million versus $311.4 million in the same quarter one year ago. A reconciliation of GAAP and non-gaap results is included in the attached financial tables. Product revenue (GAAP) for the third quarter of fiscal year 2018 was $153.2 million, which was approximately 57% of total revenue. This compares with third-quarter fiscal year 2017 product revenue (GAAP) of $192.0 million, which was approximately 64% of total revenue. On a non-gaap basis, product revenue for the third quarter of fiscal year 2018 was $153.9 million, which was approximately 57% of total non-gaap revenue. This compares with third-quarter fiscal year 2017 non-gaap product revenue $196.4 million, which was approximately 63% of total non-gaap revenue. Service revenue (GAAP) for the third quarter of fiscal year 2018 was $115.8 million, or approximately 43% of total revenue versus service revenue (GAAP) of $110.2 million, or approximately 36% of total revenue, for the same period one year ago. On a non-gaap basis, service revenue for fiscal year 2018 s third quarter was $118.1 million, or approximately 43% of total non-gaap revenue, versus non-gaap service revenue of $115.0 million, or approximately 37% of total non-gaap revenue, for the same quarter one year ago. NETSCOUT s income from operations (GAAP) was $38.3 million in the third quarter of fiscal year 2018, compared with $33.4 million in the comparable quarter one year ago. The Company s third-quarter fiscal year 2018 (GAAP) operating margin was 14.2% versus 11.0% in the prior fiscal year s third quarter. Third-quarter fiscal year 2018 non-gaap EBITDA from operations was $93.6 million, or 34.4% of non-gaap quarterly revenue, which compares with $92.8 million, or 29.8% of non-gaap quarterly revenue in the third quarter of fiscal year Third-quarter fiscal year 2018 non-gaap income from operations was $83.9 million with a non-gaap operating margin of 30.9%. This compares with third- 2
3 quarter fiscal year 2017 non-gaap income from operations of $84.3 million and a non-gaap operating margin of 27.1%. Net income (GAAP) for the third quarter of fiscal year 2018 was $89.7 million, or $1.02 per share (diluted) versus $21.2 million, or $0.23 per share (diluted), for the third quarter of fiscal year On a non-gaap basis, net income for the third quarter of fiscal year 2018 was $60.7 million, or $0.69 per share (diluted), which compares with $55.2 million, or $0.60 per share (diluted), for the third quarter of fiscal year As of December 31, 2017, cash and cash equivalents, and short and long-term marketable securities were $383.0 million, compared with $313.4 million as of September 30, 2017 and $464.7 million as of March 31, During the third quarter of fiscal year 2018, NETSCOUT did not repurchase any of its common stock. Nine-Months FY18 Financial Results For the first nine months of fiscal year 2018, total revenue (GAAP) was $751.6 million and non-gaap total revenue was $760.8 million versus total revenue (GAAP) of $843.2 million and non-gaap total revenue of $872.6 million for the comparable nine-month period of fiscal year Product revenue (GAAP) for the first three quarters of fiscal year 2018 was $417.3 million compared with $525.5 million in the year-ago period. Non-GAAP product revenue for the first nine months of fiscal year 2018 was $419.4 million compared with $540.1 million in the same period one year ago. For the first nine months of fiscal year 2018, service revenue (GAAP) was $334.3 million versus $317.7 million in the same period last year. Non-GAAP service revenue for the first nine months of fiscal year 2018 was $341.4 million, compared with $332.5 million for the comparable period of fiscal year NETSCOUT s income from operations (GAAP) during the first nine months of fiscal year 2018 was $3.5 million, compared with $23.4 million for the comparable nine-month period of fiscal year The Company s operating margin (GAAP) for the first nine months of fiscal year 2018 was 0.5% versus 2.8% in the comparable period of fiscal year During the first three quarters of fiscal year 2018, the Company s non-gaap EBITDA from operations was $169.4 million, or 22.3% of non-gaap total revenue versus non-gaap EBITDA from operations of $210.8 million, or 24.2% of non-gaap 3
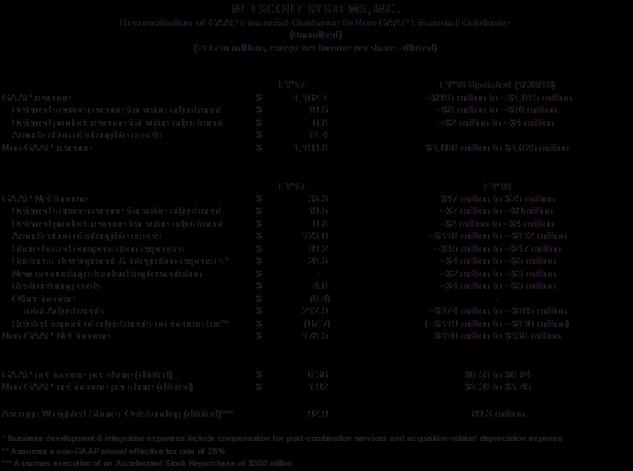
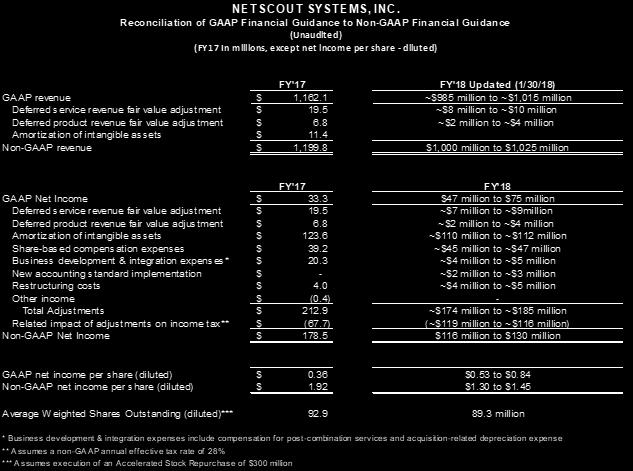
4 total revenue, in the first nine months of fiscal year The Company s non-gaap income from operations for the first three quarters of fiscal year 2018 was $140.9 million with a non-gaap operating margin of 18.5%, compared with non-gaap income from operations for the same period of fiscal year 2017 of $185.5 million and a non-gaap operating margin of 21.3%. For the first nine months of fiscal year 2018, NETSCOUT s net income (GAAP) was $63.0 million, or $0.70 per share (diluted) compared with net income of $11.0 million, or $0.12 per share (diluted) in the same nine-month period one year ago. Non-GAAP net income for the first nine months of fiscal year 2018 was $94.5 million, or $1.05 per share (diluted) versus non-gaap net income for the same period of fiscal year 2017 of $118.0 million, or $1.27 per share (diluted). During the first three quarters of fiscal year 2018, NETSCOUT repurchased a total of 5,802,788 shares of its common stock at an average price of $34.47 per share, totaling approximately $200.0 million in the aggregate. Guidance: On January 10, 2018, NETSCOUT updated its full fiscal year 2018 outlook. Please note that certain new assumptions regarding the magnitude of the planned ASR have no impact on this guidance: The Company s fiscal year 2018 GAAP revenue is expected to be in the range of approximately $985 million and $1.015 billion. The Company expects fiscal year 2018 non-gaap revenue will be in the range of approximately $1.0 billion to $1.025 billion. Due to the impact of recently enacted tax legislation, NETSCOUT s effective (GAAP) tax rate for fiscal year 2018 is expected to be in the range of percent to percent. The Company s fiscal year 2018 non-gaap effective tax is anticipated to be around 28 percent. Assuming completion of the Accelerated Share Repurchase for $300 million at a price of approximately $27.00 per share, the Company still expects fourth-quarter fiscal year 2018 shares outstanding (diluted) to be approximately 83.6 million shares, thereby reducing fiscal year 2018 shares outstanding (diluted) to approximately 89.3 million. Taking all of the aforementioned items into account, NETSCOUT expects that fiscal year 2018 s GAAP net income per share (diluted) to range from $0.53 to $0.84. NETSCOUT anticipates non-gaap net income per share (diluted) in the range of approximately $1.30 to $
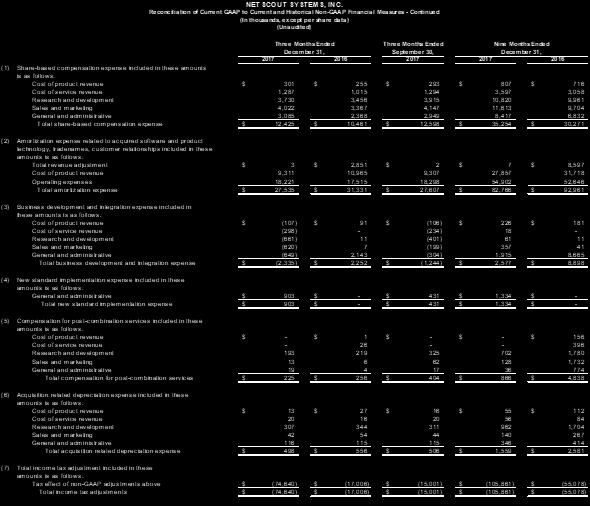
5 A reconciliation between GAAP and non-gaap revenue and net income per share (diluted) for NETSCOUT s guidance is included in the attached financial tables. Conference Call Instructions: NETSCOUT will host a conference call to discuss its third-quarter fiscal year 2018 financial results, its outlook for fiscal year 2018 and other matters today at 8:30 a.m. ET. This call will be webcast live through NETSCOUT s website at Alternatively, people can listen to the call by dialing (785) The conference call ID is NTCTQ318. A replay of the call will be available after 12:00 p.m. ET on January 30, 2018 for approximately one week. The number for the replay is (800) for U.S./Canada and (402) for international callers. Use of Non-GAAP Financial Information: To supplement the financial measures presented in NETSCOUT's press release in accordance with accounting principles generally accepted in the United States ("GAAP"), NETSCOUT also reports the following non-gaap measures: non-gaap total revenue, non-gaap product revenue, non-gaap service revenue, non-gaap income from operations, non-gaap operating margin, non-gaap earnings before interest and other expense, income taxes, depreciation and amortization (EBITDA) from operations, non-gaap EBITDA from operations margin, non-gaap net income, and non-gaap net income per share (diluted). Non-GAAP revenue (total, product and service) eliminates the GAAP effects of acquisitions by adding back revenue related to deferred revenue revaluation, as well as revenue impacted by the amortization of intangible assets. Non-GAAP income from operations includes the aforementioned revenue adjustments and also removes expenses related to the amortization of acquired intangible assets, stock-based compensation, and certain expenses relating to acquisitions including depreciation costs, compensation for post-combination services and business development and integration costs. Non-GAAP EBITDA from operations, which has been presented herein as a measure of NETSCOUT s performance, includes the aforementioned items related to non-gaap income from operations and also removes non-acquisition-related depreciation expense. Non-GAAP operating margin is calculated based on the non-gaap financial metrics discussed above. Non-GAAP net income includes the aforementioned items related to non-gaap income from operations, net of related income tax effects in addition to the provisional one-time impacts of the U.S. Tax Cuts and Jobs Act. Non-GAAP diluted net income per share also excludes these expenses as well as the related impact of all these adjustments on the provision for income taxes. Investors are encouraged to review the related GAAP financial measures and the reconciliation of these non-gaap financial measures to their most directly comparable GAAP financial measures included in the attached tables within this press release. These non-gaap measures are not in accordance with GAAP, should not be considered an alternative for measures prepared in accordance with GAAP (revenue, gross profit, operating profit, net income and diluted net income per share), and may have limitations because they do not reflect all of NETSCOUT s results of operations as determined in accordance with GAAP. These non-gaap measures should only be used to evaluate NETSCOUT s results of operations in conjunction with the corresponding GAAP measures. The presentation of non-gaap information is not meant to be considered superior to, in isolation from or as a substitute for results prepared in accordance with GAAP. NETSCOUT believes these non-gaap financial measures will enhance the reader s overall understanding of NETSCOUT s current financial performance and NETSCOUT's prospects for the future by providing a higher degree of transparency for certain financial measures and providing a level of disclosure that helps investors understand how the Company plans and measures its own business. NETSCOUT 5
6 believes that providing these non-gaap measures affords investors a view of NETSCOUT s operating results that may be more easily compared to peer companies and also enables investors to consider NETSCOUT s operating results on both a GAAP and non-gaap basis during and following the integration period of NETSCOUT s acquisitions. Presenting the GAAP measures on their own, without the supplemental non-gaap disclosures, might not be indicative of NETSCOUT s core operating results. Furthermore, NETSCOUT believes that the presentation of non-gaap measures when shown in conjunction with the corresponding GAAP measures provides useful information to management and investors regarding present and future business trends relating to its financial condition and results of operations. NETSCOUT management regularly uses supplemental non-gaap financial measures internally to understand, manage and evaluate its business and to make operating decisions. These non-gaap measures are among the primary factors that management uses in planning and forecasting. About NETSCOUT SYSTEMS, INC. NETSCOUT SYSTEMS, INC. (NASDAQ: NTCT) assures digital business services against disruptions in availability, performance, and security. Our market and technology leadership stems from combining our patented smart data technology with smart analytics. We provide real-time, pervasive visibility, and insights customers need to accelerate, and secure their digital transformation. Our approach transforms the way organizations plan, deliver, integrate, test, and deploy services and applications. Our ngenius service assurance solutions provide real-time, contextual analysis of service, network, and application performance. Arbor security solutions protect against DDoS attacks that threaten availability, and advanced threats that infiltrate networks to steal critical business assets. To learn more about improving service, network, and application performance in physical or virtual data centers, or in the cloud, and how NETSCOUT s performance and security solutions, powered by service intelligence can help you move forward with confidence, visit or on Twitter, Facebook, or LinkedIn. Safe Harbor Forward-looking statements in this release are made pursuant to the safe harbor provisions of Section 21E of the Securities Exchange Act of 1934 and other federal securities laws. Investors are cautioned that statements in this press release, which are not strictly historical statements, including without limitation, the statements related to fourth-quarter revenue challenges, fiscal year 2018 financial guidance and related performance trends for NETSCOUT, the Company s strong competitive position, initiatives that will help strengthen the Company s revenue performance, support continued gross margin gains, improve operating profitability and drive EPS expansion, and the timing and magnitude of the Company s Accelerated Stock Repurchase constitute forward-looking statements which involve risks and uncertainties. Actual results could differ materially from the forward-looking statements due to known and unknown risk, uncertainties, assumptions and other factors. Such factors include potential differences between NETSCOUT s preliminary results and the final results for the quarter ended December 31, 2017 as a result of the completion of financial reporting processes and review, slowdowns or downturns in economic conditions generally and in the market for advanced network, service assurance and cybersecurity solutions specifically; the volatile foreign exchange environment; the Company s relationships with strategic partners and resellers; dependence upon broad-based acceptance of the Company s network performance management solutions; the presence of competitors with greater financial resources than we have, and their strategic response to our products; our ability to retain key executives and employees; lower than expected demand for the Company s products and services; and the timing and magnitude of stock buyback activity based on market conditions, corporate considerations, debt agreements, and regulatory requirements. For a more detailed description of the risk factors associated with the Company, please refer to the Company s Annual Report on Form 10-K for the fiscal year ended March 31, 2017 and the Company s subsequent Quarterly Reports on Form 10-Q, which are on file with the Securities and Exchange Commission. NETSCOUT assumes no obligation to update any forward-looking information contained in this press release or with respect to the announcements described herein. 6
7 2018 NETSCOUT SYSTEMS, INC. All rights reserved. NETSCOUT and the NETSCOUT logo are registered trademarks or trademarks of NETSCOUT SYSTEMS, INC. and/or its subsidiaries and/or affiliates in the USA and/or other countries. 7

8 8

9 9

10 10

11 11

12 12
NetScout Systems Reports Financial Results for Second Quarter Fiscal Year 2017
 Contacts: Investors Media Andrew Kramer Donna Candelori Vice President of Investor Relations Senior Public Relations Manager 978-614-4279 408-571-5226 IR@netscout.com Donna.Candelori@netscout.com NetScout
Symantec Reports Third Quarter Fiscal Year 2018 Results
 Financial and Business Q3 Highlights Symantec Reports Third Quarter Fiscal Year 2018 Results Q3 GAAP revenue $1.209 billion, up 16% year-over-year; non-gaap revenue $1.234 billion, up 13% year-overyear
(650) (650) Symantec Reports Fiscal Third Quarter 2019 Results
 (650) Symantec Reports Fiscal Third Quarter 2019 Results") MEDIA CONTACT: INVESTOR CONTACT: Lauren Armstrong Cynthia Hiponia Symantec Corp. Symantec Corp. (650) 448-7352 (650) 527-8020 Lauren_Armstrong@symantec.com Cynthia_Hiponia@symantec.com Symantec Reports
MEDIA CONTACT: INVESTOR CONTACT: Lauren Armstrong Cynthia Hiponia Symantec Corp. Symantec Corp. (650) 448-7352 (650) 527-8020 Lauren_Armstrong@symantec.com Cynthia_Hiponia@symantec.com Symantec Reports
FOR IMMEDIATE RELEASE
 FOR IMMEDIATE RELEASE For media inquiries, contact: Eric Armstrong, Citrix Systems, Inc. (954) 267-2977 or eric.armstrong@citrix.com For investor inquiries, contact: Eduardo Fleites, Citrix Systems, Inc.
FOR IMMEDIATE RELEASE
 FOR IMMEDIATE RELEASE For media inquiries, contact: Eric Armstrong, Citrix Systems, Inc. (954) 267-2977 or eric.armstrong@citrix.com For investor inquiries, contact: Eduardo Fleites, Citrix Systems, Inc.
HealthEquity Reports Third Quarter Ended October 31, 2014 Financial Results
 FOR IMMEDIATE RELEASE HealthEquity Reports Third Quarter Ended October 31, Financial Results Highlights of the Third Quarter Include: Revenue of 21.9 million, an increase of 43% compared to Q3 FY14. Net
NICE Reports Strong Finish to 2017 with 31% Growth in Annual Revenue and 14% Growth in Annual EPS
 NICE Reports Strong Finish to 2017 with 31% Growth in Annual Revenue and 14% Growth in Annual EPS Cloud Revenue Exceeds $100 Million in the Fourth Quarter 2017 Record Operating Cash Flow of Nearly $400
UNITED STATES SECURITIES AND EXCHANGE COMMISSION WASHINGTON, D.C FORM 8-K
 UNITED STATES SECURITIES AND EXCHANGE COMMISSION WASHINGTON, D.C. 20549 FORM 8-K CURRENT REPORT Pursuant to Section 13 or 15(d) of the Securities Exchange Act of 1934 Date of Report (Date of Earliest Event
NICE Reports Strong Growth in Revenue and Profitability for the Third Quarter 2018 and Increases Full-Year 2018 Revenue and EPS Guidance
 NICE Reports Strong Growth in Revenue and Profitability for the Third Quarter 2018 and Increases Full-Year 2018 Revenue and EPS Guidance Strong Double Digit Growth in Operating Income and Earnings Per
COGNIZANT REPORTS SECOND QUARTER 2018 RESULTS
 Exhibit 99.1 Glenpointe Centre West 500 Frank W. Burr Blvd. Teaneck, NJ 07666 COGNIZANT REPORTS SECOND QUARTER 2018 RESULTS Second quarter 2018 revenue of $4.01 billion, up 9.2% over 2017 Declares quarterly
Zscaler Reports Third Quarter Fiscal 2018 Financial Results
 Zscaler Reports Third Quarter Fiscal 2018 Financial Results Revenue grows 49% year over year to $49.2 million Calculated billings grow 73% year over year to $54.7 million Deferred revenue grows 61% year
Symantec Reports Fourth Quarter and Fiscal Year 2017 Results
 Logo Financial Highlights Symantec Reports Fourth Quarter and Fiscal Year 2017 Results Q4 GAAP revenue $1.115 billion, up 28% year over year; non-gaap revenue $1.176 billion, up 35% year over year Fiscal
FOR IMMEDIATE RELEASE
 FOR IMMEDIATE RELEASE For media inquiries, contact: Eric Armstrong, Citrix Systems, Inc. (954) 267-2977 or eric.armstrong@citrix.com For investor inquiries, contact: Eduardo Fleites, Citrix Systems, Inc.
FOR IMMEDIATE RELEASE
 FOR IMMEDIATE RELEASE For media inquiries, contact: Eric Armstrong, Citrix Systems, Inc. (954) 267-2977 or eric.armstrong@citrix.com For investor inquiries, contact: Eduardo Fleites, Citrix Systems, Inc.
Intermolecular Announces Third Quarter 2017 Financial Results
 Intermolecular Announces Third Quarter 2017 Financial Results SAN JOSE, Calif., November 2, 2017 -- Intermolecular, Inc. (NASDAQ: IMI) today reported results for its Third Quarter ended September 30, 2017.
Science Applications International Corporation (SAIC) Third Quarter Fiscal Year 2018 Earnings Call. December 7, 2017
 Third Quarter Fiscal Year 2018 Earnings Call. December 7, 2017") Science Applications International Corporation (SAIC) Third Quarter Fiscal Year 2018 Earnings Call December 7, 2017 Supplemental Financial Information Conference Call Information Date: December 7, 2017
Science Applications International Corporation (SAIC) Third Quarter Fiscal Year 2018 Earnings Call December 7, 2017 Supplemental Financial Information Conference Call Information Date: December 7, 2017
AKAMAI REPORTS FIRST QUARTER 2014 FINANCIAL RESULTS
 FOR IMMEDIATE RELEASE Contacts: Jeff Young Tom Barth Media Relations Investor Relations Akamai Technologies Akamai Technologies 617-444-3913 617-274-7130 jyoung@akamai.com tbarth@akamai.com AKAMAI REPORTS
NETSCOUT SYSTEMS, INC. Third-Quarter Fiscal Year 2018 Financial Results Conference Call Management s Prepared Remarks
 NETSCOUT SYSTEMS, INC. Third-Quarter Fiscal Year 2018 Financial Results Conference Call Management s Prepared Remarks January 30, 2018 1 A. Kramer: Introduction Thank you [operator] and good morning everyone.
Teradata Reports 2018 Third Quarter Results
 INVESTOR CONTACT Gregg Swearingen 937-242-4600 office gregg.swearingen@teradata.com MEDIA CONTACT Jennifer Donahue 858-485-3029 office jennifer.donahue@teradata.com Teradata Reports 2018 Third Quarter
Accelerating the Shift to Digital
 Fourth Quarter 2017 Earnings Supplement Accelerating the Shift to Digital February 7, 2018 2017 Cognizant Forward Looking Statements and Non-GAAP Financial Measures This earnings supplement includes statements
HealthEquity Reports Fourth Quarter and Fiscal Year Ended January 31, 2018 Financial Results
 HealthEquity Reports Fourth Quarter and Fiscal Year Ended January 31, 2018 Financial Results Highlights of the fiscal year include: Revenue of $229.5 million, an increase of 29% compared to FY17. Net income
Fourth Quarter Fiscal 2017 Highlights
 Amdocs Limited Reports Fourth Quarter Fiscal Results Record Quarterly Revenue of $980M Expects Fiscal 2018 GAAP Diluted EPS Growth of 3.0%-9.0% and Non- GAAP Diluted EPS Growth of 4.0%-8.0% YoY Additional
OneSpan Reports Results for Third Quarter and First Nine Months of 2018; Reiterates Full Year Guidance
 OneSpan Reports Results for Third Quarter and First Nine Months of 2018; Reiterates Full Year Guidance Q3 Total revenue up 3% to $52.5 million Q3 Adjusted EBITDA of $1.0 million 1 Q3 GAAP loss per share
Reports Strong Net New Bookings and Recurring Revenue for Fiscal Year 2017
 Press Release Nuance Announces Fourth Quarter and Fiscal Year 2017 Results Reports Strong Net New Bookings and Recurring Revenue for Fiscal Year 2017 BURLINGTON, Mass., (NASDAQ: NUAN) today announced financial
HealthEquity Reports Second Quarter Ended July 31, 2014 Financial Results. Highlights of the Second Quarter Include:
 HealthEquity Reports Second Quarter Ended July 31, Financial Results Highlights of the Second Quarter Include: Revenue of 20.9 million, an increase of 39% compared to Q2 FY14. Net income of 3.0 million,
Zintel Public Relations Commtouch Reports Fourth Quarter and Full Year 2012 Results
 PRESSS RELEASE Company Contact: Israel Investor Relations Contact: Brian Briggs, Chief Financial Officer Iris Lubitch Commtouch EffectiveIR +1.703.760.3444 +972.54.252.8007 brian.briggs@commtouch.com Iris@EffectiveIR.co.il
QUALYS ANNOUNCES THIRD QUARTER 2017 FINANCIAL RESULTS
 QUALYS ANNOUNCES THIRD QUARTER 2017 FINANCIAL RESULTS Revenue Growth of 17% Year-Over-Year Normalized Revenue Growth of 19% Year-Over-Year GAAP EPS: $0.21; Non-GAAP EPS: $0.31 Raises 2017 Revenue Guidance
Citrix Announces Leadership Transition to Accelerate Cloud Transformation, Enhance Profitability and Return Capital to Shareholders
 FOR IMMEDIATE RELEASE Citrix Announces Leadership Transition to Accelerate Cloud Transformation, Enhance Profitability and Return Capital to Shareholders David J. Henshall Appointed President and Chief
News Release Issued: May 03, :00 AM ET
 News Release Issued: May 03, 2011 06:00 AM ET Cognizant Reports First Quarter 2011 Results First quarter revenue up 4.6% sequentially and 43% year-over-year Guidance for Full Year 2011 revenue growth increased
Applied Industrial Technologies Reports Fiscal 2018 Fourth Quarter and Year-End Results
 1 Financial Release For Immediate Release Applied Industrial Technologies Reports Fiscal 2018 Fourth Quarter and Year-End Results Record Full-Year Sales of $3.1 Billion, up 18.5% Fourth Quarter Sales of
ACI Worldwide, Inc. Reports Financial Results for the Quarter and Full Year Ended December 31, 2017
 News Release ACI Worldwide, Inc. Reports Financial Results for the Quarter and Full Year Ended December 31, 2017 HIGHLIGHTS Revenue up 3% for the full year 2017* Cash flow from operations up 46% in 2017
Web.com Reports Fourth Quarter and Full Year 2016 Financial Results
 Web.com Group, Inc. 12808 Gran Bay Parkway West Jacksonville, FL 32258 T: (904) 680-6600 F: (904) 880-0350 NASDAQ: WEB Web.com Reports Fourth Quarter and Full Year 2016 Financial Results Solid progress
FOR IMMEDIATE RELEASE
 FOR IMMEDIATE RELEASE For media inquiries, contact: Eric Armstrong, Citrix Systems, Inc. (954) 267-2977 or eric.armstrong@citrix.com For investor inquiries, contact: Eduardo Fleites, Citrix Systems, Inc.
Polycom Announces Financial Results for Fourth Quarter and Fiscal Year 2015
 Investor Contact: Press Contact: Laura Graves Polycom, Inc. 1.408.586.4271 laura.graves@polycom.com Michael Rose Polycom, Inc. 1.408.586.3839 michael.rose@polycom.com Polycom Announces Financial Results
Applied Industrial Technologies Reports Fiscal 2019 First Quarter Results
 Financial Release For Immediate Release Applied Industrial Technologies Reports Fiscal 2019 First Quarter Results Net Sales of $864.5M, Up 27.0%; 6.9% Organic Sales Growth Net Income of $48.9M, Up 45.1%;
HealthEquity Reports Third Quarter Ended October 31, 2017 Financial Results
 HealthEquity Reports Third Quarter Ended 2017 Financial Results Highlights of the third quarter include: Revenue of $56.8 million, an increase of 31% compared to Q3 FY17. Net income of $10.5 million, an
ACI Worldwide, Inc. Reports Financial Results for the Quarter Ended June 30, 2018
 News Release ACI Worldwide, Inc. Reports Financial Results for the Quarter Ended June 30, 2018 HIGHLIGHTS Cash flows from operating activities of $26 million, up from $13 million in Q2 2017 Repurchased
Helping Clients Win with Digital
 First Quarter 2018 Earnings Supplement Helping Clients Win with Digital May 7, 2018 2017 Cognizant Forward Looking Statements and Non-GAAP Financial Measures This earnings supplement includes statements
Web.com Reports Fourth Quarter and Full Year 2017 Financial Results
 Web.com Reports Fourth Quarter and Full Year 2017 Financial Results Strong financial and operating performance in the fourth quarter Significant progress on strategic priorities for the year Generated
Align Technology Announces Third Quarter 2014 Results
 October 23, 2014 Align Technology Announces Third Quarter 2014 Results SAN JOSE, CA -- (Marketwired) -- 10/23/14 -- Align Technology, Inc. (NASDAQ: ALGN) Revenues of $189.9 million, up 15.4% year-over-year
Wix Reports First Quarter 2018 Results
 Wix Reports First Quarter 2018 Results Strong start to the year with all key metrics once again exceeding high end of expectations o o o Q1 revenue of $137.8 million, up 49% y/y; under ASC 605, Q1 revenue
Radware Announces Fourth Quarter and Full Year 2017 Earnings
 Radware Announces Fourth Quarter and Full Year 2017 Earnings Fourth Quarter 2017 Results and Financial Highlights Revenues of $58 Million, up 13% from the fourth quarter of 2016 Non-GAAP EPS of $0.09;
Facebook Reports Third Quarter 2017 Results
 Facebook Reports Third Quarter 2017 Results MENLO PARK, Calif. November 1, 2017 Facebook, Inc. (NASDAQ: FB) today reported financial results for the quarter ended 2017. "Our community continues to grow
Wind River Reports Fourth Quarter and Fiscal Year 2009 Results
 CONTACT: Ian Halifax Anne Marie McCauley Wind River Wind River Chief Financial Officer Vice President, Investor Relations +1.510.749.2155 +1.510.749.2551 ian.halifax@windriver.com annemarie.mccauley@windriver.com
Itron, Inc. Comparison of Key 2015 Financial Metrics to Preliminary Results Announced February 17, Total operating expenses 486, ,839
 Itron, Inc. Comparison of Key 2015 Financial Metrics to Preliminary Results Announced February 17, 2016 (Unaudited, in thousands, except per share data) (announced Feb. 17, 2016) Preliminary FY 2015 Final
 For Immediate Release Contact: Ken Bond Deborah Hellinger Oracle Investor Relations Oracle Corporate Communications 1.650.607.0349 1.212.508.7935 ken.bond@oracle.com deborah.hellinger@oracle.com Q4 FY18
8x8, Inc. Announces Third Quarter Fiscal 2013 Results
 For Immediate Release 8x8, Inc. Announces Third Quarter Fiscal 2013 Results Record Revenue of $27.3 Million; Average Number of Subscribed Services per New Business Customer Increases Quarter-over-Quarter
ACI Worldwide, Inc. Reports Financial Results for the Quarter Ended March 31, 2018
 News Release ACI Worldwide, Inc. Reports Financial Results for the Quarter Ended March 31, 2018 HIGHLIGHTS New bookings up 142% over Q1 2017 60-month backlog increased to $4.4 billion ACI On Demand segment
Commtouch Reports Second Quarter 2013 Results
 PRESS RELEASE Company Contact: Israel Investor Relations Contact: Brian Briggs, Chief Financial Officer Iris Lubitch Commtouch EffectiveIR +1.703.760.3444 +972.54.252.8007 brian.briggs@commtouch.com Iris@EffectiveIR.co.il
Splunk Inc. Announces Fiscal Second Quarter 2013 Financial Results
 P R E S S R E L E A S E For Immediate Release Splunk Inc. Announces Fiscal Second Quarter 2013 Financial Results Company Increases Full Year Revenue Outlook SAN FRANCISCO August 30, 2012 Splunk Inc. (NASDAQ:SPLK),
Science Applications International Corporation (SAIC) FY16 Second Quarter Earnings Call September 1, 2015
 FY16 Second Quarter Earnings Call September 1, 2015") Science Applications International Corporation (SAIC) FY16 Second Quarter Earnings Call September 1, 2015 Supplemental Financial Information SAIC. All rights reserved. Conference Call Information Date:
Science Applications International Corporation (SAIC) FY16 Second Quarter Earnings Call September 1, 2015 Supplemental Financial Information SAIC. All rights reserved. Conference Call Information Date:
Ooma Reports Fourth Quarter and Fiscal Year 2018 Financial Results
 NEWS RELEASE Ooma Reports Fourth Quarter and Fiscal Year 2018 Financial Results 3/6/2018 SUNNYVALE, Calif., March 06, 2018 (GLOBE NEWSWIRE) -- Ooma, Inc. (NYSE:OOMA), a smart communications platform for
Cisco Reports Third Quarter Earnings
 Cisco Reports Third Quarter Earnings Q3 Revenue: $12.5 billion Increase of 4% year over year Recurring revenue was 32% of total revenue, up 2 points year over year Q3 Earnings per Share: $0.56 GAAP; $0.66
Progress Reports 2018 Third Quarter Results, Announces 11% Dividend Increase
 Progress Reports Third Quarter Results, Announces 11% Dividend Increase September 27, Solid Revenue and EPS Performance, Generates Strong Cash Flows BEDFORD, Mass.--(BUSINESS WIRE)--Sep. 27, -- Progress
Contact: Ken Bond Deborah Hellinger Oracle Investor Relations Oracle Corporate Communications
 For Immediate Release Contact: Ken Bond Deborah Hellinger Oracle Investor Relations Oracle Corporate Communications 1.650.607.0349 1.212.508.7935 ken.bond@oracle.com deborah.hellinger@oracle.com Q3 FY18
Adesto Technologies Reports Fourth Quarter and Full Year 2017 Financial Results
 Adesto Technologies Reports Fourth Quarter and Full Year 2017 Financial Results Fourth Quarter Revenue Grows 31.0% Year-Over-Year with Second Consecutive Quarter of Positive Cash Flow from Operations;
Fourth Quarter and Full Year 2017 Operational and Other Financial Highlights
 Facebook Reports Fourth Quarter and Full Year 2017 Results MENLO PARK, Calif. January 2018 Facebook, Inc. (NASDAQ: FB) today reported financial results for the quarter and full year ended 2017. "2017 was
Palo Alto Networks Reports Fiscal Second Quarter 2018 Financial Results
 Palo Alto Networks Reports Fiscal Second Quarter 2018 Financial Results February 26, 2018 - Fiscal second quarter revenue grows 28 percent year over year to $542.4 million; product revenue grows 20 percent
NetApp Reports Fourth Quarter and Fiscal Year 2018 Results
 May 23, 2018 NetApp Reports Fourth Quarter and Fiscal Year 2018 Results Net Revenues of $1.64 Billion for the Fourth Quarter and $5.91 Billion for Fiscal Year 2018 Net revenue for fiscal year 2018 increased
EPAM Reports Results for Third Quarter 2018
 EPAM Reports Results for Third Quarter November 1, Third quarter revenues of $468.2 million, up 24.0% year-over-year GAAP Diluted EPS of $1.15 for the third quarter Non-GAAP Diluted EPS of $1.17 for the
NICE Reports 6% Increase in Non-GAAP Revenue and 21% Increase in Non- GAAP EPS for the Second Quarter 2015
 NICE Reports 6% Increase in Non-GAAP Revenue and 21% Increase in Non- GAAP EPS for the Second Quarter 2015 The Company Increases Guidance for Full-Year 2015 Earnings Per Share Ra anana, Israel, July 30,
Sabre reports fourth quarter and full-year 2017 results
 Sabre reports fourth quarter and full-year 2017 results Highlights: Revenue increased 6.3% in the quarter and 6.7% for the full year 2017 Net income attributable to common stockholders increased 234.2%
Progress Reports Better Than Expected 2018 Fiscal First Quarter Results
 Progress Reports Better Than Expected Fiscal First Quarter Results March 28, Raises Guidance for FY18 Earnings Per Share and Operating Margin BEDFORD, Mass.--(BUSINESS WIRE)--Mar. 28, -- Progress (NASDAQ:
ITRON, INC. CONSOLIDATED STATEMENTS OF OPERATIONS
 , INC. CONSOLIDATED STATEMENTS OF OPERATIONS (Unaudited, in thousands, except per share data) Revenues $ 504,063 $ 615,555 $ 1,654,843 $ 1,791,647 Cost of revenues 332,266 438,559 1,103,196 1,237,722 Gross
P R E S S R E L E A S E
 Renee Brotherton Kevin Kessel Corporate Communications Investor Relations (408) 576-7189 (408) 576-7985 renee.brotherton@flex.com kevin.kessel@flex.com FLEX REPORTS FIRST QUARTER FISCAL 2018 RESULTS Quarterly
j2 Global Reports Fourth Quarter and Year End 2018 Results and Provides 2019 Outlook
 j2 Global Reports Fourth Quarter and Year End 2018 Results and Provides 2019 Outlook February 12, 2019 Achieves Record Revenues Provides Fiscal 2019 Financial Estimates Announces Thirtieth Consecutive
Jacobs Engineering Group Inc. (Exact name of Registrant as specified in its charter)
") UNITED STATES SECURITIES AND EXCHANGE COMMISSION Washington, DC 20549 Form 8-K Current Report Pursuant to Section 13 or 15(d) of The Securities Exchange Act of 1934 Date of Report (date of earliest event
UNITED STATES SECURITIES AND EXCHANGE COMMISSION Washington, DC 20549 Form 8-K Current Report Pursuant to Section 13 or 15(d) of The Securities Exchange Act of 1934 Date of Report (date of earliest event
SPS Commerce Reports Third Quarter 2017 Financial Results
 October 26, 2017 SPS Commerce Reports Third Quarter 2017 Financial Results Company delivers 15% recurring revenue growth over the third quarter of 2016 MINNEAPOLIS, Oct. 26, 2017 (GLOBE NEWSWIRE) -- SPS
Analog Devices Reports Fourth Quarter and Fiscal Year 2017 Results
 November 21, Analog Devices Reports Fourth Quarter and Fiscal Year Results NORWOOD, Mass.--(BUSINESS WIRE)-- Analog Devices, Inc. (Nasdaq: ADI), today announced financial results for its fourth quarter
Paylocity Announces Fourth Quarter and Fiscal Year 2018 Financial Results
 Paylocity Announces Fourth Quarter and Fiscal Year 2018 Financial Results August 9, 2018 Q4 2018 Total Revenue of $96.6 million, up 27% year-over-year FY 2018 Total Revenue of $377.5 million, up 26% year-over-year
WESTERN DIGITAL ANNOUNCES FINANCIAL RESULTS FOR FIRST QUARTER FISCAL YEAR 2019
 FOR IMMEDIATE RELEASE: WESTERN DIGITAL ANNOUNCES FINANCIAL RESULTS FOR FIRST QUARTER FISCAL YEAR 2019 SAN JOSE, Calif. OCT. 25, 2018 Western Digital Corp. (NASDAQ: WDC) today reported revenue of $5.0 billion
P R E S S R E L E A S E
 FLEX REPORTS FOURTH QUARTER AND FISCAL 2018 RESULTS Quarterly revenue of $6.4 billion, increased 9% year-over-year Fiscal 2018 revenue of $25.4 billion, increased 7% year-over-year Quarterly cash flow
Telkonet, Inc. Reports Continued Strong Results for its 3 rd Quarter Ended September 30, 2011
 MEDIA CONTACTS: Telkonet Investor Relations 414.721.7988 ir@telkonet.com FOR IMMEDIATE RELEASE Telkonet, Inc. Reports Continued Strong Results for its 3 rd Quarter Ended 2011 Teleconference and Webcast
Sonus Networks Reports 2014 First Quarter Results
 April 24, 2014 Sonus Networks Reports 2014 First Quarter Results Company Exceeds all Guidance Metrics for First Quarter 2014 WESTFORD, Mass.--(BUSINESS WIRE)-- Sonus Networks, Inc. (Nasdaq: SONS), a global
Teradata Reports 2018 First Quarter Results
 NEWS RELEASE Teradata Reports 2018 First Quarter Results Better than expected first quarter revenue of $506 million Bookings mix shift to subscription moving faster than expected Recurring revenue increased
Itron Announces Second Quarter 2015 Financial Results
 August 5, 2015 Itron Announces Second Quarter 2015 Financial Results LIBERTY LAKE, Wash.--(BUSINESS WIRE)-- Itron, Inc. (NASDAQ:ITRI) announced today financial results for its second quarter and six months
Tableau Reports Second Quarter 2018 Financial Results
 Tableau Reports Second Quarter 2018 Financial Results SEATTLE, Wash. - August 2, 2018 - Tableau Software, Inc. (NYSE: DATA) today reported results for its second quarter ended June 30, 2018. "We saw strong
Cirrus Logic Reports Q4 Revenue of $327.9 Million and $1.5 Billion for FY17
 FINANCIAL NEWS Investor Contact: Thurman K. Case Chief Financial Officer Cirrus Logic, Inc. (512) 851-4125 Investor.Relations@cirrus.com Cirrus Logic Reports Q4 Revenue of $327.9 Million and $1.5 Billion
Analog Devices Reports Second Quarter Fiscal Year 2014 Results
 May 20, Analog Devices Reports Second Quarter Fiscal Year Results Board declares $0.37 per share cash dividend NORWOOD, Mass.--(BUSINESS WIRE)-- Analog Devices, Inc. (NASDAQ: ADI), a global leader in high-performance
PTC Announces Fourth Quarter and Fiscal Year 2018 Results
 PTC Announces Fourth Quarter and Fiscal Year 2018 Results Bookings Near End of Guidance; Strong Recurring Software Revenue Growth NEEDHAM, MA, October 24, 2018 - PTC (NASDAQ: PTC) today reported financial
ACXIOM ANNOUNCES THIRD QUARTER RESULTS. Connectivity Revenue Up 45% Year-Over-Year Segment Margin Exceeds 10%
 ACXIOM ANNOUNCES THIRD QUARTER RESULTS Connectivity Revenue Up 45% Year-Over-Year Segment Margin Exceeds 10% Repurchases 729,000 Shares in the Quarter CONWAY, Ark., February 06, 2018 Acxiom (Nasdaq: ACXM),
Facebook Reports Fourth Quarter and Full Year 2015 Results
 Facebook Reports Fourth Quarter and Full Year 2015 Results MENLO PARK, Calif. January 27, 2016 Facebook, Inc. (NASDAQ: FB) today reported financial results for the fourth quarter and full year ended 2015.
CalAmp Reports Fiscal 2018 Third Quarter Financial Results
 NEWS RELEASE CalAmp Reports Fiscal 2018 Third Quarter Financial Results 12/21/2017 Record Q3 revenue of $93.7 million, up 12% year over year GAAP net income of $0.33 per diluted share; Non-GAAP net income
P R E S S R E L E A S E
 FLEX REPORTS THIRD QUARTER FISCAL 2018 RESULTS Quarterly revenue of $6.75 billion, increased 10% year-over-year GAAP diluted EPS of $0.22, Non-GAAP diluted EPS of $0.31 Quarterly cash flow from operations
PTC Announces Third Quarter Fiscal Year 2018 Results
 PTC Announces Third Quarter Fiscal Year 2018 Results Revenue at High End of Guidance and EPS Above Guidance NEEDHAM, MA, July 18, 2018 - PTC (NASDAQ: PTC) today reported financial results for its fiscal
Abiomed Announces Q3 FY 2018 Record Revenue of $154 Million, Up 34% Over Prior Year
 February 1, 2018 Abiomed Announces Q3 FY 2018 Record Revenue of $154 Million, Up 34% Over Prior Year U.S. Patient Utilization Grew 33%, Year Over Year DANVERS, Mass., Feb. 01, 2018 (GLOBE NEWSWIRE) --
Verisk Reports Third-Quarter 2018 Financial Results
 Verisk Reports Third-Quarter 2018 Financial Results Revenue grew 9.0% to $599 million; organic constant currency revenue growth was 4.7%. Normalizing for the revenue associated with exceptional storm activity
SECOND QUARTER 2018 BUSINESS REVIEW. Jonathan W. Painter, President & CEO Michael J. McKenney, Executive Vice President & CFO
 SECOND QUARTER 2018 BUSINESS REVIEW Jonathan W. Painter, President & CEO Michael J. McKenney, Executive Vice President & CFO Forward-Looking Statements The following constitutes a Safe Harbor statement
CORELOGIC REPORTS FOURTH QUARTER AND FULL-YEAR 2016 FINANCIAL RESULTS
 NEWS FOR IMMEDIATE RELEASE CORELOGIC REPORTS FOURTH QUARTER AND FULL-YEAR 2016 FINANCIAL RESULTS Full-Year 2016 Revenues, Operating Income, Operating Cash Flow, and Free Cash Flow Up Double-Digits From
Beacon Roofing Supply Reports Fourth Quarter and Fiscal Year 2017 Results
 November 20, 2017 Beacon Roofing Supply Reports Fourth Quarter and Fiscal Year 2017 Results Record fourth quarter net sales of $1.3 billion (9.8% growth year-over-year) Fourth quarter EPS of $0.73 ($0.93
Contact: Ken Bond Deborah Hellinger Oracle Investor Relations Oracle Corporate Communications
 For Immediate Release Contact: Ken Bond Deborah Hellinger Oracle Investor Relations Oracle Corporate Communications 1.650.607.0349 1.212.508.7935 ken.bond@oracle.com deborah.hellinger@oracle.com ORACLE
Verisk Reports First-Quarter 2018 Financial Results
 Verisk Reports First-Quarter 2018 Financial Results Revenue grew 15.6% to $581 million; organic constant currency revenue growth was 7.0%. Net income was $133 million; EBITDA, a non-gaap measure, was $269
Sonus Networks Reports 2012 Third Quarter Results
 November 7, 2012 Sonus Networks Reports 2012 Third Quarter Results SBC Revenue Exceeds Expectations for Third Straight Quarter of Fiscal 2012 WESTFORD, Mass.--(BUSINESS WIRE)-- Sonus Networks, Inc. (Nasdaq:
Micron Technology, Inc., Reports Results for the First Quarter of Fiscal 2019
 Micron Technology, Inc., Reports Results for the First Quarter of Fiscal 2019 December 18, Strong execution drives record revenue in mobile, automotive, and industrial markets BOISE, Idaho, Dec. 18, (GLOBE
CISCO SYSTEMS, INC. (Exact name of registrant as specified in its charter)
") UNITED STATES SECURITIES AND EXCHANGE COMMISSION Washington, D.C. 20549 FORM 8-K CURRENT REPORT Pursuant to Section 13 OR 15(d) of The Securities Exchange Act of 1934 Date of Report (Date of earliest event
UNITED STATES SECURITIES AND EXCHANGE COMMISSION Washington, D.C. 20549 FORM 8-K CURRENT REPORT Pursuant to Section 13 OR 15(d) of The Securities Exchange Act of 1934 Date of Report (Date of earliest event
Ooma Reports Second Quarter Fiscal Year 2018 Financial Results
 NEWS RELEASE Ooma Reports Second Quarter Fiscal Year 2018 Financial Results 8/24/2017 PALO ALTO, Calif., Aug. 24, 2017 (GLOBE NEWSWIRE) -- Ooma, Inc. (NYSE:OOMA), a smart communications platform for small
Zscaler Reports First Quarter Fiscal 2019 Financial Results
 Zscaler Reports First Quarter Fiscal 2019 Financial Results Revenue grows 59% year-over-year to $63.3 million Calculated billings grow 56% year-over-year to $64.6 million Deferred revenue grows 68% year-over-year
Teradata Reports 2014 Third Quarter Results
 NEWS RELEASE Teradata Reports 2014 Third Quarter Results Revenue of $667 million, up 1 percent in constant currency (1) GAAP EPS $0.60, non-gaap EPS $0.71 (2) Year-to-date Cash from Operations increased
Contact: Ken Bond Deborah Hellinger Oracle Investor Relations Oracle Corporate Communications
 For Immediate Release Contact: Ken Bond Deborah Hellinger Oracle Investor Relations Oracle Corporate Communications 1.650.607.0349 1.212.508.7935 ken.bond@oracle.com deborah.hellinger@oracle.com ORACLE
P R E S S R E L E A S E
 Renee Brotherton Kevin Kessel Corporate Communications Investor Relations (408) 576-7189 (408) 576-7985 renee.brotherton@flex.com kevin.kessel@flex.com FLEX REPORTS FOURTH QUARTER AND FISCAL 2017 RESULTS