FINANCIAL PHYSICS. Copyright , Crestmont Research (
|
|
|
- Mabel Higgins
- 6 years ago
- Views:
Transcription

1 FINANCIAL PHYSICS Financial Physics represents the interconnected relationships among key elements in the economy and the financial markets that determine the stock market s overall direction. Copyright , Crestmont Research (
2 PREFACE This presentation introduces Crestmont s core "Financial Physics" model. The model represents a framework to understand the relationship of the economy ('the source of wealth') and the equity markets ('the measure of equity wealth'). This presentation, although abbreviated and presented in slides, is intended to be self-explanatory. A more descriptive presentation and discussion of the material is included in chapters 7 and 8 of Unexpected Returns: Understanding Secular Stock Market Cycles and chapters 3 7 of Probable Outcomes: Secular Stock Market Insights, both books by Ed Easterling. For more information about implications of Financial Physics for the next decade, please contact Info@CrestmontResearch.com. In summary, the key factors include Real GDP, Inflation, Nominal GDP, Earnings Per Share (EPS), and P/E Ratio. Since Real GDP has been relatively constant over extended periods of time and all other factors are driven by inflation, a primary driver of the stock market is the inflation rate as it trends toward or away from price stability. Given the current state of low inflation and the likelihood of it either rising (inflation) or declining (deflation), P/E ratios are expected to decline for a number of years. As P/E ratios decline and EPS grows, the result will be another relatively non-directional secular bear market.
3 INTRODUCTION Conventional Wisdom And Long-Term Studies Often Ignore The Fundamental Factors That Drive Intermediate Stock Market Cycles The S&P 500 Stock Index Started 1982 At 123; The 20-Year Treasury Bond Yielded 14.6% By 1999, The S&P 500 Stock Index Reached 1,469; The 20-Year Treasury Bond Yielded 6.7% The Secular Bull Market Was Driven By Fundamentals And Ultimately Accentuated By A Stock Market Bubble
4 INTRODUCTION (cont.) The Preceding 16 Years ( ) Were Also Driven By Fundamental Factors Stocks Were Virtually Flat; Bond Yields Soared And Total Returns Were Disappointing P/E Ratios Declined During The Secular Bear Market Starting In 1966 As Inflation Rose Starting In 1982, The Inflation Cycle Reversed Thereby Starting A Secular Bull Market During The Late 1990 s, An Infection Of Emotions And Other Factors Created A Stock Market Bubble
5 INTRODUCTION (cont.) Real GDP Rose Equally During Both Secular Periods, Averaging Near 3% Annually Earnings Per Share Rose By Over 300% During The Secular Bear Market ( ), Similar To The Gains In The Secular Bull Market ( ) Regardless, The Stock Market Was Virtually Flat During The Secular Bear, Yet The Market Soared Dramatically During The Secular Bull Stock Market Returns Were Affected By The P/E Cycle, Which Is Driven By Inflation Rate Trends
6 INTRODUCTION (cont.) The Factors Real GDP, Nominal GDP, Inflation, EPS, and P/E Ratios Share An Interrelated Relationship That Crestmont Research Calls Financial Physics This Presentation Will Explore The Consistency, Predictability, And Dependence For Each Of These Factors And Among The Factors For Those Seeking To Understand The Potential Returns Available In The Stock Market In 5, 10, or 20 Years, The Financial Physics Model Provides The Framework To Determine Your Own Perspective
7 INTRODUCTION (cont.) To Determine The Level Of The Stock Market In The Future, Estimates For Two Variables Are Needed: (1) Price/Earnings Ratio ( P/E ), The Price Of The Market Index Divided By Earnings Per Share, And (2) Earnings Per Share ( EPS ) The Future Level Of The S&P 500 Stock Index Can Be Forecast By Multiplying The Estimated Future P/E Ratio For The S&P 500 Stock Index And The Estimated Future EPS For The S&P 500 When We Estimate The Future Stock Market Level, We Can Assess The Overall Investment Environment For Stocks Over 5, 10, or 20 Years

8 Stocks And Bonds Are Financial Assets That Often Are Not Correlated Month-To-Month, But Do Perform Similarly Over Longer Periods During The 1960s & 1970s, Both Had Poor Returns; Yet During The 1980s & 1990s, Both Had Solid, Above- Average Returns
9 FINANCIAL PHYSICS Regarding The Model Diagram On Slide 10: A Factor Is Considered Given When It Tends To Be Consistent Over Long Periods Of Time And Is Fundamentally Based Upon Underlying Factors; Prior To The 2000s, GDP-R Was Considered To Be Given, But It Is Now An Uncertainty Due To Significantly Lower Growth In the Past Decade A Factor Is Considered Driven When It Is Directly Affected By Other Given Or Assumed Factors A Factor Is Considered An Uncertainty When It Is Generally Unpredictable And Its Future Is Uncertain
10 FINANCIAL PHYSICS
11 REAL GDP Real Gross Domestic Product ( GDP ) Represents The Absolute Level Of The Economy Before Inflation; Essentially The Revenues Of All Companies Real GDP Growth Has Been Relatively Consistent Over The Past Century Annual Real GDP Averaged 3.3% Most Decades Between 3.0%-4.5% The 70s, 80s, & 90s: 3.2%, 3.0%, 3.2%
 will restore the trend average, yet recent policy changes shift the focus to the upcoming decade and whether it")
12 Note: Real GDP for the decade of the 2000s was below 2%. Last decade s GDP shift is generally unexplained. It is unlikely that this decade (the 2010s) will restore the trend average, yet recent policy changes shift the focus to the upcoming decade and whether it will restore the historical trend line growth rate.
13 SALES & EARNINGS Nominal GDP Is Real GDP Plus Inflation ( Real Means Without Inflation ; Essentially, Nominal GDP Is The Reported Revenues Of All Companies Nominal GDP Growth Has Averaged 6.1% Earnings As Represented By Earnings Per Share ( EPS ) Has Grown By 4.7% Over The Past Century Strong Relationship: Correlation r = 0.95 Relationship Is Fundamentally Based; Earnings Emanate From Revenues
 should return the average toward historical")
14 Note: EPS and profit margins continue at business cycle highs and are distorting the EPS growth rate for the decade of the 2010s; the backside of the business cycle (upcoming) should return the average toward historical levels
15 PREDICTING EPS Since The Relationship Between GDP And EPS Is Strong And Fundamentally-Based, Estimates Of Future GDP Can Be Used To Determine Expected EPS Despite The Uncertainty About Future GDP Growth, Future Growth Of Near 3% (A Midrange Value) Can Be Assumed To Estimate Future EPS Based Upon The Historical Average A Regression Formula Can Be Developed To Use The Value Of GDP To Predict EPS Historical Real GDP Growth Scenarios And Estimated Inflation Can Be Used To Predict Average Future Nominal GDP The Estimated Future Nominal GDP Predicts A Gravity Line Around Which EPS Will Cycle Above And Below

16 Note: The EPS Prediction is the gravity line for historically consistent EPS; Actual EPS will cycle above and below the gravity line depending upon aggressive accounting, recessions, recoveries, etc.
17 RECAP Economic Growth (GDP-Real), Excluding Inflation, Has Been Relatively Consistent Over Long Periods Of Time EPS Is Relatively Consistent With Economic Growth Including Inflation (GDP-Nominal) Extending Economic Growth (GDP-Nominal) Provides A Basis To Predict EPS
18 P/E RATIO Contrary To Conventional Wisdom, P/E Ratios Are Not Driven By Interest Rates: P/E Ratios Are Driven By The Inflation Rate Conventional Wisdom Implicitly Assumes Positive Inflation; Deflation Produces Low Interest Rates AND Low P/E Ratios Due To Expected Declines In Future Nominal Earnings (EPS) The Next Slide Reflects The Inconsistent Relationship Between Interest Rates And P/E Ratios Over The Past Century In Addition, The Slide Reflects The Inconsistency Between Inflation And Interest Rates Over The Past Century
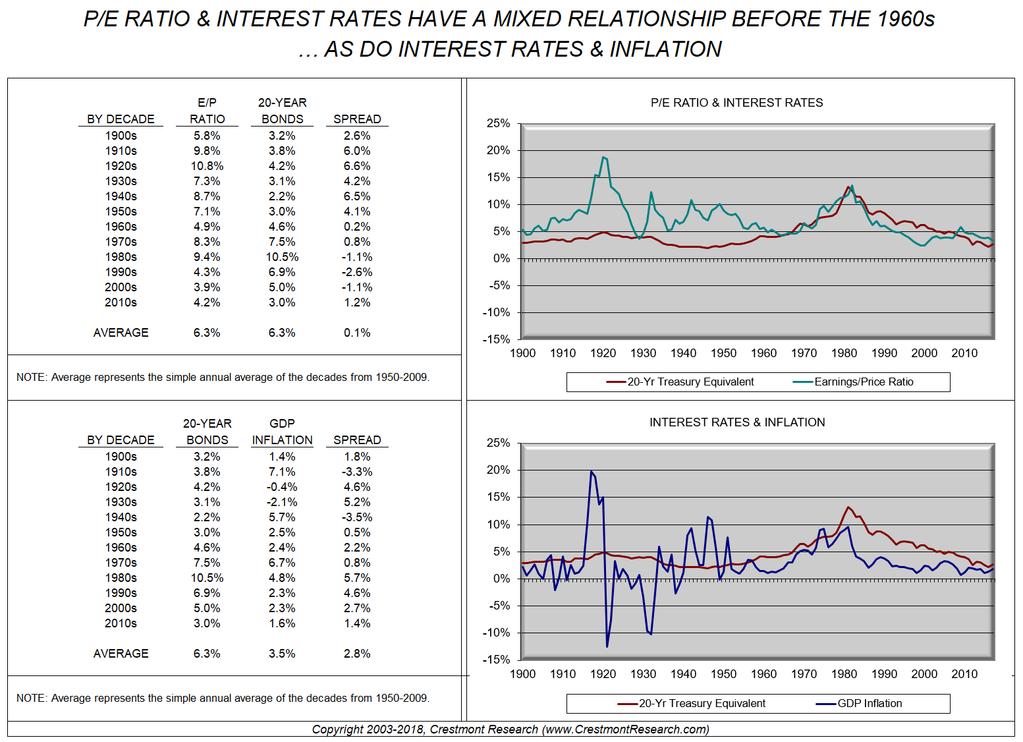
19
20 P/E RATIO (cont.) A Trend Toward Price Stability Increases P/E Ratios Rising Inflation Decreases P/E s; Deflation Decreases P/E s Crestmont Designates The Impact Of Inflation On P/E s As The Y Curve Effect Slide 21 Reflects A Sideways Y Created By The Impact Of Rising Inflation Or Deflation On The P/E Ratio; A Fork Occurs As Inflation Departs From Price Stability The Chart Indicates Future Trends In The Inflation Rate Are Likely To Drive P/E Ratios Lower
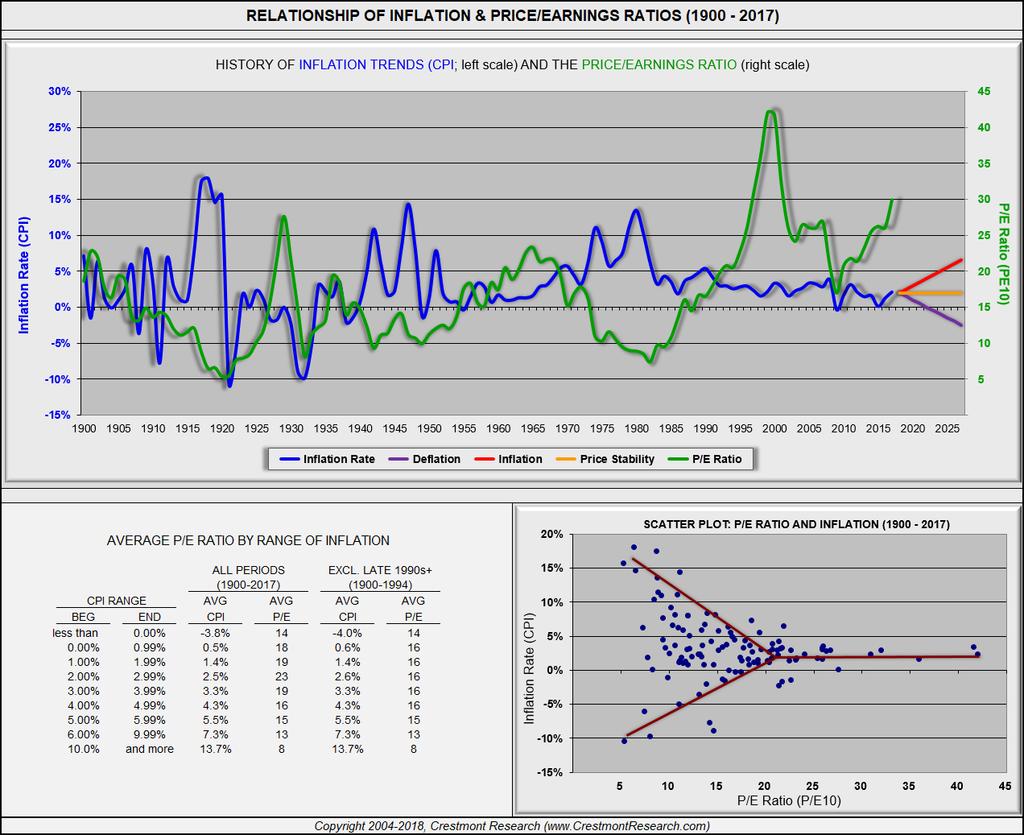
21
22 RECAP This Methodology Of Predicting EPS Trends Is Fundamentally-Based And Confirmed Historically P/E Ratios Trend Based Upon Trends In The Inflation Rate Toward Or Away From Price Stability Based Upon The Prediction Of EPS Into The Intermediate Future, An Investor Need Only A Perspective On Inflation To Determine The Return Environment Available In The Stock Market Over The Next 5, 10, Or 20 Years From Current Low Levels Of Inflation, Increases Or Decreases In The Inflation Rate Are A Key Risk And Could Be Detrimental To P/E Ratios If Either Occurs

23 IMPLICATIONS The Economy And Earnings Can Be Expected To Grow Over The Long-Term, Yet Cycle Over Shorter Periods Relatively Low Inflation, If Sustained, Should Result In The Market P/E Ratio Near 20 The Direction And Level Of Inflation Is A Significant Driver Of Stock Market Returns Over The Longer-Term Eight Secular Periods Driven By The Inflation And P/E Cycle Have Occurred Over The Past Century; Each Secular Cycle Has One Or More Shorter-Term Cyclical Cycles Investment Strategies Are Significantly Different For Secular Bull And Secular Bear Markets
24 CONTACT INFORMATION The Information In This Presentation Is Explained In Greater Detail In Both Books By Ed Easterling: Unexpected Returns: Understanding Secular Stock Market Cycles and Probable Outcomes: Secular Stock Market Insights Group Presentations, Individual Consultations, Or Coordinated Academic Research Regarding This Presentation And Other Financial Market Perspectives Are Available. Please Contact
Crestmont Research. Yet, before anyone knew it, the end of the cycle was in the rear-view mirror rather than beyond the distant horizon.
 Crestmont Research Back To The Horizon: EPS Cycles Again By Ed Easterling December 31, 2008 (update) All Rights Reserved Earnings had been increasing at double-digit growth rates for five consecutive years
Crestmont Research. Yet, is 17% a reasonable expectation? What were the sources for that level of return and will those drivers continue to deliver?
 Crestmont Research Where Did It Come From: Is the Trend Your Friend? By Ed Easterling October 4, 2017 Copyright 2017, Crestmont Research (www.crestmontresearch.com) Since March of 2009, the stock market
Understanding Secular Stock Market Cycles
 Understanding Secular Stock Market Cycles October 7, 2016 by Ed Easterling of Crestmont Research The word secular originates from a series of Latin words that mean an extended period of time or an era.
Crestmont Research. In April 2007, while forecasters predicted at least two more years of increases, the first Beyond The Horizon article stated:
 Crestmont Research Beyond The Horizon: REDUX 2011 By Ed Easterling May 17, 2011 Copyright 2011, Crestmont Research (www.crestmontresearch.com) In April 2007, while forecasters predicted at least two more
Crestmont Research. The P/E Report: Quarterly Review Of The Price/Earnings Ratio By Ed Easterling October 5, 2016 Update All Rights Reserved
 Crestmont Research The P/E Report: Quarterly Review Of The Price/Earnings Ratio By Ed Easterling October 5, 2016 Update All Rights Reserved AS OF: SEP 30, 2016 REPORTED ADJUSTED 1 CRESTMONT 2 P Closing
Crestmont Research. The P/E Report: Quarterly Review Of The Price/Earnings Ratio By Ed Easterling July 7, 2017 Update All Rights Reserved
 Crestmont Research The P/E Report: Quarterly Review Of The Price/Earnings Ratio By Ed Easterling July 7, 2017 Update All Rights Reserved AS OF: JUN 30, 2017 REPORTED ADJUSTED 1 CRESTMONT 2 P Closing Price
Crestmont Research. The P/E Report: Annual Review Of The Price/Earnings Ratio By Ed Easterling Jan 5, 2018 Update All Rights Reserved
 Crestmont Research The P/E Report: Annual Review Of The Price/Earnings Ratio By Ed Easterling Jan 5, 2018 Update All Rights Reserved NOTE: The P/E Report is transitioning to an annual review of P/E, earnings,
Crestmont Research. The Truth About P/Es By Ed Easterling August 15, 2006 (w/addendum December 1, 2006) All Rights Reserved
 All Rights Reserved") Crestmont Research The Truth About P/Es By Ed Easterling August 15, 2006 (w/addendum December 1, 2006) All Rights Reserved History shows that the change in the market P/E ratio over decade-long periods
Crestmont Research The Truth About P/Es By Ed Easterling August 15, 2006 (w/addendum December 1, 2006) All Rights Reserved History shows that the change in the market P/E ratio over decade-long periods
Crestmont Research. The P/E Report: Quarterly Review Of The Price/Earnings Ratio By Ed Easterling October 2, 2012 Update All Rights Reserved
 Crestmont Research The P/E Report: Quarterly Review Of The Price/Earnings Ratio By Ed Easterling October 2, 2012 Update All Rights Reserved AS OF: SEP 30, 2012 REPORTED ADJUSTED 1 CRESTMONT 2 P Closing
Crestmont Research. Volatility In Perspective By Ed Easterling January 5, 2018 (updated) All Rights Reserved
 All Rights Reserved") Crestmont Research Volatility In Perspective By Ed Easterling January 5, 2018 (updated) All Rights Reserved Is the current level of volatility normal? If so, it s a new normal! The purpose of this presentation
Crestmont Research Volatility In Perspective By Ed Easterling January 5, 2018 (updated) All Rights Reserved Is the current level of volatility normal? If so, it s a new normal! The purpose of this presentation
Crestmont Research. Rowing vs. The Roller Coaster By Ed Easterling January 26, 2007 All Rights Reserved
 Crestmont Research Rowing vs. The Roller Coaster By Ed Easterling January 26, 2007 All Rights Reserved Why are so many of the most knowledgeable institutions and individuals shifting away from investment
Crestmont Research. The stock market is finally fairly valued for conditions of low inflation and low interest rates.
 Crestmont Research Nightmare On Wall Street: This Secular Bear Has Only Just Begun By Ed Easterling July 1, 2012 (Updated January 31, 2017) All Rights Reserved Secular bull markets are great parties. Investors
Crestmont Research. RISK IS NOT A KNOB By Ed Easterling. The first step toward making money is not losing it
 Crestmont Research The following is a short excerpt from chapter 5 of Just One Thing: Twelve of the World's Best Investors Reveal the One Strategy You Can't Overlook (John Wiley & Sons: 2005; John Mauldin,
Crestmont Research. Reconciliation Principle: Returns and Forecasts Must Add Up
 Crestmont Research Reconciliation Principle: Returns and Forecasts Must Add Up By Ed Easterling July 7, 2017 Copyright 2017, Crestmont Research (www.crestmontresearch.com) Hope springs eternal until it
Crestmont Research. Why does the stock market appear so overvalued to many analysts when, in reality, it may be near fairly valued?
 Crestmont Research The Big Shift: A Secular Realignment of Profits and P/E By Ed Easterling July 14, 2018 Copyright 2018, Crestmont Research (www.crestmontresearch.com) Why are reported profits for the
Standard Risk Measures
 Standard Risk Measures June 2017 This paper provides the Standard Risk Measure for Schroder Investment Management Australia Limited s ( Schroders ) key funds. The Standard Risk Measure is based on industry
Diversified Stock Income Plan
 Joseph E. Buffa, Equity Sector Analyst Michael A. Colón, Equity Sector Analyst Diversified Stock Income Plan 2017 Concept Review The Diversified Stock Income Plan (DSIP List) focuses on companies that
Crestmont Research. Once a woodcutter strained to saw down a tree. A young man who was watching asked What are you doing?
 Crestmont Research Half & Half: Why Rowing Works By Ed Easterling January 4, 2018 (updated) Copyright 2013-2018, Crestmont Research (www.crestmontresearch.com) So you re in line at Starbucks. The guy in
Investment Evolution. Convergence Across The Hedge Fund & Private Equity Industries. Copyright 2005, Crestmont Research (
 Investment Evolution Convergence Across The Hedge Fund & Private Equity Industries Copyright 2005, Crestmont Research (www.crestmontresearch.com) 1 TOPICS Explore Similarities And Differences Between Private
This week s Outside the Box is an excerpt from this latest book.
 One of my favorite analysts is Ed Easterling of Crestmont Research. We used to get together a whole lot more when he lived in Dallas, but he has since moved to the wilds of Oregon. Ed s first book, Unexpected
EPIC INVESTMENT MANAGEMENT
 EPIC INVESTMENT MANAGEMENT Epic Charts Epic Investment Management data source: Bloomberg, unless noted otherwise Copyright 2010 Epic Investment Management All rights reserved. SP 500 1927 + 1000 100 10
Market Valuation, Inflation and Treasury Yields: Clues from the Past
 Market Valuation, Inflation and Treasury Yields: Clues from the Past March 7, 2018 by Jill Mislinski of Advisor Perspectives Note: The charts in this commentary have been updated to include the latest
Market Valuation, Inflation and Treasury Yields: Clues from the Past
 Market Valuation, Inflation and Treasury Yields: Clues from the Past July 3, 2018 by Jill Mislinski of Advisor Perspectives Note: The charts in this commentary have been updated to include the latest monthly
Retirement Distribution Planning: Strategies for Lifelong Income
 Retirement Distribution Planning: Strategies for Lifelong Income Jim C. Otar CFP, CMT, M.Eng. Outline Market History and Retirement Planning Time Value of Fluctuations Mathematics of Loss Two Warning Signals
Are Bonds Going to Outperform Stocks Over the Long Run? Not Likely.
 July 2009 Page 1 Are Bonds Going to Outperform Stocks Over the Long Run? Not Likely. Given the poor performance of stocks over the past year and the past decade, there has been ample discussion about the
Playing The Bull Market s Final Inning(s)
") Playing The Bull Market s Final Inning(s) Douglas Ramsey, CFA, CMT Mid-September 2013 FOR PROFESSIONAL USE ONLY. FURTHER DISTRIBUTION OF THE INFORMATION CONTAINED HEREIN IS PROHIBITED WITHOUT PRIOR PERMISSION.
Playing The Bull Market s Final Inning(s) Douglas Ramsey, CFA, CMT Mid-September 2013 FOR PROFESSIONAL USE ONLY. FURTHER DISTRIBUTION OF THE INFORMATION CONTAINED HEREIN IS PROHIBITED WITHOUT PRIOR PERMISSION.
Saybrook Capital Investment Review
 Saybrook Capital Investment Review December 31, 2003 At the start of a new year, it is constructive to discuss potential equity returns going forward for the near term (2004) and the longer term (2005-2009).
Crestmont Research. Investment forecasts have much more serious implications than daily commutes even if it doesn t seem that way during rush hour!
 Crestmont Research Serious Implications: Forecast Skew Over the Next Decade By Ed Easterling April 6, 2018 Copyright 2018, Crestmont Research (www.crestmontresearch.com) Forecasts are coveted. We rely
Aggregate Demand and Aggregate Supply. Chapter Objectives. AD AS Model
 10 Demand and Supply 10-1 Chapter Objectives Demand and the Factors That Cause it to Change. Supply and the Factors That Cause it to Change. How AD and AS Determine an Economy s and the Level of Real GDP.
9. ISLM model. Introduction to Economic Fluctuations CHAPTER 9. slide 0
 9. ISLM model slide 0 In this lecture, you will learn an introduction to business cycle and aggregate demand the IS curve, and its relation to the Keynesian cross the loanable funds model the LM curve,
Macro Value Investing What to Expect in Sideways Markets April 13, 2016
 Macro Value Investing What to Expect in Sideways Markets April 13, 2016 BEN GRAHAM CENTER 2016 VALUE INVESTING CONFERENCE Presented by: Kim Shannon, CFA, MBA Economic Growth Only Explains 17% of Stock
Letter from Linda. December 31, Valuations Have Declined Below Historical Averages
 December 31, The last four months of were the most eventful for the U.S. stock market in years. After peaking on 9/20, the S&P 500 Index declined just shy of 20% by 12/24. This was the largest drop since
S&P 500 Price: 1971 to Present
 1971 1973 1975 1977 1979 1981 1983 1985 1987 1989 1991 1993 1995 1997 1999 21 23 25 27 29 211 213 215 217 S&P 5 Returns: A Historical Perspective Part 2 The S&P 5 has been up for 8 years in a row, and
The Harbour Group of RBC Dominion Securities
 RBC Dominion Securities The Harbour Group of RBC Dominion Securities May 2017 Conference Call Featuring RBC Capital Markets Chief Canadian Strategist Matt Barasch 10 May, 2017 This is a slow-growing, but
Market Insight: Consolidations are Unpleasant but Healthy
 May 8, 2018 Market Insight: Consolidations are Unpleasant but Healthy January seems like a long time ago when the markets were humming along in a slow steady ascent, setting a record of one of the longest
This time isn t different
 UNCERTAINTY = OPPORTUNITY This time isn t different Richard Bernstein, Chief Executive and Chief Investment Officer Richard Bernstein Advisors Richard Bernstein Advisors LLC (RBA) is an independent investment
The Labor Force Participation Puzzle
 The Labor Force Participation Puzzle May 23, 2013 by David Kelly of J.P. Morgan Funds Slow growth and mediocre job creation have been common themes used to describe the U.S. economy in recent years, as
Money & Capital Markets Exam 1: Chapters 1, 2, 3, 4, 5 & 6. Name. Multiple Choice: 4 points each
 Money & Capital Markets Exam 1: Chapters 1, 2, 3, 4, 5 & 6 Name Multiple Choice: 4 points each MULTIPLE CHOICE. Choose the one alternative that best completes the statement or answers the question. 1)
Manager. Microsoft (MSFT) Identifying Stocks Poised to Outperform
 Identifying Stocks Poised to Outperform") 3 Manager Using ZRS and the Zacks Valuation Model to identify factors impacting equity valuations in 3 minutes or less Tim Nyland, CFA Managing Director Microsoft (MSFT) Identifying Stocks Poised to Outperform
3 Manager Using ZRS and the Zacks Valuation Model to identify factors impacting equity valuations in 3 minutes or less Tim Nyland, CFA Managing Director Microsoft (MSFT) Identifying Stocks Poised to Outperform
A Detailed Analysis of U.S. Bear Markets
 March 2016 CONTENTS 1. Abstract 1. Definition and characteristics of bear markets 2. Length of bear markets 4. Bear market severity 5. Recovery periods 6. Bear markets and the economy 8. Bear markets and
By most standards, the price of equities in the United States has
 Are Stocks Overvalued? Richard W. Kopcke Vice President and Economist, Federal Reserve Bank of Boston. The author thanks Kathryn Cosgrove for valuable research assistance. By most standards, the price
The Great Bull Market in Bonds Is Over What Comes Next? Introduction
 The Great Bull Market in Bonds Is Over What Comes Next? Introduction November 2010 BY: JOHN L. SICA President, Meridian Capital Partners, Inc. In 2008, for the first time in 50 years, the 3.4% yield on
Foreign Trade and the Exchange Rate
 Foreign Trade and the Exchange Rate Chapter 12 slide 0 Outline Foreign trade and aggregate demand The exchange rate The determinants of net exports A A model of the real exchange rates The IS curve and
2013 Outlook. We help manage your family s financial life. Officer. Ashley M. McCarthy. Financial Consultant. 4 th Quarter 2012 Review
 2013 Outlook 4 th Quarter 2012 Review We help manage your family s financial life. Christopher W. Davis, CFP, CIMA Managing Director Investments Officer Harriet R. White, CRPC Financial Consultant Karen
Equity Returns: Sources and Drivers for the First Decade of the 21 st Century
 March 21, 2007 By William W. Priest, CEO Equity Returns: Sources and Drivers for the First Decade of the 21 st Century We formed Epoch Investment Partners, Inc. in 2004 to take advantage of the changing
Mm Mm Good But Very Expensive
 Mm Mm Good But Very Expensive No U.S. bond trader under the age of 56 has traded in a prolonged bear market. That striking fact is a function of steadily falling bond yields since 1981. Over this era,
International Equities are En Vogue, and Could Stay That Way
 International Equities are En Vogue, and Could Stay That Way November 9, 2017 by Bryce Coward of Knowledge Leaders Capital Over the last decade US stocks have outperformed the global equity benchmark by
Market Expects 6% CAIGR (Cyclically Adjusted Implied Growth Rate) Dr. G. Kevin Spellman, CFA Coach Investing.com Date: 2/21/17
 Dr. G. Kevin Spellman, CFA Coach Investing.com Date: 2/21/17") 1/97 2/98 3/99 4/ /1 6/2 7/3 8/4 9/ /6 11/7 12/8 1/ 2/11 3/12 4/13 /14 6/1 7/16 9/16 3/1 9/13 3/12 9/ 3/9 9/7 3/6 9/4 3/3 9/1 3/3 9/98 3/97 9/9 3/94 9/92 3/91 9/89 Market Expects 6% CAIGR (Cyclically Adjusted
1/97 2/98 3/99 4/ /1 6/2 7/3 8/4 9/ /6 11/7 12/8 1/ 2/11 3/12 4/13 /14 6/1 7/16 9/16 3/1 9/13 3/12 9/ 3/9 9/7 3/6 9/4 3/3 9/1 3/3 9/98 3/97 9/9 3/94 9/92 3/91 9/89 Market Expects 6% CAIGR (Cyclically Adjusted
Challenges For the Future of Chinese Economic Growth. Jane Haltmaier* Board of Governors of the Federal Reserve System. August 2011.
 Challenges For the Future of Chinese Economic Growth Jane Haltmaier* Board of Governors of the Federal Reserve System August 2011 Preliminary *Senior Advisor in the Division of International Finance. Mailing
Report No st July Andrew Smithers.
 Smithers & Co. Ltd. St. Dunstan's Hill, London ECR HL Telephone: 7 Facsimile: 7 Web Site: www.smithers.co.uk E-mail: info@smithers.co.uk Was the Yield Curve a th Century Aberration? Report No. 7 1 st July
Macroeconomics, 7e (Blanchard) Chapter 2: A Tour of the Book. 2.1 Aggregate Output.
 Chapter 2: A Tour of the Book. 2.1 Aggregate Output.") Macroeconomics, 7e (Blanchard) Chapter 2: A Tour of the Book 2.1 Aggregate Output. 1) Fill in the blank for the following: GDP is the value of all produced in a given period. A) final and intermediate
Macroeconomics, 7e (Blanchard) Chapter 2: A Tour of the Book 2.1 Aggregate Output. 1) Fill in the blank for the following: GDP is the value of all produced in a given period. A) final and intermediate
MULTIPLE CHOICE. Choose the one alternative that best completes the statement or answers the question.
 Econ 105 Study Questions #2: The AD-AS model and Money and Banking From the Kennedy Text: Chapter 5 pp 95-96 Media Ex. #3, #5, #7 Chapter 6 pp 118 N1, N2, N3 Chapter 8 pp140-41 Media Ex. #2, #3, #7, #11,
Journal Of Financial And Strategic Decisions Volume 7 Number 1 Spring 1994 INSTITUTIONAL INVESTMENT ACROSS MARKET ANOMALIES. Thomas M.
 Journal Of Financial And Strategic Decisions Volume 7 Number 1 Spring 1994 INSTITUTIONAL INVESTMENT ACROSS MARKET ANOMALIES Thomas M. Krueger * Abstract If a small firm effect exists, one would expect
and 10 year spread compressed further by an additional 34 basis points. The following table shows the yield curve at the end of the fourth quarter.
 4th Third quarter real GDP grew at a 3.2% annualized rate, thereby falling in line with VAAM s forecast and above the consensus outlook. This represented the strongest quarterly growth rate since the first
Jeremy Siegel on Dow 15,000 By Robert Huebscher December 18, 2012
 Jeremy Siegel on Dow 15,000 By Robert Huebscher December 18, 2012 Jeremy Siegel is the Russell E. Palmer Professor of Finance at the Wharton School of the University of Pennsylvania and a Senior Investment
Chapter 15: Fiscal Policy Section 2
 Chapter 15: Fiscal Policy Section 2 Objectives 1. Compare and Contrast classical economics and Keynesian economics. 2. Explain the basic principles of supplyside economics. 3. Describe the role that fiscal
Recessions and balanced portfolio returns
 Recessions and balanced portfolio returns Vanguard investment perspectives April 2012 When a recession seems imminent, investors may be tempted to take a defensive approach by shifting away from stocks.
Summary of portfolio positions and scenario insights MLC Inflation Plus portfolios September quarter 2015
 Summary of portfolio positions and scenario insights MLC Inflation Plus portfolios The September quarter share market volatility reflected conflicting economic data about when the US Federal Reserve (Fed)
CHAPTER 13 EFFICIENT CAPITAL MARKETS AND BEHAVIORAL CHALLENGES
 CHAPTER 13 EFFICIENT CAPITAL MARKETS AND BEHAVIORAL CHALLENGES Answers to Concept Questions 1. To create value, firms should accept financing proposals with positive net present values. Firms can create
Aggregate Demand and Aggregate Supply
 Aggregate Demand and Aggregate Supply Chapter 19 Copyright 2001 by Harcourt, Inc. All rights reserved. Requests for permission to make copies of any part of the work should be mailed to: Permissions Department,
2. See Text Figure 25.2 and discussion in the text.
 Chapter 25: Using the Economic Fluctuations Model Solutions to End-of-Chapter Problems 1. In Figure 25-1, the AD line shifts from AD 0 to AD 1 by the amount of the increase in G; C increases as real GDP
Improving on Buy and Hold: Asset Allocation using Economic Indicators By Georg Vrba, P.E. August 24, 2010
 Improving on Buy and Hold: Asset Allocation using Economic Indicators By Georg Vrba, P.E. August 24, 2010 Advisor Perspectives welcomes guest contributions. The views presented here do not necessarily
Chapter 9 Inflation Modified by: Yun Wang Fall 2017, Florida International University
 PRINCIPLES OF MACROECONOMICS Chapter 9 Inflation Modified by: Yun Wang Fall 2017, Florida International University FIGURE 9.1 This bill was worth 100 billion Zimbabwean dollars when issued in 2008. There
It doesn't make sense to hire smart people and then tell them what to do. We hire smart people so they can tell us what to do.
 A United Approach to Credit Risk-Adjusted Risk Management: IFRS9, CECL, and CVA Donald R. van Deventer, Suresh Sankaran, and Chee Hian Tan 1 October 9, 2017 It doesn't make sense to hire smart people and
Exam Number. Section
 Exam Number Section MACROECONOMICS IN THE GLOBAL ECONOMY Core Course Professor Antonio Fatás Final Exam February 24, 2011 9:00-12:00 Instructions: (PLEASE READ) SUGGESTED ANSWERS Space to answer the questions
Market Insight: A Sea Change is Underway
 February 26, 2016 Market Insight: A Sea Change is Underway The price action of the financial markets since the start of the year has been nothing short of chaotic, and many would classify it as the beginning
C U L L E N C A P I T A L M A N A G E M E N T. James P. Cullen Chairman & CEO. Mid-Year Comments High Dividend Strategy -- Revisited -- July 1, 2013
 S C H A F E R C U L L E N C A P I T A L M A N A G E M E N T Mid-Year Comments High Dividend Strategy -- Revisited -- July 1, 2013 James P. Cullen Chairman & CEO Recently market commentators have questioned
Chapter 10. Chapter 10 Topics. What is Risk? The big picture. Introduction to Risk, Return, and the Opportunity Cost of Capital
 1 Chapter 10 Introduction to Risk, Return, and the Opportunity Cost of Capital Chapter 10 Topics Risk: The Big Picture Rates of Return Risk Premiums Expected Return Stand Alone Risk Portfolio Return and
Perspectives FEB Value Underperformance in the Current Market Cycle
 Perspectives FEB 2018 Underperformance in the Current Market Cycle With the value premium seemingly in decline, value investors have had a lot to complain about over the past ten years. Growth stocks continue
Chapter 16: FISCAL POLICY
 Chapter 16: FISCAL POLICY FISCAL POLICY AND ITS EFFECT ON AGGREGATE DEMAND & AGGREGATE SUPPLY What is GOVERNMENT BUDGET? The government budget is an annual statement of the revenues, the outlays, and surplus
Saving, wealth and consumption
 By Melissa Davey of the Bank s Structural Economic Analysis Division. The UK household saving ratio has recently fallen to its lowest level since 19. A key influence has been the large increase in the
Spending Review Overview
 rket Foundation Spending Review 2013 Page 1 Spending Review 2013 Overview On 26 June George Osborne will deliver his second Spending Review as Chancellor, outlining departmental spending allocations for
The Myth of Asset Allocation or Would you rather beat the market or make money?
 The Myth of Asset Allocation or Would you rather beat the market or make money? John O. Low Institutional Investor Counsel American Asset Management Group, Inc. 50 West Montgomery Avenue Suite 110 Rockville,
1st INVESTMENT MANAGEMENT UPDATE. Investment Outlook Cautious optimism follows extraordinary year
 INVESTMENT MANAGEMENT UPDATE A QUARTERLY NEWSLETTER FROM BREMER ASSET MANAGEMENT 1st 2018 Investment Outlook Cautious optimism follows extraordinary year Beyond Stocks and Bonds How alternative assets
Some Selected Evidence Suggesting that the US Stock Market is Overvalued
 Some Selected Evidence Suggesting that the US Stock Market is Overvalued Campbell and Shiller (1997) have constructed data since 1872 on January stock market prices (P t ) and total annual corporate earnings
The Long-Term Investing Myth
 The Long-Term Investing Myth January 3, 2017 by Lance Roberts of Real Investment Advice During my morning routine of caffeine supported information injections, I ran across several articles that just contained
CLIENT CENTRIC INVESTING: UTILIZING TACTICAL MANAGERS TO IMPROVE RISK/RETURN June 2014
 CLIENT CENTRIC INVESTING: UTILIZING TACTICAL MANAGERS TO IMPROVE RISK/RETURN June 2014 Characteristics of Client Portfolios DAVID GATTI Chief Investment Officer The most common method for building multi
15 th. edition Gwartney Stroup Sobel Macpherson. First page. edition Gwartney Stroup Sobel Macpherson
 Alternative Views of Fiscal Policy An Overview GWARTNEY STROUP SOBEL MACPHERSON Fiscal Policy, Incentives, and Secondary Effects Full Length Text Part: 3 Macro Only Text Part: 3 Chapter: 12 Chapter: 12
Reconciling FOMC Forecasts and Forward Guidance. Mickey D. Levy Blenheim Capital Management
 Reconciling FOMC Forecasts and Forward Guidance Mickey D. Levy Blenheim Capital Management Prepared for Shadow Open Market Committee September 20, 2013 Reconciling FOMC Forecasts and Forward Guidance Mickey
Ruminations on Market Timing with the PE10
 Jan-26 Jan-29 Jan-32 Jan-35 Jan-38 Jan-41 Jan-44 Jan-47 Jan-50 Jan-53 Jan-56 Jan-59 Jan-62 Jan-65 Jan-68 Jan-71 Jan-74 Jan-77 Jan-80 Jan-83 Jan-86 Jan-89 Jan-92 Jan-95 Jan-98 Jan-01 Jan-04 Jan-07 Jan-10
J. STERN & CO. The Value of Long Term Investing. Monthly Commentary
 Monthly Commentary 2016 has been an eventful year with solid economic performance in the US and in Europe, resilient markets and significant and unexpected political changes. It has so far delivered solid
Dynamic Change, Economic Fluctuations, and the AD-AS Model
 Dynamic Change, Economic Fluctuations, and the AD-AS Model Full Length Text Part: Macro Only Text Part: 3 Chapter: 10 3 Chapter: 10 To Accompany Economics: Private and Public Choice 13th ed. James Gwartney,
Revisiting T. Rowe Price s Asset Allocation Glide-Path Strategy
 T. Rowe Price Revisiting T. Rowe Price s Asset Allocation Glide-Path Strategy Retirement Insights i ntroduction Given 2008 s severe stock market losses, many investors approaching or already in retirement
OVERTIME: Unit 5 Price Index Problems
 OVERTIME: Unit 5 Price Index Problems Name: Base year = 2000 Market basket value = $15,000; Round all numbers to 2 decimals. Answers must be in the proper format ($, % or #). Year Market Basket Value Nominal
Insights. Tech s dirty little secret: it s a cyclical sector. Underestimating Tech s cyclicality. November 2017
 The Leaders In Pactive Management Tech s dirty little secret: it s a cyclical sector Richard Bernstein, Chief Executive and Chief Investment Officer Richard Bernstein Advisors Richard Bernstein Advisors
DRAM Weekly Price History
 1 9 17 25 33 41 49 57 65 73 81 89 97 105 113 121 129 137 145 153 161 169 177 185 193 201 209 217 225 233 www.provisdom.com Last update: 4/3/09 DRAM Supply Chain Test Case Story A Vice President (the VP)
1. Actual estimation may be more complex because of the use of statistical methods.
 Learning Objectives: Understand inflation Use terminology related to inflation Choose a base year Calculate constant dollars Choose a deflator MODULE 7 Inflation We use the term inflation to indicate the
Four Key Drivers for Stocks in 2018
 LEADERSHIP SERIES JANUARY 2018 Four Key Drivers for Stocks in 2018 Earnings, liquidity, Fed policy, and China may be the biggest market movers in the new year Jurrien Timmer l Director of Global Macro
Insights. Year Ahead: 2019 Part I: High Anxiety?
 Insights December 2018 The Leaders In Pactive Management Year Ahead: 2019 Part I: High Anxiety? Richard Bernstein, Chief Executive and Chief Investment Officer Richard Bernstein Advisors Richard Bernstein
Keynes Law and Say s Law in the AD/AS Model
 Keynes Law and Say s Law in the AD/AS Model By: OpenStaxCollege The AD/AS model can be used to illustrate both Say s law that supply creates its own demand and Keynes law that demand creates its own supply.
Chapter Six. Real Interest Rates. Copy right by Thorn bunthan
 Chapter Six Real Interest Rates What Are Real Interest Rates? Investors care about how much they can purchase with the dollars they earn, not merely the quantity of dollars When investments do not keep
Lecture 22. Aggregate demand and aggregate supply
 Lecture 22 Aggregate demand and aggregate supply By the end of this lecture, you should understand: three key facts about short-run economic fluctuations how the economy in the short run differs from the
WHAT DRIVES MARKET RETURNS
 INVESTMENT PRINCIPLES INFORMATION SHEET FOR INVESTORS WHAT DRIVES MARKET RETURNS Produced by CFA Montréal IMPORTANT NOTICE The term financial advisor is used here in a general and generic way to refer
Bank & Financial Institution Modeling: Certification Quiz Questions Module 3 Bank Valuation
 Bank & Financial Institution Modeling: Certification Quiz Questions Module 3 Bank Valuation 1. You are valuing a regional, U.S.-based bank. The set of comparable public companies, the screening criteria,
The Unseen. Great Expectations 01/13/2017. "Never ever lose sight of long term relationships" Paul Krake - View from the Peak
 The Unseen Great Expectations 01/13/2017 "Never ever lose sight of long term relationships" Paul Krake - View from the Peak Throughout 2016 we highlighted that various measures of equity valuations are
ASSET ALLOCATION AND THE EQUITY RISK PREMIUM
 ASSET ALLOCATION AND THE EQUITY RISK PREMIUM Canada Pension Plan Seminar on Demographic, Economic and Investment Perspectives for Canada May 2, 2003 Zainul Ali, Vice President Strategic Research & Risk
II. Major Engines of Sustained Economic Growth
 Opening Speech by Toshihiko Fukui, Governor of the Bank of Japan I. Introduction Good morning, ladies and gentlemen. I am very pleased to address the 11th international conference hosted by the Institute
Investment Review & Outlook
 Investment Review & Outlook December 31, 2011 1 Investment Review and Outlook We d like to provide you with a perspective of the equity markets for the past year as well as common and uncommon themes for
Chapter 12 Aggregate Demand II: Applying the IS -LM Model
 Chapter 12 Aggregate Demand II: Applying the IS -LM Model Modified by un Wang Eco 3203 Intermediate Macroeconomics Florida International University Summer 2017 2016 Worth Publishers, all rights reserved
Nothing. Sometimes Doing. Really Is Better FINANC E. A Closer Look at Stock Options, Share Repurchases, and Earnings per Share
 Sometimes Doing Nothing Really Is Better A Closer Look at Stock Options, Share Repurchases, and Earnings per Share By Gregory W. Martin and Brian P. McAllister Stock option grants continue to be an important