IPO Watch Europe 2017
|
|
|
- Bridget Benson
- 6 years ago
- Views:
Transcription


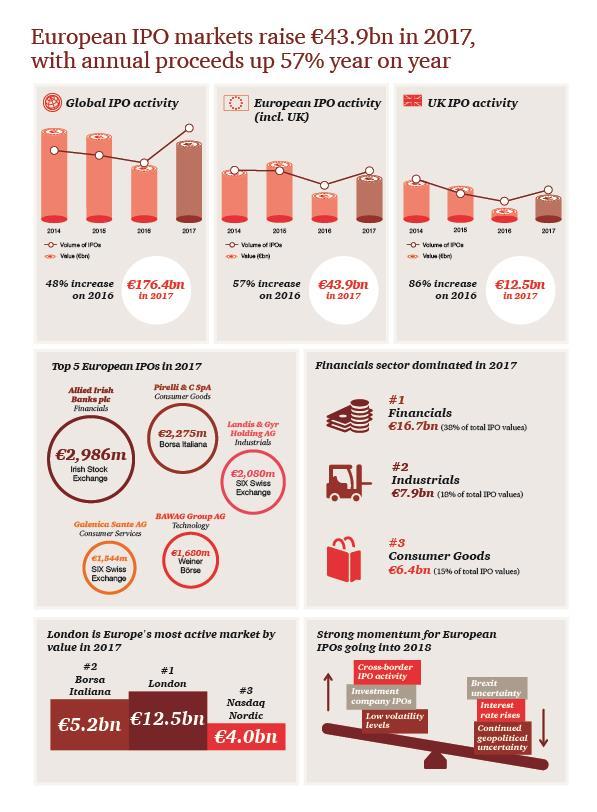
1 IPO Watch Europe bn IPO proceeds raised in 2017, up 57% from 27.9bn raised in IPOs in 2017 across Europe, up from 268 IPOs in m average offering value in 2017, an increase of 6% on 184m in
2

3 Contents Stay tuned - Outlook for European IPO review 5 European IPO trends 6 Market volatility 7 Exchange activity by value 8 Exchange activity by volume 9 Top 10 IPOs in Europe 10 Pricing of top 5 IPOs 10 The sector story 11 European PE trends 12 UK focus Overview 13 Relative performance of UK IPOs 14 The sector story 15 Global perspective Overview 16 Cross-border IPOs 17 Appendix 20
4 Stay tuned Outlook for 2018 The buoyant IPO market seen in 2017 looks set to continue into the year ahead with a healthy pipeline of IPOs building across Europe as we start The adverse effects of geopolitical uncertainty did not materialise as evidenced by the markets consistently reaching record highs over the year. Market indices reaching new heights European markets have weathered the geopolitical storm of elections, tensions between the US and North Korea and ongoing Brexit negotiations between the EU and UK as indices continue to record unprecedented performance by reaching all time highs. The global growth outlook also remains supportive for the equity markets with positive global earnings momentum likely to continue. The FTSE 100 closed 2017 at an all time high which has continued into DAX and a number of other European indices also continued to reach new heights throughout 2017 and show no signs of slowing down. With the majority of market indicators all pointing in the same direction, it s full steam ahead into Volatility has hovered close to record low levels throughout 2017, creating favourable IPO market conditions. There doesn t appear to be much to change this current stability, and we expect to see a flurry of IPO activity in 2018 as companies and investors look to get deals done before the IPO window potentially closes towards the end of the year as we get closer to the Brexit date in March Additionally, European valuations still look attractive for investors further supporting European equities. International listings The pipeline for cross-border IPOs in the year ahead looks healthy as London remains a prime destination for those pursuing international listings. London IPOs in 2017 became more international, and despite the backdrop of Britain s vote to leave the EU and ongoing Brexit negotiations, London is set to reaffirm its reputation as the most international exchange, with many companies from across the globe, particularly emerging markets continuing to see London as open for business and a key financial centre in Europe. Investment vehicles revving up The financials sector has continued to be the top sector for IPOs across Europe has been a particularly strong year for investment vehicle IPOs with London being the main beneficiary. Another year of global growth should favour cyclical sectors again, in particular financials and commodities. SPACs* have made a comeback, particularly in the US IPO markets, where there was an unprecedented number of SPAC IPOs in This has spread across the Atlantic and helped to drive momentum in the UK. The London market for SPACs remains strong as investors and management teams alike have gained confidence in the success of these vehicles and the returns generated. The momentum from 2017 is continuing and we are seeing a much greater level of interest than ever before in the use of these vehicles with further SPACs expected to come through in Mega-IPOs ** The much anticipated IPO of Saudi Aramco, Saudi Arabia s national oil company, is widely expected to be the largest on record. The company intends to list on the domestic Tadawul stock exchange with New York, London and Hong Kong the main contenders for the international listing. On the continent, Siemens is planning to list its healthcare unit in Germany, expecting to raise anything between 5bn and 10bn making it one of the biggest European IPOs in recent history. Trade sales remain strong There was a slowdown in PE backed IPO activity across Europe in While a number of PE backed IPOs were successfully achieved, we continue to observe that in many instances PE owners are pursuing a dual-track sales process. With the significant amounts of PE money available, the continuation of historically low interest rates, China s new regulatory regime for outbound M&A and clarification over the US tax reforms, inbound and outbound global M&A activity looks set to continue apace. As we head into 2018 there is strong momentum for European IPOs supported by low levels of volatility and market indices at record highs. Continuing to deliver a smooth and orderly Brexit process will be critical to providing the market conditions for a healthy pipeline of European IPOs in Mark Hughes Partner, UK Capital Markets Leader at PwC 4 IPO Watch Europe 2017 *A SPAC is a Special Purpose Acquisition Company **Mega-IPOs are those raising in excess of 1bn

5 2017 European IPO review A buoyant year for European IPOs The value of European IPOs in 2017 amounted to 43.9bn, an increase of 57% as compared to 2016, with IPO volumes up by 30%. Improving economic conditions across the EU provided an ideal environment for the IPO market to flourish as a number of candidates that postponed their plans for an IPO during 2016 went on to list in Geopolitical uncertainty remains due to ongoing Brexit negotiations however, markets are proving to be resilient with volatility remaining low and indices reaching record highs. London returned to the top spot in both value and volumes raising 12.5bn, an increase of 86% on 2016, which was predominantly driven by a rise in listings of investment vehicles and increase in crossborder IPO activity. The London and Irish Stock Exchanges also co-hosted the largest European IPO in 2017, Allied Irish Banks plc. Borsa Italiana, also part of the London Stock Exchange Group, was the second most active exchange in terms of value raising 5.2bn after hosting the mega-ipo of Pirelli. IPO Watch Europe
6 Value of IPOs bn Volume of IPOs Value of IPOs bn Volume of IPOs 2017 European IPO trends European IPO values and volumes rebound from a subdued 2016, boosted by nine mega-ipos Figure 1: European IPO activity since 2008* Value bn IPOs Figure 2: Quarterly European IPO activity since Q1 Q2 Q3 Q4 Q1 Q2 Q3 Q4 Q1 Q2 Q3 Q4 Q1 Q2 Q3 Q4 Q1 Q2 Q3 Q Value bn IPOs * Excludes IPOs on Borsa Istanbul, Zagreb Stock Exchange and Bucharest Stock exchange pre 2011 IPO Watch Europe
7 % change since 1 Jan 2016 Money raised bn VSTOXX50 index Market volatility Historic low volatility and record highs in European indices created a supportive market for IPOs in 2017 Figure 3: Volatility tracked against European IPO values Jan Feb Mar Apr May Jun Jul Aug Sep Oct Nov Dec Jan Feb Mar Apr May Jun Jul Aug Sep Oct Nov Dec Money raised bn 1bn+ IPO of Dong Energy 1bn+ IPOs of Nets 1bn+ IPOs of innogy SE and ConvaTec 1bn+ IPO of Galenica Sante AG 1bn+ IPOs of Allied Irish Bank plc and ALD SA VSTOXX50 index 1bn+ IPO of Landis & Gyr Holding AG 1bn+ IPOs of BAWAG Group AG and J2 Acquisition Falling oil prices, Chinese economy slowdown and threat of impending bear market EU referendum in the UK US presidential election Triggering of article 50 UK general election French presidential election On-going Article 50 negotiations between the UK and EU. North Korea and US tension. Figure 4: Historical performance of major European market indices since January % 30% 20% 10% 0% DAX 30-10% FTSE % CAC 40 IBEX 35-30% Jan Feb Mar Apr May Jun Jul Aug Sep Oct Nov Dec Jan Feb Mar Apr May Jun Jul Aug Sep Oct Nov Dec Source: Thomson Reuters as at 29 December 2017 IPO Watch Europe IPO Watch Europe 2017
8 Exchange activity by value Most European exchanges recorded an increase on 2016, with the London Stock Exchange increasing by 86% Figure 5: IPO offering value by stock exchange Stock exchange offering value m Performance Q Q Q Q London Stock Exchange Group 8,043 17,634 2,257 2,613 3,564 9,200 London Stock Exchange 6,700 12,472 2,115 2,223 2,672 5,462 Borsa Italiana 1,343 5, ,738 Nasdaq Nordic 7,861 3, , ,480 Nasdaq Stockholm 2,222 2, , Nasdaq Helsinki 676 1, Nasdaq Copenhagen 4, Nasdaq Tallinn Nasdaq Riga Nasdaq Iceland Nasdaq Vilnius SIX Swiss Exchange 733 3,853-1,544 2, Irish Stock Exchange - 3,756-2, BME (Spanish Exchange) 1,327 3,696 1,459 1, Euronext 3,455 3, , Euronext Paris 824 1, , Euronext Amsterdam 2, Euronext Brussels Deutsche Börse 5,022 2, , ,037 Warsaw 262 1, , Wiener Börse - 1, ,680 Oslo Børs & Oslo Axess 287 1, Borsa Istanbul Bucharest Stock Exchange Budapest Prague Stock Exchange Luxembourg Sofia Total 27,888 43,915 4,561 15,590 8,184 15,580 Figure 6: Top 3 stock exchanges in Europe in 2017 (by offering value) London IPO Watch Europe
9 Exchange activity by volume London Stock Exchange finished 2017 as Europe s most active exchange with an increase of 54% on 2016 volumes Figure 7: IPO volume by stock exchange Stock exchange offering volume Performance Q Q Q Q London Stock Exchange Group London Stock Exchange Borsa Italiana Nasdaq Nordic Nasdaq Stockholm Nasdaq Helsinki Nasdaq Copenhagen Nasdaq Vilnius Nasdaq Tallinn Nasdaq Riga Nasdaq Iceland Warsaw BME (Spanish Exchange) Euronext Euronext Paris Euronext Amsterdam Euronext Brussels Deutsche Börse Oslo Børs & Oslo Axess SIX Swiss Exchange Irish Stock Exchange Wiener Börse Borsa Istanbul Bucharest Stock Exchange Budapest Prague Stock Exchange Luxembourg Sofia Total The Nordic IPO market has continued to develop extremely well over the year. The listing activity is at an all time high, especially in the Swedish market both on Nasdaq Stockholm and First North. We saw listings of companies across all sectors, with Healthcare, Industrials and Technology standing out in The listed companies are at all stages of maturity from recent start-ups to spin-offs from well established larger entities. We have a positive outlook for 2018 with high levels of activity expected in the Nordic market and the significant interest for IPOs continuing into Sweden, in particular, is expected to see strong volumes and attractive valuations in Johan Ericsson Partner, Swedish Capital Markets Group at PwC 9 IPO Watch Europe 2017
10 Top 10 IPOs in Europe 2017 saw nine mega-ipos, the largest being Allied Irish Banks plc Figure 8: Top 10 IPOs in 2017 Trading date Issuer m Sector Stock Exchange Jun-17 Allied Irish Banks plc 2,986 Financials Irish Stock Exchange; London Stock Exchange Country of operation Oct-17 Pirelli & C SpA 2,275 Consumer Goods Borsa Italiana Italy Jul-17 Landis & Gyr Holding AG 2,080 Industrials SIX Swiss Exchange Switzerland Oct-17 BAWAG Group AG 1,680 Financials Wiener Börse Austria Apr-17 Galenica Sante AG 1,544 Consumer Services SIX Swiss Switzerland Nov-17 EN+ Group plc 1,287 Basic Materials London Stock Exchange Russian Federation Jun-17 ALD SA 1,156 Industrials Euronext France Jul-17 Play Communications SA 1,041 Telecommunications Warsaw Stock Exchange Poland Oct-17 J2 Acquisition Ltd 1,029 Financials London Stock Exchange United Kingdom Apr-17 Gestamp Automocion SA 870 Consumer Goods BME Spain Total 15,948 Ireland PE backed Pricing of top 5 IPOs Two of the top five IPOs in Europe priced towards the top end of the range Figure 10: Pricing of Top 5 IPOs in 2017 Exchange Allied Irish Banks plc Pirelli & C SpA Landis & Gyr Holding AG BAWAG Group AG Galenica Sante AG Irish Stock Exchange; London Stock Exchange Borsa Italiana SIX Swiss Exchange Wiener Börse SIX Swiss Exchange IPO date 23-Jun 04-Oct 21-Jul 25-Oct 07-Apr Money raised m 2,986 2,275 2,080 1,680 1,544 Price range SFR SFR CHF CHF39.00 Offer Price SFR CHF was an exceptional year for Borsa Italiana. Admissions were at the highest levels since 2000 with 32 IPOs (of which 26 companies were admitted to AIM Italia). The exchange contributed the second highest amounts of capital raised in Europe of 5.2bn, and the largest continental European IPO of the year with Pirelli & C. This record year reflects the confidence in the Italian economy, together with the rising popularity of public markets as an alternative to private fundraising or debt. Nonetheless, in 2018, some slowdown in the Italian IPO activity is expected in connection with uncertainties around the outcome of the Italian general election in March Stefanie Lierheimer Director, Italian Capital Markets Group at PwC IPO Watch Europe
11 The sector story Financials remained the largest sector, driven by the mega- IPOs of Allied Irish Banks plc, BAWAG Group AG and J2 Acquisition Ltd Figure 10: IPO value by sector By offering value m Increase / (decrease) Q Q Q Q Financials 7,962 16,719 8,757 2,697 5,217 2,985 5,820 Industrials 4,121 7,887 3, ,295 2,455 1,153 Consumer Goods 1,827 6,428 4, , ,622 Consumer Services 3,517 4,716 1, , Health Care 2,351 2,115 (236) ,138 Technology 309 2,053 1, , Basic Materials 33 1,933 1, ,300 Telecommunications 438 1, ,044 - Utilities 7, (6,659) Oil & Gas Total 27,888 43,915 16,027 4,561 15,590 8,184 15,580 Financials 109 IPOs raised in bn Largest IPO: Allied Irish Banks plc 2,986m Industrials 50 IPOs raised in bn Largest IPO: Landis & Gyr Holding AG 2,080m Consumer Goods 28 IPOs raised in bn Largest IPO: Pirelli & C SpA 2,275m IPO Watch Europe
12 European PE Trends PE backed IPO activity has slowed across Europe with dual-track processes being common Figure 11: Value of European PE backed IPOs as a percentage of total European IPO value* Figure 12: Volume of European PE backed IPOs as a percentage of total European IPOs* 47% 52% 44% 54% 31% 32% 47% 40% 51% 39% 19% 7% bn 10.6bn 22.6bn 24.6bn 13.5bn 12.4bn Figure 13: European PE backed IPOs by industry 2017 bn* Value bn Utilities Industrials Consumer Services Technology Financials Health Care Consumer Goods Basic Materials Volume of IPOs Figure 14: Value of London PE backed IPOs as a percentage of total London IPO value * Figure 15: Volume of London PE backed IPOs as a percentage of total London IPOs * 42% 70% 64% 73% 27% 28% 50% 43% 57% 28% 0% 0% bn 9.6bn 7.1bn 3.5bn 2.7bn *IPOs raising over 50m, excludes closed-end funds, SPACs, SPVs, Capital Pool companies, Investment Trusts, REITs, Royalty Trusts Source: Dealogic 12 IPO Watch Europe 2017
13 Value of IPOs bn Volume of IPOs UK focus Overview UK IPOs back to pre-eu referendum levels, with volumes increasing by 54% in 2017 Figure 16: UK IPO trends (by offering value) Figure 17: UK IPO trends (by volume) bn 15.7bn bn 11.9bn 6.7bn 5.5bn 12.5bn 10.9bn Q1 Q2 Q3 Q4 Q1 Q2 Q3 Q4 Q1 Q2 Q3 Q4 Q1 Q2 Q3 Q Main AIM Q1 Q2 Q3 Q4 Q1 Q2 Q3 Q4 Q1 Q2 Q3 Q4 Q1 Q2 Q3 Q Main AIM London returned as Europe s most active exchange in terms of value and volume in The high levels of investment vehicle listings helped to drive the London IPO market, accounting for 2.7bn (25%) of proceeds raised. This is compared to only 0.3bn in The resurgence in flotations during 2017 can be seen in the second and third quarters where 4.3bn was raised compared to 1.2bn raised during the same period during The increase was attributable to favourable IPO market conditions, with the FTSE 100 continuing to rally in 2017, closing the year at an all time high. Furthermore, volatility has remained close to record lows throughout the year. As we get closer to the Brexit date in March 2019, we may see a flurry of IPO activity in 2018 to get deals completed well ahead of the deadline. Figure 18: Top 5 UK IPOs in 2017 Issuer Proceeds m Sector PE backed EN+ Group plc 1,147 Basic Materials J2 Acquisition Ltd 919 Financials Sherborne Investors (Guernsey) C Ltd 700 Financials BioPharma Credit plc 611 Financials ContourGlobal plc 441 Utilities The UK's resurgence to pre-eu referendum levels has been driven in part by investment company IPOs. SPACs and REITs accounted for a quarter of UK volumes and values and three of the top five UK IPOs fall into this category, which is a trend expected to continue in The pipeline for UK IPOs in the year ahead looks healthy, and includes a number of international companies, demonstrating London s continued attractiveness for cross border IPOs in Europe. Lucy Tarleton Director, UK Capital Markets Group at PwC IPO Watch Europe
14 UK focus Relative performance of UK IPOs Figure 19: Share price performance of UK IPOs relative to the FTSE All Share Index, from IPO to 29 Dec 2017 (%) Alfa Financial Software Holdings PLC Footasylum PLC Medica Group PLC Strix Group PLC Xafinity PLC Boku Inc Charter Court Financial Services Group PLC Sabre Insurance Group PLC Tatton Asset Management PLC Sumo Group PLC Polyus PAO Jupiter Emerging & Frontier Income Trust Plc DP Eurasia NV Arena Events Group PLC PRS Reit PLC Bakkavor Group Plc Triple Point Social Housing REIT PLC ContourGlobal PLC Sherborne Investors (Guernsey) C Ltd Alpha Financial Markets Consulting PLC Tufton Oceanic Assets Ltd Aberdeen Standard European Logistics Income PLC CIP Merchant Capital Ltd AEW UK Long Lease REIT PLC BioPharma Credit PLC Gabelli Merger Plus+ Trust PLC Warehouse REIT PLC City Pub Group PLC Supermarket Income REIT PLC LXi REIT PLC J2 Acquisition Limited EN+ Group PLC Impact Healthcare REIT PLC TI Fluid Systems PLC Residential Secure Income PLC Downing Strategic Micro-Cap Investment Trust PLC QUIZ PLC Landscape Acquisition Holdings Ltd Ocelot Partners Ltd Scotgems PLC Eddie Stobart Logistics PLC Arix Bioscience PLC ADES International Holding Ltd Global Ports Holding PLC UP Global Sourcing Holdings PLC FFI Holdings PLC -80% -60% -40% -20% 0% 20% 40% 60% 80% * companies have outperformed the index 24 companies have underperformed the index Main AIM *Threshold of 50m proceeds Relative performance based on the FTSE All Share Index for Main Market listed companies and FTSE AIM All Share Index for AIM quoted companies Source: Dealogic and Thomson Reuters as of 29 Dec 2017 IPO Watch Europe
15 UK focus The sector story The Financials sector has continued to dominate UK IPOs Figure 20: UK IPO value by sector By offering value m Increase / (decrease) Q Q Q Q Financials 1,910 5,812 3,902 1, ,480 2,105 Industrials Consumer Goods Basic Materials 15 1,600 1, ,159 Consumer Services (220) Utilities Technology Oil & Gas Health Care 1, (1,443) Total value m 5,519 10,915 5,396 1,807 1,913 2,343 4,852 "SPAC IPOs have been a regular feature of the US IPO markets but we saw an unprecedented number in 2017 where $10bn was raised in the US. This helped to drive momentum elsewhere, particularly here in the UK where SPAC IPOs raised 1.7bn. The increase in the number of SPAC IPOs in the past year will inevitably lead to an increase in M&A activity in the next couple of years as the SPACs seek to fulfil their acquisition policy and meet their investors expectations. Vhernie Manickavasagar Director, UK Capital Markets Group at PwC UK focus SPACs A Special Purpose Acquisition Company ( SPAC ) is a cash shell used to raise finance through a public listing with the aim of making a future acquisition. Unlike other financing methods, a SPAC provides an opportunity for expert managers to raise finance for potential acquisitions without having a target identified. Shareholders invest in a SPAC based on their confidence in the founder s or management team s ability to exploit opportunities in their particular fields of expertise. Of the 103 IPOs in London in 2017, 15 were SPACs with 1.7bn raised from this type of listing. J2 Acquisition s launch on the London Stock Exchange last year was the second largest IPO in London in 2017, raising 919m - the largest amount for a London SPAC since The London market for SPACs is growing as investors and management teams alike have gained confidence in the success of these vehicles. The momentum from 2017 is set to continue and we are seeing a much greater level of interest than ever before in the use of these vehicles with further SPACs included in the 2018 IPO pipeline. 15 IPO Watch Europe 2017
16 Value of IPOs bn Volume of IPOs Global perspective Overview Global IPO volumes highest for a decade Figure 21: Global IPO activity ,861 1,601 1,583 1,411 1,326 1,116 1,181 1, EMEA bn Americas bn Asia Pacific bn IPOs 2,000 1,800 1,600 1,400 1,200 1, Global IPO values increased by 48% when compared to 2016, with values across the majority of the largest exchanges rising Figure 23: Global IPO activity by region m Asia Pacific, home to the Hong Kong and Shanghai exchanges, continues to be the world s most active IPO region in terms of value as it has been in most years in the past decade. Americas is the next most active region in terms of value after more than doubling its 2016 proceeds, closely followed by EMEA. In 2017, New York led the world by value of IPOs. They were followed by Shanghai and Hong Kong in second and third positions, respectively. The Americas hosted the largest IPO of the year, with Snap Inc raising 3.2bn in New York. However, it was EMEA that featured the most heavily in the top ten hosting five of the largest IPOs in The SIX Swiss Exchange appeared twice in the top ten with the IPOs of Landis & Gyr and Galenica Sante. 72, ,244 50,908 Figure 22: Top 10 global IPOs in 2017 Issuer m Exchange Privatisation 29,991 Snap Inc 3,209 NYSE No Allied Irish Banks plc 2,986 Irish Stock Exchange; Yes London Stock Exchange Pirelli & C SpA 2,275 Borsa Italiana No Netmarble Games Corp 2,176 Korea Exchange No Landis & Gyr Holding AG 2,080 SIX Swiss Exchange No Altice USA Inc 1,721 NYSE No BAWAG Group AG 1,680 Wiener Börse No Galenica Sante AG 1,544 SIX Swiss Exchange No Netlink NBN Trust 1,489 Singapore Exchange No General Insurance Corp of India Ltd 1,461 Bombay Stock Exchange Yes ,092 20,259 EMEA Americas Asia Pacific IPO Watch Europe Source: Dealogic
17 Value of IPOs bn Volume of IPOs Global perspective Cross-border IPOs Renewed appetite for cross-border IPOs in 2017 Figure 24: Cross-border IPO activity, Alibaba ( 19.3bn) Value bn IPOs 20 - There has been a resurgence in cross-border IPOs in 2017, with values doubling on 2016 to 12.3bn. Nearly half of cross-border IPO proceeds was raised on the US exchanges. There was a significant increase in the number of Chinese companies coming to the US, and we have also started seeing a comeback of LatAm companies to the US markets. London was in second place, attracting 3bn of cross-border IPO proceeds, with the eagerly awaited return of the emerging markets companies, who do not seem to be deterred by Brexit uncertainties. Significantly, London welcomed the first Russian IPO since 2014, with EN+ Group plc raising 1.3bn, the first IPO from the Middle East since 2015 (ADES International Holding Ltd) and the first ever IPO of a Turkish business on the Main Market of the London Stock Exchange, Global Port Holdings. There also seems to be renewed interest in and cautious hopes for - the return of energy and mining stocks, traditionally a stronghold of the London market was a positive year for the IPO markets globally, particularly after a subdued 2016, with IPO volumes the highest for ten years on the back of strong equity indices performance, low volatility and attractive valuations. Global outlook remains positive and all markets are in good shape, with the US powering ahead, Asia continuing to dominate the global activity and Europe enjoying economic stability. The year ahead looks promising, with a healthy number of cross-border IPOs in the pipeline on the key exchanges. Ross Hunter Partner, Head of the Global IPO Centre at PwC The much anticipated IPO of Saudi Aramco, Saudi Arabia s national oil company, is widely expected to be the largest on record. The company intends to list on the domestic Tadawul stock exchange with New York, London and Hong Kong the main contenders for the international listing representing all three world regions. Source: Dealogic 17 IPO Watch Europe 2017
18 Issuer nationality Issuer nationality Global perspective Cross-border IPOs Figure 25: Cross-border activity in 2017 between the top 10 issuing countries and selected exchanges By value m New York London Other European Exchange nationality Australia Singapore Hong Kong Other exchanges Exchange nationality Total by issuer nationality 2017 Total by issuer nationality 2016 China 3, ,220 2,526 Russian Federation - 1, ,771 - Singapore ,396 1,061 Argentina 1, ,098 - Brazil France Germany UK Canada Turkey Other issuer nationalities ,977 2,325 Total by exchange 2017 Total by exchange ,947 2, , ,254 n/a 3, n/a 6,223 By volume of IPOs New York London Other Australia Singapore Hong Other Total by issuer Total by issuer European Kong exchanges nationality 2017 nationality 2016 China Russian Federation Singapore Argentina Brazil France Germany UK Canada Turkey Other issuer nationalities Total by exchange n/a Total by exchange n/a 73 Source: Dealogic IPO Watch Europe
19 Appendix 19 IPO Watch Europe 2017
20 Appendix IPOs by market Appendix 1: European IPOs by market Stock exchange TOTAL IPOs Q Q Q Q Value Value Value Value Value Value IPOs IPOs IPOs IPOs IPOs m m m m m m London Stock Exchange Group 81 8, , , , , ,200 Nasdaq Nordic 80 7, , , ,480 SIX Swiss Exchange , , , Irish Stock Exchange , , BME (Spanish Exchange) 24 1, , , , Euronext 23 3, , , Deutsche Börse 11 5, , , ,037 Warsaw , , Wiener Börse 1-1 1, ,680 Oslo Børs & Oslo Axess , Borsa Istanbul Bucharest Budapest Prague Luxembourg Sofia Total , , , , , ,580 EU-REGULATED London Main 28 5, , , , , ,851 Borsa Italiana (Main) 3 1, , ,232 SIX Swiss Exchange , , , Irish Stock Exchange (Main) , , BME (Spanish Exchange) (Main) 3 1, , , , Euronext 14 3, , , Deutsche Börse (Prime and General Standard) 8 5, , , ,013 Warsaw (Main) , , Nasdaq Nordic (Main) 29 7, , ,220 Wiener Börse , ,680 Oslo Børs , Bucharest Budapest Prague Sofia EU-regulated sub-total , , , , , ,127 EXCHANGE-REGULATED Nasdaq Nordic (First North) , , London AIM 39 1, , Borsa Italiana (AIM) , Borsa Istanbul Warsaw (NewConnect) Euronext (Alternext) Deutsche Börse (Scale) BME (Spanish Exchange) (MAB) Oslo Axess Bucharest (AeRO) Luxembourg (MTF) Wiener Borse (MTF) Exchange-regulated sub-total 158 2, , , , ,453 Europe total , , , , , ,580 IPO Watch Europe
21 IPO Watch Europe
 on a quarterly basis.")
22 Contacts About IPO Watch Europe IPO Watch Europe surveys all new primary market equity IPOs on Europe s principal stock markets and market segments (including exchanges in Austria, Belgium, Croatia, Denmark, France, Germany, Greece, the Netherlands, Ireland, Italy, Luxembourg, Norway, Poland, Portugal, Romania, Spain, Sweden, Switzerland, Turkey and the UK) on a quarterly basis. Movements between markets on the same exchange are excluded. The data in this report excludes greenshoe. Where data has not been provided in Euros, it has been converted using the spot rate as of the pricing date of the IPO. Katherine Howbrook (Press office) +44 (0) katherine.j.howbrook@pwc.com Mark Hughes +44 (0) mark.c.hughes@pwc.com Lucy Tarleton +44 (0) lucy.c.tarleton@pwc.com This survey was conducted between 1 January and 31 December 2017 and captures introductions as well as IPOs based on their first trading date. All market data is sourced from Dealogic and the stock markets themselves and has not been independently verified by PricewaterhouseCoopers LLP. This publication has been prepared for general guidance on matters of interest only, and does not constitute professional advice. You should not act upon the information contained in this publication without obtaining specific professional advice. No representation or warranty (express or implied) is given as to the accuracy or completeness of the information contained in this publication, and, to the extent permitted by law, PricewaterhouseCoopers LLP, its members, employees and agents do not accept or assume any liability, responsibility or duty of care for any consequences of you or anyone else acting, or refraining to act, in reliance on the information contained in this publication or for any decision based on it PricewaterhouseCoopers LLP. All rights reserved. In this document, PwC refers to PricewaterhouseCoopers LLP which is a member firm of PricewaterhouseCoopers International Limited, each member firm of which is a separate legal entity.
IPO Watch Europe Q3 2018
 IPO Watch Europe 18 3.9bn raised in 18 ( 17: 8.3bn, 3% decrease) 4 IPOs in 18 across Europe ( 17: 7 IPOs, 1% decrease) 2.8bn IPO Proceeds raised in YTD 18 (YTD 17: 29.1bn, 11% decrease) www.pwc.co.uk/ipowatch
IPO Watch Europe Q1 2018
 IPO Watch Europe 18 12.5bn raised in 18 ( 17: 4.6bn, 172% increase) 67 IPOs in 18 across Europe ( 17: 54 IPOs, 24% increase) 260m average offering value in 18, an increase of 31% compared to 199m in 17
für Rückfragen zu der beigefügten Publikation IPO Watch Europe Q stehen Ihnen folgende Ansprechpartner gerne zur Verfügung:
 Sehr geehrte Damen und Herren, für Rückfragen zu der beigefügten Publikation IPO Watch Europe Q1 17 stehen Ihnen folgende Ansprechpartner gerne zur Verfügung: Nadja Picard nadja.picard@de.pwc.com Tel.
IPO Watch Europe Survey Q1 2014
 www.pwc.com IPO Watch Europe Survey 2014 Contents Long term European IPO activity by value and volume 3 Quarterly European IPO activity by value and volume 4 Market volatility index and stock market performance
IPO Watch Europe Survey Q2 2014
 www.pwc.com IPO Watch Europe Survey Q2 2014 Contents Long term European IPO activity by value and volume 3 Quarterly European IPO activity by value and volume 4 Market volatility index and stock market
IPO Watch Europe Q1 2016
 IPO Watch Europe Q1 1 3.5bn IPO proceeds raised in Q1 1 down 79% from the 1.4bn raised in Q1 50 IPOs in Q1 1 across Europe, down from 82 IPOs in Q1 135m average offering value in Q1 1, a decrease of 50%
BME. Euronext OMX. Euronext. London OMX. Figure 1: Quarterly European IPO activity by value and volume. Total European listings comprise those with:
 IPO Watch Europe Q 0 IPO Watch Europe Q 0 Figure : Quarterly European IPO activity by value and volume H 0 Q 0 Q 0 H 0 Total European listings comprise those with: Less than m raised Greater than m raised
IPO Watch Europe Survey Q2 2013
 www.pwc.com IPO Watch Europe Survey Q2 2013 Contents Quarterly European IPO activity by value and volume 3 Market volatility index and stock market performance 4 IPO offering value 5 IPO volume 6 Top ten
IPO Watch Europe Survey Q4 2011
 www.pwc.com IPO Watch Europe Survey Q4 2011 Table of contents Page 2011 overview 3 2011 European IPO activity by value and volume 4 2011 volume and value by exchange 5 Q4 11 European IPO activity by value
IPO Watch Europe Survey Q Change image
 www.pwc.com/ua/capital-markets IPO Watch Europe Survey Q4 2012 Change image Contents Annual European IPO activity by value and volume 3 Quarterly European IPO activity by value and volume 4 Market volatility
IPO Watch Europe Survey Q4 2012
 www.pwc.com IPO Watch Europe Survey Q4 2012 Contents Annual European IPO activity by value and volume 3 Quarterly European IPO activity by value and volume 4 Market volatility index and stock market performance
IPO Watch Europe Survey Q4 2010
 www.pwc.com IPO Watch Europe Survey Q4 2010 Table of contents Page European IPO activity by number and volume 3 IPO volume 4 IPO offering value 5 by market 6 Top five 7 US and Russia 8 value of by month
IPO Watch Europe Survey Q Change image
 www.pwc.com IPO Watch Europe Survey Q3 2012 Change image Contents European IPO activity by value and volume 3 Market volatility index and stock market performance 4 Post IPO performance 5 IPO offering
für Rückfragen zu der beigefügten Publikation IPO Watch Europe Q stehen Ihnen folgende Ansprechpartner gerne zur Verfügung:
 Sehr geehrte Damen und Herren, für Rückfragen zu der beigefügten Publikation IPO Watch Europe Q1 2016 stehen Ihnen folgende Ansprechpartner gerne zur Verfügung: Nadja Picard nadja.picard@de.pwc.com Tel.
IPO Watch Europe Survey Q3 2011
 www.pwc.com IPO Watch Europe Survey Q3 2011 Table of contents Page European IPO activity by value and volume 3 IPO offering value 4 IPO volume 5 Top five 6 by sector and value 7 US activity 8 Offering
IPO Watch Europe Survey Q2 2012
 www.pwc.com IPO Watch Europe Survey Q2 2012 Contents European IPO activity by value and volume 3 Marker volatility index 4 IPO offering value 5 IPO volume 6 Top five IPOs 7 IPOs by sector and value 8 US
IPO Watch Europe Q3 2014
 IPO Watch Europe Q3 2014 6.6bn IPO proceeds raised in Q3 2014 (excl. greenshoe) 40.3bn proceeds raised YTD 2014 76 Companies listed in Q3 2014 28 companies listed YTD 2014 207m Average offering YTD 2014
Dirk Menker Tel
 Sehr geehrte Damen und Herren, für Rückfragen zu der beigefügten Publikation IPO Watch Europe Q1 2015 stehen Ihnen folgende Ansprechpartner gerne zur Verfügung: Nadja Picard nadja.picard@de.pwc.com Tel.
für Rückfragen zu der beigefügten Publikation IPO Watch Europe Q stehen Ihnen folgende Ansprechpartner gerne zur Verfügung:
 Sehr geehrte Damen und Herren, für Rückfragen zu der beigefügten Publikation IPO Watch Europe Q2 16 stehen Ihnen folgende Ansprechpartner gerne zur Verfügung: Nadja Picard nadja.picard@de.pwc.com Tel.
IPO Watch Europe Q2 2015
 IPO Watch Europe Q2 201 14.7bn IPO proceeds raised in Q2 201 (excl. greenshoe) 31.1bn in H1 201 and 33.7bn in H1 2014 121 IPOs Listed in Q2 201 203 IPOs in H1 201 and 214 IPOs in H1 2014 192m Average offering
MANDATORY PROVIDENT FUND SCHEMES AUTHORITY
 Guidelines III.4 MANDATORY PROVIDENT FUND SCHEMES AUTHORITY III.4 Guidelines on Approved Exchanges INTRODUCTION Section 2 of the Mandatory Provident Fund Schemes (General) Regulation ( the Regulation )
MANDATORY PROVIDENT FUND SCHEMES AUTHORITY. Guidelines on Recognized Exchanges
 Guidelines III.4 MANDATORY PROVIDENT FUND SCHEMES AUTHORITY III.4 Guidelines on Recognized Exchanges INTRODUCTION Section 2 of the Mandatory Provident Fund Schemes (General) Regulation ( the Regulation
IPO Watch Europe Survey Q1 2010
 IPO Watch Europe Survey Q1 2010 Table of contents Page 1 Introduction 2 2 IPO activity by number and value 3 3 IPOs by market 4 4 Top five IPOs 7 5 The US exchanges 8 6 IPO value by month 9 7 Number of
BEST EXECUTION POLICY
 BEST EXECUTION POLICY Effective from 3 January 2018 TABLE OF CONTENT 1. Introductory provisions 2. Execution Venues and Quality of Executions 3. Execution venues where the Company executes customer's instructions
THE WORLD FEDERATION OF EXCHANGES PUBLISHES 2017 FULL YEAR MARKET HIGHLIGHTS
 THE WORLD FEDERATION OF EXCHANGES PUBLISHES 217 FULL YEAR MARKET HIGHLIGHTS London, Thursday 15 February 218 The World Federation of Exchanges ( The WFE ), the global industry group for exchanges and CCPs,
Equity Primary Markets and Trading Report
 Equity Primary Markets and Trading Report European market data update Q3: 6 Association for Financial Markets in Europe www.afme.eu Table of Contents Table of Contents Highlights... 3 Year-to-date variation
Outlook 2015: Europe & Germany
 Part of the M&G Group Outlook 215: Europe & Germany Research presentation 27 th November 214 European Economic Fundamentals Update & Outlook 2 Economic recovery broadening GDP growth by country Q3 214
MANDATORY PROVIDENT FUND SCHEMES AUTHORITY
 Guidelines III.4 MANDATORY PROVIDENT FUND SCHEMES AUTHORITY III.4 Guidelines on Approved Exchanges INTRODUCTION Section 2 of the Mandatory Provident Fund Schemes (General) Regulation (the Regulation) defines
Equity Primary Markets and Trading Report
 Equity Primary Markets and Trading Report European market data update Q: 26 Association for Financial Markets in Europe www.afme.eu Table of Contents Table of Contents Highlights... 3 European Equity activity
ABN AMRO (Channel Islands) Limited Order Execution Policy
 Limited Order Execution Policy") ABN AMRO (Channel Islands) Limited Order Execution Policy 1. Introduction 1.1. What is the aim of this policy? In this policy document, the bank has set out the procedures and rules used to execute your
ABN AMRO (Channel Islands) Limited Order Execution Policy 1. Introduction 1.1. What is the aim of this policy? In this policy document, the bank has set out the procedures and rules used to execute your
PwC IPO Centre Q Equity Capital Markets Briefing
 IPO Centre Equity Capital Markets Briefing provides independent guidance to companies in the process of going public and to already listed companies in assessing their position in the equity capital markets.
Equity Primary Markets and Trading Report
 Equity Primary Markets and Trading Report European market data update Q4: 216 Association for Financial Markets in Europe www.afme.eu Table of Contents Table of Contents Highlights... 3 Year-on-year variation
GCC Capital Markets Watch 2018
 GCC Capital Markets Watch 018 USD.bn raised from IPOs in 018 in the GCC, compared to USD 3.3bn in 017. Q4 018 generated USD 1bn of proceeds. 17 IPOs in 018 in the GCC, down from 8 in 017. Five IPOs took
Global Markets and Exchanges: Recent Trends
 Global Markets and s: Recent Trends Michael Shepherd, National President, Finsia, and Vice-Chairman, ASX 25 September 26 teryear s Business Chalkies and Open Outcry Growing Levels of Global Capital US$Tn
Equity Primary Markets and Trading Report
 Equity Primary Markets and Trading Report European market data update Q: 6 Association for Financial Markets in Europe www.afme.eu Table of Contents Table of Contents Highlights... 3 European Equity activity
NASDAQ FIRST NORTH CASE PRESENTATION
 NASDAQ FIRST NORTH CASE PRESENTATION September 1, 2016 NASDAQ NORDIC & EUROPE 2016 Market Cap EUR 1 113 billion Iceland Sweden Finland Turnover per Business Day EUR 2 779 million 632 Main Market listed
2013 Market Segmentation Survey
 Market Segmentation Survey Introduction This survey is being conducted since 2007. The domestic market capitalization was broken down in four segments according to thresholds. The same threshold levels
PROPERTY EU EUROPEAN LOGISTICS INVESTMENT BRIEFING
 PROPERTY EU EUROPEAN LOGISTICS INVESTMENT BRIEFING RICHARD HOLBERTON, SENIOR DIRECTOR, EMEA RESEARCH, CBRE FEBRUARY 19 TH 2015 AGENDA Economy Market Activity Forecasts Issues ECONOMY 2014 Some Alarms and
Results and Impact Report. Sustainable Stock Exchanges initiative
 Results and Impact Report Sustainable Stock s initiative 2017 Consensus Building Broad engagement with exchanges on sustainability Seven new partner exchanges, reaching nearly 10,000 new listed companies
M&A. Predictor? What is KPMG s M&A 13% Global M&A levels expected to stay strong in Capacity (net debt/ebitda) Appetite (Forward P/E ratios)
 Appetite (Forward P/E ratios)") M&A February 2016 Predictor Global M&A levels expected to stay strong in 2016 After a strong year for M&A in key markets during 2015, analysts expect the world s largest corporates to maintain the positive
M&A February 2016 Predictor Global M&A levels expected to stay strong in 2016 After a strong year for M&A in key markets during 2015, analysts expect the world s largest corporates to maintain the positive
Sehr geehrte Damen und Herren,
 Sehr geehrte Damen und Herren, für Rückfragen zu der beigefügten Publikation IPO Centre Equity Capital Markets Briefing stehen Ihnen folgende Ansprechpartner gerne zur Verfügung: Nadja Picard nadja.picard@pwc.com
Dirk Menker Tel
 Sehr geehrte Damen und Herren, für Rückfragen zu der beigefügten Publikation IPO Watch Europe Q3 2015 stehen Ihnen folgende Ansprechpartner gerne zur Verfügung: Nadja Picard nadja.picard@de.pwc.com Tel.
Corrigendum. OECD Pensions Outlook 2012 DOI: ISBN (print) ISBN (PDF) OECD 2012
 ISBN (PDF) OECD 2012") OECD Pensions Outlook 2012 DOI: http://dx.doi.org/9789264169401-en ISBN 978-92-64-16939-5 (print) ISBN 978-92-64-16940-1 (PDF) OECD 2012 Corrigendum Page 21: Figure 1.1. Average annual real net investment
OECD Pensions Outlook 2012 DOI: http://dx.doi.org/9789264169401-en ISBN 978-92-64-16939-5 (print) ISBN 978-92-64-16940-1 (PDF) OECD 2012 Corrigendum Page 21: Figure 1.1. Average annual real net investment
IPO Watch Europe Survey Q (January March): Full Analysis
: Full Analysis") IPO Watch Europe Survey Q1 2008 (January March): Full Analysis PricewaterhouseCoopers latest IPO Watch Europe survey, tracking volume and value of IPOs on Europe s main stock exchanges, shows a significant
IPO Watch Europe Survey Q1 2008 (January March): Full Analysis PricewaterhouseCoopers latest IPO Watch Europe survey, tracking volume and value of IPOs on Europe s main stock exchanges, shows a significant
Equity Primary Markets and Trading Report
 Equity Primary Markets and Trading Report European market data update Q4: 2 Association for Financial Markets in Europe www.afme.eu Table of Contents Table of Contents Highlights... 3 European Equity activity
GUIDE TO UNREGULATED FUNDS IN JERSEY
 GUIDE TO UNREGULATED FUNDS IN JERSEY CONTENTS PREFACE 1 1. Unregulated Eligible Investor Fund 2 2. Unregulated Exchange Traded Fund 2 3. General 2 Schedule 1 4 Who is an Eligible Investor? 4 Schedule 2
European ETF Listing and Distribution Poster September 2017
 www.pwc.lu European ETF Listing and Distribution Poster September 217 Global Fund Distribution Market overview Evolution of EU-domiciled ETFs AuM by country of domicile and total number of ETFs 6 1,497
THE WORLD FEDERATION OF EXCHANGES PUBLISHES 2018 FULL YEAR MARKET HIGHLIGHTS
 THE WORLD FEDERATION OF EXCHANGES PUBLISHES 18 FULL YEAR MARKET HIGHLIGHTS London, Tuesday 12 February 19 The World Federation of Exchanges ( WFE ), the global industry group for exchanges and CCPs, has
ManpowerGroup Employment Outlook Survey Singapore
 ManpowerGroup Employment Outlook Survey Singapore 1 218 ManpowerGroup interviewed nearly 59, employers across 43 countries and territories to forecast labor market activity* in 1Q 218. All participants
GCC Capital Markets Watch Q3 2018
 GCC Capital Markets Watch Q 018 USD 8m raised from IPOs in Q 018 across KSA, Kuwait and Oman (Q 018: USD 6m). IPOs in Q 018 in GCC, across a wide range of sectors. USD.bn of sovereign bonds issued by the
GCC Capital Markets Watch Q4 2017
 GCC Capital Markets Watch Q4 2017 8 IPOs USD 2.5 billion USD 12.5 billion in Q4 2017 across GCC (Q4 2016: 1 IPO). raised from IPOs in Q4, 2017 across GCC (Q4 2016: USD 37 million). worth of bonds issued
Information on Erste Group Banks Execution Policy for Professional Clients
 Information on Erste Group Banks Execution Policy for Professional Clients Information on Erste Group Banks Execution Policy for Professional Clients Information on Erste Group Banks Execution Policy for
Real Estate Investment Strategy
 Real Estate Investment Strategy 8th of July, 2015 Alessandro Bronda Head of Global Real Estate Investment Strategy Group Real Estate Zurich s real estate strategy Zurich has a systematic and structured
Auscap Long Short Australian Equities Fund Newsletter June 2018
 Auscap Long Short Australian Equities Fund Auscap Asset Management Limited Disclaimer: This newsletter contains performance figures and information in relation to the Auscap Long Short Australian Equities
Execution Policy for Professional Clients
 Execution Policy for Professional Clients Table of contents 1 EXECUTION POLICY FOR ORDERS OF PROFESSIONAL CLIENTS... 02 1.1 Scope...02 1.2 Execution Standards...02 1.3 Execution Standards per Class of
ManpowerGroup Employment Outlook Survey Netherlands
 ManpowerGroup Employment Outlook Survey Netherlands 1 218 The ManpowerGroup Employment Outlook Survey for the first quarter 218 was conducted by interviewing a representative sample of 754 employers in
EXECUTION VENUE LIST 2018 BANK JULIUS BAER & CO. LTD.
 15 TH MAY 2018 1/5 EXECUTION VENUE LIST 2018 BANK JULIUS BAER & CO. LTD. Cash Equities, Exchange Traded Funds & Securitized Derivatives Europe Austria Wiener Boerse AG Broker Network Cyprus Cyprus Stock
Global IPO trends: Q Investor confidence is growing
 Global IPO trends: Investor confidence is growing Contents Global IPO market 3 Americas 7 Asia-Pacific 11 Europe, Middle East, India and Africa 21 Appendix 29 About this report EY Global IPO Trends report
GCC Capital Markets Watch Q1 2018
 GCC Capital Markets Watch Q1 2018 USD 430m raised from IPOs in Q1 2018 across the GCC (Q4 2017: USD 2.5billion). 4 IPOs in Q1 2018 across GCC. USD 6.5bn of bonds issued by the Sultanate of Oman. www.pwc.com/me/capital-markets-watch
July 2012 Chartbook The Halftime Report
 Average Daily $VA LUE Traded ($Billions ) $Billions (212 ( US China Japan CHI-X London Hong Kong Germany France Canada Korea Australia Brazil Taiwan Spain India Italy $billions Switzerland Sweden Amsterdam
INVESTMENT MARKET UPDATE UBC FACULTY PENSION PLAN
 INVESTMENT MARKET UPDATE UBC FACULTY PENSION PLAN MIKE LESLIE, FACULTY PENSION PLAN NEIL WATSON, LEITH WHEELER FEBRUARY 12, 2014 Presenters Mike Leslie Executive Director, Investments Faculty Pension Plan
Second estimate for the third quarter of 2008 EU27 current account deficit 39.5 bn euro 19.3 bn euro surplus on trade in services
 STAT/09/12 22 January 2009 Second estimate for the third quarter of 20 EU27 current account deficit 39.5 bn euro 19.3 bn euro surplus on trade in According to the latest revisions1, the EU272 external
PwC IPO Centre Q Equity Capital Markets Briefing
 IPO Centre Equity Capital Markets Briefing provides independent guidance to companies in the process of going public and to already listed companies in assessing their position in the equity capital markets.
Balanced Select Portfolio Pn
 Factsheet as at : September 22, 2018 Balanced Select Portfolio Pn Fund objective This portfolio aims to provide long-term capital growth while keeping risk in a target volatility range of 8-10% over a
ManpowerGroup Employment Outlook Survey New Zealand
 ManpowerGroup Employment Outlook Survey New Zealand 1 218 New Zealand Employment Outlook The ManpowerGroup Employment Outlook Survey for the first quarter 218 was conducted by interviewing a representative
ManpowerGroup Employment Outlook Survey New Zealand
 ManpowerGroup Employment Outlook Survey New Zealand 3 18 New Zealand Employment Outlook The ManpowerGroup Employment Outlook Survey for the third quarter 18 was conducted by interviewing a representative
AIM INSIGHTS REVIEW OF AIM FOR THE SIX MONTHS TO DECEMBER 2017
 AIM INSIGHTS REVIEW OF AIM FOR THE SIX MONTHS TO DECEMBER 2017 1 AIM INSIGHTS REVIEW OF AIM FOR THE SIX MONTHS TO DECEMBER 2017 REVIEW OF AIM FOR THE SIX MONTHS TO DECEMBER 2017 There were conflicting
RECENT EVOLUTION AND OUTLOOK OF THE MEXICAN ECONOMY BANCO DE MÉXICO OCTOBER 2003
 OCTOBER 23 RECENT EVOLUTION AND OUTLOOK OF THE MEXICAN ECONOMY BANCO DE MÉXICO 2 RECENT DEVELOPMENTS OUTLOOK MEDIUM-TERM CHALLENGES 3 RECENT DEVELOPMENTS In tandem with the global economic cycle, the Mexican
ManpowerGroup Employment Outlook Survey Netherlands
 ManpowerGroup Employment Outlook Survey Netherlands 4 218 The ManpowerGroup Employment Outlook Survey for the fourth quarter 218 was conducted by interviewing a representative sample of 75 employers in
Manpower Employment Outlook Survey New Zealand
 Manpower Employment Outlook Survey New Zealand 3 216 New Zealand Employment Outlook The Manpower Employment Outlook Survey for the third quarter 216 was conducted by interviewing a representative sample
ManpowerGroup Employment Outlook Survey Sweden
 ManpowerGroup Employment Outlook Survey Sweden 4 218 Sweden Employment Outlook The ManpowerGroup Employment Outlook Survey for the fourth quarter 218 was conducted by interviewing a representative sample
ManpowerGroup Employment Outlook Survey Finland
 ManpowerGroup Employment Outlook Survey Finland 4 217 The ManpowerGroup Employment Outlook Survey for the fourth quarter 217 was conducted by interviewing a representative sample of 625 employers in Finland.
Best execution policy
 Best execution policy I. Purpose 1. This document: a) sets forth the measures that BCV takes to obtain the best possible result when executing orders and/or receiving and transmitting orders on behalf
ManpowerGroup Employment Outlook Survey UK
 ManpowerGroup Employment Outlook Survey UK 218 United Kingdom Employment Outlook The ManpowerGroup Employment Outlook Survey for the fourth quarter 218 was conducted by interviewing a representative sample
Q1 10 Global IPO update. April 2010
 Q1 10 Global IPO update April 2010 Q1 10 key highlights Global IPO activity by number of IPOs, was significantly higher in Q1 10 (267 deals) compared with Q1 09 (52 deals), though this was lower than Q4
ORDER EXECUTION POLICY FOR RETAIL CLIENTS LARGE SIZE ORDERS DEFINITION TABLE... 4 APPENDIX I...
 Contents ORDER EXECUTION POLICY FOR RETAIL CLIENTS... 2 1. Field of application of the Order Execution Policy... 2 2. Obligation for Best Execution... 2 3. Execution Venues... 2 4. Types of transactions
Put Numbers in Context 17th SECA Conference
 Put Numbers in Context 17th SECA Conference Patrick Förg Head Origination, Primary Markets SIX, Securities and Exchanges 4 July 2018 Successful IPOs and Capital Raisings in 2017 Confirm the Deep Pools
PwC IPO Centre Q Equity Capital Markets Briefing
 IPO Centre Equity Capital Markets Briefing provides independent guidance to companies in the process of going public and to already listed companies in assessing their position in the equity capital markets.
ManpowerGroup Employment Outlook Survey Czech Republic
 ManpowerGroup Employment Outlook Survey Czech Republic 3 217 Czech Republic Employment Outlook The ManpowerGroup Employment Outlook Survey for the third quarter 217 was conducted by interviewing a representative
Thai securities market s presence in the world
 - 2554 : 02 229 2128, 2120 2122 Email: Research@set.or.th Thai securities market s presence in Asia Thai securities market s presence in the world Market Capitalization ก GDP ก ก ก Market Capitalization
Brexit Webinar. One week on - weighing up the outlook. Financial Advisory June 2016
 Brexit Webinar One week on - weighing up the outlook Financial Advisory June 2016 Nick Edwards Head of Restructuring Services 2 Reaction To Date FTSE 100, 250 and 350 % change since 23 June 4.0% 3.0% 2.6%
Global growth weakening as some risks materialise
 OECD INTERIM ECONOMIC OUTLOOK Global growth weakening as some risks materialise 6 March 2019 Laurence Boone OECD Chief Economist http://www.oecd.org/eco/outlook/economic-outlook/ ECOSCOPE blog: oecdecoscope.wordpress.com
First ever quarter with over 200m Gross Profit
 11 July 2018 and H1 2018 Trading Update Steve Ingham Kelvin Stagg Chief Executive Officer Chief Financial Officer First ever quarter with over 200m Gross Profit LSE: PAGE.L Website: http://www.page.com/investors
Q2 10 Global IPO update. July 2010
 Q2 10 Global IPO update July 2010 Q2 10 key highlights Global IPO activity by number of IPOs, was significantly higher in Q2 10 (301 deals) compared with Q2 09 (82 deals) and this was slightly higher than
Balanced Plus Select Portfolio Pn
 Factsheet as at : August 25, 2018 Balanced Plus Select Portfolio Pn Fund objective This portfolio aims to provide long-term capital growth while keeping risk in a target volatility range of 10-12% over
Global IPOs 2016 A year of uncertainties. Cross-border IPOs gain share of global listings
 Global 2016 A year of uncertainties Cross-border gain share of global listings CROSS-BORDER IPO INDEX: 2016 3 Contents Global Insight 03 Global Insight 08 Stock Exchange Insight 10 Sector Insight 14 Private
PROPOSITION FOR SME COMPANIES
 Wersja robocza NewConnect PROPOSITION FOR SME COMPANIES September 2014 POLAND S KEY POSITION IN THE ENLARGED EU Economy: 25 years ago Poland opened a new chapter in its history and initiated the process
Equity Primary Markets and Trading Report
 Equity Primary Markets and Trading Report European market data update 1H: 217 Association for Financial Markets in Europe www.afme.eu Table of Contents Table of Contents Detailed findings and commentary...
Tim Payne Senior Partner, Head of Asia Brunswick Group. Striking Patterns and Trends Impacting Global M&A
 Tim Payne Senior Partner, Head of Asia Brunswick Group Striking Patterns and Trends Impacting Global M&A Financial 1 The convergence of business, society & politics has created a more complex environment
ManpowerGroup Employment Outlook Survey Global
 ManpowerGroup Employment Outlook Survey Global 1 19 ManpowerGroup interviewed over 6, employers across 44 countries and territories to forecast labor market activity* in January-March 19. All participants
ManpowerGroup Employment Outlook Survey Australia
 ManpowerGroup Employment Outlook Survey Australia 4 218 The ManpowerGroup Employment Outlook Survey for the fourth quarter 218 was conducted by interviewing a representative sample of 1,515 employers in
FTSE Global Equity Index Series
 FTSE Global Equity Index Series THE FTSE GLOBAL EQUITY INDEX SERIES With an unparalleled record of flexibility, transparency, consistent accuracy and the ability to meet any mandate, FTSE indices are already
ManpowerGroup Employment Outlook Survey Hong Kong
 ManpowerGroup Employment Outlook Survey Hong Kong 4 18 Hong Kong Employment Outlook The ManpowerGroup Employment Outlook Survey for the fourth quarter 18 was conducted by interviewing a representative
H & M HENNES & MAURITZ AB SIX-MONTH REPORT
 SIX-MONTH REPORT 2010 H & M HENNES & MAURITZ AB SIX-MONTH REPORT 1 December 2009 31 May 2010 THE FIRST HALF-YEAR The H&M Group s sales excluding VAT during the first six months of the financial year amounted
September Sadakazu Osaki Executive Fellow Nomura Institute of Capital Markets Research
 September 2006 Sadakazu Osaki Executive Fellow Nomura Institute of Capital Markets Research International Reorganization of Stock s - 1 Europe Euronext Proposal for Management Integration NYSE Group United
Global Economic Outlook John Hawksworth Chief Economist, PwC September 2012
 www.pwc.co.uk/economics Global Economic Outlook John Hawksworth Chief Economist, September 2012 Agenda Global overview Short term prospects for Europe, US and BRICs Long term trends: demographics, growth
Quarterly Investment Update First Quarter 2017
 Quarterly Investment Update First Quarter 2017 Market Update: A Quarter in Review March 31, 2017 CANADIAN STOCKS INTERNATIONAL STOCKS Large Cap Small Cap Growth Value Large Cap Small Cap Growth Value Emerging
Order Execution Policy January 2018
 Order Execution Policy January 2018 This policy is applicable to the below LCM entities: LCM Group Louis Capital Markets UK LLP, London LCM products ALL Cash Equities Options on cash/index Option/Future
PRESENTATION OF RESULTS OF WSE GROUP IN 2013 FEBRUARY 2014
 PRESENTATION OF RESULTS OF WSE GROUP IN 2013 FEBRUARY 2014 2013: Year of challenges for WSE Group Reduction of exchange fees, shorter trading session Results: 2013 Net profit: PLN 113.5 mn +6.9% YoY EBITDA
POLICY OF CUSTOMER ORDER IMPLEMENTATION OF UNICREDIT BANKA SLOVENIJA
 POLICY OF CUSTOMER ORDER IMPLEMENTATION OF UNICREDIT BANKA SLOVENIJA d.d. General Terms and Conditions of Conducting Transactions with Financial Instruments of UniCredit Banka Slovenija d.d. SUPPLEMENT