CENTRAL BANK OF LIBERIA (CBL)
|
|
|
- Elfreda Mathews
- 5 years ago
- Views:
Transcription

")


1 CENTRAL BANK OF LIBERIA (CBL) MONTHLY ECONOMIC REVIEW JUNE 2016 VOLUME 2 No. 6
2 The Monthly Economic Review is produced by the Bank s Research, Policy & Planning Department. Inquiries concerning this publication should be addressed to: The Director Research, Policy & Planning Department Central Bank of Liberia P. O. Box 2048 Ashmun & Lynch Streets, Monrovia, Liberia Contacts: / / Fax: 00(231) Table 2: Performances of End-of-Period WAMZ Countries Exchange Rates against the US Dollar Currency May-16 Jun-16 Curr. Unit./US$1 Curr Unit./US$1 M-on-M Rate of Appr (-)/Depr(+) LRD GHC GMD GNF 8, , NGN SLL 6, , Sources: Central Banks of Liberia and WAMA: and LRD Liberian Dollar GHC Ghanaian Cedi GMD Gambian Dalasi GNF Guinean Franc NGN Nigerian Naira SLL Sierra Leonean Leone USD US Dollar GBP British Pound 9
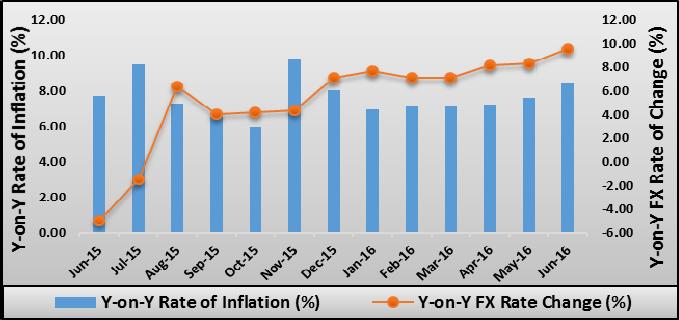
3 Mar-16 Apr-16 May-16 Jun Inflation (In percent) Overall (Year-on-year) Rate of Inflation a. Food and Non-alcoholic Beverages Inflation Domestic Food Inflation Imported Food Inflation b. Transport Inflation c. Imported Fuels Inflation Overall (Month-on-Month) Rate of Inflation Core Inflation Inflation excluding Food & Nonalcoholic Beverages Inflation excluding Imported Food Inflation excluding Domestic Food Inflation excluding Food and Transport Production (Metric Tons) Iron Ore 80, , , ,337 Rubber 2,903 5,724 3, ,500 Cement 28,490 25,406 22,853 17,808 Beverages (In Litres) Alcoholic 1,359,733 1,231,710 1,411, ,899 Non-Alcoholic 920, , , ,341 * US$ converted to L$ ** Other Deposits Include Official and Manager Checks ***The Minimum Capital Adequacy Ratio is 10% ****The Required Minimum Liquidity Ratio is 15% Reserves exclude ECF borrowing from the IMF ± Provisional, Preliminary, Estimate Revised Not Available (NA) /1 Average Monthly prices of Dated Brent, West Texas Intermediate & Dubai Fateh ^With liquidity Effect REAL SECTOR & PRICE DEVELOPMENTS Production Output during the review period experienced uniform declines across all key commodities. Iron ore production declined by 40.7 percent, up from 171,029 metric tons in May 2016 to 101,337 metric tons. The decline was attributed to its falling global market price. Rubber output declined to 2,500 metric ton from 3003 metric tons produced in the preceding period. The fall was informed by its slumping international market price. Cement production trended similarly. There was a decline by 22.1 percent or 5,045 metric tons. The fall in output was explained by the ongoing rainy season during which time construction activities are restrained. Beverages output with likewise pattern saw a decline of 26.2 percent; to 1.7 million litres down from 2.3 million litres produced during the previous period. The decline was generally explained by the fall in the production of alcoholic beverages by 35.8 percent while non-alcoholic beverages declined by 10.3 percent. Consumer Prices Headline inflation during the review period surged by 0.7 percentage points to 8.4 percent, down from 7.7 percent a year ago. The rise in inflation was mainly explained by the current depreciation of the local currency against the US Dollar. Month-on-month analysis shows that the rate of inflation rose by 5.5 percentage points, to 5.2 percent, from negative 0.32 percent in the previous month. The monthly rise in inflation was driven by respective increases in food and nonalcoholic beverages to 4.1 percent (from negative 0.6 percent); and clothing and footwear to 10.7 percent (from negative 2.6 percent). MONETARY DEVELOPMENTS Monetary Policy Stance The CBL monetary policy stance continued to be anchored on price stability through broad exchange rate stability. During the month of June, 2016, the foreign exchange auction was the available tool used by the Bank to broadly stabilize the exchange rate. 8 8 Monetary Aggregates and Credit Overall liquidity (M2) in the Liberian Economy at end-june, 2016 grew by 2.7 percent to L$60,666.5 million, from L$59,080.7 million reported in the preceding month, due mainly to a 3.2 percent surge in Narrow Money Supply (M1), resulting 1
4 from a 3.5 percent and 2.0 percent rise in both demand deposit and currency outside banks, respectively. Net foreign assets (NFA) during the period reportedly rose to US$37,052.3 million, from US$31,698.8 million. The 16.9 percent rise was mainly on account of 15.8 percent growth in foreign assets of the CBL. On the domestic front, net domestic assets (NDA) declined by 13.8 percent, owing to reduction in net credit to Government. Commercial bank loans to private sector in United States dollars increased by 2.5 percent to US$338.9 million, from US$330.5 million, while loans to private sector in Liberian dollars increased by 10.6 percent, respectively, up from L$1,993.4 million to L$2,132.4 million during the review period. Exchange Rate The average Liberian dollar at end-june, 2016 depreciated by 1.6 percent to L$92.9/US$1.00 when compared to the rate recorded in the previous month. Similarly, the end-of-period exchange rate depreciated by 3.3 percent to L$94.5/US$1.00. However, compared to the corresponding month a year ago, the monthly average exchange rate depreciated by 8.9 percent against the US dollar. High demand for foreign exchange couple with net injection of Liberian dollar contributed to the depreciation of the Liberian dollar. In the West African Monetary Zone (WAMZ), all currencies depreciated against the US dollar at end-june, The Nigerian Naira depreciated by 43.3 percent, followed by the Gambian Dalasi, Liberian dollar, Ghanaian Cedis, Sierra Leonean Leone and the Guinean franc all of which fell by 9.4 percent, 3.3 percent, 2.4 percent, 2.0 percent and 0.5 percent, respectively, (Table 2). Money Market Developments Money market operations continued during the month of June, 2016, with a Treasury-bill issuance and a redemption of L$46.9 million and L$45.3 million, respectively. The T-bill operations resulted into a net withdrawal of L$1.6 million from the system. The weighted average discount rate for the month was 4 basis point lower when compared with the previous month. Mar-16 Apr-16 May-16 Jun-16 6 Financial Soundness Indicators (FSI) (In percent) Capital Adequacy Ratio (CAR)*** Non-performing Loans to Total Loans Non-performing Loans (% change) Returns on Assets Returns on Equity (ROE) Liquidity Ratio**** Fiscal Operations 7a Revenue, Expenditure & Debt (Millions of US$) Actual Revenue & Grants Projected Revenue & Grants Expenditure Public Debt Stock Domestic External b Treasury Securities (Millions of L$) T- Bills Issued T- Bills Redeemed Net GoL Treasury Operation^ Average Weighted Discount Rate External Trade (Value) (Millions of US$) 8a Exports/ O/w Iron Ore O/w Rubber O/w Mineral b Imports (F.O.B)/ O/w Petroleum Products O/w Commercial Rice O/w Non commercial Rice Trade Balance External Trade (Volume) (Metric Tons) Rubber 2,903 5,724 3,004 2,499.8 Iron Ore 80, , , ,336.6 Commercial Rice 249,600 ± 4,379 ± 472,926 4,378.9 Non commercial Rice 1,744 ± 3,489 ± 1,744 2,907.2 Petroleum Products 11,328 8,795 8,995 7, Int l Commodity Prices US$/Unit Iron Ore (US$ /MT) Rubber (US$/MT) 1, , , ,580.7 Crude Oil (US$/Barrel)/ Rice (US$/MT) Terms of trade 2 /1 Trade datanow sourced from Customs (LRA) withlargercoverage than BIVAC. 7
5 Table 1: Fact Sheet Mar-16 Apr-16 May-16 Jun-16 1 Monetary (Millions of US$) CBL Net Foreign Exchange Reserves Position (Including SDRs) CBL Gross Foreign Reserves (excluding SDRs) Liberian Dollars in Circulation 10, , , ,925.2 Money Supply (M1) in L$ only 12, , , ,269.4 Broad money (M2) in L$ only 16, , , ,985.1 Broad money (M2) in both L$ and US$* 60, , , ,666.5 (In percent) Liberian Dollar share of Broad Money Interest Rates - Lending rate Average Deposit rates -Savings Time Commercial banks loans to private sector - US$ Commercial banks loans to private sector - L$ 1, , , , Demand Deposits of commercial banks Demand deposits - US$ Demand deposits - L$ 3, , , , Time & Savings Deposits of commercial banks Time & savings deposits - US$ Time & savings deposits - L$ 4, , , , Other Deposits** Actual US$ component of other deposits Liberian $ component of other deposits CBL's Foreign Exchange Auction (Millions of US$) US Dollar Amount Sold Total Subscription Over(+)- / Under(-) Subscription CBL Bills Auction (Millions of L$) Bill Issued Bill Redeemed Personal Remittances (Millions of US$) Inflows Outflows Net flows Exchange Rate End of Period Period Average Banking Sector Developments On account of capital adequacy ratio (CAR) and liquidity position, the banking sector has performed over margin. At end-june, 2016, both the CAR and liquidity ratios of the sector stood high above the minimum required ratios. When compared to the previous month, the capital adequacy and liquidity ratios grew slightly by 0.9 and 2.1 percentage points, respectively. On the other hand, the ratio of non-performing loans to total loan worsened by 20 basis points to 14.6 percent at end-june, 2016, from 14.4 percent recorded during the month of May, 2016 (Table 1). The increasing level of non-performing loan remains a risk to the lending decision of the sector. FISCAL DEVELOPMENTS Revenue (including Grants) & Expenditures Fiscal operations in June, 2016, resulted in a surplus of US$19.0 million, up from a deficit of US$5.8 million recorded in the previous month, explained by month-on-month 31.3 percent growth in actual revenue and grants, coupled with 16.1 percent decline in total public expenditure. Tax and non-tax revenue & grants constituted 59.2 percent and 40.8 percent of total revenue and grants, respectively. Actual revenue and grants rose above budgetary target for the month by US$5.7 million or 9.4 percent. Recurrent and capital expenditure accounted for 89.4 percent and 10.6 percent of total public expenditure for the review month, respectively. Liberia s public debt stock at end-june, 2016, stood at US$ million, reducing by 0.04 percent against the stock of US$ million recorded in the previous month, mainly explained by 0.04 percent reduction in domestic debt stock during the review period. Domestic and external debt stocks constituted 37.4 percent and 62.6 percent of Liberia s total public debt stock at end-june, 2016, respectively (Table 1). EXTERNAL SECTOR DEVELOPMENTS Merchandise Trade At end-june, 2016, merchandise trade, though recorded a deficit, improved by 20 percent to US$80.1 million, from a revised US$100.1 million during the month of May, 2016, attributed to a gain in export proceeds against the decline in import payments (Table 1). 6 3
6 Exports During the month ended June, 2016, export receipts rose by 13.8 percent to US$14.0 million, up from a revised US$12.3 million recorded in the previous month. The rise in export proceeds was largely on account of a 42.5 percent surge in diamond earnings that constituted 23.0 percent of total exports. All major export commodities experienced decline (Table 1). Petroleum (Crude Oil)1 Petroleum price during the period ended June, 2016 surged by 3.7 percent to US$47.7 per barrel, from US$46.0 per barrel reported in May, The rise in the price of the commodity has mainly been due to supply outage influenced by slower production from non-opec countries as well as supply disruption in the Middle East. Imports During the reviewed month, import payments (f.o.b) decreased by 16.3 percent to US$94.4 million, from US$112.4 million recorded during the previous month. The reduction in import payments at end-june, 2016 was mainly attributed to a significant decline in payments on both petroleum products and commercial rice as a result of large stock of unsold inventories of the products (Table 1). Global Commodity Price Review Primary commodity prices for five consecutive months have followed a rising trend. At end-june, 2016, commodity prices rose by 3.1 percent, from a revised 6.3 percent recorded in the preceding month. Like the previous month, the increase in commodity prices was attributed to a 3.7 percent rise in the price of crude oil. Iron ore At end-june, 2016, iron ore price, as was in the previous month, reportedly dropped by 6.4 percent to US$51.4 per metric ton, from US$54.9 per metric ton recorded in the previous month. The decrease in the price of the commodity was due partly to increased supply from Australia coupled with the large stock of inventory in China, a major buyer (Table 1). Food (Rice) Global food price index slightly rose at the end of June, With moderate gains in cereal prices, rice price during the month rose moderately by 2.1 percent to US$417.6 per metric ton, from US$408.8 per metric ton recorded in the preceding month. The rise in the price of the commodity was marked by a continued unfavourable weather condition that had resulted to weak supply in Asia. Gross Foreign Reserves Gross foreign reserves (excluding SDR 2 holdings) of the Central Bank rose by 7.6 percent to US$291.5 million, from US$270.8 million recorded in the previous month. The surge in balances with bank abroad and US dollar notes and coins contributed significantly to the gain in gross foreign reserves position. Balances with Banks abroad constituted 80.8 percent of gross foreign reserves at end-june, Crude oil price is the average of the three global oil price benchmarks: Dated Brent, West Texas Intermediate and Dubai Fateh. 2 Special Drawing Rights Rubber Rubber price for the second time slumped by 5.6 percent to US$1,580.7 per metric ton during June, 2016, from US$1,673.8 per metric ton recorded in the previous month. The reduction in the price of rubber during the month was mainly on account of lowering demand from major buyers of the commodity
CENTRAL BANK OF LIBERIA (CBL)
") CENTRAL BANK OF LIBERIA (CBL) MONTHLY ECONOMIC REVIEW AUG 2016 VOLUME 2 No. 8 The Monthly Economic Review is produced by the Bank s Research, Policy & Planning Department. Inquiries concerning this publication
CENTRAL BANK OF LIBERIA (CBL) MONTHLY ECONOMIC REVIEW AUG 2016 VOLUME 2 No. 8 The Monthly Economic Review is produced by the Bank s Research, Policy & Planning Department. Inquiries concerning this publication
CENTRAL BANK OF LIBERIA (CBL)
") CENTRAL BANK OF LIBERIA (CBL) MONTHLY ECONOMIC REVIEW March 2016 VOLUME 2 No. 3 The Monthly Economic Review is produced by the Bank s Research, Policy & Planning Department. Inquiries concerning this publication
CENTRAL BANK OF LIBERIA (CBL) MONTHLY ECONOMIC REVIEW March 2016 VOLUME 2 No. 3 The Monthly Economic Review is produced by the Bank s Research, Policy & Planning Department. Inquiries concerning this publication
MONTHLY ECONOMIC REVIEW
 MONTHLY ECONOMIC REVIEW MAY, 2017 VOLUME 3 No. 5 4 3 2 1 0 1 2 CENTRAL BANK OF LIBERIA (CBL) Exchange Rate (Change) The Monthly Economic Review is produced by the Bank s Research, Policy & Planning Department.
CENTRAL BANK OF LIBERIA (CBL)
") CENTRAL BANK OF LIBERIA (CBL) MONTHLY ECONOMIC REVIEW JANUARY 2016 VOLUME 2 No. 1 Table 2: Performances of End-of-Period WAMZ Exchange Rates against the US Dollar The Monthly Economic Review is produced
CENTRAL BANK OF LIBERIA (CBL) MONTHLY ECONOMIC REVIEW JANUARY 2016 VOLUME 2 No. 1 Table 2: Performances of End-of-Period WAMZ Exchange Rates against the US Dollar The Monthly Economic Review is produced
CENTRAL BANK OF LIBERIA (CBL)
") CENTRAL BANK OF LIBERIA (CBL) MONTHLY ECONOMIC REVIEW OCT. 2017 VOLUME 3 No. 10 The Monthly Economic Review is produced by the Bank s Research, Policy & Planning Department. Inquiries concerning this publication
CENTRAL BANK OF LIBERIA (CBL) MONTHLY ECONOMIC REVIEW OCT. 2017 VOLUME 3 No. 10 The Monthly Economic Review is produced by the Bank s Research, Policy & Planning Department. Inquiries concerning this publication
CENTRAL BANK OF LIBERIA (CBL)
") CENTRAL BANK OF LIBERIA (CBL) MONTHLY ECONOMIC REVIEW JAN. 2018 VOLUME 4 No. 1 The Monthly Economic Review is produced by Research, Policy & Planning Department of the Central Bank of Liberia. Inquiries
CENTRAL BANK OF LIBERIA (CBL) MONTHLY ECONOMIC REVIEW JAN. 2018 VOLUME 4 No. 1 The Monthly Economic Review is produced by Research, Policy & Planning Department of the Central Bank of Liberia. Inquiries
CENTRAL BANK OF LIBERIA (CBL)
") CENTRAL BANK OF LIBERIA (CBL) MONTHLY ECONOMIC REVIEW JULY. 2017 VOLUME 3 No. 7 The Monthly Economic Review is produced by the Bank s Research, Policy & Planning Department. Inquiries concerning this publication
CENTRAL BANK OF LIBERIA (CBL) MONTHLY ECONOMIC REVIEW JULY. 2017 VOLUME 3 No. 7 The Monthly Economic Review is produced by the Bank s Research, Policy & Planning Department. Inquiries concerning this publication
CENTRAL BANK OF LIBERIA (CBL)
") CENTRAL BANK OF LIBERIA (CBL) MONTHLY ECONOMIC REVIEW DEC. 2017 VOLUME 3 No. 12 The Monthly Economic Review is produced by the Bank s Research, Policy & Planning Department. Inquiries concerning this publication
CENTRAL BANK OF LIBERIA (CBL) MONTHLY ECONOMIC REVIEW DEC. 2017 VOLUME 3 No. 12 The Monthly Economic Review is produced by the Bank s Research, Policy & Planning Department. Inquiries concerning this publication
CENTRAL BANK OF LIBERIA (CBL)
") CENTRAL BANK OF LIBERIA (CBL) MONTHLY ECONOMIC REVIEW SEP. 2017 VOLUME 3 No. 9 The Monthly Economic Review is produced by the Bank s Research, Policy & Planning Department. Inquiries concerning this publication
CENTRAL BANK OF LIBERIA (CBL) MONTHLY ECONOMIC REVIEW SEP. 2017 VOLUME 3 No. 9 The Monthly Economic Review is produced by the Bank s Research, Policy & Planning Department. Inquiries concerning this publication
CENTRAL BANK OF LIBERIA (CBL)
") CENTRAL BANK OF LIBERIA (CBL) MONTHLY ECONOMIC REVIEW 138.00 134.00 130.00 126.00 122.00 118.00 114.00 110.00 106.00 102.00 98.00 94.00 90.00 86.00 Jan Feb Mar Apr May Jun Jul Aug Sep Oct Nov Dec Jan Feb
CENTRAL BANK OF LIBERIA (CBL) MONTHLY ECONOMIC REVIEW 138.00 134.00 130.00 126.00 122.00 118.00 114.00 110.00 106.00 102.00 98.00 94.00 90.00 86.00 Jan Feb Mar Apr May Jun Jul Aug Sep Oct Nov Dec Jan Feb
CENTRAL BANK OF LIBERIA (CBL)
") CENTRAL BANK OF LIBERIA (CBL) MONTHLY ECONOMIC REVIEW JAN. 2019 VOLUME 5 No. 1 The Monthly Economic Review is produced by the Central Bank of Liberia (CBL). Inquiries concerning this publication should
CENTRAL BANK OF LIBERIA (CBL) MONTHLY ECONOMIC REVIEW JAN. 2019 VOLUME 5 No. 1 The Monthly Economic Review is produced by the Central Bank of Liberia (CBL). Inquiries concerning this publication should
CENTRAL BANK OF LIBERIA (CBL)
") CENTRAL BANK OF LIBERIA (CBL) MONTHLY ECONOMIC REVIEW JUN. 2018 VOLUME 4 No. 6 The Monthly Economic Review is produced by the Bank s Research, Policy & Planning Department. Inquiries concerning this publication
CENTRAL BANK OF LIBERIA (CBL) MONTHLY ECONOMIC REVIEW JUN. 2018 VOLUME 4 No. 6 The Monthly Economic Review is produced by the Bank s Research, Policy & Planning Department. Inquiries concerning this publication
CENTRAL BANK OF LIBERIA (CBL)
") CENTRAL BANK OF LIBERIA (CBL) MONTHLY ECONOMIC REVIEW NOV. 2018 VOLUME 4 No. 11 The Monthly Economic Review is produced by the Central Bank of Liberia (CBL). Inquiries concerning this publication should
CENTRAL BANK OF LIBERIA (CBL) MONTHLY ECONOMIC REVIEW NOV. 2018 VOLUME 4 No. 11 The Monthly Economic Review is produced by the Central Bank of Liberia (CBL). Inquiries concerning this publication should
Monetary Policy Report
 CENTRAL BANK OF THE GAMBIA Monetary Policy Report November 20 The Central Bank of The Gambia Monetary Policy Report provides summary of reports presented at the Monetary Policy Committee Meeting. It entails
FINANCIAL FINANCIAL & ECONOMIC & BULLETIN
 FINANCIAL FINANCIAL & ECONOMIC & BULLETIN ECONOMIC BULLETIN VOLUME 19 No. 2 APRIL JUNE, 2018 April - June, 2018 THE FINANCIAL & ECONOMIC BULLETIN is produced by the Bank s Research, Policy and Planning
BANK OF TANZANIA. Monthly Economic Review
 BANK OF TANZANIA Monthly Economic Review February 2011 1 TABLE OF CONTENTS 1.0 Inflation Developments... 3 Food Supply Situation... 5 2.0 Monetary and Financial Markets Developments... 6 Money Supply and
1.0 BANK OF TANZANIA MONTHLY ECONOMIC REVIEW
 1.0 BANK OF TANZANIA MONTHLY ECONOMIC REVIEW April 2016 Contents 1.0 Inflation and Food Supply Situation... 1 1.1 Inflation Developments... 1 1.2 Food Supply Situation... 1 1.3 Prices of Food Crops...
QUARTERLY ECONOMIC REVIEW (QER)
") QUARTERLY ECONOMIC REVIEW (QER) Volume 2 No 4 January - March 2018 OBJECTIVES OF THE CENTRAL BANK OF KENYA The principal objectives of the Central Bank of Kenya (CBK) as established in the CBK Act are:
QUARTERLY ECONOMIC REVIEW (QER) Volume 2 No 4 January - March 2018 OBJECTIVES OF THE CENTRAL BANK OF KENYA The principal objectives of the Central Bank of Kenya (CBK) as established in the CBK Act are:
Monthly Economic Review
 October 214, Volume 8, Issue 1 Outlook for 214 According to the latest estimates from the National Bureau of Statistics, real GDP growth is expected to accelerate to 4.5% in 214, driven mainly by the tourism
Major Highlights. Recent Economic Developments. September/October,2016. Central Bank of Swaziland 1
 September/October,20 Major Highlights The country s headline inflation increased to 8.3 per cent in Septmber 20 from 8.0 per cent in August 20. Inflation rate (% y/y) 8.3 (Sep) Discount and prime rates
Monthly Economic Review
 September 14, Volume 8, Issue 9 Outlook for 14 According to the latest estimates from the National Bureau of Statistics, real GDP growth is expected to accelerate to 4.5% in 14, driven mainly by the tourism
Monthly Economic Review
 November 14, Volume 8, Issue 11 Outlook for 15 According to revised estimates of the National Bureau of Statistics, real GDP 1 growth is projected to accelerate to 1.5% in 15, up from 8.5% in 14, driven
1 RED July/August 2018 JULY/AUGUST 2018
 1 RED July/August 20 JULY/AUGUST 20 2 RED July/August 20 MAJOR HIGHLIGHTS The country s annual consumer inflation remained unchanged at 4.9 per cent in July 20 same as in June 20. Inflation rate (% y/y)
MONTHLY ECONOMIC REVIEW
 April 218 a BANK OF TANZANIA MONTHLY ECONOMIC REVIEW April 218 b April 218 April 218 i Contents 1. Inflation and Food Stocks... 1 1.1 Inflation Developments... 1 1.2 Food Stocks... 2 1.3 Prices of Food
PERFORMANCE OF ECONOMY REPORT December 2017
 PERFORMANCE OF ECONOMY REPORT December 2017 MACROECONOMIC POLICY DEPARTMENT MINISTRY OF FINANCE PLANNING AND ECONOMIC DEVELOPMENT www.finance.go.ug TABLE OF CONTENTS LIST OF ACRONYMS... 3 HIGHLIGHTS...
1.0 BANK OF TANZANIA MONTHLY ECONOMIC REVIEW
 1.0 BANK OF TANZANIA MONTHLY ECONOMIC REVIEW October 2016 Contents 1.0 Inflation and Food Supply Situation... 1 1.1 Inflation Developments... 1 1.2 Food Supply Situation... 2 1.3 Prices of Food Crops...
PERFORMANCE OF THE ECONOMY REPORT NOVEMBER 2017
 PERFORMANCE OF THE ECONOMY REPORT NOVEMBER 2017 MACROECONOMIC POLICY DEPARTMENT MINISTRY OF FINANCE, PLANNING AND ECONOMIC DEVELOPMENT www.finance.go.ug Table of Contents SUMMARY... 2 REAL SECTOR DEVELOPMENTS...
MONTHLY ECONOMIC REVIEW
 MONTHLY ECONOMIC REVIEW 11111111 111111 111111 111111 1111 111111 1111 1111 111 111 11 11 1 Volume 9 Issue 2 Outlook for 15 According to revised estimates of the National Bureau of Statistics, real GDP
Monthly Economic and Financial Developments February 2007
 Release Date: 3 April Monthly Economic and Financial Developments February In an effort to provide the public with more frequent information on its economic surveillance activities, the Central Bank has
MONTHLY ECONOMIC REVIEW
 February 218 a BANK OF TANZANIA MONTHLY ECONOMIC REVIEW February 218 b February 218 February 218 i Contents 1. Inflation and Food Stocks... 1 1.1 Inflation Developments... 1 1.2 Food Stocks... 1 1.3 Prices
Monthly Report PERFORMANCE OF THE ECONOMY SEPTEMBER 2017 MACROECONOMIC POLICY DEPARTMENT MINISTRY OF FINANCE, PLANNING AND ECONOMIC DEVELOPMENT
 Monthly Report PERFORMANCE OF THE ECONOMY SEPTEMBER 2017 MACROECONOMIC POLICY DEPARTMENT MINISTRY OF FINANCE, PLANNING AND ECONOMIC DEVELOPMENT www.finance.go.ug Table of Contents SUMMARY... 1 REAL SECTOR...
1 RED September/October 2018 SEPTEMBER/OCTOBER 2018
 1 RED September/October 20 SEPTEMBER/OCTOBER 20 2 RED September/October 20 MAJOR HIGHLIGHTS The country s annual consumer inflation grew by 0.2 percentage points to reach 5.1 per cent in September 20,
Quarterly Economic Review
 Central Bank of Kenya Quarterly Economic Review April - June 2016 Volume 1 No. 2 OBJECTIVES OF THE CENTRAL BANK OF KENYA The principal objectives of the Central Bank of Kenya (CBK) as established in the
MONETARY POLICY COMMITTEE STATEMENT FOR THIRD QUARTER Governor s Presentation to the Media. 22 nd November, 2017
 1 MONETARY POLICY COMMITTEE STATEMENT FOR THIRD QUARTER 2017 Governor s Presentation to the Media 22 nd November, 2017 INTRODUCTION 2 The presentation is structured as follows: 1. Decision of the Monetary
Bank of Ghana Monetary Policy Committee Press Release
 Bank of Ghana Monetary Policy Committee Press Release November 26, 2018 Ladies and Gentlemen of the Press, welcome to this morning s press conference following the 85th regular meeting of the Monetary
1.0 INFLATION DEVELOPMENTS...
 BANK OF TANZANIA Monthly Economic Review November 2009 1 TABLE OF CONTENTS 1.0 INFLATION DEVELOPMENTS... 3 FOOD SUPPLY SITUATION... 5 2.0 MONETARY AND FINANCIAL DEVELOPMENTS... 6 MONEY SUPPLY AND CREDIT
1 RED June/July 2018 JUNE/JULY 2018
 1 RED June/July 20 JUNE/JULY 20 2 RED June/July 20 MAJOR HIGHLIGHTS Headline consumer inflation grew by 4.9 per cent in June 20 compared to 4.8 per cent recorded in May 20 Inflation rate (% y/y) 4.9 (June)
Major Highlights. Recent Economic Developments April/May Central Bank of Swaziland 1
 Major Highlights Annual consumer inflation increased to 7.0 per cent in April 2017 from 6.0 per cent in March 2017. Inflation rate (% y/y) 7.0 (Apr) Discount and prime lending rates remained unchanged
MONTHLY ECONOMIC REVIEW
 October 217 a BANK OF TANZANIA MONTHLY ECONOMIC REVIEW October 217 b October 217 October 217 i Contents 1. Inflation and Food Stocks... 1 1.1 Inflation Developments... 1 1.2 Food Stocks... 1 1.3 Prices
Current Macroeconomic Situation of Nepal
 Current Macroeconomic Situation of Nepal (Based on the Four Months' Data of FY 2012/13) Monetary Situation Money Supply 1. Broad money supply (M2) increased by 4.0 percent during the four months of the
Monthly Report PERFORMANCE OF THE ECONOMY. May 2017 MACROECONOMIC POLICY DEPARTMENT MINISTRY OF FINANCE, PLANNING AND ECONOMIC DEVELOPMENT
 Monthly Report PERFORMANCE OF THE ECONOMY May 2017 MACROECONOMIC POLICY DEPARTMENT MINISTRY OF FINANCE, PLANNING AND ECONOMIC DEVELOPMENT www.finance.go.ug Table of Contents SUMMARY:... 1 REAL SECTOR DEVELOPMENTS:...
EC ONO MI C BU LLE TIN
 BANK OF TANZANIA EC ONO MI C BU LLE TIN FOR THE QUARTER ENDING ECONOMIC SEPTEMBER BULLETIN 2018 VOL. L NO. 3 FOR THE QUARTER ENDING SEPTEMBER 2018 VOL. L NO. 3 For any inquiry please contact: Director
MONETARY POLICY COMMITTEE STATEMENT FOR FIRST QUARTER Governor s Presentation to the Media. 16 th May, 2018
 1 MONETARY POLICY COMMITTEE STATEMENT FOR FIRST QUARTER 2018 Governor s Presentation to the Media 16 th May, 2018 INTRODUCTION 2 The presentation is structured as follows: 1. Decision of the Monetary Policy
Nepal Rastra Bank Central Office. Current Macroeconomic Situation of Nepal
 Nepal Rastra Bank Central Office Current Macroeconomic Situation of Nepal (Based on the Annual Data of FY 2013/14) Real Sector Gross Domestic Product 1. According to the preliminary estimates of Central
Saudi Arabian economy
 Research Department ARC Research Team Tel 966 11 211 9370, research@alrajhi-capital.com Saudi Arabian economy Saudi Arabian Economy The IMF executive board maintained the Kingdom s real GDP growth outlook
Monthly Economic and Financial Developments April 2006
 Release Date: 30 May Monthly Economic and Financial Developments April In an effort to provide the public with more frequent information on its economic surveillance activities, the Central Bank has decided
AsianBondsOnline WEEKLY DEBT HIGHLIGHTS
 AsianBondsOnline WEEKLY 9 January 7 asianbondsonline.adb.org Key Developments in Asian Local Currency Markets Consumer price inflation in Indonesia eased to.% year-on-year (y-o-y) in December from.6% y-o-y
EC ONO MI C BU LLE TIN FOR THE QUARTER ENDING MARCH 2017 VOL. XLIX NO. 1
 EC ONO MI C BU LLE TIN FOR THE QUARTER ENDING MARCH 2017 VOL. XLIX NO. 1 86 BANK OF TANZANIA ECONOMIC BULLETIN FOR THE QUARTER ENDING MARCH 2017 VOL. XLIX NO. 1 For any inquiry please contact: Director
Current Macroeconomic Situation (Based on the First Three Month's Data of 2009/10)
") Current Macroeconomic Situation (Based on the First Three Month's Data of 2009/10) Monetary Situation Money Supply 1. Broad money (M2) increased by 4.6 percent in the first three months of 2009/10. M2
Current Macroeconomic Situation (Based on the First Three Month's Data of 2009/10) Monetary Situation Money Supply 1. Broad money (M2) increased by 4.6 percent in the first three months of 2009/10. M2
Nepal Rastra Bank Research Department
 Nepal Rastra Bank Research Department Current Macroeconomic and Financial Situation of Nepal Macroeconomic Outlook (Based on Three Months' Data of 2017/18) 1. Macroeconomic data available so far suggest
MONTHLY ECONOMIC REVIEW
 March 218 a BANK OF TANZANIA MONTHLY ECONOMIC REVIEW March 218 b March 218 March 218 i Contents 1. Inflation and Food Stocks... 1 1.1 Inflation Developments... 1 1.2 Food Stocks... 1 1.3 Prices of Food
MONTHLY ECONOMIC REVIEW
 October 218 a BANK OF TANZANIA MONTHLY ECONOMIC REVIEW October 218 b October 218 October 218 i Contents 1. Inflation and Food Stocks... 1 1.1 Inflation Developments... 1 1.2 Food Stocks... 1 1.3 Prices
WEST AFRICAN MONETARY AGENCY (WAMA) Report on Developments in the Exchange Rates of ECOWAS Currencies as at end November 2011
 Report on Developments in the Exchange Rates of ECOWAS Currencies as at end November 2011") WEST AFRICAN MONETARY AGENCY (WAMA) Report on Developments in the Exchange Rates of ECOWAS Currencies as at end November 2011 Freetown, December 2011 Introduction The stabilization of ECOWAS currencies
WEST AFRICAN MONETARY AGENCY (WAMA) Report on Developments in the Exchange Rates of ECOWAS Currencies as at end November 2011 Freetown, December 2011 Introduction The stabilization of ECOWAS currencies
SELECTED ECONOMIC INDICATORS... 2 INTERNATIONAL COMMODITY PRICE DEVELOPMENTS... 3 MERCHANDISE TRADE DEVELOPMENTS... 4 MONETARY DEVELOPMENTS...
 JUNE i TABLE OF CONTENTS SELECTED ECONOMIC INDICATORS... 2 INTERNATIONAL COMMODITY PRICE DEVELOPMENTS... 3 MERCHANDISE TRADE DEVELOPMENTS... 4 MONETARY DEVELOPMENTS... 7 STOCK MARKET DEVELOPMENTS... 8
Nepal Rastra Bank Research Department
 Nepal Rastra Bank Research Department Current Macroeconomic and Financial Situation of Nepal (Based on Nine Months' Data of 2017/18) Macroeconomic Outlook 1. As per the recent release of national accounts
Caleb M Fundanga: Fourth quarter 2010 media briefing
 Caleb M Fundanga: Fourth quarter 2010 media briefing Presented by Dr Caleb M Fundanga, Governor of the Bank of Zambia, Lusaka, 18 February 2011. * * * Executive summary 1. This brief examines monetary
QUARTERLY ECONOMIC REVIEW (QER)
") QUARTERLY ECONOMIC REVIEW (QER) Volume 3 No 3 July - September 2018 OBJECTIVES OF THE CENTRAL BANK OF KENYA The principal objectives of the Central Bank of Kenya (CBK) as established in the CBK Act are:
QUARTERLY ECONOMIC REVIEW (QER) Volume 3 No 3 July - September 2018 OBJECTIVES OF THE CENTRAL BANK OF KENYA The principal objectives of the Central Bank of Kenya (CBK) as established in the CBK Act are:
MONTHLY ECONOMIC REVIEW
 September 218 a BANK OF TANZANIA MONTHLY ECONOMIC REVIEW September 218 b September 218 September 218 i Contents 1. Inflation and Food Stocks... 1 1.1 Inflation Developments... 1 1.2 Food Stocks... 1 1.3
Press Release December adjustment of monetary policy, allowed for a substantial reduction in new credit to Government by the Central Bank.
 Press Release December 2017 Overview During 2017, the Barbados economy continued to face significant macroeconomic challenges associated with declining international reserves, weak public finances and
Nepal Rastra Bank Research Department
 Nepal Rastra Bank Research Department Current Macroeconomic and Financial Situation of Nepal (Based on Two Months' Data of 2016/17) Economic Outlook 1. Summer crops are expected to improve on account ample
Nepal Rastra Bank. Research Department. Current Macroeconomic and Financial Situation of Nepal. (Based on Eleven Months' Data of 2016/17)
") Nepal Rastra Bank Research Department Current Macroeconomic and Financial Situation of Nepal Macrofinancial Outlook (Based on Eleven Months' Data of 2016/17) 1. Developments in four areas relating to weather,
Nepal Rastra Bank Research Department Current Macroeconomic and Financial Situation of Nepal Macrofinancial Outlook (Based on Eleven Months' Data of 2016/17) 1. Developments in four areas relating to weather,
Monthly Economic and Financial Developments January 2013
 Release Date: 8 March 2013 Monthly Economic and Financial Developments January 2013 In an effort to provide the public with more frequent information on its economic surveillance activities, the Central
WEST AFRICAN MONETARY AGENCY (WAMA) Developments in the Exchange Rates of ECOWAS Currencies as at End November 2012
 Developments in the Exchange Rates of ECOWAS Currencies as at End November 2012") WEST AFRICAN MONETARY AGENCY (WAMA) Developments in the Exchange Rates of ECOWAS Currencies as at End November 2012 Freetown, December 2012 TABLE OF CONTENTS I. Introduction... 2 II. Trends in the Exchange
WEST AFRICAN MONETARY AGENCY (WAMA) Developments in the Exchange Rates of ECOWAS Currencies as at End November 2012 Freetown, December 2012 TABLE OF CONTENTS I. Introduction... 2 II. Trends in the Exchange
Sri Lanka: Recent Economic Trends. January 2018
 Sri Lanka: Recent Economic Trends January 2018 1 Agenda Summary Economic Growth Inflation and Monetary Policy External Account Fiscal Scenario of Government of Sri Lanka ICRA Lanka Limited 2 2 Agenda Summary
SACU INFLATION REPORT. February 2016
 SACU INFLATION REPORT February 2016 The content of this publication is intended for general information only. While precaution is taken to ensure the accuracy of information, the SACU Secretariat shall
Current Macroeconomic Situation (Based on the first eight months' data of 2007/08)
") Current Macroeconomic Situation (Based on the first eight months' data of 2007/08) Money Situation Overall Liquidity 1. In the first eight months of 2007/08, broad money (M 2 ) increased by 13.5 percent
Current Macroeconomic Situation (Based on the first eight months' data of 2007/08) Money Situation Overall Liquidity 1. In the first eight months of 2007/08, broad money (M 2 ) increased by 13.5 percent
FINANCIAL & ECONOMIC BULLETIN
 FINANCIAL & ECONOMIC BULLETIN VOLUME 14 No. 4 OCTOBER DECEMBER, 2013 October December, 2013 THE FINANCIAL & ECONOMIC BULLETINis produced by the Bank s Research, Policy and Planning Department. Inquiries
Selected Economic Indicators International Commodity Prices Merchandise Trade Developments Monetary Developments...
 DECEMBER i TABLE OF CONTENTS Selected Economic Indicators... 2 International Commodity Prices... 3 Merchandise Trade Developments... 4 Monetary Developments... 6 Stock Market Developments... 7 Inflation
SACU INFLATION REPORT. October 2018
 SACU INFLATION REPORT October 2018 The content of this publication is intended for general information only. While precaution is taken to ensure the accuracy of information, the SACU Secretariat shall
EC ONO MI C BU LLE TIN
 BANK OF TANZANIA EC ONO MI C BU LLE TIN FOR THE QUARTER ENDING ECONOMIC JUNE 2018 BULLETIN VOL. L NO. 2 FOR THE QUARTER ENDING JUNE 2018 VOL. L NO. 2 For any inquiry please contact: Director of Economic
BANK of ZAMBIA MONETARY POLICY STATEMENT
 BANK of ZAMBIA MONETARY POLICY STATEMENT JANUARY - JUNE 2013 Bank of Zambia Mission Statement The principal purpose of the Bank of Zambia is to formulate and implement monetary and supervisory policies
EC ONO MI C BU LLE TIN FOR THE QUARTER ENDING DECEMBER 2018 VOL. L NO. 4
 EC ONO MI C BU LLE TIN FOR THE QUARTER ENDING DECEMBER 2018 VOL. L NO. 4 80 BANK OF TANZANIA ECONOMIC BULLETIN FOR THE QUARTER ENDING DECEMBER 2018 VOL. L NO. 4 For any inquiry please contact: Director
CONTENTS OVERVIEW 2-3 PART I MONETARY DEVELOPMENTS 4. (1.0) Monetary Policy.. 4. (2.0) Money Supply Growth.. 4. (2.1) Components of Money Supply 4
 Monetary Policy.. 4. (2.0) Money Supply Growth.. 4. (2.1) Components of Money Supply 4") CONTENTS OVERVIEW 2-3 PART I MONETARY DEVELOPMENTS 4 (1.0) Monetary Policy.. 4 (2.0) Money Supply Growth.. 4 (2.1) Components of Money Supply 4 (2.2) Determinants of Money Supply 6 (a) Net Foreign Assets
CONTENTS OVERVIEW 2-3 PART I MONETARY DEVELOPMENTS 4 (1.0) Monetary Policy.. 4 (2.0) Money Supply Growth.. 4 (2.1) Components of Money Supply 4 (2.2) Determinants of Money Supply 6 (a) Net Foreign Assets
BANK OF UGANDA MONTHLY ECONOMIC REVIEW
 BANK OF UGANDA MONTHLY ECONOMIC REVIEW JANUARY 2010 MONTHLY REPORT ON ECONOMIC AND MONETARY DEVELOPMENTS AS AT December 30, 2009 RESEARCH DEPARTMENT BANK OF UGANDA ii TABLE OF CONTENTS TABLE OF CONTENTS.i
EC ONO MI C BU LLE TIN FOR THE QUARTER ENDING DECEMBER 2017 VOL. XLIX NO. 4
 EC ONO MI C BU LLE TIN FOR THE QUARTER ENDING DECEMBER 2017 VOL. XLIX NO. 4 BANK OF TANZANIA ECONOMIC BULLETIN FOR THE QUARTER ENDING DECEMBER 2017 VOL. XLIX NO. 4 For any inquiry please contact: Director
SACU INFLATION REPORT. February 2017
 SACU INFLATION REPORT February 2017 The content of this publication is intended for general information only. While precaution is taken to ensure the accuracy of information, the SACU Secretariat shall
Nepal Rastra Bank Research Department
 Nepal Rastra Bank Research Department Current Macroeconomic and Financial Situation of Nepal Macroeconomic Outlook (Based on Two Months' Data of 2017/18) 1. Notwithstanding the damage caused by flood to
Nepal Rastra Bank Research Department
 Nepal Rastra Bank Research Department Current Macroeconomic and Financial Situation of Nepal (Based on Eight Months' Data of 2017/18) Macroeconomic Outlook 1. The data available so far indicate a mixed
Pre-budget economic analysis Key facts and figures
 Pre-budget economic analysis Key facts and figures June 2008 Advisory Table of Contents Page 1 Macro-economic overview 1 2 External sector 10 3 Government finance 16 Appendix 1 - Glossary 21 Section 1
MID-TERM REVIEW OF THE 2014 MONETARY POLICY STATEMENT
 MID-TERM REVIEW OF THE 2014 MONETARY POLICY STATEMENT 1. INTRODUCTION 1.1 The Mid-Term Review (MTR) of the 2014 Monetary Policy Statement (MPS) examines recent price developments and reviews key financial
Selected Economic Indicators International Commodity Prices Merchandise Trade Developments Monetary Developments...
 NOVEMBER i TABLE OF CONTENTS Selected Economic Indicators... 2 International Commodity Prices... 3 Merchandise Trade Developments... 4 Monetary Developments... 6 Stock Market Developments... 7 Inflation
Nepal Rastra Bank Research Department
 Nepal Rastra Bank Research Department Current Macroeconomic and Financial Situation of Nepal (Based on Eleven Months' Data of 2015/16) Growth Outlook 1. The available data from different parts of the country
CONTENTS. 2. Implementation of monetary policy Inflation Money market Capital market... 10
 CONTENTS 1. Monetary developments... 3 1.1. Factors affecting the development of the money supply... 3 1.2. Structure of the money supply... 5 1.3. Bank lending... 6 1.4. Interest rate development in October
Monthly Report PERFORMANCE OF THE ECONOMY JUNE 2018 MACROECONOMIC POLICY DEPARTMENT MINISTRY OF FINANCE, PLANNING AND ECONOMIC DEVELOPMENT
 Monthly Report PERFORMANCE OF THE ECONOMY JUNE 2018 MACROECONOMIC POLICY DEPARTMENT MINISTRY OF FINANCE, PLANNING AND ECONOMIC DEVELOPMENT www.finance.go.ug Table of Contents SUMMARY... 1 REAL SECTOR DEVELOPMENTS...
Saudi Arabian Economy
 Saudi Arabian Economy Economic Research Research Department ARC Research Team, Tel. +966 1 211 9370, devassyp@alrajhi-capital.com Saudi economy continues to improve The recent data released by SAMA indicates
Reserve Bank of Malawi. Monthly Economic Review
 Reserve Bank of Malawi Monthly Economic Review November 2018 Table of Contents 1.0 INTRODUCTION... 1 1.1 Gross Official Reserves... 1 1.2 Exchange Rates... 1 1.3 Money Supply... 1 1.4 Interest Rates...
Reserve Bank of Malawi. Monthly Economic Review
 Reserve Bank of Malawi Monthly Economic Review September 2018 Table of Contents 1.0 INTRODUCTION... 1 1.1 Gross Official Reserves... 1 1.2 Exchange Rates... 1 1.3 Money Supply... 1 1.4 Interest Rates...
Item
 256 POPULATION Total population million; as of 1 July 42.9 45.1 47.0 47.6 47.9 48.0 48.1 48.3 Population density persons per square kilometer 432 454 473 487 490 492 494 487 Population annual change, %
monetary policy monthly report
 monetary policy monthly report Current and expected inflation performance and monetary policy SUMMARY Inflation highlights Annual inflation rate of recorded +3.2 percent, the highest upward trend of this
KGkh BANK OF TANZANIA MONTHLY ECONOMIC REVIEW
 KGkh BANK OF TANZANIA MONTHLY ECONOMIC REVIEW June 218 Contents 1. Inflation and Food Stocks... 1 1.1 Inflation Developments... 1 1.2 Food Stocks... 1 1.3 Prices of Food Crops... 2 2. Monetary and Financial
QUARTERLY ECONOMIC REVIEW (QER)
") QUARTERLY ECONOMIC REVIEW (QER) Volume 2 No 5 April - June 2018 OBJECTIVES OF THE CENTRAL BANK OF KENYA The principal objectives of the Central Bank of Kenya (CBK) as established in the CBK Act are: 1)
QUARTERLY ECONOMIC REVIEW (QER) Volume 2 No 5 April - June 2018 OBJECTIVES OF THE CENTRAL BANK OF KENYA The principal objectives of the Central Bank of Kenya (CBK) as established in the CBK Act are: 1)
Nepal Rastra Bank Research Department
 Nepal Rastra Bank Research Department Current Macroeconomic and Financial Situation of Nepal (Based on Six Months' Data of 2016/17) Macroeconomic Outlook 1. The current macroeconomic indicators show the
SACU INFLATION REPORT. December 2017
 SACU INFLATION REPORT December 20 The content of this publication is intended for general information only. While precaution is taken to ensure the accuracy of information, the SACU Secretariat shall not
2.1 Supply. Nominal Farm Income. Bank of Thailand, October 2017
 Bank of Thailand, October 2.1 Supply Farm income contracted from both decreased agricultural prices and output. Manufacturing production remained unchanged from the same period last year. The overall services
PERU. 1. General trends
 Economic Survey of Latin America and the Caribbean 2015 1 PERU 1. General trends Peru s gross domestic product (GDP) grew by 2.4% in 2014, compared with 5.8% in 2013. This slowdown was due mainly to the
Mauritius Economy Update October 2013
 October 28, 2013 Economics Mauritius Economy Update October 2013 Mauritius, a tropical island situated towards the south east coast of Africa comprises 9 districts Flacq, Grand port, Moka, Pamplemousses,
Current Macroeconomic Situation (Based on the First Six Months' Data of 2007/08)
") Current Macroeconomic Situation (Based on the First Six Months' Data of 2007/08) Monetary Situation Money Supply 1. Broad money (M2) registered a growth of 10.4 percent in the first six months of 2007/08
Current Macroeconomic Situation (Based on the First Six Months' Data of 2007/08) Monetary Situation Money Supply 1. Broad money (M2) registered a growth of 10.4 percent in the first six months of 2007/08
Review of the Economy. E.1 Global trends. January 2014
 Export performance was robust during the third quarter, partly on account of the sharp depreciation in the exchange rate of the rupee and partly on account of a modest recovery in major advanced economies.
Japan's Balance of Payments for August 2009 International Department Bank of Japan
 Japan's Balance of Payments for 28 August 29 International Department Bank of Japan This is an English translation of the Japanese original released on March 24, 29 Balance of Payments 28 Please contact
SACU INFLATION REPORT. January 2017
 SACU INFLATION REPORT January 2017 The content of this publication is intended for general information only. While precaution is taken to ensure the accuracy of information, the SACU Secretariat shall