Greater London Labour Market Intelligence 2006
|
|
|
- Wilfrid Nelson
- 5 years ago
- Views:
Transcription
1 Greater London Labour Market Intelligence 2006
2 Contents 1 The headlines 1 2 Introduction 2 3 The current situation 4 4 The outlook for construction 9 5 Construction industry employment requirements 12 APPENDICES I. Glossary of terms II. Note on Logistics and Other Civil Engineering Operatives III. Data Sources Construction Skills Network Model IV. Footprints for the Built Environment SSCs This document provides labour market intelligence for Greater London and also includes national UK data. Similar reports have been produced for the other English regions and for Scotland, Wales and Northern Ireland. These reports are all available upon request from ConstructionSkills. The document replaces the Skills Foresight Report that was previously published annually for Greater London. This new Labour Market Intelligence Report links into the work of the Construction Skills Network. For information on the numbers of people currently entering construction training, as well as workload and recruitment difficulties being experienced by the industry, this report should be read in conjunction with the CITB-ConstructionSkills Trainee Numbers Survey and Employers Skills Needs Survey Reports. Future papers and briefings that reconcile the employment forecasts with the results from these other ConstructionSkills surveys will be published through the Network. Similarly, the Network will produce discussion papers that compare the differences between the Construction Skills Network forecasts with those published from other sources. A glossary of terms used in this document is provided in Appendix I. Supplementary information, including the CITB-ConstructionSkills Employers Skills Needs Survey and Trainee Numbers Survey, is available on the ConstructionSkills website at: Extra resources for members of the Construction Skills Network are available at:
3 1 The headlines Across the UK, total employment in the construction industry is expected to rise by approximately 250,000 to 2.8 million during the forecast period ( ). Total employment in the Greater London construction industry is expected to increase by approximately 11% during the forecast period. In Greater London, the average annual employment requirement for SIC 45 * (Construction) is 7,530. A large Average Annual Requirement in Architects & Technical Engineers (SIC 74.2 * ) of 1,990 means that the Average Annual Requirement for both SIC 45 and 74.2 combined is 9,520. The greatest Average Annual Requirement in Greater London will be for Architects & Technical Engineers, which is estimated at 1,990. Nationally, Wood Trades is forecast to have the greatest requirement at 11,090, and in Greater London it has the fifth largest requirement at 800. Construction output in Greater London is estimated to have declined in 2005 by around 5%. Falls are expected in both new work and repair and maintenance (R&M), by 6% and 3%, respectively. Going forward, prospects for the new work sector are set to improve but the decline in R&M output is forecast to be more prolonged. In contrast with the recent past, infrastructure is forecast to be the strongest sub-sector in Greater London between 2006 and From 2007 double-digit growth is expected as work begins on a number of sizeable road and rail schemes. An additional boost from work directly attributable to the 2012 Olympic Games is also expected post Greater London s economy expanded robustly in 2004, increasing by 3.2% over the year as a whole. In 2005, economic growth was much more subdued and Gross Value Added (GVA) is estimated to have risen by just 1.6%. Slower activity resulted from lacklustre growth in private services and a contraction in manufacturing. Over the short term, a sharp downturn in distribution, hotels and catering will constrain more robust expansion in other areas of the economy. By 2008, year-on-year growth is forecast at a steady 3.2% and is expected to be maintained for the remainder of the forecast period. * For definitions and a list of SIC Codes covered by ConstructionSkills see Appendices I & IV 1
4 2 Introduction Background CITB-ConstructionSkills, CIC and CITB(NI) are working in partnership as the Sector Skills Council (SSC) for Construction. The Construction Skills Network, launched in 2005, represents a radical change in the way that ConstructionSkills will collect and produce information on the future employment and training needs of the industry. The model generates forecasts of recruitment and training requirements within the industry for a range of trades and will provide a crucial foundation on which to plan for future skills needs and target investment. The Construction Skills Network functions at both national and regional levels, comprising a National Group, 12 Observatory groups, a redesigned model and a Technical Reference Group. The Observatories consist of key stakeholders invited from industry, government, education and other SSCs who can contribute local knowledge of the industry and views on training, skills, recruitment, qualifications and policy. An Observatory group currently operates in each of the nine English regions and also in Wales, Scotland and Northern Ireland (note that in the context of the model, Wales, Scotland and Northern Ireland are hereafter referred to as regions ). The input of the members of the Construction Skills Network is fundamental to the forecasting process and the contributions made to date have been invaluable. The model approach The new model approach relies on a combination of primary research and views from the Construction Skills Network to facilitate it. National data were used as the basis for the assumptions that augment the model, which was then adjusted with the assistance of the Observatories and National Group. Each region has a separate model (although all models are inter-related due to labour movements) and, in addition, there is one national UK model that acts as a constraint to the regional models and enables best use to be made of the most robust data (which is available at the national level). Each model considers the skilled trades within the industry as well as the professionals. The models work by forecasting demand and supply of skilled workers separately. The difference between demand and supply forms the employment requirement. The forecast total employment levels are derived from expectations about construction output and productivity. Essentially this is based on the question "How many people will be needed to produce forecast output, given the assumptions made about productivity?" The Average Annual Requirement is a gross requirement which takes into account the dynamic factors that influence all of the flows into and out of construction employment, such as movement to and from other industries, migration, sickness, and retirement. Young trainees are not included in the flows. Therefore, the Average Annual Requirement provides an indication of the number of new employees that would need to be recruited into construction each year in order to realise forecast output. How the Average Annual Requirement is fulfilled can range from training the indigenous population to recruiting already skilled labour from overseas and will vary across the UK. At present the model does not separately forecast the numbers requiring top-up training although data are being collected and these figures should be included in future publications. Demand is based upon the results of discussion groups comprising industry experts, an econometric model of construction output and a set of integrated models relating to wider regional economic performance. The model is dynamic and reflects the general UK economic climate at any point in time. To generate the labour demand, the model makes use of a set of specific statistics for each major type of work (labour coefficients) that determine the employment, by trade, needed to produce the predicted levels of construction output. 2
5 The labour supply for each type of trade or profession is based upon the previous years supply (the total stock of employment) combined with flows into and out of the labour market. The key leakages (outflows) that need to be considered are: transfers to other industries international/domestic OUT migration permanent retirements (including permanently sick) outflow to temporarily sick and home duties. The main reason for outflow is likely to be transfer to other industries. Flows into the labour market include: transfers in from other industries international/domestic IN migration inflow from temporarily sick and home duties. New entrants (e.g. young trainees attached to formal training programmes) are not included in the flows of the labour market but are derived from the forecasted Average Annual Requirement for employment. The most significant inflow is likely to be from other industries. A summary of the model components is shown in Figure 1. Figure 1 Model flowchart The flows into the market are not merely the counterbalancing figures for the flows out of the market, because those people flowing into the market are likely to require some form of training. It is likely that this training will merely be to top-up their skills, rather than full training. The model recognises two distinct types of training as an input: Top-up training and Full training. 3
6 3 The current situation Economic overview Greater London is the largest regional economy in the UK. In 2005, GVA is estimated at 178.2bn (in 2002 prices), accounting for 18% of UK GVA. Structurally, the Greater London economy is highly geared towards the service sector. Particularly large is the region s financial and business services sector, which contributes around 47% of total GVA compared to 25% of total output nationally. Unsurprisingly, manufacturing takes a relatively small share of output. Greater London is home to 13% of the UK population. Estimated at 23,800, GVA per capita in the region is well above the UK average of 17,258. Economic performance and expectations The macroeconomic forecasts for Greater London are summarised in Table 1. Greater London s economy expanded robustly in 2004, increasing by 3.2% over the year as a whole. In 2005, economic growth was much more subdued and GVA is estimated to have risen by just 1.6%. Slower activity resulted from lacklustre growth in private services and a contraction in manufacturing. Over the short term, a sharp downturn in distribution, hotels and catering will constrain more robust expansion in other areas of the economy. By 2008 yearon-year growth is forecast at a steady 3.2%, and is expected to be maintained for the remainder of the forecast period. Reflecting weaker growth in the service sector in 2005, total employment in Greater London is forecast to rise only marginally in As with output growth, any slowdown in job creation is expected to be short lived and by 2007 total employment should be increasing at around 0.8% per year. Over the medium term, Greater London is forecast to record the strongest rate of job creation, mainly due to the strength of financial and business services. Greater London endured a marked consumer slowdown in 2004, with real household disposable income increasing by just 0.7%. Estimates for 2005 are more optimistic and by 2010 growth in real household disposable income is expected to be around 2.8%. Table 1 Macroeconomic forecasts for Greater London EXPERIAN BUSINESS STRATEGIES FORECASTS FOR GREATER LONDON % change (except unemployment) Gross Value Added Total employment Unemployment rate (ILO) Real household disposable income Source: Experian. 4
7
8
9
10
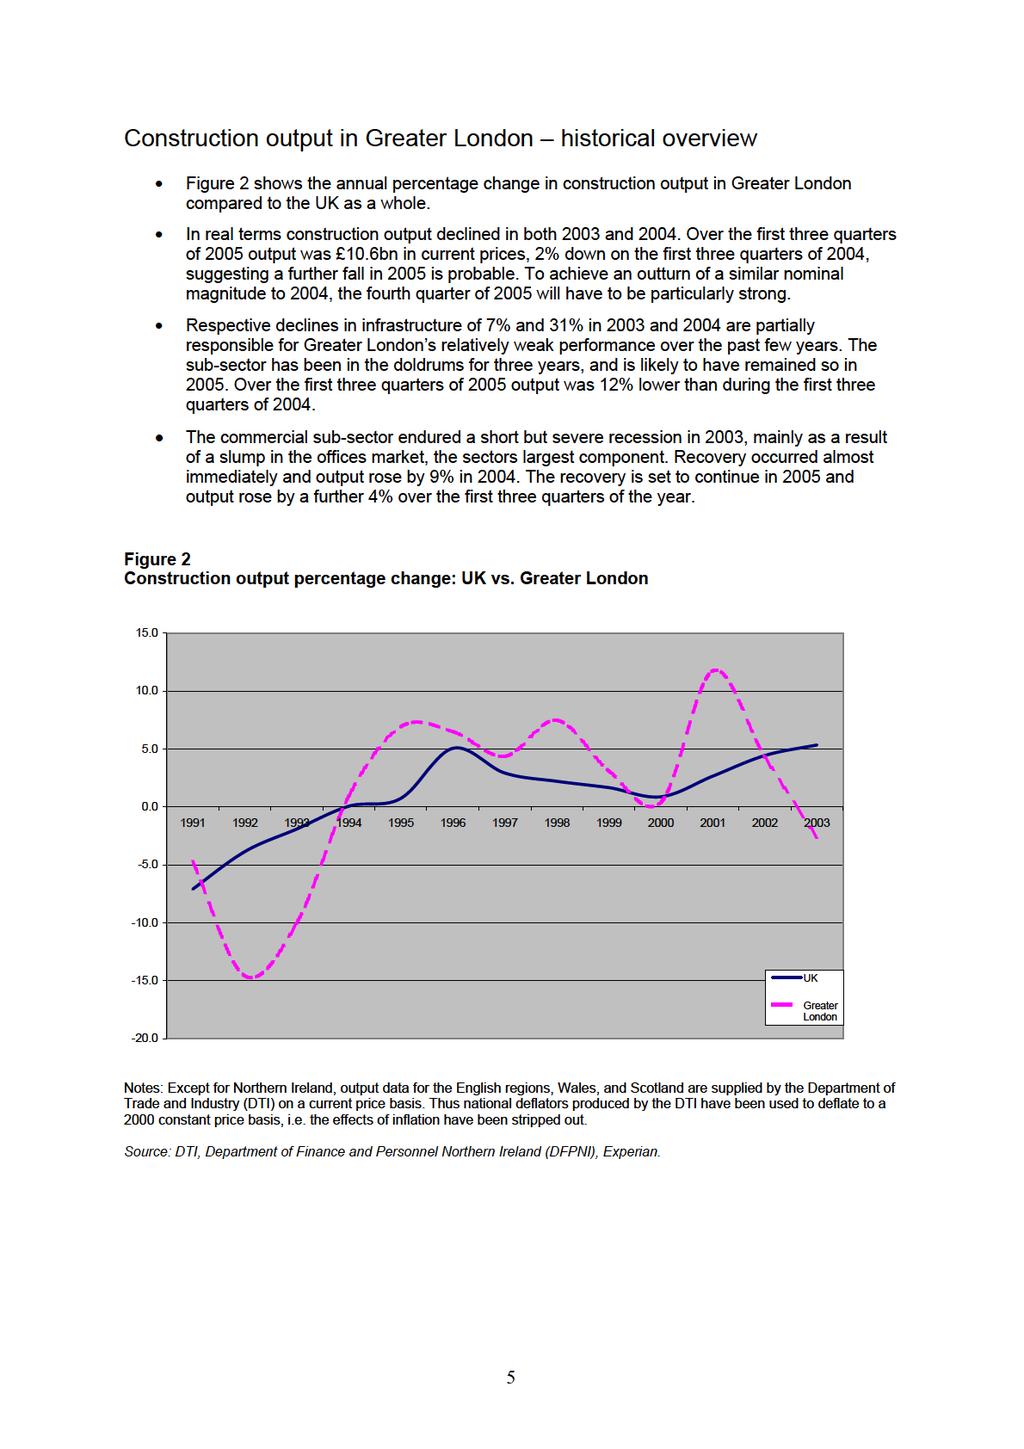
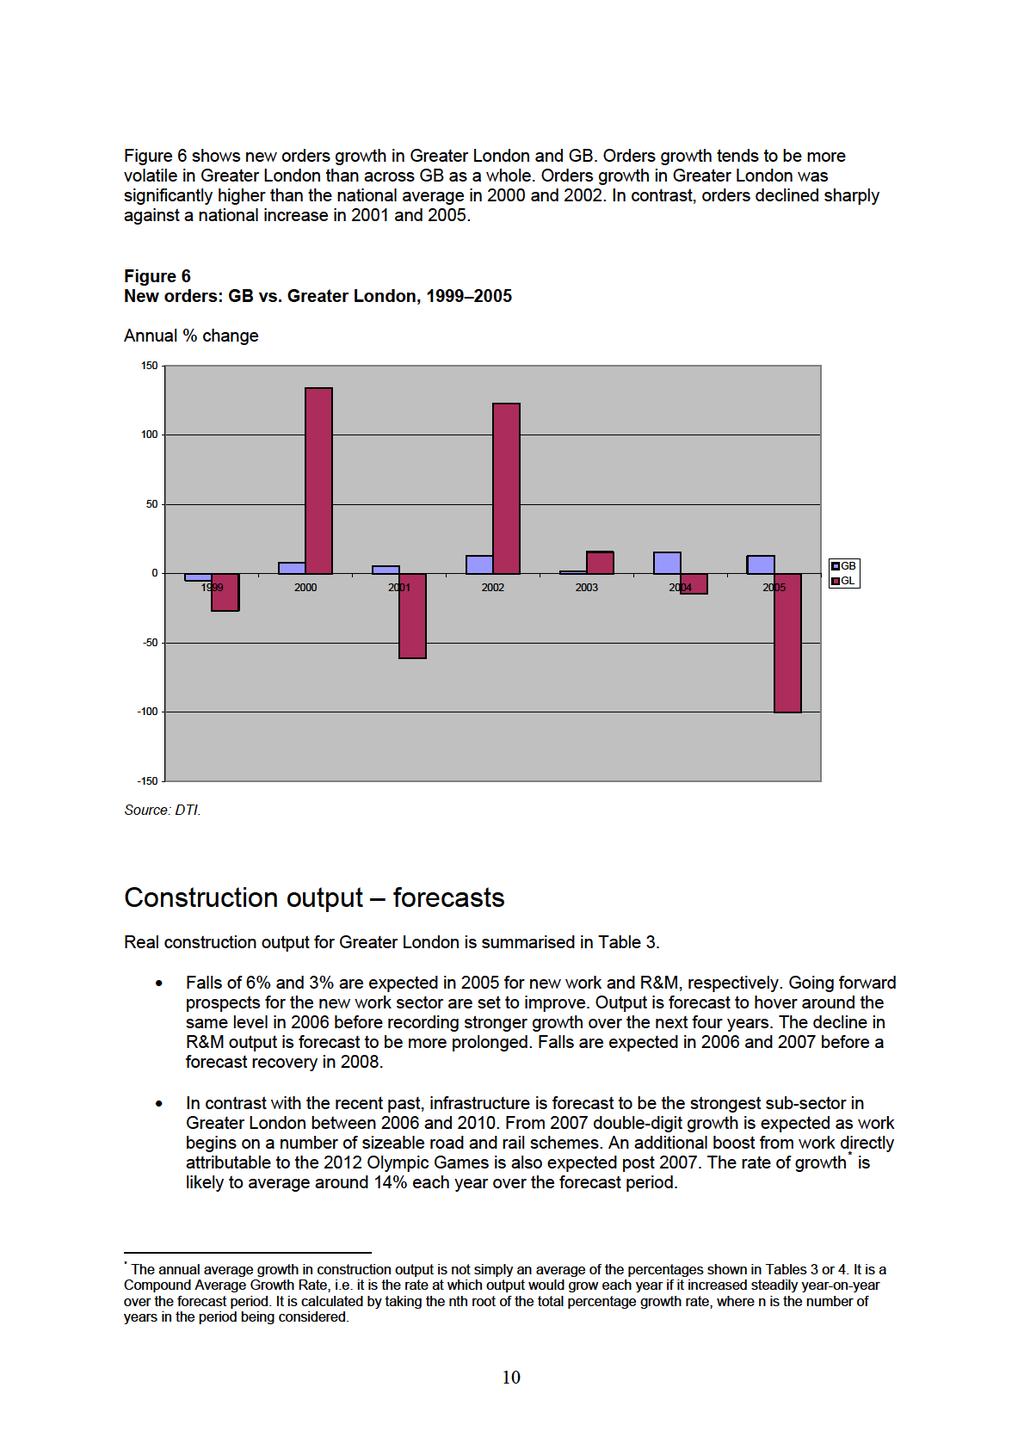
11 4 The outlook for construction New construction orders historical overview In this section, comparison is made with GB rather than the UK, owing to the fact that official orders data for Northern Ireland are not available. Table 2 shows new work orders for the main construction sub-sectors in Greater London (current prices). Since 2000, the annual change in new work construction orders has been variable. Growth was particularly strong in 2000 and However, this was followed by a decline in both 2002 and In the last two years, growth has recovered with new work orders increasing to around 6 billion in Commercial, the largest sub-sector, was almost entirely responsible for the region s overall slump in 2002 and A 4% decline in commercial orders in 2002 was followed by a sharp 31% decline in The overall effect was a 16% drop in total new work orders. In 2004 the commercial sub-sector recovered strongly, orders rose by 31%. Growth continued in 2005 but at a slower rate of 13%. The shortage of affordable housing in Greater London has recently been made a government priority. In 2005 orders were a phenomenal 327% higher than in Orders in the public housing subsector have been rising for the past three years and, at 77%, growth in 2004 was particularly strong. Orders continued to rise in 2005 but the rate of increase slowed to 19%. Nationally, new work orders rose strongly in 2004, increasing by 15%. With the exception of infrastructure and public non-housing, all sub-sectors saw their orders rise over the year. The rate of increase slowed slightly in 2005 to 11%, due mainly to a sharp slowdown in growth in the private housing sub-sector. In contrast to 2004, orders in the public non-housing sub-sector increased robustly by 48% in Commercial orders were similarly buoyant over the year, also rising by 48%. Infrastructure orders failed to recover in 2005 and declined by a further 9%. Table 2 New work orders for Greater London, million/annual % change Public housing Private housing Infrastructure Public non-housing Industrial Commercial All new work Source: DTI. 9
12
13 Industrial is set to be Greater London s weakest sub-sector. Marginal growth expected in the latter stages of the forecast period is unlikely to compensate for the three years of decline forecast between 2006 and However, the relatively small size of this sub-sector will limit its affect on overall growth. Any slowdown in private housing activity, resulting from a less certain housing market, is likely to be short-lived and the outlook for the sub-sector is positive. Averaging around 10% per year, growth is forecast to peak at a little less than 15% in Public non-housing endured the sharpest decline in 2005 and, while the outlook is better, growth is forecast to under-perform the increases expected in most other sub-sectors. Peaking at 4% in 2009, annual average growth of just 2.6% is forecast. Table 3 Greater London construction output by sub-sector, Annual % change Public housing 50% -4% 0% 3% 13% 10% 8% Private housing -21% 5% -4% 5% 15% 11% 11% Infrastructure -31% -16% -3% 13% 15% 15% 13% Public non-housing -5% -17% -1% 1% 1% 4% 4% Industrial -16% 9% -3% -3% 0% 1% 2% Commercial 9% -3% 3% 5% 7% 4% 4% All new work -3% -6% 0% 5% 8% 7% 6% R&M -1% -3% 0% -3% 3% 2% 2% Total Work -2% -5% 0% 1% 6% 5% 5% Source: Experian. Table 4 shows total construction output and employment over the period for Greater London. Real construction output is set to be 12% higher in 2010 than in 2004, due to strong growth in the latter stages of the forecast period. However, its lacklustre performance over the next couple of years will prevent Greater London matching a 14% national increase over the same period. Total employment is expected to increase by 19% over the forecast period. Table 4 Total construction output and employment, Greater London: Year Total Output Growth Total Output m 2001 Total Employment (direct and Rate % prices indirect) 000s Actual Forecast Source: Experian, Construction Skills Network Model,
14 5 Construction industry employment requirements Table 5 and Figure 7 show total employment levels and Average Annual Requirements for the UK, region, and Learning and Skills Council (LSC) areas in order to highlight where the greatest requirements are, and also for the purpose of comparison. The tables include data relating to Plumbers* and Electricians *. As part of SIC 45, Plumbers and Electricians working in contracting are an integral part of the construction process. However, it is recognised by ConstructionSkills that SummitSkills has responsibility for these occupations across a range of SIC Codes (SIC and 45.33). Thus, outputs from the Construction Skills Network Model relating to these two occupations have been passed to SummitSkills for their analysis but have been included here for completeness. The figures for the Average Annual Requirement are based upon the net balance of inflows and outflows, and cover replacement and expansion of the industry. The national UK forecasts The average annual gross employment requirement across the UK over the period 2006 to 2010 is estimated at 87,000, including all occupations in SIC 74.2 and in SIC 45 with the exception of Nonconstruction Operatives (Table 5). Non-construction Operatives captures all of the other elements involved in construction as defined by SIC 74.2 and SIC 45, outside of the main occupations listed in the following charts and tables. The Average Annual Requirement for Non-construction Operatives is not shown because the activities covered by this group are too diverse. Total employment is forecast to rise by 246,760 to 2.8 million between 2006 and At 11,090 Wood Trades is likely to have the highest Average Annual Requirement going forward (Table 5). Three out of the four occupations with the highest Average Annual Requirement from 2006 to 2010 are focused on management and organisation, namely Managers, Architects & Technical Engineers (SIC 74.2) and Clerical (Table 5). The Average Annual Requirement for Electricians, Plumbers, Engineering, IT & Other Professionals and Bricklayers is also expected to be high (Table 5). At the other end of the scale, the Average Annual Requirement for Scaffolders and Logistics is significantly lower at just 900 and 580, respectively (Table 5). Nationally, the professionals working within architectural and engineering activities and related technical consultancy (SIC 74.2) (Architects & Technical Engineers) take the largest share of total employment with an estimated 340,450 employed in 2006, rising to 354,270 by Second in line is Managers with 235,400 in 2006, increasing to 258,520 by Particularly strong demand for Wood Trades between 2006 and 2010 should make this the second largest occupation in employment terms by 2010 (Table 5 and Figure 7). Whilst the forecasts for an increase in total employment for Maintenance Workers are shown in Table 5, the Average Annual Requirement has been excluded. The model is currently forecasting a low requirement for this group compared to other occupations. Further research is being undertaken on the factors influencing this result and the Average Annual Requirement will be published when this work has been completed. Please note that all of the Average Annual Requirements presented in this section are employment requirements and not necessarily training requirements. Recruiting from other industries with a similar skills base or employing skilled migrant labour could mean the actual training requirement is lower. * For the ConstructionSkills and SummitSkills sector footprints see Appendix IV 12
15
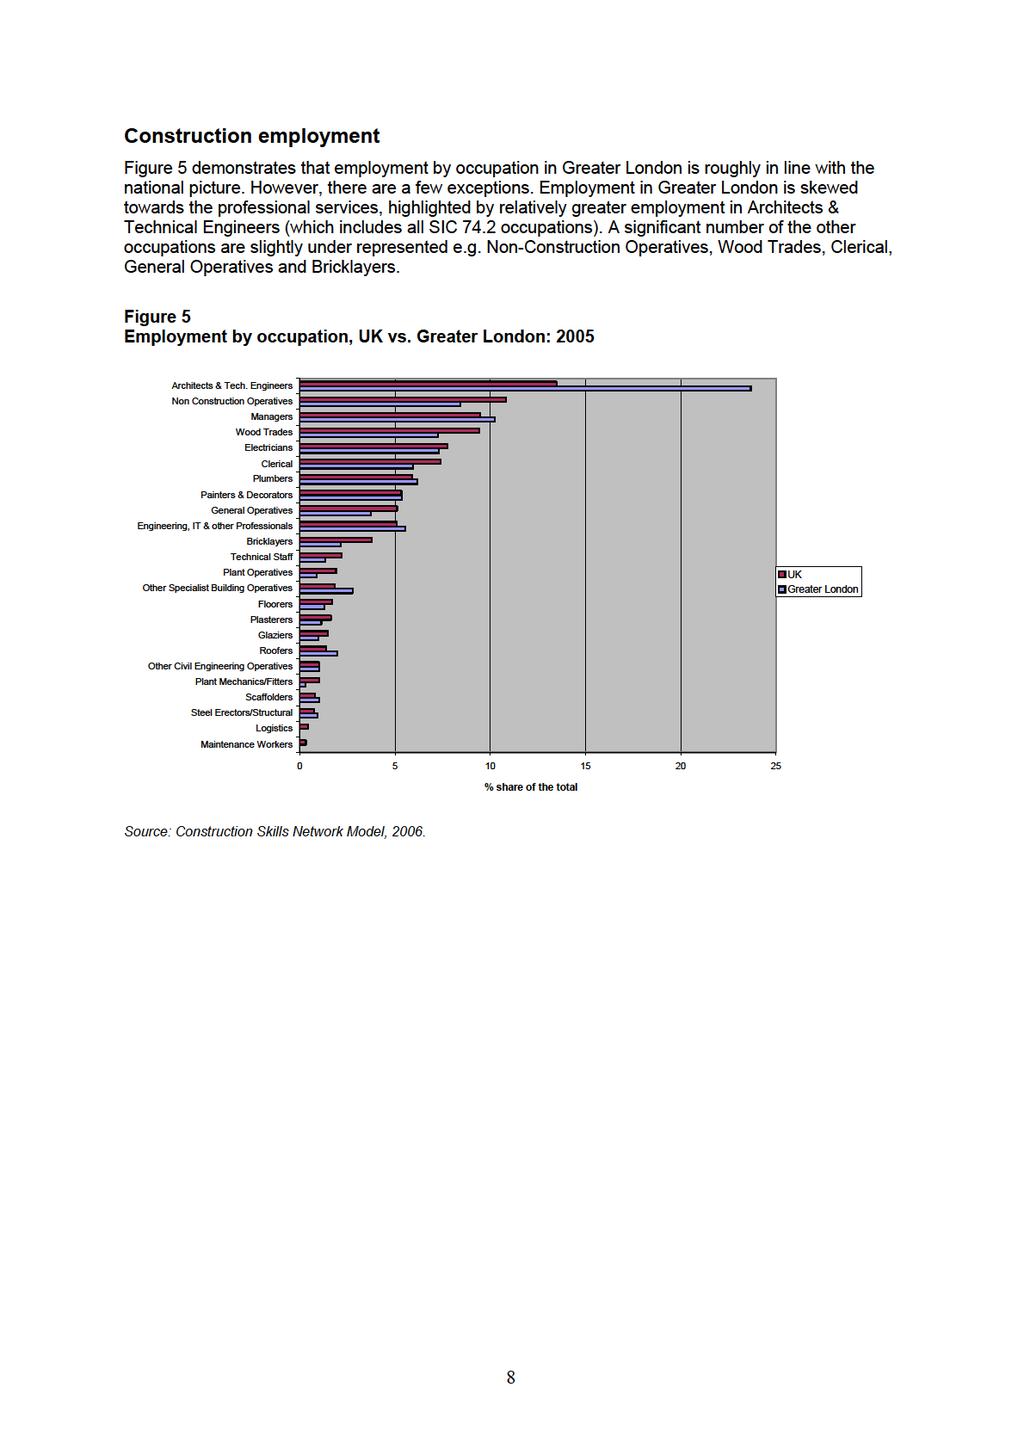
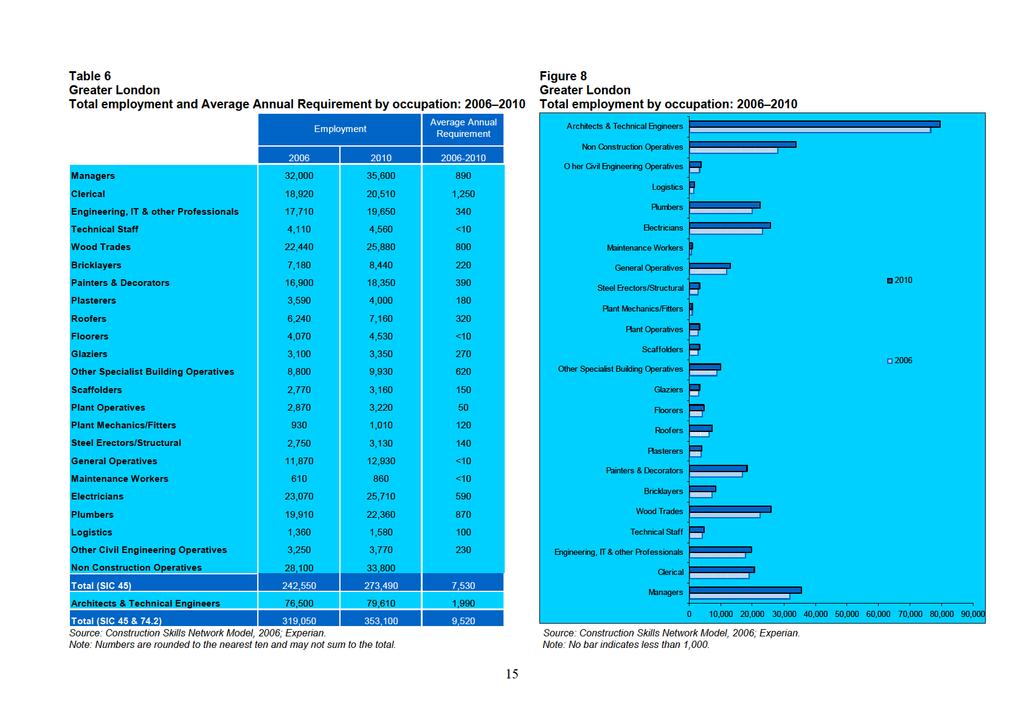
16 The Greater London employment forecasts Table 6 and Figure 8 outline the forecast employment and Average Annual Requirements for 24 occupations within the Greater London construction industry between 2006 and Total construction employment is forecast to increase by 34,050 between 2006 and 2010 in both SIC 45 and SIC Greater London has an Average Annual Requirement of 9,520 (Table 6 and Figure 8). The greatest Average Annual Requirement in Greater London will come from Architects & Technical Engineers (SIC 74.2), which is estimated at 1,990. Nationally, Wood Trades is forecast to have the greatest requirement. In Greater London, Wood Trades has the fifth largest requirement at 800 (Table 6). Other occupations with a large Average Annual Requirement include Clerical (1,250), Managers (890), Plumbers (870), Other Specialist Building Operatives (620) and Electricians (590) (Table 6). Four occupations have a requirement of less than 10, namely Technical Staff, Floorers, General Operatives and Maintenance Workers (Table 6). Non-construction Operatives is expected to see the greatest increase in total employment over the forecast period. Between 2006 and 2010 an extra 5,700 new employees are likely to be required (Table 6, Figure 8). 14
17
18 The following charts give an indication of employment and requirement by occupation for the LSC areas in Greater London. The areas and populations being looked at are considerably smaller than those on a regional level and the data available at this sub-regional level are much less robust. Construction employment and future requirements on a sub-regional level are created as ratios of the regional data and as such the results that are presented should be treated with a significant degree of caution. ConstructionSkills is currently working with Observatory members and other partners and stakeholders to review regional research to improve the robustness of these data. 16
19 Table 7 Table 8 Central London West London Total employment and annual requirement by occupation: Total employment and annual requirement by occupation: Employment Average Annual Requirement Managers 6,730 7, Clerical 3,980 4, Engineering, IT & other Professionals 3,720 4, Technical Staff <10 Wood Trades 4,720 5, Bricklayers 1,510 1, Painters & Decorators 3,550 3, Plasterers Roofers 1,310 1, Floorers <10 Glaziers Other Specialist Building Operatives 1,850 2, Scaffolders Plant Operatives Plant Mechanics/Fitters Steel Erectors/Structural General Operatives 2,500 2,680 <10 Maintenance Workers <10 Electricians 4,850 5, Plumbers 4,190 4, Logistics <10 Other Civil Engineering Operatives <10 Non Construction Operatives 5,910 7,020 <10 Total (SIC 45) 51,020 56,790 1,510 Architects & Technical Engineers 16,080 16, Total (SIC 45 & 74.2) 67,100 73,310 1,920 Source: Construction Skills Network Model, 2006; Experian. Employment Average Annual Requirement Managers 5,730 6, Clerical 3,390 3, Engineering, IT & other Professionals 3,170 3, Technical Staff <10 Wood Trades 4,020 4, Bricklayers 1,290 1, Painters & Decorators 3,030 3, Plasterers Roofers 1,120 1, Floorers <10 Glaziers Other Specialist Building Operatives 1,580 1, Scaffolders Plant Operatives <10 Plant Mechanics/Fitters Steel Erectors/Structural General Operatives 2,130 2,210 <10 Maintenance Workers <10 Electricians 4,130 4, Plumbers 3,570 3, Logistics <10 Other Civil Engineering Operatives <10 Non Construction Operatives 5,030 5,790 <10 Total (SIC 45) 43,460 46,850 1,230 Architects & Technical Engineers 13,700 13, Total (SIC 45 & 74.2) 57,160 60,490 1,570 Source: Construction Skills Network Model, 2006; Experian. 17
20 Table 9 Table 10 South London North London Total employment and annual requirement by occupation: Total employment and annual requirement by occupation: Employment Average Annual Requirement Managers 6,270 7, Clerical 3,710 4, Engineering, IT & other Professionals 3,470 3, Technical Staff <10 Wood Trades 4,400 5, Bricklayers 1,410 1, Painters & Decorators 3,310 3, Plasterers Roofers 1,220 1, Floorers <10 Glaziers Other Specialist Building Operatives 1,730 1, Scaffolders Plant Operatives <10 Plant Mechanics/Fitters Steel Erectors/Structural General Operatives 2,330 2,550 <10 Maintenance Workers <10 Electricians 4,520 5, Plumbers 3,900 4, Logistics <10 Other Civil Engineering Operatives <10 Non Construction Operatives 5,510 6,670 <10 Total (SIC 45) 47,550 53,980 1,410 Architects & Technical Engineers 15,000 15, Total (SIC 45 & 74.2) 62,550 69,700 1,800 Employment Average Annual Requirement Managers 3,660 4, Clerical 2,160 2, Engineering, IT & other Professionals 2,030 2, Technical Staff <10 Wood Trades 2,570 3, Bricklayers Painters & Decorators 1,930 2, Plasterers Roofers Floorers <10 Glaziers Other Specialist Building Operatives 1,010 1, Scaffolders Plant Operatives <10 Plant Mechanics/Fitters Steel Erectors/Structural General Operatives 1,360 1,500 <10 Maintenance Workers <10 Electricians 2,640 2, Plumbers 2,280 2, Logistics <10 Other Civil Engineering Operatives <10 Non Construction Operatives 3,210 3,910 <10 Total (SIC 45) 27,750 31, Architects & Technical Engineers 8,750 9, Total (SIC 45 & 74.2) 36,500 40,870 1,070 Source: Construction Skills Network Model, 2006; Experian. Source: Construction Skills Network Model, 2006; Experian. 18
21 Table 11 East London Total employment and annual requirement by occupation: Employment Average Annual Requirement Managers 8,000 9, Clerical 4,730 5, Engineering, IT & other Professionals 4,430 5, Technical Staff 1,030 1,180 <10 Wood Trades 5,610 6, Bricklayers 1,800 2, Painters & Decorators 4,230 4, Plasterers 900 1, Roofers 1,560 1, Floorers 1,020 1,170 <10 Glaziers Other Specialist Building Operatives 2,200 2, Scaffolders Plant Operatives Plant Mechanics/Fitters Steel Erectors/Structural General Operatives 2,970 3,340 <10 Maintenance Workers <10 Electricians 5,770 6, Plumbers 4,980 5, Logistics <10 Other Civil Engineering Operatives 950 1,140 <10 Non Construction Operatives 7,030 8,730 <10 Total (SIC 45) 60,670 70,630 1,860 Architects & Technical Engineers 19,130 20, Total (SIC 45 & 74.2) 79,800 91,190 2,370 Source: Construction Skills Network Model, 2006; Experian. 19
22 Appendix I Glossary of terms Demand construction output, vacancies, and a set of labour coefficients to translate demand for workers to labour requirements by trade. Demand is calculated using DTI and DFP output data. Vacancy data are usually taken from the National Employers Skills Survey (NESS) from the Department for Education and Skills (DfES). GDP Gross Domestic Product total market value of all final goods and services produced. A measure of national income. GDP = GVA + taxes on products subsidies on products GVA Gross Value Added total output minus the value of inputs used in the production process. GVA measures the contribution of the economy as a difference between gross output and intermediate outputs. Labour coefficients the labour inputs required for various types of construction activity. The number of workers of each occupation/trade to produce 1m of output in each sub-sector. LFS Labour Force Survey a UK household sample survey which collects information on employment, unemployment, flows between sectors and training, from around 53,000 households each quarter (>100,000 people). LMI Labour Market Information data that are quantitative (numerical) or qualitative (insights and perceptions) on workers, employers, wages, conditions of work, etc. LMI Labour Market Intelligence labour market information analysed. Macroeconomics the study of an economy on a national level, including total employment, investment, imports, exports, production and consumption. ONS Office for National Statistics official statistics on economy, population and society at national UK and local level. Output total value of all goods and services produced in an economy. Productivity output per employee SIC Codes Standard Industrial Classification Codes from the UK Standard Industrial Classification of Economic Activities produced by the ONS. ConstructionSkills is responsible for SIC 45 Construction and SIC 74.2 Architectural and Engineering activities and related technical consultancy. ConstructionSkills shares an interest with SummitSkills in SIC Installation of wiring and fittings and SIC Plumbing. AssetSkills has a peripheral interest in SIC SOC Codes Standard Occupational Classification Codes Supply the total stock of employment in a period of time plus the flows into and out of the labour market. Supply is usually calculated from LFS data.
23 Appendix II Note on Logistics and Other Civil Engineering Operatives In this initial run of the Construction Skills Network Model, the categories Logistics and Other Civil Engineering Operatives are derived from the category Other Civil Engineering Operatives to take account of the different employment requirements within each category. Logistics consists of labour within construction that deals with transportation, handling and storage. Other Civil Engineering Operatives consists of workers within construction that deals directly with construction work itself, for instance labourers and operatives in road and rail construction. This is a part of ongoing research.
24 Appendix III Data sources Construction Skills Network Model Accession Monitoring Report Home Office Analysis of Construction Industry Employment using the British Household Panel Survey CITB-ConstructionSkills British Household Panel Survey Institute for Social and Economic Research (University of Essex) Building the Future: Skills Training in Construction and Building Services Engineering Construction Apprentices Survey CITB-ConstructionSkills Construction Forecasts Experian Construction Skills Foresight Report CITB-ConstructionSkills Construction Skills Report Learning & Skills Councils (England) Construction Statistics Annual DTI Employer Panel Consultation CITB-ConstructionSkills Employers Skills Needs Survey CITB-ConstructionSkills Foresight, Regional construction forecasts Experian Investment Strategy for Northern Ireland Strategic Investment Board Labour Force Survey ONS International Passenger Survey ONS Measuring the Competitiveness of UK Construction DTI National Employer Skills Survey LSC, SSDA, & DfES Northern Ireland Census of Employment Northern Ireland Construction Bulletin DFPNI Occupational Skills Survey 2003 CITB-ConstructionSkills Quarterly output and New orders bulletin DTI Skills Needs Analysis ConstructionSkills Trainee Numbers Survey 2004/05 CITB-ConstructionSkills Travel Trends ONS Workforce Mobility and Skills in the UK Construction Sector ConstructionSkills, ECITB, SEEDA, DTI
25 Appendix IV Footprints for Built Environment SSCs The table summarises the SIC codes covered by ConstructionSkills. ConstructionSkills SIC Description Code 45.1 Site preparation 45.2 Building of complete construction or parts; civil engineering 45.3 Building installations (except and which are covered by SummitSkills) 45.4 Building completion 45.5 Renting of construction or demolition equipment with operator 74.2* Architectural and engineering activities and related technical consultancy * AssetSkills has a peripheral interest in SIC 74.2 The sector footprints for the other SSCs covering the Built Environment: SummitSkills Footprint Plumbing, Heating, Ventilation, Air Conditioning, Refrigeration and Electrotechnical. Coverage Building Services Engineering. AssetSkills Footprint Property Services, Housing, Facilities Management, Cleaning Coverage Property, Housing and Land Managers, Chartered Surveyors, Estimators, Valuers, Home Inspectors, Estate Agents and Auctioneers (property and chattels), Caretakers, Mobile and Machine Operatives, Window Cleaners, Road Sweepers, Cleaners, Domestics, Facilities Managers. Energy & Utility Skills Footprint Electricity, Gas (including gas installers), Water and Waste Management Coverage Electricity generation and distribution; Gas transmission, distribution and appliance installation and maintenance; Water collection, purification and distribution; Waste water collection and processing; Waste Management. At national level, ConstructionSkills and SummitSkills are in discussions to determine the most appropriate way of working together on forecasting employment requirements for trades/occupations where there is overlap between the two SSCs.
26 CITB-ConstructionSkills (Greater London & East) 1a Peel Street Luton LU1 2QR T
Construction Skills Network Wales
 2012 2016 Construction Skills Network Wales LABOUR MARKET INTELLIGENCE Contents ConstructionSkills is the Sector Skills Council for construction, tasked by Government to ensure the UK s largest industry
ConstructionSkills Network East Midlands
 LABOUR MARKET INTELLIGENCE ConstructionSkills Network 2011-2015 East Midlands 02 2 The outlook for construction in the East Midlands 04 3 Construction employment forecasts for the East Midlands 4 Comparisons
ConstructionSkills Network
 ConstructionSkills Network 20102014 LABOUR MARKET INTELLIGENCE for Contents Labour Market Intelligence 1 Summary and key findings 02 Page 04 3 Construction employment forecasts for 10 4 Comparisons across
EMPLOYERS SKILL NEEDS SURVEY
 EMPLOYERS SKILL NEEDS SURVEY AUTUMN 2003 CITB-ConstructionSkills Employers Skill Needs Survey 2003 1 Summary Approximately 500 construction companies drawn from across Great Britain were asked about workload
INDUSTRY INSIGHTS. Construction Skills Network Forecasts SCOTLAND
 INDUSTRY INSIGHTS Construction Skills Network Forecasts 2017 2021 SCOTLAND About CITB CITB is the Industrial Training Board (ITB) for the construction industry in Great Britain (England, Scotland and Wales).
INDUSTRY INSIGHTS. Construction Skills Network Forecasts NORTHERN IRELAND
 INDUSTRY INSIGHTS Construction Skills Network Forecasts 2017 2021 NORTHERN IRELAND About CITB CITB is the Industrial Training Board (ITB) for the construction industry in Great Britain (England, Scotland
INDUSTRY INSIGHTS. Construction Skills Network Forecasts SOUTH WEST
 INDUSTRY INSIGHTS Construction Skills Network Forecasts 2017 2021 SOUTH WEST About CITB CITB is the Industrial Training Board (ITB) for the construction industry in Great Britain (England, Scotland and
INDUSTRY INSIGHTS. Construction Skills Network Forecasts WALES
 INDUSTRY INSIGHTS Construction Skills Network Forecasts 2017 2021 WALES About CITB CITB is the Industrial Training Board (ITB) for the construction industry in Great Britain (England, Scotland and Wales).
STATE OF TRADE SURVEY
 STATE OF TRADE SURVEY Q3 2017 Contents Introduction page 3 Summary page 4 Workloads page 5 Residential workloads page 6 Non-residential workloads page 7 Expected workloads and enquiries page 9 Residential
Construction Skills Network Northern Ireland
 2012 2016 Construction Skills Network Northern Ireland LABOUR MARKET INTELLIGENCE Contents ConstructionSkills is the Sector Skills Council for construction, tasked by Government to ensure the UK s largest
INDUSTRY INSIGHTS. Construction Skills Network Forecasts
 INDUSTRY INSIGHTS Construction Skills Network Forecasts 20172021 About CITB CITB is the Industrial Training Board (ITB) for the construction industry in Great Britain (England, Scotland and Wales). CITB
INDUSTRY INSIGHTS. Construction Skills Network Forecasts NORTH EAST
 INDUSTRY INSIGHTS Construction Skills Network Forecasts 2017 2021 NORTH EAST About CITB CITB is the Industrial Training Board (ITB) for the construction industry in Great Britain (England, Scotland and
STATE OF TRADE SURVEY
 STATE OF TRADE SURVEY Q1 2017 Contents Introduction page 3 Summary page 4 Workloads page 5 Residential workloads page 6 Non-residential workloads page 7 Expected workloads and enquiries page 9 Residential
Build UK State of Trade Survey Q2 2016
 Executive Summary Build UK State of Trade Survey Q2 2016 Results of the second State of Trade survey for 2016 show that whilst output from Build UK members rose before the EU referendum, there is uncertainty
INDUSTRY INSIGHTS. Construction Skills Network Forecasts GREATER LONDON
 INDUSTRY INSIGHTS Construction Skills Network Forecasts 2017 2021 GREATER LONDON About CITB CITB is the Industrial Training Board (ITB) for the construction industry in Great Britain (England, Scotland
CITB RESEARCH INDUSTRY INSIGHTS SCOTLAND. Construction Skills Network Labour Market Intelligence
 CITB RESEARCH INDUSTRY INSIGHTS SCOTLAND Construction Skills Network Labour Market Intelligence 2018 2022 About CITB CITB is the Industrial Training Board (ITB) for the construction industry in Great Britain
SASKATCHEWAN Re-calibration ahead as resource expansion slows
 CONSTRUCTION & MAINTENANCE LOOKING FORWARD SASKATCHEWAN Re-calibration ahead as resource expansion slows HIGHLIGHTS 2017 2026 DISTRIBUTION OF CONSTRUCTION EMPLOYMENT IN 2017, SASKATCHEWAN Construction
CITB RESEARCH INDUSTRY INSIGHTS. Construction Skills Network Forecasts
 CITB RESEARCH INDUSTRY INSIGHTS Construction Skills Network Forecasts 2018-2022 About CITB CITB is the Industrial Training Board (ITB) for the construction industry in Great Britain (Scotland, England
8,400 NEW ENTRANTS 2,600 (-6.5%) EMPLOYMENT CHANGE
 EMPLOYMENT CHANGE") CONSTRUCTION & MAINTENANCE LOOKING FORWARD Manitoba Construction investment slows from the peak HIGHLIGHTS 2018 2027 The Manitoba construction industry has seen a significant expansion over the past decade,
CONSTRUCTION & MAINTENANCE LOOKING FORWARD Manitoba Construction investment slows from the peak HIGHLIGHTS 2018 2027 The Manitoba construction industry has seen a significant expansion over the past decade,
Construction and Maintenance Looking Forward Saskatchewan
 2016 2025 Key Highlights Construction and Maintenance Looking Forward Saskatchewan 2015 marks a change for Saskatchewan s construction industry, with residential building declining from historical highs
10,100 NEW ENTRANTS 1,300 (3%) EMPLOYMENT CHANGE
 EMPLOYMENT CHANGE") CONSTRUCTION & MAINTENANCE LOOKING FORWARD SASKATCHEWAN The pace slows ahead of new opportunities HIGHLIGHTS 2018 2027 2027 The Saskatchewan construction industry has seen significant expansion over the
CONSTRUCTION & MAINTENANCE LOOKING FORWARD SASKATCHEWAN The pace slows ahead of new opportunities HIGHLIGHTS 2018 2027 2027 The Saskatchewan construction industry has seen significant expansion over the
MANITOBA Building to a plateau
 CONSTRUCTION & MAINTENANCE LOOKING FORWARD MANITOBA Building to a plateau HIGHLIGHTS 2017 2026 DISTRIBUTION OF CONSTRUCTION EMPLOYMENT IN 2017, MANITOBA Construction activity in Manitoba is expected to
RESIDENTIAL SUMMARY 94,100 NEW ENTRANTS 37,400 (-7.3%) EMPLOYMENT CHANGE
 EMPLOYMENT CHANGE") CONSTRUCTION & MAINTENANCE LOOKING FORWARD RESIDENTIAL SUMMARY Retirements dominate hiring needs; 118,000 expected to retire by 2026 New workers will be required in residential construction over the 2017
CONSTRUCTION & MAINTENANCE LOOKING FORWARD RESIDENTIAL SUMMARY Retirements dominate hiring needs; 118,000 expected to retire by 2026 New workers will be required in residential construction over the 2017
Nova Scotia Retirements drive rising hiring requirements, despite muted growth outlook
 CONSTRUCTION & MAINTENANCE LOOKING FORWARD Nova Scotia Retirements drive rising hiring requirements, despite muted growth outlook The Nova Scotia construction industry has seen significant expansion over
Jobseekers Allowance (JSA) claims by occupation. A TUC analysis
 claims by occupation. A TUC analysis") Jobseekers Allowance (JSA) claims by occupation A TUC analysis Introduction Between July 2008 and July 2009 the claimant count 1 increased by 700,065. This TUC analysis looks at the relative increases
Jobseekers Allowance (JSA) claims by occupation A TUC analysis Introduction Between July 2008 and July 2009 the claimant count 1 increased by 700,065. This TUC analysis looks at the relative increases
NEWFOUNDLAND & LABRADOR
 CONSTRUCTION & MAINTENANCE LOOKING FORWARD NEWFOUNDLAND & LABRADOR At the midpoint of the down-cycle; stable demands ahead HIGHLIGHTS 2018 2027 2027 The Newfoundland and Labrador construction industry
BRITISH COLUMBIA Proposed major projects drive construction activity
 CONSTRUCTION & MAINTENANCE LOOKING FORWARD BRITISH COLUMBIA Proposed major projects drive construction activity HIGHLIGHTS 2017 2026 DISTRIBUTION OF CONSTRUCTION EMPLOYMENT IN 2017, BRITISH COLUMBIA British
UK BUSINESS CONFIDENCE MONITOR Q3 2013
 UK BUSINESS CONFIDENCE MONITOR 213 BUSINESS WITH CONFIDENCE WELCOME Businesses are feeling at their most confident since Q2 21, with that confidence yet again registering across all sectors and all regions.
1,200 NEW ENTRANTS 400 (9.1%) EMPLOYMENT CHANGE
 EMPLOYMENT CHANGE") CONSTRUCTION & MAINTENANCE LOOKING FORWARD prince edward island An island of growth within Atlantic Canada HIGHLIGHTS 2019 2028 Prince Edward Island is bracing for the busiest construction season ever
CONSTRUCTION & MAINTENANCE LOOKING FORWARD prince edward island An island of growth within Atlantic Canada HIGHLIGHTS 2019 2028 Prince Edward Island is bracing for the busiest construction season ever
Construction Skills Network
 Construction Skills Network Blueprint for Construction 20132017 Labour Market Intelligence Contents Chairman s message 3 The big picture 4 Comparing the sectors 8 Comparing the UK regions and nations 10
Construction and Maintenance Looking Forward Alberta
 2014 2023 Key Highlights Construction and Maintenance Looking Forward Alberta Alberta continues to lead Canada s construction industry; adding jobs and building the productive capacity of the provincial
Construction Skills Network. ConstructionSkills is the Sector Skills Council for Construction
 Construction Skills Network ConstructionSkills is the Sector Skills Council for Construction Blueprint for Construction Skills 2006-2010 Chairman s message The Construction Skills Network I am proud to
Construction Looking Forward Key Highlights. Saskatchewan. Residential market
 Construction Looking Forward 2012 2020 Key Highlights Saskatchewan The 2012 1 Construction Looking Forward scenario for Saskatchewan describes the peak of a steep climb over 10 years of growth. By 2013,
Construction and Maintenance Looking Forward British Columbia
 2016 2025 Key Highlights Construction and Maintenance Looking Forward British Columbia As the new forecast scenario begins in 2016, construction in British Columbia will start on a growth path that will
british columbia Biggest construction growth potential in Canada
 CONSTRUCTION & MAINTENANCE LOOKING FORWARD british columbia Biggest construction growth potential in Canada HIGHLIGHTS 2019 2028 Recruiting challenges emerged in British Columbia s construction labour
The Economic Value of the Adult Social Care sector - Northern Ireland Final report
 The Economic Value of the Adult Social Care sector - Northern Ireland Final report 05 June 2018 Final report The Economic Value of the Adult Social Care sector - Northern Ireland Final report A report
UK BUSINESS CONFIDENCE MONITOR Q4 2013
 UK BUSINESS CONFIDENCE MONITOR 213 BUSINESS WITH CONFIDENCE WELCOME This quarter s ICAEW/Grant Thornton Business Confidence Monitor shows that business confidence has now risen for five consecutive quarters.
Construction and Maintenance Looking Forward Manitoba
 2016 2025 Key Highlights Construction and Maintenance Looking Forward Manitoba New hydro development, transmission lines, pipelines and infrastructure projects will boost employment over the next few years,
Overview of the labour market
 Overview of the labour market Current interest in the Scottish labour market continues to focus on the trends and patterns in the unemployment figures, in this issue, in addition to noting recent changes
Ulster Bank Northern Ireland PMI
 Embargoed until 0101 UK (0001 UTC) 13 August 2018 Ulster Bank Northern Ireland PMI Fastest rise in output since January Key Findings Sharper increases in both output and new orders Slowest rise in employment
38,300 8,300 (4.3%) EMPLOYMENT CHANGE
 EMPLOYMENT CHANGE") CONSTRUCTION & MAINTENANCE LOOKING FORWARD ALBERTA Transition to a more diverse workforce is underway HIGHLIGHTS 2018 2027 2027 Alberta s construction industry is facing a significant change in the coming
CONSTRUCTION & MAINTENANCE LOOKING FORWARD ALBERTA Transition to a more diverse workforce is underway HIGHLIGHTS 2018 2027 2027 Alberta s construction industry is facing a significant change in the coming
Ulster Bank Northern Ireland PMI
 Embargoed until 0101 UK (0001 UTC) 10 September 2018 Ulster Bank Northern Ireland PMI New orders rise at weakest pace in four months Key Findings Weaker growth of output and new orders Further increase
Peterborough Sub-Regional Strategic Housing Market Assessment
 Peterborough Sub-Regional Strategic Housing Market Assessment July 2014 Prepared by GL Hearn Limited 20 Soho Square London W1D 3QW T +44 (0)20 7851 4900 F +44 (0)20 7851 4910 glhearn.com Appendices Contents
Exploring the rise of self-employment in the modern economy
 Exploring the rise of self-employment in the modern economy A guide to demographics and other trends in the UK s self-employed workforce in 2017 1 About IPSE IPSE is the largest association of independent
4 Scottish labour market
 4 Scottish labour market Andrew Ross, Fraser of Allander Institute This section provides an overview of key labour market data in Scotland and contrasts these with both UK performance and changes over
4 Scottish labour market
 4 Scottish labour market Andrew Ross, Fraser of Allander Institute This section provides an overview of key labour market data in Scotland and contrasts these with both UK performance and changes over
Ulster Bank Northern Ireland PMI
 11 February 2019 Employment falls for first time in four years Key Findings Output growth at 28-month low Employment falls for first time in four years Business sentiment remains muted Northern Ireland
NORTH WEST QUARTERLY ECONOMIC OUTLOOK. August 2012
 NORTH WEST QUARTERLY ECONOMIC OUTLOOK August 2012 North West Quarterly Economic Outlook August 2012 Quarterly Economic Outlook Through the Regional Leaders Board the North West s five Local Enterprise
NEW ENTRANTS 300 (6.8%) EMPLOYMENT CHANGE
 EMPLOYMENT CHANGE") CONSTRUCTION & MAINTENANCE LOOKING FORWARD Prince Edward Island Steady non-residential growth follows the residential boom HIGHLIGHTS 2018 2027 Prince Edward Island s construction labour market has been
CONSTRUCTION & MAINTENANCE LOOKING FORWARD Prince Edward Island Steady non-residential growth follows the residential boom HIGHLIGHTS 2018 2027 Prince Edward Island s construction labour market has been
Medium to long-term employment forecasts: Looking ahead to February 2017
 Medium to long-term employment forecasts: Looking ahead to 2025 February 2017 Ministry of Business, Innovation and Employment (MBIE) Hikina Whakatutuki - Lifting to make successful MBIE develops and delivers
The Economic Value of the Adult Social Care sector - Wales Final report
 The Economic Value of the Adult Social Care sector - Wales Final report 05 June 2018 Final report The Economic Value of the Adult Social Care sector - Wales Final report A report submitted by ICF Consulting
Construction and Maintenance Looking Forward Nova Scotia
 015 0 Key Highlights Construction and Maintenance Looking Forward Nova Scotia While total construction investment and employment fluctuate in a narrow band over the 015 0 Construction and Maintenance Looking
RESIDENTIAL SUMMARY -12,500 (-2.3%) EMPLOYMENT CHANGE
 EMPLOYMENT CHANGE") CONSTRUCTION & MAINTENANCE LOOKING FORWARD 2027 RESIDENTIAL SUMMARY Retirements loom large; 122,000 workers expected to retire by 2027 Canada s residential construction workforce must contend with replacing
CONSTRUCTION & MAINTENANCE LOOKING FORWARD 2027 RESIDENTIAL SUMMARY Retirements loom large; 122,000 workers expected to retire by 2027 Canada s residential construction workforce must contend with replacing
The Economic Value of the Adult Social Care sector - UK Final report
 The Economic Value of the Adult Social Care sector - UK Final report 05 June 2018 Final report The Economic Value of the Adult Social Care sector - UK Final report A report submitted by ICF Consulting
Economic Projections :2
 Economic Projections 2018-2020 2018:2 Outlook for the Maltese economy Economic projections 2018-2020 The Central Bank s latest economic projections foresee economic growth over the coming three years to
Overview of the Scottish labour market
 Overview of the Scottish labour market Comparable figures on the labour market 1 between Scotland and the United Kingdom in the second quarter of 2008 are summarised in Table 1. Labour Force Survey (LFS)
Business activity growth weakens in June
 9 July 2018 NatWest Wales PMI Business activity growth weakens in June Key Findings Output rises at softer pace Rate of growth in new business weakest in almost two years Staffing numbers decline Wales
Workforce Mobility and Skills in the UK Construction Sector Scotland Report
 Workforce Mobility and Skills in the UK Construction Sector 2015 Scotland Report Study prepared by BMG Research from a commission by CITB. The views expressed by research participants are their own and
City Economic Digest
 City Economic Digest January 216 Overview City Economic Digest January 216 This report interprets and analyses a wide range of data and intelligence to (i) provide up to date, comprehensive data relating
PAPER NO. 3/2005 Recent Trends in Employment Creation
 PAPER NO. 3/2005 Recent Trends in Employment Creation Manpower Research and Statistics Department Singapore October 2005 COPYRIGHT NOTICE Brief extracts from the report may be reproduced for non-commercial
32,800 NEW ENTRANTS 2,300 (-1.3%) EMPLOYMENT CHANGE
 EMPLOYMENT CHANGE") CONSTRUCTION & MAINTENANCE LOOKING FORWARD British Columbia Stacked major project demands; market challenges loom HIGHLIGHTS 2018 2027 British Columbia is facing very tight construction labour markets
CONSTRUCTION & MAINTENANCE LOOKING FORWARD British Columbia Stacked major project demands; market challenges loom HIGHLIGHTS 2018 2027 British Columbia is facing very tight construction labour markets
SMEs and UK growth: the opportunity for regional economies. November 2018
 1 SMEs and UK growth: the opportunity for regional economies November 2018 2 Table of contents FOREWORD 3 1: INTRODUCTION 4 2: EXECUTIVE SUMMARY 5 3: SMES AND UK REGIONAL GROWTH 7 Contribution of SMEs
Asda Income Tracker. Report: December 2015 Released: January Centre for Economics and Business Research ltd
 Asda Income Tracker Report: December 2015 Released: January 2016 M a k i n g B u s i n e s s S e n s e Centre for Economics and Business Research ltd Unit 1, 4 Bath Street, London EC1V 9DX t 020 7324 2850
Strategic Housing Market Assessment South Essex. May 2016
 Strategic Housing Market Assessment South Essex May 2016 Contents Executive Summary i 1. Introduction 7 2. Defining the Housing Market Area 17 3. Demographic Projections of Need 35 4. Likely Change in
The economic impact of the UK Maritime Services Sector
 The economic impact of the UK Maritime Services Sector A Report for Maritime UK (including regional breakdown) February 2013 Contents 1 Executive summary...2 2 Introduction...5 2.1 The channels of economic
Ulster Bank Northern Ireland PMI
 Embargoed until 0101 (UK) 14 January 2019 Ulster Bank Northern Ireland PMI New orders stagnate in December Key Findings No change in new business ends 25-month sequence of growth Further solid rises in
(2008) 2008]. 32 (2) ISSN
![(2008) 2008]. 32 (2) ISSN](/thumbs/79/79059428.jpg "(2008) 2008]. 32 (2) ISSN") Allan, Grant (2008) Overview of the Scottish labour market [November 2008]. Fraser of Allander Economic Commentary, 32 (2). pp. 34-40. ISSN 2046-5378, This version is available at https://strathprints.strath.ac.uk/46896/
Allan, Grant (2008) Overview of the Scottish labour market [November 2008]. Fraser of Allander Economic Commentary, 32 (2). pp. 34-40. ISSN 2046-5378, This version is available at https://strathprints.strath.ac.uk/46896/
Greater Manchester Quarterly Economic Survey Q1 2014
 Greater Manchester Quarterly Economic Survey 14 OVERVIEW Dr John Ashcroft Chief Economist Greater Manchester Chamber of Commerce - where economics means business. The Manchester Index suggests growth up
Calculating the economic contribution of Beatrice Offshore Windfarm Limited
 Calculating the economic contribution of Beatrice Offshore Windfarm Limited Methodology document Contents Background... 2 Input-Output Model methodology... 3 Direct, indirect and induced impacts... 3 Gross
Construction Industry Focus Survey. Volume 27 Issue 2 November 2017
 Construction Industry Focus Survey Volume 27 Issue 2 1 CONTENTS Executive Summary 1 1. Leading Activity Indicator 1 2. Activity by sector and constraints Residential, Nonresidential, Civil Engineering
TRADE UNION MEMBERSHIP Statistical Bulletin
 TRADE UNION MEMBERSHIP 2016 Statistical Bulletin May 2017 Contents Introduction 3 Key findings 5 1. Long Term and Recent Trends 6 2. Private and Public Sectors 13 3. Personal and job characteristics 16
Economic Projections :1
 Economic Projections 2017-2020 2018:1 Outlook for the Maltese economy Economic projections 2017-2020 The Central Bank s latest economic projections foresee economic growth over the coming three years to
Structural Changes in the Maltese Economy
 Structural Changes in the Maltese Economy Dr. Aaron George Grech Modelling and Research Department, Central Bank of Malta, Castille Place, Valletta, Malta Email: grechga@centralbankmalta.org Doi:10.5901/mjss.2015.v6n5p423
Construction and Maintenance Looking Forward Newfoundland and Labrador
 015 0 Key Highlights Construction and Maintenance Looking Forward Newfoundland and Labrador The 015 Construction and Maintenance Looking Forward scenario for Newfoundland and Labrador projects a cyclical
Great Britain (Numbers) All People 85,100 5,810,800 63,785,900 Males 42,300 2,878,100 31,462,500 Females 42,800 2,932,600 32,323,500
 All People 85,100 5,810,800 63,785,900 Males 42,300 2,878,100 31,462,500 Females 42,800 2,932,600 32,323,500") Labour Market Profile - The profile brings together data from several sources. Details about these and related terminology are given in the definitions section. Resident Population Total population (2016)
Labour Market Profile - The profile brings together data from several sources. Details about these and related terminology are given in the definitions section. Resident Population Total population (2016)
Great Britain (Numbers) All People 127,500 5,517,000 63,785,900 Males 63,200 2,712,300 31,462,500 Females 64,400 2,804,600 32,323,500
 All People 127,500 5,517,000 63,785,900 Males 63,200 2,712,300 31,462,500 Females 64,400 2,804,600 32,323,500") Labour Market Profile - The profile brings together data from several sources. Details about these and related terminology are given in the definitions section. Resident Population Total population (2016)
Labour Market Profile - The profile brings together data from several sources. Details about these and related terminology are given in the definitions section. Resident Population Total population (2016)
All People 532,500 5,425,400 63,785,900 Males 262,500 2,678,200 31,462,500 Females 270,100 2,747,200 32,323,500. Bradford (Numbers)
") Labour Market Profile - The profile brings together data from several sources. Details about these and related terminology are given in the definitions section. Resident Population Total population (2016)
Labour Market Profile - The profile brings together data from several sources. Details about these and related terminology are given in the definitions section. Resident Population Total population (2016)
BBPA Local impact of the beer and pub sector 2010/11
 Local impact of the beer and pub sector 2010/11 A report for the British Beer and Pub Association () Contents Executive summary... 1 The beer and pub sector provides significant benefits to the UK economy......
Economic Projections :3
 Economic Projections 2018-2020 2018:3 Outlook for the Maltese economy Economic projections 2018-2020 The Central Bank s latest projections foresee economic growth over the coming three years to remain
The number of unemployed people
 Economic & Labour Market Review Vol 3 No February 9 FEATURE Debra Leaker Trends since the 197s SUMMARY occurs when an individual is available and seeking work but is without work. There are various causes
Brighton And Hove (Numbers) All People 287,200 9,030,300 63,785,900 Males 144,300 4,449,200 31,462,500 Females 142,900 4,581,100 32,323,500
 All People 287,200 9,030,300 63,785,900 Males 144,300 4,449,200 31,462,500 Females 142,900 4,581,100 32,323,500") Labour Market Profile - The profile brings together data from several sources. Details about these and related terminology are given in the definitions section. Resident Population Total population (2016)
Labour Market Profile - The profile brings together data from several sources. Details about these and related terminology are given in the definitions section. Resident Population Total population (2016)
Great Britain (Numbers) All People 283,500 7,224,000 63,785,900 Males 140,400 3,563,200 31,462,500 Females 143,100 3,660,800 32,323,500
 All People 283,500 7,224,000 63,785,900 Males 140,400 3,563,200 31,462,500 Females 143,100 3,660,800 32,323,500") Labour Market Profile - The profile brings together data from several sources. Details about these and related terminology are given in the definitions section. Resident Population Total population (2016)
Labour Market Profile - The profile brings together data from several sources. Details about these and related terminology are given in the definitions section. Resident Population Total population (2016)
Great Britain (Numbers) All People 186,600 6,130,500 63,785,900 Males 92,600 3,021,700 31,462,500 Females 94,000 3,108,900 32,323,500
 All People 186,600 6,130,500 63,785,900 Males 92,600 3,021,700 31,462,500 Females 94,000 3,108,900 32,323,500") Labour Market Profile - The profile brings together data from several sources. Details about these and related terminology are given in the definitions section. Resident Population Total population (2016)
Labour Market Profile - The profile brings together data from several sources. Details about these and related terminology are given in the definitions section. Resident Population Total population (2016)
North West Leicestershire (Numbers) All People 98,600 4,724,400 63,785,900 Males 48,900 2,335,000 31,462,500 Females 49,800 2,389,400 32,323,500
 All People 98,600 4,724,400 63,785,900 Males 48,900 2,335,000 31,462,500 Females 49,800 2,389,400 32,323,500") Labour Market Profile - The profile brings together data from several sources. Details about these and related terminology are given in the definitions section. Resident Population Total population (2016)
Labour Market Profile - The profile brings together data from several sources. Details about these and related terminology are given in the definitions section. Resident Population Total population (2016)
Great Britain (Numbers) All People 64,000 6,168,400 64,169,400 Males 31,500 3,040,300 31,661,600 Females 32,500 3,128,100 32,507,800
 All People 64,000 6,168,400 64,169,400 Males 31,500 3,040,300 31,661,600 Females 32,500 3,128,100 32,507,800") Labour Market Profile - The profile brings together data from several sources. Details about these and related terminology are given in the definitions section. Resident Population Total population (2017)
Labour Market Profile - The profile brings together data from several sources. Details about these and related terminology are given in the definitions section. Resident Population Total population (2017)
Great Britain (Numbers) All People 267,500 9,080,800 64,169,400 Males 132,500 4,474,400 31,661,600 Females 135,000 4,606,400 32,507,800
 All People 267,500 9,080,800 64,169,400 Males 132,500 4,474,400 31,661,600 Females 135,000 4,606,400 32,507,800") Labour Market Profile - The profile brings together data from several sources. Details about these and related terminology are given in the definitions section. Resident Population Total population (2017)
Labour Market Profile - The profile brings together data from several sources. Details about these and related terminology are given in the definitions section. Resident Population Total population (2017)
Great Britain (Numbers) All People 325,300 4,724,400 63,785,900 Males 164,500 2,335,000 31,462,500 Females 160,800 2,389,400 32,323,500
 All People 325,300 4,724,400 63,785,900 Males 164,500 2,335,000 31,462,500 Females 160,800 2,389,400 32,323,500") Labour Market Profile - The profile brings together data from several sources. Details about these and related terminology are given in the definitions section. Resident Population Total population (2016)
Labour Market Profile - The profile brings together data from several sources. Details about these and related terminology are given in the definitions section. Resident Population Total population (2016)
All People 263,400 5,450,100 64,169,400 Males 129,400 2,690,500 31,661,600 Females 134,000 2,759,600 32,507,800. Rotherham (Numbers)
") Labour Market Profile - The profile brings together data from several sources. Details about these and related terminology are given in the definitions section. Resident Population Total population (2017)
Labour Market Profile - The profile brings together data from several sources. Details about these and related terminology are given in the definitions section. Resident Population Total population (2017)
Great Britain (Numbers) All People 49,600 5,559,300 64,169,400 Males 24,000 2,734,200 31,661,600 Females 25,700 2,825,100 32,507,800
 All People 49,600 5,559,300 64,169,400 Males 24,000 2,734,200 31,661,600 Females 25,700 2,825,100 32,507,800") Labour Market Profile - The profile brings together data from several sources. Details about these and related terminology are given in the definitions section. Resident Population Total population (2017)
Labour Market Profile - The profile brings together data from several sources. Details about these and related terminology are given in the definitions section. Resident Population Total population (2017)
Great Britain (Numbers) All People 140,700 9,026,300 63,785,900 Males 68,100 4,447,200 31,462,500 Females 72,600 4,579,100 32,323,500
 All People 140,700 9,026,300 63,785,900 Males 68,100 4,447,200 31,462,500 Females 72,600 4,579,100 32,323,500") Labour Market Profile - The profile brings together data from several sources. Details about these and related terminology are given in the definitions section. Resident Population Total population (2016)
Labour Market Profile - The profile brings together data from several sources. Details about these and related terminology are given in the definitions section. Resident Population Total population (2016)
All People 280,000 6,168,400 64,169,400 Males 138,200 3,040,300 31,661,600 Females 141,800 3,128,100 32,507,800. Central Bedfordshire (Numbers)
") Labour Market Profile - The profile brings together data from several sources. Details about these and related terminology are given in the definitions section. Resident Population Total population (2017)
Labour Market Profile - The profile brings together data from several sources. Details about these and related terminology are given in the definitions section. Resident Population Total population (2017)
Great Britain (Numbers) All People 176,200 6,168,400 64,169,400 Males 87,200 3,040,300 31,661,600 Females 89,000 3,128,100 32,507,800
 All People 176,200 6,168,400 64,169,400 Males 87,200 3,040,300 31,661,600 Females 89,000 3,128,100 32,507,800") Labour Market Profile - The profile brings together data from several sources. Details about these and related terminology are given in the definitions section. Resident Population Total population (2017)
Labour Market Profile - The profile brings together data from several sources. Details about these and related terminology are given in the definitions section. Resident Population Total population (2017)
All People 437,100 5,450,100 64,169,400 Males 216,700 2,690,500 31,661,600 Females 220,500 2,759,600 32,507,800. Kirklees (Numbers)
") Labour Market Profile - The profile brings together data from several sources. Details about these and related terminology are given in the definitions section. Resident Population Total population (2017)
Labour Market Profile - The profile brings together data from several sources. Details about these and related terminology are given in the definitions section. Resident Population Total population (2017)
Legal services sector forecasts
 www.lawsociety.org.uk Legal services sector forecasts 2017-2025 August 2018 Legal services sector forecasts 2017-2025 2 The Law Society of England and Wales August 2018 CONTENTS SUMMARY OF FORECASTS 4
Embargo: 00:01hrs 14 January 2019
 FINANCIAL SERVICES SURVEY DECEMBER 18 Embargo: :1hrs 14 January 19 DEMAND FALLS FOR THE FIRST TIME IN FIVE YEARS Sentiment among financial services firms continued to deteriorate in the quarter to December.
Stockton-On- Tees (Numbers) All People 196,500 2,644,700 64,169,400 Males 96,800 1,297,900 31,661,600 Females 99,700 1,346,800 32,507,800
 All People 196,500 2,644,700 64,169,400 Males 96,800 1,297,900 31,661,600 Females 99,700 1,346,800 32,507,800") Labour Market Profile - The profile brings together data from several sources. Details about these and related terminology are given in the definitions section. Resident Population Total population (2017)
Labour Market Profile - The profile brings together data from several sources. Details about these and related terminology are given in the definitions section. Resident Population Total population (2017)
Relative regional consumer price levels of goods and services, UK: 2016
 Article Relative regional consumer price levels of goods and services, UK: 2016 UK relative regional consumer price levels (RRCPLs) of goods and services for 2016. They provide an indication of a region's
All People 295,800 2,644,700 64,169,400 Males 149,400 1,297,900 31,661,600 Females 146,400 1,346,800 32,507,800. Newcastle Upon Tyne (Numbers)
") Labour Market Profile - The profile brings together data from several sources. Details about these and related terminology are given in the definitions section. Resident Population Total population (2017)
Labour Market Profile - The profile brings together data from several sources. Details about these and related terminology are given in the definitions section. Resident Population Total population (2017)