Comprehensive Annual Financial Report
|
|
|
- Jennifer Berry
- 5 years ago
- Views:
Transcription


1 Comprehensive Annual Financial Report Dallas Area Rapid Transit For the Fiscal Year Ended September 30, 2014 Dallas, Texas
2 This page intentionally left blank.
3 COMPREHENSIVE ANNUAL FINANCIAL REPORT For the Fiscal Year Ended September 30, 2014 Dallas, Texas
4 COMPREHENSIVE ANNUAL FINANCIAL REPORT For the Fiscal Year Ended September 30, 2014 Dallas, Texas Gary C. Thomas President/Executive Director David Leininger Executive Vice President, Chief Financial Officer Prepared by: General Accounting Division of the Finance Department
5 COMPREHENSIVE ANNUAL FINANCIAL REPORT FOR THE FISCAL YEAR ENDED SEPTEMBER 30, 2014 TABLE OF CONTENTS INTRODUCTORY SECTION (Unaudited) Letter of Transmittal GFOA Certificate of Achievement Organization Chart DART Board of Directors DART Service Area DART Current and Future Services Page i v vi vii viii ix FINANCIAL SECTION Independent Auditor s Report 1 Management s Discussion and Analysis (MD&A) (Required Supplementary Information - Unaudited) 3 Financial Statements Statements of Net Position 14 Statements of Revenues, Expenses and Changes in Net Position 15 Statements of Cash Flows 16 Notes to Financial Statements 18 Required Supplementary Information (Unaudited) Schedule of Funding Progress for the DART Defined Benefit Pension Plan and DART Other Postemployment Benefits 40 STATISTICAL SECTION (Unaudited) Guide to Statistical Section 41 Financial Trends 42 Revenue Capacity 48 Debt Capacity 54 Demographic and Economic Information 57 Operating Information 59
6 INTRODUCTORY SECTION

7

8

9

10

11 Government Finance Officers Association Certificate of Achievement for Excellence in Financial Reporting Pres en ted to Dallas Area Rapid Transit Texas For its Comprehensive Annual Financial Report for the Fiscal Year Ended September 30, 2013 Executive Director/CEO rf
12 Dallas Area Rapid Transit Functional Organization Chart Board of Directors President/ Executive Director Board Support Internal Audit General Counsel Workforce Leadership and Development Customer Care and Service Delivery Growth and Development Business Solutions and Innovation Safety * Human Capital * Transportation * Planning & Development * Finance * Operations * Diversity * Maintenance * Capital Planning * Marketing * Customer * Government Relations * Mobility Mgmt. * Rail Program Development * Procurement * Policy & Strategy * Security * Commuter Rail * Technology * Materials Mgmt. vi
13 Dallas Area Rapid Transit Board of Directors Officers Robert W. Strauss, Chairman City of Dallas Faye Moses-Wilkins, Vice Chairman Cities of Plano and Farmers Branch Richard Carrizales, Secretary City of Dallas Gary Slagel, Assistant Secretary Cities of Richardson and University Park; Towns of Addison and Highland Park City of Dallas Jim Adams Jerry Christian Amanda Moreno Cross Pamela Dunlop Gates Michele Wong Krause Cities of Dallas and Cockrell Hill William Velasco, II City of Garland Michael T. Cheney City of Irving Rick Stopfer City of Plano Paul N. Wageman Cities of Carrollton & Irving Timothy A. Hayden Cities of Garland, Rowlett, and Glenn Heights Mark C. Enoch

14 vii
15 DART Current and Future Services A-Train to Denton (operated by DCTA) NORTH CARROLLTON/FRANKFORD TRINITY MILLS NW PLANO PARK & RIDE Dallas North Tollway JACK HATCHELL TRANSIT CTR. President George Bush Turnpike RICHARDSON PLANO PARKER ROAD DOWNTOWN PLANO BUSH TURNPIKE GALATYN PARK To Fort Worth DFW CENTREPORT/ DFW AIRPORT TRE to Fort Worth DFW AIRPORT Open 2014 BELT LINE WEST IRVING Tr i n RICHLAND HILLS it y R iver ADDISON DOWNTOWN CARROLLTON CARROLLTON FARMERS BRANCH FARMERS BRANCH ROYAL LANE WALNUT HILL/DENTON IRVING CONVENTION CENTER NORTH LAKE LAS COLINAS COLLEGE URBAN CENTER UNIVERSITY BACHMAN UNIVERSITY OF DALLAS PARK LOVE HIGHLAND PARK INWOOD/LOVE FIELD IRVING SOUTHWESTERN MEDICAL DISTRICT/ PARKLAND DOWNTOWN IRVING/ MEDICAL/ MARKET HERITAGE CROSSING MARKET CENTER CENTER BELL BURBANK VICTORY ADDISON TRANSIT CTR. UNION STATION CONVENTION CENTER PEARL/ARTS DISTRICT ST. PAUL AKARD WEST END CEDARS COCKRELL HILL 8TH & CORINTH DALLAS ZOO TYLER/VERNON MORRELL HAMPTON ILLINOIS WESTMORELAND KIEST WALNUT HILL PARK LANE DALLAS FOREST LANE LOVERS LANE MOCKINGBIRD CITYPLACE/UPTOWN LBJ/CENTRAL HATCHER SPRING VALLEY LAKE HIGHLANDS WHITE ROCK White Rock Lake ARAPAHO CENTER GARLAND LBJ/SKILLMAN DEEP ELLUM BAYLOR UNIVERSITY MEDICAL CENTER FAIR PARK MLK, JR. LAWNVIEW LAKE JUNE FOREST/JUPITER BUCKNER DOWNTOWN GARLAND S. GARLAND TRANSIT CTR. LAKE RAY HUBBARD TRANSIT CTR. DOWNTOWN ROWLETT ROWLETT Lake Ray Hubbard FORT WORTH ITC T&P STATION FORT WORTH RED BIRD TRANSIT CTR. VA MEDICAL CENTER LEDBETTER CAMP WISDOM Downtown Dallas UNT DALLAS VICTORY UNION STATION WEST TRANSFER CONVENTION CENTER PEARL/ARTS DISTRICT ST. PAUL WEST END AKARD EAST TRANSFER ROSA PARKS PLAZA DEEP ELLUM GLENN HEIGHTS GLENN HEIGHTS PARK & RIDE Rail System Legend Currently Operating DART Rail Red Line DART Rail Blue Line DART Rail Green Line DART Rail Orange Line DART Rail Orange Line (Selected Weekday Trips Rush Hour Only) Trinity Railway Express (TRE) DCTA A-train Under Design/Construction DART Rail Blue Line Extension to UNT Dallas opens 2016.
16 FINANCIAL SECTION
17 Dallas Area Rapid Transit Dallas, Texas Financial Statements Years Ended September 30, 2014 and 2013 and Independent Auditors Report
18 DALLAS, TEXAS FINANCIAL STATEMENTS AS OF AND FOR THE YEARS ENDED SEPTEMBER 30, 2014 AND 2013 TABLE OF CONTENTS INDEPENDENT AUDITOR S REPORT... 1 MANAGEMENT S DISCUSSION AND ANALYSIS (UNAUDITED)... 3 BASIC FINANCIAL STATEMENTS: STATEMENTS OF NET POSITION STATEMENTS OF REVENUES, EXPENSES, AND CHANGES IN NET POSITION STATEMENTS OF CASH FLOWS NOTES TO FINANCIAL STATEMENTS REQUIRED SUPPLEMENTARY INFORMATION (UNAUDITED): SCHEDULE OF FUNDING PROGRESS FOR DEFINED BENEFIT PLAN AND OTHER POST EMPLOYMENT BENEFITS... 40
19 Members of the Board of Directors Dallas Area Rapid Transit Dallas, Texas Report on the Financial Statements INDEPENDENT AUDITOR'S REPORT We have audited the accompanying financial statements of the Dallas Area Rapid Transit ( DART ), as of and for the years ended September 30, 2014 and 2013, and the related notes to the financial statements, which collectively comprise DART s basic financial statements as listed in the table of contents. Management s Responsibility for the Financial Statements Management is responsible for the preparation and fair presentation of these financial statements in accordance with accounting principles generally accepted in the United States of America; this includes the design, implementation, and maintenance of internal control relevant to the preparation and fair presentation of financial statements that are free from material misstatement, whether due to fraud or error. Auditor s Responsibility Our responsibility is to express an opinion on these financial statements based on our audits. We conducted our audits in accordance with auditing standards generally accepted in the United States of America. Those standards require that we plan and perform the audit to obtain reasonable assurance about whether the financial statements are free from material misstatement. An audit involves performing procedures to obtain audit evidence about the amounts and disclosures in the financial statements. The procedures selected depend on the auditor s judgment, including the assessment of the risks of material misstatement of the financial statements, whether due to fraud or error. In making those risk assessments, the auditor considers internal control relevant to DART s preparation and fair presentation of the financial statements in order to design audit procedures that are appropriate in the circumstances, but not for the purpose of expressing an opinion on the effectiveness of DART s internal control. Accordingly, we express no such opinion. An audit also includes evaluating the appropriateness of accounting policies used and the reasonableness of significant accounting estimates made by management, as well as evaluating the overall presentation of the financial statements. We believe that the audit evidence we have obtained is sufficient and appropriate to provide a basis for our audit opinion. Opinion In our opinion, the financial statements referred to above present fairly, in all material respects, the financial position of DART, as of September 30, 2014 and 2013, and the changes in its financial position and its cash flows thereof for the years then ended in accordance with accounting principles generally accepted in the United States of America. 1
20 Emphasis of Matter As discussed in Note 1 to the financial statements, in March 2012, the GASB issued GASB Statement 65, Items Previously Reported as Assets and Liabilities. The provisions of this Statement are effective for DART s fiscal year ended September 30, DART has implemented this Statement retroactively for the year ended September 30, 2013 resulting in restated net position. This Statement establishes accounting and financial reporting standards that reclassify, as deferred outflows of resources or deferred inflows of resources, certain items that were previously reported as assets and liabilities and recognizes, as outflows of resources or inflows of resources, certain items that were previously reported as assets and liabilities. This Statement also provides other financial reporting guidance related to the impact of the financial statement elements deferred outflows of resources and deferred inflows of resources, such as changes in the determination of the major fund calculations and limiting the use of the term deferred in financial statement presentations. Our opinion is not modified with respect to this matter. Other Matters Required Supplementary Information Accounting principles generally accepted in the United States of America require that the Management s Discussion and Analysis and the Schedule of Funding Progress, as listed in the table of contents, be presented to supplement the basic financial statements. Such information, although not a part of the basic financial statements, is required by Governmental Accounting Standards Board who considers it to be an essential part of financial reporting for placing the basic financial statements in an appropriate operational, economic, or historical context. We have applied certain limited procedures to the required supplementary information in accordance with auditing standards generally accepted in the United States of America, which consisted of inquiries of management about the methods of preparing the information and comparing the information for consistency with management s responses to our inquiries, the basic financial statements, and other knowledge we obtained during our audit of the basic financial statements. We do not express an opinion or provide any assurance on the information because the limited procedures do not provide us with sufficient evidence to express an opinion or provide any assurance. Supplementary Information Our audit was conducted for the purpose of forming an opinion on the financial statements that collectively comprise DART s basic financial statements. The Introductory Section and Statistical Section, as listed in the table of contents, are presented for purposes of additional analysis and are not a required part of the basic financial statements. The Introductory Section and Statistical Section have not been subjected to the auditing procedures applied in the audit of the basic financial statements, and accordingly, we do not express an opinion or provide any assurance on them. Dallas, Texas February 3, 2015 Crowe Horwath LLP 2
21 MANAGEMENT S DISCUSSION AND ANALYSIS (UNAUDITED) FOR THE YEARS ENDED SEPTEMBER 30, 2014 and 2013 (Dollars in Thousands) The management of Dallas Area Rapid Transit (DART) offers the users of DART s financial statements this narrative overview and analysis of the financial activities for the fiscal years ended September 30, 2014 and This discussion and analysis is designed to assist the reader to focus on significant financial activities and identify any significant changes in the financial position of DART. It should be read in conjunction with the financial statements that follow this section. All amounts, unless otherwise indicated, are expressed in thousands of dollars. FINANCIAL HIGHLIGHTS As of September 30, 2014 and 2013, total assets and deferred outflows of resources of DART exceeded total liabilities by $2,039,587 and $2,185,147 respectively. The amount of unrestricted net position as of September 30, 2014 was $920,666 compared to $827,165 in The net position of DART decreased by $145,560 during the current fiscal year compared to a decrease of $137,985 last year. The decrease during 2014 is mainly due to a loss recognized on the transfer of high occupancy vehicle (HOV) lane operation to Texas Department of Transportation, as well as increases in benefits, labor, interest, purchased transportation and decreases in federal grant revenues. The decrease in 2013 was due to increases in interest and depreciation expenses and decreases in federal grants. DART s total debt increased by $81,126 (2%) during the current fiscal year compared to an increase of $127,180 (3%) in The increase in 2014 is due to additional borrowings in the form of commercial paper notes and Transportation Infrastructure Finance and Innovation Act (TIFIA) bonds. The increase in 2013 was due to additional borrowings in the form of bonds, commercial paper notes and TIFIA bonds. The proceeds from these additional borrowings were used to pay for capital project costs. Debt information is summarized on page 12 of this management discussion and analysis. Sales and use tax revenue was $486,564 in 2014 compared to $456,524 in It increased by 7% ($30,040) in 2014 compared to an increase of 5% ($23,222) in Capital contributions from federal, state and local governments were $38,864 in 2014 and $134,148 in Such contributions were used to finance DART s transit system expansion projects and acquisition of light rail vehicles, buses and equipment. Other federal grants were $92,211 in 2014 compared to $17,418 in For fiscal year 2014, total expenses exceeded total revenues resulting in a loss before capital contributions and grants of $164,032 compared to $272,133 for The loss in 2014 is lower than that of 2013 due primarily to an increase in sales and use tax revenue. BASIC FINANCIAL STATEMENTS Management s Discussion and Analysis serves as an introduction to DART s basic financial statements. DART s basic financial statements are comprised of four components: Statements of Net Position; Statements of Revenues, Expenses, and Changes in Net Position; Statements of Cash Flows; and Notes to the Financial Statements. The Statements of Net Position presents information on all of DART s assets, deferred outflows of resources, liabilities, and deferred inflows of resources. Assets plus deferred outflows of resources, less liabilities, less deferred inflows of resources equals net position. Over time, increases or decreases in net position may serve as a useful indicator of changes in the financial position of DART. The Statements of Net Position is shown on page 14 of this report. The Statements of Revenues, Expenses, and Changes in Net Position present information on revenues, expenses, capital contributions, and how DART s net position changed during the two most recent fiscal years. All changes in net position are reported as soon as the underlying event giving rise to the changes occurs, regardless of the timing of related cash flows. Thus, revenues, expenses, and capital contributions are reported in the statements for some items that result in cash flows only in future fiscal periods. The increase or decrease in net position may serve as an indicator of the effect of DART s current year operation on its financial position. The Statements of Revenues, Expenses, and Changes in Net Position are shown on page 15 of this report. 3
22 MANAGEMENT S DISCUSSION AND ANALYSIS (UNAUDITED) FOR THE YEARS ENDED SEPTEMBER 30, 2014 and 2013 (Dollars in Thousands) The Statements of Cash Flows summarize all of DART s cash flows into four categories: cash flows from operating activities; cash flows from non-capital financing activities; cash flows from investing activities; and cash flows from capital and related financing activities. The statements of cash flows, along with related notes and information in other financial statements, can be used to assess the following: DART s ability to generate positive cash flows and pay its debt as the debt matures; the reasons for differences between DART s operating cash flows and operating income (loss); and the effect of cash and non-cash investing, capital, and financing activities on DART s financial position. The Statements of Cash Flows are shown on pages of this report. Notes to the Financial Statements provide additional information that is essential to fully understand the data provided in the Statements of Net Position, Statements of Revenues, Expenses, and Changes in Net Position, and Statements of Cash Flows. The Notes to the Financial Statements are shown on pages of this report. The activities of DART are accounted for as a proprietary fund and are presented in the financial statements of DART as business type activities. The activities of DART are supported by a 1% sales and use tax within the member jurisdictions, fare collections, federal, state, and local financial assistance, and other receipts such as advertising and rental income. The financial statements of DART include the accounts and operations of blended component units, Regional Rail Right-of-Way Corporation and Dallas Area Rapid Transit Bus Service, LGC. FINANCIAL ANALYSIS Statements of Net Position Total assets and deferred outflows of resources of DART exceeded total liabilities by $2,039,587 and $2,185,147 as of September 30, 2014 and 2013, respectively. The largest portion of this excess (53% in 2014 and 60% in 2013) was net investment in capital assets (capital assets less related outstanding debt). DART uses these capital assets to provide public transportation services to customers and member jurisdictions; consequently, these assets are not available for future spending. Although DART s investments in capital assets are reported net of related debt, it should be noted that the resources needed to repay this debt must be obtained from other sources such as sales and use tax and farebox revenues, since the capital assets themselves cannot be used to liquidate these liabilities. Condensed Summary of Assets, Liabilities, Deferred Inflows of Resources, and Net Position Current assets $1,064,407 $999,342 $1,000,872 Other non-current assets 335, , ,479 Capital assets (net of accumulated depreciation) 4,810,004 4,877,612 4,877,773 Total assets 6,209,769 6,278,654 6,317,124 Deferred outflows of resources 13,965 15,664 17,505 Total assets and deferred outflows of resources 6,223,734 6,294,318 6,334,629 Current liabilities 427, , ,506 Non-current liabilities 3,756,165 3,750,617 3,617,126 Total liabilities 4,184,147 4,109,171 4,006,632 Deferred inflows of resources Accumulated increase in fair value of fuel hedging Derivative - - 4,865 Total liabilities and deferred inflows of resources 4,184,147 4,109,171 4,011,497 Net position Net investment in capital assets 1,071,576 1,320,349 1,512,832 Restricted for: Debt service 37,560 27,415 10,760 Security for lease/leaseback liabilities 9,785 10,218 10,543 Unrestricted 920, , ,997 Total net position $2,039,587 $2,185,147 $2,323,132 4
23 MANAGEMENT S DISCUSSION AND ANALYSIS (UNAUDITED) FOR THE YEARS ENDED SEPTEMBER 30, 2014 and 2013 (Dollars in Thousands) Other non-current assets decreased by $66,342 in 2014 compared to a decrease of $36,779 in The decrease in 2014 is due to a decrease in restricted investments held for system expansion and acquisition as a result of spending on capital projects. The decrease in 2013 was mainly due to decreases in restricted investments held for system expansion and acquisition as a result of spending on capital projects and payments made on capital lease/leaseback liabilities. As of September 30, 2014, $9,785 of DART s net position is restricted to satisfy the requirements of an amended lease/leaseback agreement compared to $10,218 as of September 30, The unrestricted portion of net position, $920,666 in 2014 and 827,165 in 2013 represent resources available to meet DART s ongoing obligations. The DART Board committed $49,028 and $44,746 of the unrestricted net position for self-insurance and financial reserves in 2014 and 2013, respectively. The increase in unrestricted net position of $93,501 (11%) in 2014 is due to an increase in sales tax revenue. The increase in unrestricted net position of $38,168 (5%) in 2013 was due to an increase in sales tax revenue. Statements of Revenues, Expenses, and Changes in Net Position During fiscal year 2014, DART s activities resulted in a decrease in net position of $145,560 compared to a decrease of $137,985 in The decrease during 2014 is due to a loss on the transfer of HOV operations as well as increases in benefits, labor, interest, purchased transportation and decreases in federal capital contributions. The decrease during 2013 was due to increases in interest and depreciation expense and decreases in federal grants. The key elements of the changes in net position for the fiscal years ended September 30 with comparative information for 2012 are shown in the following table. Summary of Revenues, Expenses, and Changes in Net Position Operating revenues Passenger revenues $ 70,902 $ 67,569 $ 59,809 Advertising, rent and other 13,573 16,146 20,306 Total operating revenues 84,475 83,715 80,115 Operating expenses Labor 216, , ,009 Benefits 99,851 87,302 86,734 Services 33,869 34,775 30,153 Materials and supplies 44,327 53,224 49,120 Purchased transportation 46,900 43,716 55,640 Depreciation 236, , ,875 Utilities 17,151 20,946 18,499 Taxes, leases, and other 5,245 5,604 5,732 Casualty and liability 4,582 5,329 5,048 Total operating expenses 704, , ,810 Operating loss (620,044) (617,692) (565,695) Non-operating revenues (expenses) Sales and use tax revenue 486, , ,302 Investment income 19,547 20,301 27,315 Build America Bonds tax credit 28,259 28,406 30,462 Other federal grants 92,211 17,418 56,161 Other non-operating revenues 15,760 12,226 11,392 Interest expense (182,581) (178,853) (154,258) Street improvements for member cities (2,127) (6,615) (5,615) Other non-operating expenses (1,621) (3,848) (3,445) Total net non-operating revenues 456, , ,314 Loss before capital contributions and grants (164,032) (272,133) (170,381) Capital contributions 38, , ,669 Loss before special item (125,168) (137,985) (28,712) Special Item: Loss on transfer of HOV operations to TXDOT (20,392) - - Decrease in net position (145,560) (137,985) (28,712) Net position, beginning of the year (as restated) 2,185,147 2,323,132 2,351,844 Net position, end of the year $2,039,587 $2,185,147 $2,323,132 Significant changes in revenues and expenses are shown and explained on the following pages. 5
24 MANAGEMENT S DISCUSSION AND ANALYSIS (UNAUDITED) FOR THE YEARS ENDED SEPTEMBER 30, 2014 and 2013 (Dollars in Thousands) REVENUES The following table summarizes revenues for fiscal year 2014 and 2013 with comparative information for 2012: REVENUES AND CAPITAL CONTRIBUTIONS Revenues Passenger revenues $ 70,902 $ 67,569 $ 59,809 Advertising, rent and other 13,573 16,146 20,306 Sales and use tax revenue 486, , ,302 Other federal grants 92,211 17,418 56,161 Investment income 19,547 20,301 27,315 Capital contributions 38, , ,669 Build America Bonds tax credit 28,259 28,406 30,462 Other revenues 15,760 12,226 11,392 Total $765,680 $752,738 $780,416 Passenger revenues include farebox receipts, monthly and annual pass revenues, paratransit revenue, and special event fares. Passenger revenues increased by 5% ($3,333) in 2014 compared to a 13% ($7,760) increase in The increase in 2014 is due to increases in commuter rail ridership and additional receipts related to the DLink and Arlington MAX services. The increase in 2013 was due to an increase in light rail ridership and a fare increase that became effective December Advertising, rent and other Advertising income includes revenues from advertisements at transit stations, on DART buses, and electronic signs on light rail cars. Rental income includes revenue from the rental of land along the rail corridor and other properties. Advertising, rent and other income decreased by 16% ($2,573) in 2014 compared to a decrease of 20% ($4,160) in The decreases in both 2014 and 2013 were due to lower amount of reimbursement of HOV operating costs for service provided outside of the DART service area compared to the previous years. In 2014 advertising also decreased due to the decrease in the size of DART bus fleet. Sales and use tax revenue Sales and use tax revenue is a dedicated 1% tax imposed on certain items within DART s member jurisdictions or service area. Sales and use tax revenue increased by 7% ($30,040) in 2014 compared to an increase of 5% ($23,222) in The increases in both 2014 and 2013 are due to a relative improvement in the local economy resulting in better than previous year s retail sales. Sales and use tax revenue constituted approximately 64% of DART's total revenues in 2014 compared to 61% in Other federal grants Other federal grant revenues increased by 429% ($74,793) in 2014 compared to a decrease of 69% ($38,743) in The decrease in 2013 was due to a delay by the metropolitan planning organization in calculating sub-allocation of formula funds. This resulted in higher revenues for DART received $1,528 in 2014 and $1,545 in 2013 from the Federal Transit Administration (FTA) for vanpool and ozone programs and $777 in 2014 compared to $706 in 2013 in the form of grants from the United States Department of Homeland Security. Capital contributions Capital contributions include federal, state and local grants and contributions. Capital contributions decreased by 71% ($95,284) in 2014 compared to a decrease of 5% ($7,521) in The decreases in both 2014 and 2013 were mainly due to lower federal and state capital contributions as a result of completion of projects funded with such grants. Investment income Investment income decreased by 4% ($754) in 2014 compared to 26% ($7,014) decrease in The decrease in 2014 is due to a decrease in investments held to pay lease/leaseback obligations The decrease in 2013 wes due to changes in the market value of investments, a decrease in investments held to pay lease/leaseback obligations and a slightly lower interest rate during Build America Bonds tax credit The Build America Bonds (BABs) tax credit decreased by 0.5% ($147) in 2014 compared to a 7% ($2,056) decrease in The decreases in both 2014 and 2013 were due to budget cuts by the Federal government, or sequestration. Other revenues Other revenues increased by 29% ($3,534) in 2014 compared to a 7% ($834) increase in Other revenues include: revenues from billings to the Fort Worth Transportation Authority (The T) for their share of the Trinity Railway Express (TRE) commuter rail service; toll credits received from the State of Texas as a local match for FTA capital grants; and alternative fuel tax credits. Factors contributing to the increases in both 2014 and 2013 include a gain on disposal of assets and an increase in alternative fuel tax credits received due to conversion of diesel fuel operated buses to compressed natural gas (CNG) operated new bus fleet and paratransit vehicles. 6
")

 The following")

25 MANAGEMENT S DISCUSSION AND ANALYSIS (UNAUDITED) FOR THE YEARS ENDED SEPTEMBER 30, 2014 and 2013 (Dollars in Thousands) The following charts summarize revenues for fiscal years 2012 through
26 MANAGEMENT S DISCUSSION AND ANALYSIS (UNAUDITED) FOR THE YEARS ENDED SEPTEMBER 30, 2014 and 2013 (Dollars in Thousands) EXPENSES The following table summarizes expenses for fiscal year 2014 and 2013 with comparative information for 2012: EXPENSES BY OBJECT CLASS Expenses Labor $216,188 $211,801 $202,009 Benefits 99,851 87,302 86,734 Services 33,869 34,775 30,153 Materials and supplies 44,327 53,224 49,120 Purchased transportation 46,900 43,716 55,640 Depreciation and amortization 236, , ,875 Utilities 17,151 20,946 18,499 Taxes, leases and other 5,245 5,604 5,732 Casualty and liability 4,582 5,329 5,048 Street improvements for member cities 2,127 6,615 5,615 Interest and financing expenses 182, , ,258 Other non-operating expense 1,621 3,848 3,445 Loss on transfer of HOV operations 20, Total $ 911,240 $ 890,723 $ 809,128 Labor Labor costs increased by 2% ($4,387) in 2014 compared to an increase of 5% ($9,792) in The increase in 2014 is due to merit increases. The increase in 2013 was due to positions filled in Maintenance, DART Police, Technology, and Revenue Operations. Termination payment to some HOV employees and merit increase also contributed to the increase. Benefits Benefits increased by 14% ($12,549) in 2014 compared to a 0.7% ($568) increase in The increase in 2014 is mainly due to a significant (32%) increase in healthcare costs as a result of the increase in the number of large medical and pharmacy claims. The smaller increase in 2013 was due to increases in healthcare costs, payroll taxes, and contributions to retirement plans net of a decrease in workers compensation claim costs as a result of improved claim experience. Increases in payroll taxes and contributions to retirement plans in 2013 were as a result of an increase in labor cost. Services Services include contracted services such as: security, vehicles, equipment and right-of-way maintenance, advertising, marketing, computing, communication, legal, governmental, and environmental services. Services decreased by 3% ($906) in 2014 compared to an increase of 15% ($4,622) in The decrease in 2014 is due to less marketing and advertising costs in 2014 compared to the year before because there was only one light rail station opening in 2014 compared to two stations opened in The increase in 2013 was due to increased work on the commuter rail right-of-way maintenance, spending on the 511 traffic information system that became operational during 2013, advertising costs associated with the Irving II and Rowlett light rail openings in December 2012, and an increase in software licenses needed for the new radio communications program. Materials and supplies Materials and supplies include the cost of fuel, parts and supplies used to operate and maintain vehicles, equipment, and facilities. Materials and supplies expenses decreased 17% (8,897) in 2014 compared to an increase of 8% (4,104) in The decrease in 2014 is due to less spending on bus parts and savings in fuel costs as a result of replacing the older bus fleet with new compressed natural gas (CNG) buses, and a decrease in allowance for obsolete parts. The increase in 2013 is mainly due to obsolete/surplus parts expense as a result of replacing the older bus fleet with new compressed natural gas (CNG) buses. Some of the spare parts maintained for the old buses could not be used on the new buses. Purchased transportation Purchased transportation represents the costs of contracted transportation services such as commuter rail, paratransit, DART on-call, and shuttle services. Purchased transportation expenses increased by 7% ($3,184) in 2014 compared to a 21% ($11,924) decrease in The increase in 2014 is mainly due to modifications to the paratransit service contract that resulted in additional charges during The decrease in 2013 is due to changes in the paratransit service delivery program and service provider which resulted in cost savings during Depreciation Depreciation expenses decreased by 1% ($2,304) in 2014 compared to a 24% ($45,835) increase in Depreciation was lower in 2014 than 2013 because 2013 numbers included an accelerated depreciation for an impairment loss of $8,318 due to the unexpected wear of the Central Business (CBD) light rail line segment rail. The increase in 2013 was also due to new assets placed in service and $834 for a light rail vehicle that was derailed and damaged during
27 MANAGEMENT S DISCUSSION AND ANALYSIS (UNAUDITED) FOR THE YEARS ENDED SEPTEMBER 30, 2014 and 2013 (Dollars in Thousands) Utilities Utilities represent the cost of electricity, telecommunications, water, sewer, and natural gas. Utilities decreased by 18% ($3,795) in 2014 compared to an increase of 13% ($2,447) in The decrease in 2014 is due to a new electricity contract with a lower rate compared to the previous year. The increase in 2013 was due to an increase in electricity usage as a result of opening new light rail segments and operating facilities. Taxes, leases, and other Taxes, leases, and other includes fuel and lube taxes, equipment rentals, leases of operating and passenger facilities, training, travel, business meetings, membership dues, subscriptions, employee programs and allowance for uncollectible receivables. Taxes, leases, and other expenses decreased by 6% ($359) in 2014 compared to a decrease of 2% ($128) in The decrease in 2014 is due to less bad debt expense compared to last year. The decrease in 2013 was due to leases terminated during the year. Casualty and liability Casualty and liability expenses decreased by 14% ($747) in 2014 compared to an increase of 6% ($281) in The decrease in 2014 is due to favorable claims experience. The increase in 2013 was due to higher claim losses. Street improvements Local assistance is provided to eligible member jurisdictions in the form of technical and financial assistance to reduce traffic congestion and complement bus and public transit operations. The street improvement program costs decreased by 68% ($4,488) in 2014 compared to an increase of 18% ($1,000) in The decrease in 2014 is due to less work on intelligent transportation systems as a result of projects getting close to completion. The increase in 2013 was due to increased work on intelligent transportation systems and street improvement projects that are expected to improve the flow of vehicle traffic. Interest Interest expense increased by 2% ($3,728) in 2014 compared to an increase of 16% ($24,595) in In both 2014 and 2013, interest expense increased due to additional borrowings and less interest capitalized as a result of the completion of Rowlett extension, Irving I, Irving II and Irving III light rail service expansion projects. Other non-operating expenses Other non-operating expenses decreased by 58% ($2,227) in 2014 compared to an increase of 12% ($403) in The decrease in 2014 is due to less spending related to the regional commuter rail project during The increase in 2013 was due to general planning and consulting service costs. Loss on transfer of HOV operations: DART and the Texas Department of Transportation (TXDOT) entered into an agreement effective July 9, 2014 to transfer the responsibilities for operations and maintenance of high occupancy vehicle (HOV) lanes from DART to TXDOT. As of the effective date, DART had $20,392 worth of HOV- related assets on its books. As part of the transfer of HOV operations and assets, no consideration was paid to DART by TXDOT. As a result, DART recorded a loss of $20,392 which is the book value of HOV assets as of July 9, 2014 in accordance with Government Accounting Standards Statement No. 69, Government Combinations and Disposal of Government Operations. The charts on the following page summarize expenses for fiscal years 2012 through
")

 The following")

28 MANAGEMENT S DISCUSSION AND ANALYSIS (UNAUDITED) FOR THE YEARS ENDED SEPTEMBER 30, 2014 and 2013 (Dollars in Thousands) The following charts summarize expenses for fiscal years 2012 through 2014: - 10
 lanes, DART on-call and shuttle services.")


29 MANAGEMENT S DISCUSSION AND ANALYSIS (UNAUDITED) FOR THE YEARS ENDED SEPTEMBER 30, 2014 and 2013 (Dollars in Thousands) Expenses by function Transportation includes expenses that are directly related to the operation of bus, light rail, commuter rail, vanpool, paratransit, high occupancy vehicle (HOV) lanes, DART on-call and shuttle services. These expenses include such items as wages and benefits for operators, transit center service employees, transportation supervisors and managers, DART police, cost of fuel, tires and tubes, propulsion power, purchased transportation, customer service, revenue collection, and other related costs. Maintenance includes labor costs and benefits for vehicle and facility maintenance, materials and supplies, utilities, and all other costs incurred for maintenance purposes. General and administration includes administrative personnel costs, benefits, accident, general liability and contract claims, street improvements; loss on transfer on HOV operations during 2014, and other related costs. Depreciation includes depreciation expense on all depreciable capital assets. Interest includes interest expense incurred on debt net of capitalized interest. EXPENSES BY FUNCTION Transportation $ 271,425 $ 265,378 $ 267,001 Maintenance 138, , ,708 General and administration 82,674 68,636 70,286 Depreciation and amortization 236, , ,875 Interest 182, , ,258 Total $ 911,240 $ 890,723 $ 809,128 11
30 MANAGEMENT S DISCUSSION AND ANALYSIS (UNAUDITED) FOR THE YEARS ENDED SEPTEMBER 30, 2014 and 2013 (Dollars in Thousands) CAPITAL ASSETS AND DEBT ADMINISTRATION Capital assets Investment in capital assets includes: land and rights-of-way; transitways; buildings and improvements; revenue and nonrevenue vehicles and equipment; and furniture, fixtures, and leasehold improvements. DART s investment in capital assets as of September 30, 2014, is $4,810,004 compared to $4,877,612 in The net decrease in capital assets during 2014 is $67,608 (1%) compared to a slight decrease of $161 in The following table summarizes capital assets net of depreciation as of September 30 with comparative information for Capital Assets (Net of Depreciation) Land and rights-of-way $ 609,498 $ 578,169 $ 554,714 Projects in progress 70, , ,567 Transitways 2,914,631 2,875,423 2,497,655 Buildings and improvements 429, , ,298 Revenue and non-revenue vehicles and equipment 776, , ,931 Furniture, fixtures, and leasehold improvements 8,899 14,734 10,608 Total $4,810,004 $4,877,612 $4,877,773 The net decreases in both 2014 and 2013 are due to depreciation. However, there were increases before depreciation in both fiscal years due to the cost of planning, designing and building the Light Rail Transit (LRT) Phase II and Phase III expansions. The Phase II expansion consists of approximately 46 miles of light rail transit lines. These new lines extend northwest from Downtown Dallas to the cities of Carrollton, Farmers Branch, and Irving and southeast from Downtown Dallas to Buckner Blvd. in South Dallas and northeast from the Downtown Garland Station to the Rowlett Park-and-Ride. The first section of the southeast extension, Bryan Street to Fair Park, opened for service on September 14, Other northwest and southeast extensions opened for service during fiscal year 2011 and the first section of Irving line segment opened for service in July The second section of the Irving line segment and the northeast (Rowlett) opened for service in December 2012 and the third Irving line segment opened for service in August The Phase III light rail build-out consists of approximately three miles extension of the Blue Line from Ledbetter Station toward the University of North Texas (UNT) Dallas Campus located at the southeast corner of Camp Wisdom Road and University Hills Blvd. Additional information on DART s capital assets is shown in note 7 on pages Outstanding debt Outstanding debt includes sales tax revenue commercial paper notes, senior lien revenue bonds, TIFIA bonds payable, and capital lease/leaseback liabilities. As of September 30, 2014, DART had total outstanding debt of $3,857,925 compared to $3,776,799 as of September 30, Outstanding debt increased by 2% ($81,126) in 2014 compared to a 3% ($127,180) increase in The following table summarizes DART s total outstanding debt. Outstanding Debt Sales tax revenue commercial paper notes $ 180,000 $ 100,000 $ 70,000 Senior lien revenue bonds payable 3,377,920 3,411,095 3,290,060 TIFIA bonds payable 100,000 45,000 Capital lease/leaseback liabilities 200, , ,559 Total debt $3,857,925 $3,776,799 $3,649,619 The sales tax revenue commercial paper notes outstanding balance was $180,000 as of September 30, 2014 compared to $100,000 as of September 30, The commercial paper notes were issued as a senior subordinate lien to sales and use tax revenues and are payable from the 1% sales and use tax receipts. The increases during both 2014 and 2013 are due to additional borrowings to pay for capital project costs. 12
31 MANAGEMENT S DISCUSSION AND ANALYSIS (UNAUDITED) FOR THE YEARS ENDED SEPTEMBER 30, 2014 and 2013 (Dollars in Thousands) Senior lien revenue bonds outstanding are $3,377,920 as of September 30, 2014 and $3,411,095 as of September 30, These are senior lien bonds secured by and payable from the 1% sales and use tax receipts and farebox revenues (pledged revenues). The decrease of $33,175 in 2014 is due to $25,480 principal payment made on December 1, 2013 and $7,695 early payment of bond (extinguishment of debt) made in May The increase of $121,035 in 2013 was due to an additional borrowing during fiscal year 2013 net of principal payments. All DART bonds are issued to finance capital projects. The senior lien revenue bonds are shown net of original issuance premium (discount) of $86,579 and $94,155 as of September 30, 2014 and 2013 in the Statements of Net Position. During 2014, DART maintained a AA+ credit rating from Standard & Poor s, and a Aa2 from Moody s for its bonds. TIFIA bonds payable are $100,000 as of September 30, 2014 compared to $45,000 as of September 30, On December 13, 2012 DART entered into a Transportation Infrastructure Finance and Innovation Act (TIFIA) financing agreement with the U.S Department of Transportation (DOT). Under this loan agreement, DART issued a Senior Lien Obligation bond to borrow up to $105,000 from the DOT. The proceeds from the bond are used to pay for the cost of the third phase of DART s light rail Orange Line extension project, which extends DART s light rail service from Irving to the Dallas Fort Worth International Airport. The TIFIA financing agreement is reimbursement-based and DART requested the money after paying for the capital project costs. The TIFIA bond is a Senior Lien Obligation and is secured by and payable from Pledged Revenues on parity with other Senior Lien Obligations. Capital lease/leaseback liabilities are $200,005 and $220,704 as of September 30, 2014 and 2013, respectively. The decreases in capital lease/leaseback liabilities in both 2014 and 2013 are due to lease payments. Additional information on DART s outstanding debt is shown in footnotes ECONOMIC OUTLOOK Sales and use tax is the largest source of revenue for DART, representing 64% of total revenues in 2014 compared to 61% in Sales and use tax revenues are affected by changes in the local economy. During fiscal year 2014, DART s sales and use tax revenues showed a 7% increase compared to the previous year. Actual sales and use tax revenues in 2014 are $486,564 compared to $456,524 in The sales and use tax budget for 2015 is $502,986 compared to $486,564 actual for The budget for 2015 represents a 3.4% increase from the 2014 actual sales and use tax revenues. REQUESTS FOR INFORMATION This financial report is designed to provide our member jurisdictions, customers, investors, and creditors with a general overview of DART s finances. If you have questions concerning any of the information provided in this report or need additional financial information, contact the Chief Financial Officer at Dallas Area Rapid Transit, 1401 Pacific Avenue, P.O. Box , Dallas, TX
32 DALLAS ARE RAPID TRANSIT STATEMENTS OF NET POSITION SEPTEMBER 30, 2014 and 2013 (Dollars in Thousands) ASSETS CURRENT ASSETS Cash and cash equivalents $ 27,217 $ 75,826 Investments 760, ,424 Sales and use tax receivable 85,319 77,752 Transit revenue receivable, net 2,553 2,759 Due from federal and other governments 33,275 24,575 Materials and supplies inventory, net 28,693 24,252 Prepaid transit expense and other 2,840 2,455 Restricted investments held by trustee for debt service 97,808 87,353 Restricted investments held for advance funding agreements 12,013 11,737 Restricted investments held to pay capital lease/leaseback liabilities 14,096 36,209 TOTAL CURRENT ASSETS 1,064, ,342 NONCURRENT ASSETS Restricted investments for system expansion and acquisition 39, ,743 Restricted investments held as security for capital lease/leaseback liabilities 9,785 10,218 Investment in joint venture 20,722 22,058 Investment in managed HOV lane agreements 66,706 51,972 Capital assets Land and rights-of-way 609, ,169 Projects in progress 70, ,542 Depreciable capital assets, net of depreciation 4,129,661 4,093,901 Restricted investments held to pay capital lease/leaseback liabilities 185, ,495 Net pension asset 11,346 9,457 Unamortized bond insurance premium and other 1,638 1,757 TOTAL NONCURRENT ASSETS 5,145,362 5,279,312 TOTAL ASSETS 6,209,769 6,278,654 DEFERRED OUTFLOWS OF RESOURCES Loss on debt refunding 13,965 15,664 TOTAL ASSETS AND DEFERRED OUTFLOWS OF RESOURCES 6,223,734 6,294,318 LIABILITIES CURRENT LIABILITIES Accounts payable and accrued liabilities 72,345 76,563 Commercial paper notes payable 180, ,000 Current portion of capital lease/leaseback liabilities 14,096 36,209 Current portion of repayment due to State Comptroller Local Assistance Program payable 1,497 1,997 Retainage payable 27,860 23,514 Unearned revenue and other liabilities 32,898 34,029 Accrued interest payable from restricted assets 60,247 59,938 Current portion of senior lien revenue bonds payable 38,215 25,480 TOTAL CURRENT LIABILITIES 427, ,554 NONCURRENT LIABILITIES Accrued liabilities 34,573 31,129 Repayment due to State Comptroller 9,399 10,223 Senior lien revenue bonds payable 3,426,284 3,479,770 Transportation Infrastructure Finance and Innovation Act (TIFIA) bonds payable 100,000 45,000 Capital lease/leaseback liabilities 185, ,495 TOTAL NONCURRENT LIABILITIES 3,756,165 3,750,617 TOTAL LIABILITIES 4,184,147 4,109,171 NET POSITION Net investment in capital assets 1,071,576 1,320,349 Restricted for debt service 37,560 27,415 Restricted as security for capital lease/leaseback liabilities 9,785 10,218 Unrestricted 920, ,165 TOTAL NET POSITION $2,039,587 $2,185,147 The accompanying notes are an integral part of these financial statements. 14
33 STATEMENTS OF REVENUES, EXPENSES, AND CHANGES IN NET POSITION FOR THE YEARS ENDED SEPTEMBER 30, 2014 and 2013 (Dollars in Thousands) OPERATING REVENUES Passenger revenues $ 70,902 $ 67,569 Advertising, rent, and other 13,573 16,146 TOTAL OPERATING REVENUES 84,475 83,715 OPERATING EXPENSES Labor 216, ,801 Benefits 99,851 87,302 Services 33,869 34,775 Materials and supplies 44,327 53,224 Purchased transportation 46,900 43,716 Depreciation and amortization 236, ,710 Utilities 17,151 20,946 Taxes, leases, and other 5,245 5,604 Casualty and liability 4,582 5,329 TOTAL OPERATING EXPENSES 704, ,407 NET OPERATING LOSS (620,044) (617,692) NON-OPERATING REVENUES (EXPENSES) Sales and use tax revenue 486, ,524 Investment income 4,037 2,272 Interest income from investments held to pay capital lease/leaseback 15,510 18,029 Interest expense on capital lease/leaseback (15,510) (18,029) Street improvements (2,127) (6,615) Interest and financing expenses (167,071) (160,824) Build America Bonds tax credit 28,259 28,406 Other federal grants 92,211 17,418 Other non-operating revenues 15,760 12,226 Other non-operating expenses (1,621) (3,848) NET NON-OPERATING REVENUES 456, ,559 LOSS BEFORE CAPITAL CONTRIBUTIONS AND GRANTS (164,032) (272,133) CAPITAL CONTRIBUTIONS AND GRANTS Federal capital contributions 36, ,877 State capital contributions 1,596 2,676 Local capital contributions 1,245 7,595 TOTAL CAPITAL CONTRIBUTIONS AND GRANTS 38, ,148 LOSS BEFORE SPECIAL ITEM (125,618) (137,985) SPECIAL ITEM Loss on transfer of HOV Lane operations (see note 24) (20,392) - CHANGE IN NET POSITION (145,560) (137,985) TOTAL NET POSITION BEGINNING OF YEAR (as restated) 2,185,147 2,323,132 TOTAL NET POSITION END OF YEAR $2,039,587 $2,185,147 The accompanying notes are an integral part of these financial statements. 15
34 STATEMENTS OF CASH FLOWS FOR THE YEARS ENDED SEPTEMBER 30, 2014 and 2013 (Dollars in Thousands) CASH FLOWS FROM OPERATING ACTIVITIES Receipts from customers $ 85,171 $ 88,088 Cash flows from other sources 11,045 13,552 Payments to suppliers of goods and services (116,161) (114,620) Payments to purchased transportation service providers (46,710) (46,639) Payments to employees (212,978) (209,293) Benefit payments on behalf of employees (99,732) (91,036) NET CASH USED BY OPERATING ACTIVITIES (379,365) (359,948) CASH FLOWS FROM NON-CAPITAL FINANCING ACTIVITIES Sales and use tax receipts 478, ,874 Other federal grants 92,247 18,804 Other non-capital financing receipts Build America Bonds tax credit 28,269 29,137 Other non-capital financing payments (67) (152) Local Assistance Program and street improvements (2,627) (10,846) NET CASH PROVIDED BY NON-CAPITAL FINANCING ACTIVITIES 596, ,967 CASH FLOWS FROM INVESTING ACTIVITIES Interest on investments 4,356 2,529 Proceeds from sales and maturity of investments 972, ,030 Purchase of investments (1,076,767) (836,775) Decrease (increase) in restricted assets 71,761 (1,389) Investment in managed HOV lane agreements (14,734) (13,187) NET CASH USED BY INVESTING ACTIVITIES (43,222) (69,792) CASH FLOWS FROM CAPITAL AND RELATED FINANCING ACTIVITIES Acquisition and construction of capital assets (186,069) (270,349) Proceeds from the issuance of commercial paper notes 550, ,000 Payment on commercial paper notes (470,000) (410,000) Proceeds from the issuance of revenue bonds 151,097 Proceeds from TIFIA Bonds 55,000 45,000 Payment of debt issuance costs (2,454) Principal payment on revenue bonds (25,480) (6,740) Payment for early extinguishment of revenue bonds (7,887) - Interest and financing expenses (172,323) (162,486) Federal capital contributions 29, ,426 State capital contributions 1, Local capital contributions 1,246 3,675 Proceeds from the sale of capital assets 2, NET CASH USED BY CAPITAL AND RELATED FINANCING ACTIVITIES (222,085) (89,933) NET DECREASE IN CASH AND CASH EQUIVALENTS (48,609) (30,706) CASH AND CASH EQUIVALENTS, BEGINNING OF YEAR 75, ,532 CASH AND CASH EQUIVALENTS, END OF YEAR $ 27,217 $ 75,826 (Continued) 16
35 STATEMENTS OF CASH FLOWS FOR THE YEARS ENDED SEPTEMBER 30, 2014 and 2013 (Dollars in Thousands) RECONCILIATION OF OPERATING LOSS TO CASH USED BY OPERATING ACTIVITIES CASH FLOWS FROM OPERATING ACTIVITIES Net operating loss $(620,044) $(617,692) ADJUSTMENTS TO RECONCILE NET OPERATING LOSS TO NET CASH USED IN OPERATING ACTIVITIES Depreciation and amortization 236, ,710 Miscellaneous non-operating income 13,582 11,352 Miscellaneous non-operating expenses (1,553) (3,665) Changes in assets and liabilities Decrease in transit receivable 206 5,776 (Increase) Decrease in due from federal & other governments (1,166) 483 (Increase) Decrease in materials and supplies inventory (4,441) 4,662 (Increase) Decrease in prepaid expenses and other current assets 192 (503) (Increase) in pension assets (1,889) (1,682) Increase in accounts payable and accrued liabilities 723 3,377 (Decrease) in unearned revenue and other liabilities (1,381) (766) NET CASH USED BY OPERATING ACTIVITIES $(379,365) $(359,948) NON-CASH OPERATING, INVESTING, AND FINANCING ACTIVITIES Interest income from investments held to pay capital lease/leaseback $15,510 $18,029 Interest expense on capital lease/leaseback (15,510) (18,029) Decrease in capital lease/leaseback obligations (20,699) (68,855) Decrease in investments held to pay capital lease/leaseback 20,699 68,855 Decrease in fair value of investments (1,592) (1,291) Amortization of premium, discount, bond insurance premium costs, and loss on debt refunding (9,325) (4,645) Mass transit easements granted to DART - 7,287 Loss on transfer of HOV Lane operations (20,392) - Purchases of capital assets in accounts payable at year-end 19,376 20,905 (Concluded) The accompanying notes are an integral part of these financial statements. 17
36 NOTES TO FINANCIAL STATEMENTS FOR THE YEARS ENDED SEPTEMBER 30, 2014 and 2013 (Dollars in Thousands) 1. ORGANIZATION AND SIGNIFICANT ACCOUNTING POLICIES Organization Dallas Area Rapid Transit (DART) is a regional transportation authority of the State of Texas, created and confirmed by passage of a referendum on August 13, 1983, pursuant to Article 1118y of the Vernon's Annotated Texas Civil Statutes, as amended, and recodified into Section 452 of the Texas Transportation Code (the Code) effective September 1, DART is organized to provide public and general transportation services to 13 member jurisdictions in five counties: Dallas, Collin, Ellis, Denton, and Rockwall. The member jurisdictions in which the voters elected to be included in DART consist of the cities of Carrollton, Cockrell Hill, Dallas, Farmers Branch, Garland, Glenn Heights, Irving, Plano, Richardson, Rowlett, University Park, and the towns of Addison and Highland Park. Fifteen Board members represent the 13 member jurisdictions. Board members are appointed according to the ratio of the population of a member jurisdiction to the total population of the service area. One Board member may represent multiple jurisdictions. Amendments to DART s enabling legislation require approval of the Texas State Legislature, which holds its regular session every two years. Past legislative changes allowed the issuance of lease/leaseback transactions (see note 11), changed the collection period of sales taxes from quarterly to monthly, and allowed a joint pledge of sales and use tax and farebox revenues as security for long-term debt. Future changes to DART s enabling legislation could have a material impact on DART s financial position. The next session of the State Legislature is scheduled to begin in January On August 12, 2000, the voters of the DART service area passed a referendum that allows DART to issue up to $2.9 billion of bonds or notes that are solely payable from and secured by the DART sales and use tax revenue, have maturities beyond five years, and are issued pursuant to the authority granted at the election. On August 9, 2001, DART issued $400 million of the authorized $2.9 billion bonds. On September 10, 2002, $98.7 million of the authorized bonds were issued. On March 8, 2007, an additional $770.3 million of the authorized bonds were issued. From the $770.3 million, $317.7 million was issued to refund part of the 2001 and 2002 bonds. The remaining $452.6 million was issued to pay-off commercial paper notes. In April 2008, the Board approved the fourth issuance of Bonds (Series 2008), for $731.4 million as authorized by the Master Debt Resolution. This issuance included $341 million to refund commercial paper notes. In May 2009, the Board approved the fifth issuance of Bonds (Series 2009A and Series 2009B), for $1 billion as authorized by the Master Debt Resolution (see notes 13). In September 2010, the Board approved the sixth issuance of Bonds (Series 2010A and Series 2010B), for $824.6 million as authorized by the Master Debt Resolution (see notes 13). On November 15, 2012, DART issued and sold $127,775 in Senior Lien Sales Tax Revenue Bonds (Series 2012 Bonds). Series 2012 Bonds were issued to refund $150,000 Commercial Paper Notes. The Commercial Paper Notes were issued to finance capital expenditures for DART s system expansion and acquisition. On December 13, 2012 DART entered into a Transportation Infrastructure Finance and Innovation Act (TIFIA) financing agreement with the U.S Department of Transportation (see note 14). Under this agreement, DART borrowed $100,000 from the U.S Department of Transportation and plans to borrow an additional $5,000 during fiscal year The proceeds from the bond were used to pay for the cost of the third phase of DART s light rail Orange Line extension project, which extended DART s light rail service from Irving to the Dallas Fort Worth International Airport. These bonds are Senior Lien Revenue Bonds that are secured by, and payable from, a senior lien on Pledged Revenues. DART received approximately $486,564 in 2014 from a 1% sales and use tax imposed on certain items within its member jurisdictions compared to $456,524 in These revenues constituted approximately 64% of DART's total revenues during fiscal year 2014 compared to 61% during Approximately 50%, 15%, and 11% of these sales and use tax revenues were collected from sales in the cities of Dallas, Plano, and Irving during fiscal years 2014 compared to 51%, 15%, and 11% for fiscal year Basis of Accounting The activities of DART are accounted for as proprietary funds and therefore are reported as an enterprise fund in accordance with governmental accounting and financial reporting principles issued by the Governmental Accounting Standards Board (GASB). Accordingly, transactions are accounted for using the accrual basis of accounting. Reporting Entity DART has two blended component units, Regional Rail Right-Of-Way Corporation (RRRC) and Dallas Area Rapid Transit Bus Service, LGC (LGC). RRRC is a legally separate corporation, which was formed to facilitate the acquisition of certain properties and right-of-way for DART. The RRC Board consists of three board members that are appointed by the DART Board. LGC is a Corporation created under the LGC Act on behalf of DART to provide public transportation service (solely by bus) outside the DART service area. Currently the LGC provides bus service to the cities of Arlington and Mesquite. The LGC Board consists of five Board members who are appointed by the DART Board of Directors. Since DART appoints the governing board of the RRRC and LGC; has operational responsibility for them; and since the RRRC and LGC activities directly benefit DART; the financial information of the RRRC and LGC, are included in the accompanying financial statements of DART as blended component units in accordance with GASB Statement No. 61. Internally prepared financial statements for either RRRC or LGC may be obtained by contacting the Chief Financial Officer at Dallas Area Rapid Transit, 1401 Pacific Avenue, P.O. Box , Dallas, TX
37 NOTES TO FINANCIAL STATEMENTS FOR THE YEARS ENDED SEPTEMBER 30, 2014 and 2013 (Dollars in Thousands) New Accounting Pronouncements In March 2012, the GASB issued Statement No. 65, Items Previously Reported as Assets and Liabilities. This Statement specifies items that were previously reported as assets and liabilities that should now be reported as deferred outflows of resources, deferred inflows of resources, outflows of resources, or inflows of resources. This Statement became effective for DART during As a result of implementing GASB Statement No. 65, DART has written off $22,157 in prepaid debt issuance costs. In order to present comparative numbers in accordance with GASB Statement No. 65, prior years amounts have been restated. The Statements of Net Position and the Statements of Revenues, Expenses and Changes in Net Position shown on pages 14 and 15 reflect such restatements. In March 2012, the GASB issued Statement No. 66, Technical Corrections 2012 an amendment of GASB Statements No. 10 and No. 62. This Statement became effective for DART during 2014 and had no material impact on DART during In January 2013, the GASB issued Statement No. 69, Government Combinations and Disposals of Government Operations. This Statement specifies accounting, financial reporting and disclosure requirements related to government combinations and disposals of government operations. The requirements of this Statement are effective for financial statements for periods beginning after December 15, 2013 which is fiscal year 2015 for DART. However, DART chose to implement this statement early in order to account for and report the transfer of HOV operations to Texas Department of Transportation (TXDOT) in accordance with GASB Statement No. 69 (see note 24 on page 39). In April 2013, the GASB issued Statement No. 70, Accounting and Financial Reporting for Nonexchange Financial Guarantees. This Statement (1) requires a government that extends a nonexchange financial guarantee to recognize a liability when qualitative factors and historical data, if any, indicate that it is more likely than not that the government will be required to make a payment on the guarantee; (2) requires a government that has issued an obligation guaranteed in a nonexchange transaction to recognize revenue to the extent of the reduction in its guaranteed liabilities, and (3) specifies the information required to be disclosed by governments that extend nonexchange financial guarantees, and (4) requires new information to be disclosed by governments that receive non-exchange financial guarantees. As of September 30, 2013, DART did not extend a non-exchange financial guarantee to another organization or individual. This Statement became effective for DART during 2014 and had no material impact on DART during Cash and Cash Equivalents DART considers investments in unrestricted funds with original maturities of less than 90 days at the date of purchase to be cash equivalents. Cash and cash equivalents were $27,217 and $75,826 as of September 30, 2014 and 2013, respectively. Investments The investment balances, other than investments held to pay lease/leaseback obligations (see Note 3), on September 30, 2014 and 2013 are stated at fair value. Fair value is the amount at which an investment may be exchanged in a current transaction between willing parties other than in a forced or liquidation sale. DART utilizes quoted market prices on September 30, 2014 and 2013, as the equivalent of the fair value of investments. When both restricted and unrestricted funds are available, it is DART s policy to spend restricted funds first on eligible expenditures. Material and Supplies Inventory An inventory of supplies and parts is maintained at different DART warehouses for use in the operation and is recorded as an expense when consumed or placed in service. Inventory is stated at average cost. Capital Assets Capital assets are assets with an initial individual cost of more than five thousand dollars ($5,000) and an estimated useful life in excess of one year. Such assets are stated at cost. Depreciation is calculated using the straight-line method over the estimated useful lives of the related assets as indicated in note 7. Major improvements to buildings and equipment are capitalized. Maintenance and repairs are charged to expense as incurred. Improvements and betterments that extend the useful lives of capital assets or add new functionality are capitalized. Transit system development costs for services such as project-related design, construction, construction management, and project management costs are capitalized when incurred. Interest expense incurred during the construction phase of a capital asset is capitalized. In 2014, total interest and financing expense of $175,629 was incurred, and $8,558 of this total was capitalized. In 2013, total interest and financing expense of $175,618 was incurred, and $14,794 of this total was capitalized. Donated assets are capitalized at estimated fair value on the date of donation. Federal, State and Local Capital Contributions, and Grants Grant funds used for the acquisition of property and equipment are recorded as capital contribution revenues when the related grant eligibility requirements are met and qualified expenditures are incurred. DART received $38,864 in federal, state and local capital contributions during 2014 compared to $134,148 during Of the total capital contributions amount received during 2014, $18,933 was based on capital expenditures made during the previous years. This amount is included in Federal Capital Contributions on the Statements of Revenues, Expenses and Changes in Net Position for the fiscal year ended September 30, In addition to capital contributions, DART also received $92,211 in 2014 compared to $17,418 in 2013 in the form of other federal grants. Included in these amounts are grants that are substantially related to capital maintenance grants from the federal government. 19
38 NOTES TO FINANCIAL STATEMENTS FOR THE YEARS ENDED SEPTEMBER 30, 2014 and 2013 (Dollars in Thousands) Paid Time Off, Vacation and Sick Leave Salaried exempt and non-exempt employees are eligible for a "Paid Time Off" (PTO) benefits program. Accumulated PTO hours have no cash value unless the employee has five or more years of service. Upon termination of employment, a percentage of unused PTO hours will be paid in a lump sum based on number of years of continued service with DART. Hourly employees earn vacation and sick leave, which may be taken or accumulated up to certain levels, until paid upon retirement or termination. The liability for PTO, vacation, and sick leave has been calculated in accordance with GASB Statement No. 16, Accounting for Compensated Absences, and is included in the accounts payable and accrued liabilities line item in the accompanying Statements of Net Position. Operating Revenues and Expenses Operating revenues are generated from activities related to providing public transportation services such as bus, light rail, commuter rail, paratransit, and vanpool to DART customers. DART s operating revenues include passenger fare revenues, advertising revenues, and certain rental income. Non-operating revenues are revenues not directly related to the operations of DART's transit service. Sales and use tax revenues, Build America Bond tax credit, and investment income are classified as non-operating revenues. Operating expenses are incurred for activities directly related to providing public transportation services to DART customers. Such activities include transportation, maintenance, transit police, and general and administrative functions. Non-operating expenses include interest and financing costs, general planning and consulting work not related to current service, and the local assistance provided to eligible member jurisdictions. Revenue Recognition Operating revenues are recognized when transit service is provided. Monthly tickets and annual passes are sold for revenue service, including bus and rail operations. An estimate of unused tickets and passes is recorded as unearned transit revenue and is included in the unearned revenue and other liabilities line item in the accompanying Statements of Net Position. Sales and Use Tax Revenues Sales and use tax revenues are recognized when the underlying transactions occur. Sales and use tax revenues are subject to audits by the State Comptroller, which sometimes results in refunds to the State. Self-Insurance Liabilities DART administers and maintains self-insured reserves for employee medical, operational workers compensation, auto, and general liability (including bus/rail accidents), directors and officers liability, and light rail construction workers compensation and general liability claims. These programs are administered by DART, or in some instances, a third party. DART accrues the estimated cost of self-insurance liabilities based on actuarial review and the estimate is included in the accounts payable and accrued liabilities line item in the accompanying Statements of Net Position. The estimate includes incurred but not reported (IBNR) claims. Changes in the liabilities in 2014 and 2013 for DART's self-insured programs are as follows: Description Beginning balance $15,024 $17,014 $17,816 Current year claims and changes in estimates 6,275 2,438 3,868 Payments (4,435) (4,428) (4,670) Ending balance $16,864 $15,024 $17,014 Amounts due in one year $4,509 $4,867 $5,633 DART purchases liability insurance coverage for all-risk property, commuter rail, leased premises, crime, directors and officers and light rail project-specific professional liability and light rail build-out workers compensation and general liability. Coverage is evaluated annually and adjusted as necessary based upon exposure and claim payments. There was no significant reduction in insurance coverage from the previous year and the settlement amounts did not exceed insurance coverage for each of the past three fiscal years. Premium and Discounts on Revenue Bonds - Premiums and discounts on Senior Lien Revenue Bonds are amortized using the effective interest method. Bond insurance premiums and gains/losses on refunding are also amortized using the effective interest method over the life of the bonds. Net position Net Investment in Capital Assets, includes capital assets, net of accumulated depreciation, less the outstanding balances of any bonds, notes, or other borrowings that are attributable to the acquisition, construction, or improvement of those assets. Restricted consists of net position that is legally restricted by outside parties or by law through constitutional provisions or enabling legislation. When both restricted and unrestricted resources are available for use, generally it is DART s policy to use restricted resources first, and then unrestricted resources when they are needed. Unrestricted consists of net position that does not meet the definition of restricted or net investment in capital assets. 20
39 NOTES TO FINANCIAL STATEMENTS FOR THE YEARS ENDED SEPTEMBER 30, 2014 and 2013 (Dollars in Thousands) 2. SERVICE AGREEMENTS DART has entered into several long-term agreements with contractors to provide paratransit, commuter rail, HOV lane, DART on-call and shuttle services. Payments to service providers are recorded as purchased transportation in the accompanying Statements of Revenues, Expenses, and Changes in Net Position. The following table summarizes major amounts for services rendered in 2014 and 2013 and the current contract terms, including option periods: Summary of major services rendered in 2014 and 2013 and the current contract terms, including option periods is shown as follows: Annual Payments Contract Terms Contractor s Name Service Type Began Expires Herzog Transit Services, Inc. Commuter Rail $18,782 $18,494 10/1/2010 9/30/2015 MV Contract Transportation, Inc Paratransit, and DART 21,330 19,778 10/1/2012 9/30/2019 On-call Services Others Various 6,788 5,444 Various Various Total $46,900 $43, CASH, CASH EQUIVALENTS, AND INVESTMENTS Cash and investments, excluding investments held for lease/leaseback liabilities, as of September 30 are classified in the Statements of Net Position as follows: 9/30/2014 9/30/2013 Cash and cash equivalents $27,217 $75,826 Investments 760, ,424 Restricted investments held by trustee for debt service 97,808 87,353 Restricted investments held for advance funding agreements 12,013 11,737 Restricted investments for system expansion and acquisition 39, ,743 Restricted investments held as security for capital lease/leaseback liabilities 9,785 10,218 Total cash and investments $946,668 $963,301 Cash and investments as of September 30 consist of the following: 9/30/2014 9/30/2013 Cash on hand $2,080 $988 Cash equivalents 25,137 74,838 Investments 919, ,475 Total cash and investments $946,668 $963,301 Deposits State statutes authorize DART's cash to be deposited in demand deposits, time deposits, or certificates of deposit and require that all deposits be fully collateralized or insured. On September 30, 2014, the carrying amount of DART's deposits was $2,080 compared to $988 at September 30, Bank balances at September 30, 2014 and 2013 were entirely covered either by Federal Depository Insurance or by collateral held by DART's agent in DART's name. 21
40 NOTES TO FINANCIAL STATEMENTS FOR THE YEARS ENDED SEPTEMBER 30, 2014 and 2013 (Dollars in Thousands) Custodial Credit Risk - Custodial credit risk for deposits is the risk that, in the event of failure of a depository financial institution, DART will not be able to recover its deposits or will not be able to recover collateral securities that are in the possession of an outside party. DART s policy requires that all deposits with financial institutions must be collateralized to the extent not protected by F.D.I.C. insurance. Securities that can be accepted as collateral are limited to U.S. Government Securities, Federal Agency Securities, and Municipal Securities. Investments In accordance with the Texas Public Funds Investment Act and DART's investment policy, DART invests in, among others, obligations of the United States or its agencies and instrumentalities, and obligations of states, agencies, counties, cities, and other state political subdivisions with ratings from a nationally recognized investment rating firm of not less than "A" or its equivalent and commercial paper with ratings of not less than "A1" or "P1." In addition, State statutes authorize DART to invest funds in other cash equivalents such as money market mutual funds among other things. All DART investments are subject to the Texas Public Funds Investment Act. The following table identifies the investment types that are authorized by DART s Investment Policy. The table also identifies certain provisions of DART Investment Policy that address interest rate risk, credit risk and concentration of credit risk. Maximum Percentage of Portfolio Maximum Investment in One Issuer at the time of purchase Maximum Authorized Investment Type Maturity U.S. Government Securities None None None Federal Agency Securities None None 25% Municipal Securities None None 10% Repurchase Agreements and Reverse Repurchase Agreements 90 days 50% 5% Money Market Mutual Funds 10 years None None Commercial Paper 270 days None 5% Banker s Acceptance 270 days None 5% Certificate of Deposit 10 years None None Interest Rate Risk - Interest rate risk is the risk that changes in market interest rates will adversely affect the fair value of an investment. Generally, the longer the maturity of an investment, the greater the sensitivity of its fair value to changes in market interest rates. One of the ways that DART manages exposure to interest rate risk is by purchasing a combination of shorter term and longer term investments and by timing cash flows from maturities so that a portion of it matures evenly over time as necessary to provide the cash flow and liquidity needed for operations. Information about the sensitivity of the fair values of DART investments to market interest rate fluctuations as of September 30 is provided in the following tables, which show the distribution of DART investments by maturity. Investment Type Total Amount Remaining Maturity (in months) as of September 30, to 24 Months 12 months or Less 24 to 60 Months Federal Farm Credit Banks $ 227,150 $ 9,992 $ 140,678 $ 76,480 Federal Home Loan Bank 207,922 74,265 39,997 93,660 Federal Home Loan Mortgage Corporation 201,196 15,491 70, ,959 Federal National Mortgage Association 124,159 4,005 35,544 84,610 Commercial Paper 133, , Money Market Funds 46,506 46, US Treasury Note 3,999 3, Total $ 944,588 $ 287,914 $ 286,965 $ 369,709 22
41 NOTES TO FINANCIAL STATEMENTS FOR THE YEARS ENDED SEPTEMBER 30, 2014 and 2013 (Dollars in Thousands) Investment Type Total Amount Remaining Maturity (in months) as of September 30, months or Less 12 to 24 Months 24 to 60 Months Federal Farm Credit Banks $ 193,354 $ 15,004 $ 124,161 $ 54,189 Federal National Mortgage Association 190,344 12,139 16, ,209 Federal Home Loan Bank 113,237 50,468 19,995 42,774 Federal Home Loan Mortgage Corporation 74,715 14,615 28,574 31,526 Federal Agricultural Mortgage Corporation 19,997 10,003 9,994 - Commercial Paper 256, , Money Market Funds 78,095 78, US Treasury Note 35,809 35, Total $ 962,313 $ 472,895 $ 199,720 $ 289,698 Credit Risk - Credit risk is the risk that an issuer of an investment will not fulfill its obligation to the holder of the investment. This is measured by the assignment of a rating by a nationally recognized rating agency. The following tables show actual ratings as of September 30 for each investment type. Money market funds listed are SEC regulated 2a.7 funds. Rating as of September 30, 2014 Investment Type Total Amount AA+/ Aaa A1/P1 AAAm Federal Farm Credit Banks $ 227,150 $ 227,150 $ - $ - Federal Home Loan Bank 207, , Federal Home Loan Mortgage Corporation 201, , Federal National Mortgage Association 124, , Commercial Paper 133, ,656 - Money Market Funds 46,506 36,342-10,164 US Treasury Note 3,999 3, Total $ 944,588 $ 800,768 $133,656 $ 10,164 Rating as of September 30, 2013 Investment Type Total Amount AA+/ Aaa A1/P1 AAAm Federal Farm Credit Banks $ 193,354 $ 193,354 $ - $ - Federal National Mortgage Association 190, , Federal Home Loan Bank 113, , Federal Home Loan Mortgage Corporation 74,715 74, Federal Agricultural Mortgage Corporation 19,997 19, Commercial Paper 256, ,762 - Money Market Funds 78, ,095 US Treasury Note 35,809 35, Total $ 962,313 $ 627,456 $256,762 $ 78,095 On August 5, 2011, Standard and Poor s, one of three nationally recognized raters of US debt and securities, downgraded the rating of longterm United States sovereign debt from AAA to AA+ for the first time since 1941 with a negative outlook. The two other national raters, Moody s and Fitch, continue to have the highest ratings, but also have the debt on their watch lists. Included in DART s investment portfolio as of September 30, 2014 is $764,426 compared to $627,456 as of September 30, 2013 that was downgraded from AAA to AA+ by Standard and Poor s. 23
42 NOTES TO FINANCIAL STATEMENTS FOR THE YEARS ENDED SEPTEMBER 30, 2014 and 2013 (Dollars in Thousands) Concentration of Credit Risk - Concentration of credit risk is the risk of loss attributed to the magnitude of DART s investment in a single issuer. The Investment Policy of DART contains limitations on the amount that can be invested in any one issuer as shown in the table on page 22. Investments in any one issuer that represent 5% or more of total investment portfolio of DART as of September 30 are as shown below: September 30, 2014 Investment type/issuer Reported Amount Percentage of Total Portfolio Federal Farm Credit Banks $227,150 24% Federal Home Loan Bank 207,922 22% Federal Home Loan Mortgage Corporation 201,196 21% Federal National Mortgage Association 124,159 13% September 30, 2013 Investment type/issuer Reported Amount Percentage of Total Portfolio Federal Farm Credit Banks $193,354 20% Federal National Mortgage Association 190,344 20% Federal Home Loan Bank 113,237 12% Federal Home Loan Mortgage Corporation 74,715 8% Custodial Credit Risk - The custodial credit risk for investments is the risk that, in the event of the failure of the counterparty (e.g., brokerdealer) to a transaction, DART will not be able to recover the value of its investment or collateral securities that are in the possession of another party. All of DART s investments with the exception of money market mutual funds, which by design provide ownership of shares within the fund, are registered in DART s name as of September 30, 2014 and 2013 and are not exposed to custodial credit risk. Foreign Currency Risk - Foreign currency risk is the risk that changes in exchange rates will adversely affect the fair value of an investment or deposit. None of DART s Investment is in foreign currency-denominated investments. Restricted investments held to pay capital lease/leaseback liabilities As of September 30, 2014, DART had three outstanding lease/leaseback obligations. One of these three lease/leaseback obligations is anticipated to be closed out during the first quarter of fiscal year When DART entered into these transactions it received advance rental payments. A portion of the advance rental payment received by DART was used to purchase contractual undertakings from certain financial institutions. These institutions assumed and agreed to pay the sublease rental payments due through the purchase option date, together with the purchase option price owed if DART were to exercise the purchase option rights. For other leases, DART deposited a portion of the advance rental payment with a trustee, who was to purchase direct obligations of the US government and other securities that would mature on the dates and the amounts required to pay sublease rental payments and the respective purchase option price. These investments are held by the trustee in the name of DART and are invested in U.S. Treasury strips, U.S. government sponsored enterprise obligations, and guaranteed investment contracts. They include a combination of investments with short-term and long-term maturities which minimizes the exposure to interest rate risk. Because these investments are insured by a third party and are held in U.S. Treasuries and government investment contracts they are not recorded at fair value but are recorded at amortized cost in the Statements of Net Position. Assigned assets The DART Board has assigned certain cash and investment balances to be maintained for self-insurance and financial reserve. These amounts are shown as unrestricted investments in the accompanying financial statements. The assets for self-insurance include amounts assigned by the Board to fund future claims and workers' compensation liabilities. The Board established the financial reserve to accumulate sales and use taxes in years when sales and use tax revenues exceed the budgeted amount. Sales and use tax revenues, net of annual repayments to the State Comptroller, were $7,255 more than budget for fiscal year 2014 compared to $3,977 for fiscal year In addition, the Board of Directors authorized the establishment of a Capital Project Reserve Account. Should the Financial Reserve exceed $50 million, excess funds are placed in the Capital Project Reserve Account. An affirmative vote of two-thirds of the Board is required to draw upon the Financial and Capital Project Reserves, and the funds may be used for any purpose approved by the Board. During 2011, the DART Board approved a request to set aside a portion of the financial reserve investments for potential collateral as required by an amendment to one of the lease/leaseback agreements. The amount set aside for this purpose is $9,785 as of September 30, 2014 compared to $10,218 as of September 30, These amounts are shown as restricted investments held as security for capital lease/lease back liabilities in the Statements of Net Position and are excluded from the financial reserve amount of September 30, 2014 and 2013 shown on the next page: 24
43 NOTES TO FINANCIAL STATEMENTS FOR THE YEARS ENDED SEPTEMBER 30, 2014 and 2013 (Dollars in Thousands) As of September 30, assets assigned by the DART Board for specific purposes, including investments and accrued interest, consisted of the following: Assigned for Self-Insurance $ 12,576 $ 13,022 Financial Reserve 36,452 31,723 Total $ 49,028 $ 44, RESTRICTED ASSETS As security for the Senior Lien Obligations (Bonds) and Senior Subordinate Lien Obligations (Commercial Paper Notes), DART is required to maintain a certain amount of money in trust accounts created for this purpose. The money maintained in the trust accounts is reported as Investments held by trustee for debt service in the Statements of Net Position. The trustee uses all the monies and investments in the account for payment of principal, interest for bonds and commercial paper notes, and administrative expenses. The System Expansion and Acquisition Fund (SEA Fund) includes monies on deposit to be used solely for paying the costs of acquisition and construction of capital assets. The Board may, but is not required to, use money on deposit in the SEA Fund to pay for obligations in the event of a default. Restricted assets shown in the Statements of Net Position also include bond proceeds which will be used to fund capital expenditures. DART entered into three advance funding agreements with the Texas Department of Transportation and received money for construction of three parking lots. DART also entered into an inter-local agreement with the City of Dallas to plan and design a modern street car system for the City of Dallas and received money for this purpose. The remaining balances of these monies are shown as restricted investments held for advance funding agreements in the Statements of Net Position as of September 30, 2014 and DART also entered into an additional Equity Security Agreement that requires it to set aside certain investments as security for a certain lease/leaseback obligation. As of September 30, 2014, DART has set aside $9,785 compared to $10,218 as of September 30, 2013 for this purpose. These amounts are shown as investments restricted as security for lease/lease back liabilities in the Statements of Net Position. 5. INVESTMENT IN JOINT VENTURE DART and the Fort Worth Transportation Authority ( The T ) jointly provide commuter rail service between downtown Dallas and downtown Fort Worth. The authorities have adopted the name Trinity Railway Express ( TRE ) to provide this service. The operation and maintenance of commuter rail service is contracted to Herzog Transit Services, Inc. The cost of operating TRE, net of operating revenues, is shared between DART and the T based on revenue seat miles operated in Dallas County and Tarrant County, respectively. The transit authorities separately contributed the capital for the passenger stations and track storage areas in their respective counties, including fixtures and fare collection equipment at those stations. DART has separately contributed the capital for thirteen rail diesel cars (RDCs) purchased for the initial TRE commuter rail service. DART and the T have jointly contributed the capital for seven rehabilitated locomotives, two new locomotives, ten rehabilitated bi-level coaches, five new bi-level coaches, two rehabilitated bi-level cab cars, and five new bi-level cab cars. The book value of DART s share of these capital assets jointly owned with the T is recorded as Investment in Joint Venture in the Statements of Net Position in accordance with GASB Statement No. 61. There are no separate financial statements for the TRE. Each authority includes its share of revenues, operating costs and capital assets in its own financial statements. 6. INVESTMENT IN MANAGED HOV LANE AGREEMENTS In September 2008 and October 2010, DART entered into agreements with TXDOT to invest in managed HOV lane projects that fall under the Regional Transportation Council s (RTC) policy for Excess Toll Revenue Sharing. RTC s policy allows local governments and transportation authorities to invest in Comprehensive Development Agreement (CDA) projects. Any excess revenue will be returned to the funding partner in proportion to their shares and be used to fund future transportation projects. Since DART s investment and related CDA projects are on-going, information needed to estimate fair market value based on current revenue projections are not available. These investments are shown at cost at year end and will be reviewed annually for impairment or decline in value. As of September 30, 2014, the Statements of Net Position reflects these Investments in Managed HOV Lane Projects totaling $66,706 compared to $51,972 as of September 30,
44 NOTES TO FINANCIAL STATEMENTS FOR THE YEARS ENDED SEPTEMBER 30, 2014 and 2013 (Dollars in Thousands) 7. CAPITAL ASSETS Changes in capital assets for the years ended September 30, 2014 and 2013 are shown as follows: Beginning Oct. 1, 2013 Additions Disposals Net Transfers/ Adjustments Ending Sept. 30, 2014 Non-Depreciable Assets Land and right-of-way $ 578,169 $ - $ (951) $ 32,280 $ 609,498 Capital projects in progress 205, ,189 - (323,886) 70,845 Total non-depreciable assets 783, ,189 (951) (291,606) 680,343 Depreciable Assets Transitways 3,696,268 - (34,751) 184,319 3,845,836 Buildings and improvements 745,314 - (833) 2, ,585 Revenue and non-revenue vehicles and equipment 1,319,261 - (119,603) 103,827 1,303,485 Furniture, fixtures, and Leasehold improvements 61,184 - (2,668) 1,356 59,872 Total depreciable assets 5,822,027 - (157,855) 291,606 5,955,778 Less accumulated depreciation Transitways 820, ,719 (14,359) - 931,205 Buildings and improvements 292,055 25,565 (818) - 316,802 Revenue and non-revenue vehicles and equipment 568,776 77,597 (119,236) - 527,137 Furniture, fixtures, and Leasehold improvements 46,450 7,189 (2,666) - 50,973 Total accumulated depreciation 1,728, ,070 (137,079) - 1,826,117 Depreciable assets, net 4,093,901 (235,070) (20,776) 291,606 4,129,661 Total capital assets $ 4,877,612 $ (45,881) $ (21,727) $ - $ 4,810,004 Beginning Oct. 1, 2012 Additions Disposals Net Transfers/ Adjustments Ending Sept. 30, 2013 Non-Depreciable Assets Land and right-of-way $ 554,714 $ - $ (206) $ 23,661 $ 578,169 Capital projects in progress 662, ,870 - (694,895) 205,542 Total non-depreciable assets 1,217, ,870 (206) (671,234) 783,711 Depreciable Assets Transitways 3,188, ,963 3,696,268 Buildings and improvements 702, , ,314 Revenue and non-revenue vehicles and equipment 1,275,561 - (64,789) 108,489 1,319,261 Furniture, fixtures, and Leasehold improvements 49, ,647 61,184 Total depreciable assets 5,215,582 - (64,789) 671,234 5,822,027 Less accumulated depreciation Transitways 690, , ,845 Buildings and improvements 265,881 26, ,055 Revenue and non-revenue vehicles and equipment 559,630 73,582 (64,436) - 568,776 Furniture, fixtures, and leasehold improvements 38,929 7, ,450 Total accumulated depreciation 1,555, ,472 (64,436) - 1,728,126 Depreciable assets, net 3,660,492 (237,472) (353) 671,234 4,093,901 Total capital assets $ 4,877,773 $ 398 $ (559) $ - $ 4,877,612 26
45 NOTES TO FINANCIAL STATEMENTS FOR THE YEARS ENDED SEPTEMBER 30, 2014 and 2013 (Dollars in Thousands) Depreciation included $2,503 of impairment loss for two light rail vehicles and two buses damaged in accidents in In 2013 impairment losses included in depreciation consisted of $8,318 due to unexpected wear and obsolescence of the Dallas Central Business (CBD) light rail line segment rail and $834 for a light rail vehicle that derailed and was damaged during Capital assets are depreciated using the straight-line method over the following estimated useful lives: Description Buildings and improvements Buses and equipment Furniture, fixtures, and leasehold improvements Facilities and transitways (LRT System and HOV lanes) Light rail transit vehicles and remanufactured diesel cars Years ACCOUNTS PAYABLE AND ACCRUED LIABILITIES AND REPAYMENT DUE TO STATE COMPTROLLER Accounts payable and accrued liabilities at September 30 are as follows: Description Accounts payable and accrued liabilities Payroll $ 15,462 $ 13,327 Accrued paid time off, vacation and sick leave 23,211 22,495 Self insurance liabilities 16,864 15,024 Other operating liabilities 31,959 35,867 Total operating expense related 87,496 86,713 Non-operating expense and capital related 19,422 20,979 Total accounts payable and accrued liabilities 106, ,692 Non-current 34,573 31,129 Current $ 72,345 $ 76,563 The Texas State Comptroller collects the 1% sales and use tax from tax payers for DART. Sales and use tax revenues are subject to audits by the State Comptroller, which sometimes results in repayments to the State. Outstanding repayments and changes in the repayments due to the State Comptroller at September 30 are as follows: Description Beginning balance $ 11,047 $ 11,871 Payments (824) (824) Ending balance 10,223 11,047 Non-current 9,399 10,223 Current $ 824 $ ACCRUED PAID TIME OFF (PTO) VACATION AND SICK LEAVE Changes in accrued PTO, vacation, and sick leave for the years ended September 30 are shown in the following table. Description Beginning balance $ 22,495 $ 20,979 Additions 1,788 2,402 Payments (1,072) (886) Ending balance $ 23,211 $ 22,495 Amounts due in one year $ 993 $
46 NOTES TO FINANCIAL STATEMENTS FOR THE YEARS ENDED SEPTEMBER 30, 2014 and 2013 (Dollars in Thousands) 10. LOCAL ASSISTANCE PROGRAM In 1989, DART created a Local Assistance Program (LAP) to provide technical and financial assistance to cities for the implementation of projects to reduce traffic congestion and complement bus and public transit operations. Eligible member jurisdictions are responsible for developing and submitting projects to DART for approval in order to receive distribution of these funds. According to the terms of inter-local agreements, DART allocated a percentage of its annual sales and use tax collections for the LAP program. Eligible member jurisdictions received 15% of the estimated sales and use taxes collected within that jurisdiction, except Irving, which received 7.5%. Dallas, University Park, and Highland Park were not eligible. The LAP program ended in Accrued but unpaid funds were carried over to succeeding years and were recorded as a liability on the accompanying Statements of Net Position. Changes in Local Assistance Program Payable for the years ended September 30 are as follows: Description Beginning balance $ 1,997 $ 5,370 Payments (500) (3,373) Ending balance $ 1,497 $ 1, FINANCE OBLIGATIONS UNDER CAPITAL LEASE/LEASEBACK DART has entered into lease transactions in which certain capital assets are leased to investors (headlease) and simultaneously leased back (sublease). Under these transactions, DART maintains the right to continued use and control of the assets through the end of the lease term and is required to insure and maintain the assets. The headleases and subleases have been recorded as capital lease/leaseback for accounting purposes. The following table summarizes DART capital lease/leaseback transactions as of the respective transaction date. Lease Date Property Fair Market Value At Closing Date Prepayment Received On Head Lease Amount Invested to Satisfy Sublease Obligation Cash Benefit Repurchase Option Date Sublease Termination Date 9/28/00 28 Light rail cars $ 91,000 $ 91,000 $ 84,000 $ 7,000 01/02/23 12/15/23 10/26/00 25 Light rail cars 81,000 81,000 74,700 6,300 01/02/25 12/15/25 7/10/02 Buses Lot 3 15,367 15,367 14, /01/14 12/15/14 The subleases provide DART with an opportunity, at its sole discretion, to repurchase equipment on specified dates. As these dates approach, DART will complete a financial analysis on each specific lease to determine if it is financially beneficial to repurchase the equipment. At this point in time, DART anticipates that it will exercise the repurchase option on all of its remaining leases at the specified dates and has reflected this option in the amortization. The following table shows the book value of the light rail cars and buses under the lease/lease back agreements as of September 30, 2014 and Lease Date Property Book value as of 9/30/2014 Book value as of 9/30/2013 9/28/00 28 Light rail cars $31,168 $34,218 10/26/00 25 Light rail cars 31,620 34,502 7/10/02 Buses Lot The net present value of the future sublease payments has been recorded as both a short-term and long-term liability in the accompanying Statements of Net Position. Prepayments received from the head lease were invested to satisfy the sublease obligations. Since the investments have been structured to meet all future obligations under the subleases at all times when due, the investment balances have been recorded to equal the sublease liabilities on the accompanying Statements of Net Position. The benefits from these transactions, net of transaction costs, were recorded as non-operating revenues in the Statements of Revenues, Expenses, and Changes in Net Position in the fiscal year each transaction occurred. 28
47 NOTES TO FINANCIAL STATEMENTS FOR THE YEARS ENDED SEPTEMBER 30, 2014 and 2013 (Dollars in Thousands) The capital lease/leaseback liabilities are reported as follows on the Statements of Net Position: Amounts due within one year $ 14,096 $ 36,209 Amounts due in more than one year 185, ,495 Total $ 200,005 $ 220,704 Each of the lease/leaseback transactions has specific performance requirements for DART when the financial rating of the Payment Undertaker insurer falls below a specified level. During fiscal year 2010, credit ratings of two of three financial institutions insuring DART s lease/leaseback transactions were downgraded below certain levels specified in the lease/leaseback agreements. As a result, DART has entered into an amended agreement to reset the acceptable credit rating to be maintained at or above BBB for one of these two transactions. For the other lease/leaseback obligation, DART also entered into an additional Equity Security Agreement that requires it to set aside certain investments as security. As of September 30, 2014, DART has set aside $9,785 compared to $10,218 as of September 30, 2013 for this purpose. These amounts are shown as investments restricted as security for lease/lease back liabilities in the Statements of Net Position. Changes in the capital lease/lease back obligations for the years ended September 30 are shown below: Description Beginning balance $ 220,704 $ 289,559 Accrued interest 15,510 18,029 Retirements (36,209) (86,884) Ending Balance $ 200,005 $ 220,704 The following schedule shows future minimum sublease payments as of September 30, 2014 for the outstanding lease capital lease/leaseback transactions. Minimum Year Ending September 30 Sublease Payments 2015 $ 14, , , , , , ,206 Total minimum sublease payments due under capital lease/leaseback 354,559 Less: amount representing interest (154,554) Present value of minimum sublease payments $ 200, SENIOR SUBORDINATE LIEN SALES TAX REVENUE COMMERCIAL PAPER NOTES PAYABLE In January 2001, the DART Board approved the issuance of up to $650 million of Senior Subordinate Lien Sales Tax Revenue Commercial Paper Notes under the provisions of the Master Debt Resolution. Commercial Paper Self-liquidity Program- after the Revolving Credit Agreement was terminated, the DART Board approved a new Commercial Paper Self-liquidity Program that allows DART to issue up to $200 million in commercial paper notes backed by self-liquidity. Under this program, DART provides self-liquidity in an aggregate principal amount of $200 million and 90 days interest calculated at an interest rate 12% of the outstanding commercial paper debt. DART also maintains at least 2.0 times the debt service coverage amount for the self-liquidity commercial paper notes and ensures that no more than $35 million of the commercial paper notes mature within five days. During fiscal year 2014, DART has complied with these requirements of the self-liquidity program. As of September 30, 2014, DART has $180 million in outstanding commercial paper notes issued under the self-liquidity program. Commercial paper notes are issued in blocks for terms from 1 to 270 days and recorded as current liabilities on the Statements of Net Position. The average interest rate on outstanding commercial paper was 0.24% at September 30, 2014 and 0.13% at September 30,
48 NOTES TO FINANCIAL STATEMENTS FOR THE YEARS ENDED SEPTEMBER 30, 2014 and 2013 (Dollars in Thousands) Changes in the Commercial Paper Notes for the years ended September 30 are shown below: Description Beginning balance $ 100,000 $ 70,000 Additions 550, ,000 Retirement (470,000) (410,000) Ending Balance $ 180,000 $ 100,000 The maximum principal of outstanding Commercial Paper Notes did not exceed the $200 million limit during either year. 13. SENIOR LIEN REVENUE BONDS The DART Board has approved several issuances in accordance with the Master Debt Resolution. These bonds are Senior Lien Revenue Bonds that are secured by, and payable from pledged revenues. Pertinent information related to each bond outstanding is shown below: Bond Series Board Approval Date Original Issue Amount Date issued Interest rates (Yields) range Maturity date range From To From To Optional Redemption Bonds maturing after Earliest call date 2007* Jan ,270 3/08/07 4.0% 5.3% 12/1/07 12/1/36 12/1/17 12/1/ Apr ,415 6/23/08 4.5% 5.3% 12/1/09 12/1/48 12/1/18** 12/1/ A May ,385 6/25/09 2.8% 4.3% 12/1/14 12/1/22 12/1/19 6/1/ B May ,615 6/25/09 6.0% 6.3% 12/1/23 12/1/44 12/1/34 5/31/ A Sep ,235 10/7/10 2.0% 5.0% 12/1/13 12/1/23 12/1/21 12/1/ B Sep ,390 10/7/10 4.9% 5.0% 12/1/37 12/1/48 Not applicable 2012 April ,775 11/15/12 1.0% 5.0% 12/1/13 12/1/42 12/1/22 12/1/22 * The series 2007 bond issuance included $328,235 to partially refund Series 2001 and 2002 bonds. ** The Series 2008 bonds maturing after December 1, 2018 are subject to optional redemption with the exception of those maturing on December 1, 2029 and In June 2009, DART issued and sold $170,385 in tax exempt Senior Lien Sales Tax Revenue Bonds (Series 2009A Bonds), and $829,615 in taxable Senior Lien Sales Tax Revenue Bonds (Series 2009B Bonds) to finance capital expenditures for DART s system expansion and acquisition. The Series 2009B bonds are taxable bonds issued under the Build America Bond program of the American Recovery and Reinvestment Act of 2009 (ARRA). In accordance with ARRA, DART receives a tax credit from the United States Treasury in amounts equal to 35% of the interest payable amount on the Series 2009B Bonds. However, during fiscal years 2014 and 2013, this tax credit was reduced by 7.3% and 7.2% due to budget cuts or sequestration by the federal government. In October 2010, DART issued and sold $95,235 in tax exempt Senior Lien Sales Tax Revenue Bonds (Series 2010A Bonds), and $729,390 in taxable Senior Lien Sales Tax Revenue Bonds (Series 2010B Bonds) to finance capital expenditures for DART s system expansion and acquisition. The Series 2010B bonds are taxable bonds issued under the Build America Bond program of the American Recovery and Reinvestment Act of 2009 (ARRA). In accordance with ARRA, DART receives a tax credit from the United States Treasury in amounts equal to 35% of the interest payable amount on the Series 2010B Bonds. However, during fiscal years 2014 and 2013, this tax credit was reduced by 7.3% and 7.2% due to budget cuts or sequestration by the federal government. On November 15, 2012, DART issued and sold $127,775 in Senior Lien Sales Tax Revenue Bonds (Series 2012 Bonds). Series 2012 Bonds were issued to refund $150,000 Commercial Paper Notes. The Commercial Paper Notes were issued to finance capital expenditures for DART s system expansion and acquisition. During 2014, DART recorded tax credits of $28,259 compared to $28,406 for 2013 as Build America Bonds tax credit in the Statements of Revenues, Expenses and Changes in Net Position. 30
49 NOTES TO FINANCIAL STATEMENTS FOR THE YEARS ENDED SEPTEMBER 30, 2014 and 2013 (Dollars in Thousands) Additional bonds may not be issued unless gross sales and use tax revenues exceed maximum debt service by at least 200% for 12 of the last 18 months. Changes in revenue bonds (shown at par) for the years ended September 30, 2014 and 2013 are as shown below: Changes in revenue bonds (shown at par) for the years ended September 30, 2014 and 2013 are as follows: Bond Series Balance, 9/30/2012 Addition Retirement Balance, 9/30/2013 Retirement Balance, 9/30/2014 Amounts due in one year 2002 $ 1,000 $ - $ (1,000) $ - $ - $ - $ ,895 - (5,740) 740,155 (5,350) 734,805 5, , ,540 (11,335) 707, A 170, , ,385 15, B 829, , , A 95, ,235 (14,365) 80,870 14, B 729, , , , ,775 (2,125) 125,650 2,170 Total $3,290,060 $127,775 $(6,740) $3,411,095 $(33,175) $3,377,920 $38,215 The revenue bonds shown above are at face value. They are shown in the Statements of Net Position includes the original issuance premium of $86,579 and $94,155 as of September 30, 2014 and 2013, respectively. Below is a summary of debt service requirements of the Senior Lien Revenue Bonds outstanding as of September 30, 2014: Year Ended September 30 Principal Interest Total Debt Service Build America Bonds tax credit Net Debt Service 2015 $ 38,215 $ 176,933 $ 215,148 $ (28,239) $ 186, , , ,035 (28,239) 194, , , ,033 (28,239) 194, , , ,075 (28,239) 194, , , ,032 (28,239) 194, , ,603 1,114,913 (145,378) 969, , ,808 1,095,198 (142,531) 952, , ,255 1,078,775 (126,111) 952, , ,165 1,040,290 (104,532) 935, , , ,983 (61,784) 902, ,125 71, ,962 (15,844) 644,118 TOTAL $ 3,377,920 $ 3,682,524 $ 7,060,444 $ (737,375) $ 6,323, TRANSPORTATION INFRASTRUCTURE FINANCE AND INNOVATION ACT (TIFIA) BONDS On December 13, 2012 DART entered into a Transportation Infrastructure Finance and Innovation Act (TIFIA) financing agreement with the U.S Department of Transportation. Under this agreement, DART issued a Senior Lien Obligation bond to borrow up to $105,000 from the U.S Department of Transportation at an interest rate of 2.91%. The proceeds from the bond were used to pay for the cost of the third phase of DART s light rail Orange Line extension project, which extended DART s light rail service from Irving to the Dallas Fort Worth International Airport. According to the TIFIA financing agreement, the U.S. Department of Transportation (DOT) reimburses DART for eligible capital project costs. DART received $45,000 during fiscal year 2013 and $55,000 during fiscal year 2014 and plans to request a drawdown of an additional $5,000 during fiscal year Since the project cost is lower than budget, DART will borrow only $105,000 instead of the maximum amount of $119,972 allowed in the agreement. The TIFIA bond is a Senior Lien Obligation and is secured by and payable from Pledged Revenues on parity with other Senior Lien Obligations. The following table summarizes estimated debt service requirements of the TIFIA financing agreement executed on December 13, 2012 based on expected draw down of an additional $5,000 during fiscal year The amounts and timing of the debt service for the TIFIA bond are subject to change depending on the amount and timing of the draw down. A summary of estimated debt service requirements of TIFIA bonds as of September 30, 2014 is shown on the next page. 31
50 NOTES TO FINANCIAL STATEMENTS FOR THE YEARS ENDED SEPTEMBER 30, 2014 and 2013 (Dollars in Thousands) Summary of estimated debt service requirements of TIFIA bonds as of September 30, 2014 is as follows: Year Ended September 30 Principal Interest Total TIFIA Bond Debt Service 2015 $ - $ 2,953 $ 2, ,059 3, ,032 3,018 5, ,091 2,961 5, ,151 2,899 5, ,734 13,506 25, ,543 11,660 25, ,632 9,539 25, ,043 7,088 25, ,825 4,259 25, ,949 1,077 20,026 TOTAL $ 105,000 $ 62,019 $ 167,019 The annual debt service requirements for the TIFIA bond range from $2,953 in fiscal year 2015 to $5,053 in fiscal year PLEDGED REVENUES DART has pledged sales and use tax and farebox revenues as security for revenue bonds, TIFIA Bonds and commercial paper debts. The amount of the pledge is equal to the remaining debt service requirements for these obligations. These obligations were issued to pay for DART s system expansion and acquisition costs. The pledge continues for the remaining life of these obligations, which is currently through fiscal year Total principal and interest remaining on the revenue bonds as of September 30, 2014 is $7.1 billion before Build America Bonds tax credits of $737.4 million (see the second table on page 31). The annual debt service requirements for these bonds, before Build America Bonds tax credits, range from $223,075 in fiscal year 2018 to $118,162 in fiscal year For the current fiscal year, debt service on the bonds (including principal and interest) is $213,755. Bonds have a senior lien on pledged revenues. Total estimated principal and interest remaining on the revenue bonds as of September 30, 2014 is $167 million. The annual debt service requirements for the TIFIA bonds range from $2,953 in fiscal year 2015 to $5,053 in fiscal year For the current fiscal year, debt service on the TIFIA bonds is $1,709 for payments of interest. TIFIA bonds have a senior lien on pledged revenues. Total principal and interest remaining on commercial paper as of September 30, 2014 is $180,020 compared to $100,021 as of September 30, Interest payments on commercial paper notes during the current fiscal year totaled $131. Commercial Paper notes have a subordinate senior lien on pledged revenues. 16. DEBT REFUNDINGS In fiscal year 2007, DART issued $770,270 in Senior Lien Sales Tax Revenue Bonds (Series 2007 bonds) to refund the Series 2001 and 2002 Bonds and the Series 2001 Commercial Paper Notes. As a result, the Series 2001 Commercial Paper Notes, and a portion of the Series 2001 and 2002 bonds are considered defeased and the liability for those notes, bonds, and the corresponding assets in the trust account have been removed from DART s Statements of Net Position. As a result of the 2007 refunding, DART recognized a book loss (a difference between the reacquisition price and the carrying amount of the old debt) of $16,534, a reduction in debt service of $21,413 and an economic gain of $9,294. Also during 2011, DART issued the Series 2010A bonds to refund a portion of Series 2001, 2002 and 2008 bonds. As a result, the Series 2001, 2002 and 2008 bonds in the total amount of $102,775 are considered to be defeased and the liability for those bonds, and the corresponding assets in the trust account have been removed from DART s Statements of Net Position. As a result of the 2011 refunding, DART recognized a book loss of $7,883, a reduction in debt service of $3,945 and an economic gain of $8,786. As of September 30, 2014 and 2013, the unamortized portion of the book loss of $13,965 and $15,664 respectively have been shown in the Statements of Net Position as loss on debt refunding under the deferred outflows of resources section. As of September 30, 2014 and 2013, none of these refunded DART bonds remains outstanding. 32
51 NOTES TO FINANCIAL STATEMENTS FOR THE YEARS ENDED SEPTEMBER 30, 2014 and 2013 (Dollars in Thousands) 17. EARLY EXTINGUISHMENT OF DEBT In May 2014, DART used its own financial resources and paid $7,887 to defease a bond with a face value of $7,695 and an interest of $192. The maturity date for this bond is December 1, The difference between the reacquisition price and the carrying amount of this debt is not material. 18. PENSION, RETIREMENT, AND DEFERRED COMPENSATION PLANS DART operates several employee benefit plans. The plans include DART Employees Defined Benefit Plan (formerly the Dallas Transit System [DTS] pension plan), DART Retirement Plan, and DART Capital Accumulation Plan and Trust. DART is the administrator of these retirement plans and has the authority to establish and amend the plans. Defined Benefit Plan The DART Employees Defined Benefit Retirement Plan and Trust (the DB Plan) is a single-employer defined benefit pension plan that was designed to provide retirement, death, and disability benefits to certain employees of DART. On October 1, 1995, the DTS Employees Retirement Plan (Plan A) was amended to become the DB Plan. Participants of the DB Plan are those employees who were members of the former plan on September 30, Those employees who elected to be covered under Plan A have eligibility, vesting, and benefit provisions different from those who elected the DB Plan. DART s covered payroll for the DB Plan as of October 1, 2013 (actuarial valuation date), was approximately $19.4 million compared to $19.5 as of October 1, Contributions to the DB Plan, as stipulated by the "Sale, Purchase, and Transfer Contract Between the City of Dallas and Dallas Area Rapid Transit, are based upon Dallas Area Rapid Transit's agreement to contribute an amount at least equal to the minimum funding standard under Section 412 of the Internal Revenue Code of 1986, as if the Plan were subject to Section 412. Participants who were in the Plan on September 30, 1995 are required to contribute 3% of their base monthly salaries to the Plan. Other participants are not required to contribute to the DB Plan. DART s contribution amount is actuarially determined on an annual basis. Participants under the provisions of Original Plan A may elect normal retirement at age 60 or at the date at which the sum of their credited service and age equals 90. Participants who elected to remain under the provisions of the original plan receive monthly benefits equal to 2% times the years of credited service multiplied by the participant's final average monthly compensation. Participants in Amended Plan A are entitled to monthly benefits equal to: 2% times the number of years of credited service up to October 1, 1983; plus 1.5% times the number of years of credited service after October 1, 1983; times the participant's final average monthly compensation. A participant may elect early retirement at age 55 with 10 years of service (30 years of service for participants under the Original Plan A). Monthly income under this election will equal normal retirement benefits reduced by 5/12 of 1% for each full month by which the participant's early retirement date precedes the normal retirement date. A net pension asset of $11,346 and $9,457 is shown in the accompanying Statements of Net Position of DART at September 30, 2014 and 2013, respectively. In accordance with GASB Statement No. 27, Accounting for Pension by State and Local Government Employers, an actuary determines the contribution amount that DART pays to the plan each year. The amount determined is referred to as the "Annual Required Contribution" (ARC). All significant actuarial assumptions used to compute the ARC are the same as those used to compute the actuarial accrued liability. The net pension asset/obligation is the cumulative difference between annual pension cost (including any interest accumulated on the pension asset/obligation, the ARC, and any adjustments to the ARC), and the employer's actual contribution to the plan. Actuarial Assumptions - The net pension assets for fiscal years 2014 and 2013 were computed as part of an actuarial valuation performed and dated as of the first day of the fiscal periods, October 1, 2013 and Significant actuarial assumptions for the DB Plan are shown below: Valuation Date October 1, 2013 and 2012 Investment Return 7% compounded annually, net of expenses Salary Increases 3.25% per annum Mortality RP 2000 combined mortality tables for males and females with rates increased by 8.59% and with generational projection from 2000 by Scale AA Disability Mortality RP 2000 mortality tables for males and females Early Retirement Age 55 Normal Retirement Age 60 Cost-of-Living Adjustments 2.5% per annum Actuarial Cost Method Projected Unit Credit Cost Method 33
52 NOTES TO FINANCIAL STATEMENTS FOR THE YEARS ENDED SEPTEMBER 30, 2014 and 2013 (Dollars in Thousands) For plan years 2014, 2013, and 2012, the net pension asset was as follows: Annual required contribution $7,133 $7,310 $6,686 Interest on net pension asset (662) (544) (454) Adjustment to annual required contribution Annual pension cost 7,233 7,392 6,755 Employer contributions 9,122 9,074 8,045 Increase in net pension asset 1,889 1,682 1,290 Net pension asset, beginning of year 9,457 7,775 6,485 Net pension asset, end of year $11,346 $9,457 $7,775 Percentage of annual pension cost contributed 126% 123% 120% The actuarial value of plan net position is determined using a technique that smoothes the effects of short-term volatility in the market value of investments over a five-year period. The unfunded actuarial accrued liability is being amortized using a level dollar amount on a closed basis with no amortization period exceeding 30 years. Funding Progress - The schedule of funding progress for the DART Employees Defined Benefit Retirement Plan is included in the Required Supplementary Information. The data for the two most recent valuations are as follows: Actuarial Valuation Date 10/1/13 10/1/12 Actuarial value of assets $142,664 $137,946 Actuarial accrued liability (AAL) projected unit credit 201, ,447 Unfunded AAL (UAAL) 59,042 61,501 Funded ratio 70.7% 69.2% Covered payroll 19,438 19,467 UAAL as a % of covered payroll 303.7% 315.9% Additional trend information for the DB Plan can be obtained by writing to the DB Plan, Dallas Area Rapid Transit, P.O. Box , Dallas, Texas DART Retirement Plan DART has adopted a defined contribution retirement plan for all employees not covered by the pension plans described above. DART contributes an amount equal to 7.7% of each participant's annual compensation to the plan. Participants hired before January 1, 2006 are vested in 25% of DART's contributions after two years of service, graduating to 100% vesting after five years. Participants hired after December 31, 2005 become 100% vested in DART s contributions to the Plan only after completing five years of service. Total expense to DART to fully fund this plan was approximately $14,451 and $13,853 for the years ended September 30, 2014 and 2013, respectively. DART Capital Accumulation Plan 401(k) DART has adopted a deferred compensation plan created in accordance with Internal Revenue Code Section 401(k), which allows employees to contribute up to 50% of their annual compensation to the plan subject to the annual contribution limits of the Internal Revenue Service. DART matches 50% of the employee's contribution up to a maximum of 3% of the employee's annual compensation. Participants hired before January 1, 2006 are vested in 25% of DART's contributions after two years of service, graduating to 100% vesting after five years. Participants hired after December 31, 2005 become 100% vested in DART s contributions to the Plan only after completing five years of service. Total expense to DART to fully fund this plan was approximately $4,920 and $4,669 for the years ended September 30, 2014 and 2013, respectively. Annual financial statements for each of the three retirement plans discussed above may be obtained by contacting the Chief Financial Officer at Dallas Area Rapid Transit, 1401 Pacific Avenue, P.O. Box , Dallas, TX
53 NOTES TO FINANCIAL STATEMENTS FOR THE YEARS ENDED SEPTEMBER 30, 2014 and 2013 (Dollars in Thousands) 19. POSTEMPLOYEMENT BENEFITS OTHER THAN PENSIONS Plan Description - DART administers a single-employer defined benefit other post employment benefits (OPEB) Plan. The plan provides healthcare and life insurance for eligible retirees and their spouses through DART s group health plan and group life plan, which covers both active employees and retired members. Eligibility criteria for the post employment health care and life insurance benefits are as follows: Participants of the defined benefit pension plan will be eligible at age 55 with a minimum of ten years of service to DART. Participants of the defined contribution pension plan will be eligible at age 60 with a minimum of ten years of service to DART. The plan does not issue separate stand-alone financial reports. Funding Policy - DART s contribution to the retiree healthcare and life insurance is an annual required contribution (ARC) determined actuarially based on the parameters of GASB Statement 45. The ARC represents a level of funding that, if paid on an ongoing basis, is projected to cover normal cost each year and amortization of any unfunded actuarial liabilities (funding excess) over a period not to exceed thirty years. The ARC is 3.0% of annual covered payroll for both fiscal years 2014 and Retirees also make monthly contributions to the healthcare plan. Such contributions are determined annually by the plan administrator based on expected annual cost. For the years ended September 30, 2014 and 2013, DART s annual required contributions to other post employment benefits (OPEB) trust were $5,141 and $4,996. These contribution amounts are the same as annual OPEB costs for both years. The OPEB trust was set up during the fiscal year 2008 for the first time and is not included in those financial statements. DART has 269 retirees and surviving spouses that participate in the medical plan and 287 that participate in the life insurance plan as of September 30, 2014 compared to 252 participants in the medical plan and 320 in the life insurance plan as of September 30, Actuarial Assumptions Projections of benefits for financial reporting purposes are based on the substantive plan (the plan as understood by the employer and the plan members) and include the type of benefits provided at the time of each valuation and the historical pattern of sharing benefit costs between the employer and plan members to that point. The actuarial methods and assumptions used include techniques that are designed to reduce the effects of short-term volatility in actuarial accrued liabilities and the actuarial value of assets, consistent with the longterm perspective of the calculations. Actuarial evaluations were performed for the OPEB Plan as of September 30. The following two tables show the summaries of significant actuarial assumptions: Valuation Date September 30, 2014 Investment Return 7.00% Future Participation For future eligible retirees, 56% are assumed to elect medical coverage, while 100% are assumed to elect life coverage Health Care Trend rate Year 2014 trend is 8% for Aetna dropping to 5% in Year 2014 (Health care inflation rate) trend is 10.5% for Secure Horizons Medicare Advantage Plan, trending down to 8.5% in 1% increments where they stay level for five years before dropping to 5% in Mortality RP 2000 combined mortality tables for males and females with rates increased by 8.59% and with generational projection from 2000 by Scale AA. Aging Factor Eligibility for Coverage Dependent coverage Actuarial Cost Method Salary Increases Amortization 3% per annum for Pre-65 and 2% for Post-65 For Defined Benefit Pension Plan participants: age 55 and 10 years of service and for Defined Contribution Pension Plan participants: age 60 and 10 years of service For active employees, 40% are assumed to be married at retirement with the spouse electing coverage. Female spouses are assumed to be four (4) years younger than their husbands. Any potential costs for children have not been considered for valuation purposes. Projected Unit Credit 3.25% per annum 30 Years Level Dollar Amortization Method, Open period 35
54 NOTES TO FINANCIAL STATEMENTS FOR THE YEARS ENDED SEPTEMBER 30, 2014 and 2013 (Dollars in Thousands) Valuation Date September 30, 2013 Investment Return 7.00% Future Participation For future eligible retirees, 56% are assumed to elect medical coverage, while 100% are assumed to elect life coverage Health Care Trend rate Year 2013 trend is 8% for Aetna dropping to 5% in Year 2013 (Health care inflation rate trend is 10.5% for Secure Horizons Medicare Advantage Plan, trending down to 8.5% in 1% increments where they stay level for five years before dropping to 5% in Mortality RP 2000 combined mortality tables for males and females with rates increased by 8.59% and with generational projection from 2000 by Scale AA. Aging Factor Eligibility for Coverage Spouse coverage Age of Dependent Spouse Actuarial Cost Method Salary Increases Amortization 3% per annum for Pre-65 and 2% for Post-65 For Defined Benefit Pension Plan participants: age 55 and 10 years of service and for Defined Contribution Pension Plan participants: age 60 and 10 years of service For active employees, 40% are assumed to be married at retirement with the spouse electing coverage Females are assumed to be 4 years younger than males Projected Unit Credit 3.25% per annum 30 Years Level Dollar Amortization Method, Open period Annual OPEB Cost and Net OPEB Asset - For plan years 2014 and 2013, annual OPEB cost and the net OPEB asset were as follows: 2014, Annual required contribution $ 5,141 $4,996 $5,024 Annual OPEB cost 5,141 4,996 5,024 Total employer contributions 5,141 4,996 9,975 Increase in net OPEB obligation (decrease in net OPEB asset) - - 4,951 Net OPEB asset (obligation), beginning of year - - (4,951) Net OPEB asset (obligation), end of year $ - $ - $ - Percentage of annual OPEB cost contributed 100% 100% 199% Funding Progress - The schedule of funding progress for the DART Other Postemployment Benefits (OPEB) is included in the Required Supplementary Information. The data for the two most recent valuations is based on payroll information as of September 30, The data for the two most recent valuations are as follows: Fiscal Year Ended 9/30/14 9/30/13 Actuarial value of assets $ 30,529 $ 24,162 Actuarial accrued liability (AAL) $ 58,315 $ 52,676 Unfunded AAL (UAAL) $ 27,786 $ 28,514 Funded ratio 52.4% 45.9% Covered payroll $ 174,557 $ 174,557 UAAL as a % of covered payroll 15.9% 16.3% Actuarial valuations for OPEB plans involve estimates of the value of reported amounts and assumptions about the probability of events far into the future. These actuarially determined amounts are subject to continual revisions as actual results are compared to past expectations and new estimates are made about the future. The schedule of funding progress presented immediately following the financial statements as required supplementary information, presents multi-year trend information about whether the actuarial value of plan assets is increasing or decreasing over time relative to the actuarial accrued liability for benefits. 36
55 NOTES TO FINANCIAL STATEMENTS FOR THE YEARS ENDED SEPTEMBER 30, 2014 and 2013 (Dollars in Thousands) 20. CLAIMS AND LITIGATION In the ordinary course of business, a number of claims and lawsuits arise from individuals seeking compensation for personal injury, death, and/or property damage resulting from accidents occurring in the operation of the system. In addition, DART has been named as a defendant in a number of lawsuits relating to personnel and contractual matters. Management does not believe that the outcome of these claims will have a material adverse effect on DART's financial statements. 21. COMMITMENTS AND CONTINGENCIES The Board has approved a Transit System Plan, which includes the design and construction of a 46-mile light rail transit (LRT) extension from Downtown Dallas to Buckner Blvd. (the Southeast Corridor) and from Downtown Dallas to Farmers Branch, Carrollton, and Irving (the Northwest Corridor) and from downtown Garland to Rowlett (Rowlett extension) and the three miles extension of the Blue Line from Ledbetter Station toward the University of North Texas (UNT) Dallas Campus located at the southeast corner of Camp Wisdom Road and University Hills Blvd. The timing and completion of the Transit System Plan is based on economic assumptions made in DART s 20-year financial plan and is subject to change based on changing economic conditions. The Transit System Plan is forecasted at $4.1 billion as of September 30, The first section of the southeast extension, Bryan Street to Fair Park, opened for service on September 14, Other northwest and southeast extensions opened for service during 2011 and the first section of Irving line segment opened for service in July The second section of the Irving line segment and the northeast (Rowlett) extension opened for revenue service in December The third section of the Irving line (Irving-3) opened for service in August DART has entered into contract commitments for the LRT build out and other capital developments in the amount of $3.4 billion and has spent approximately $3.3 billion of the committed amount as of September 30, DART participates in several federal and state grant programs that are governed by various rules and regulations of the grantor agencies. Costs charged to the respective grant programs are subject to audit and adjustment by the grantor agencies. In the opinion of management, no significant contingent liabilities exist relating to compliance with the rules and regulations governing the respective grants; therefore, no provision has been recorded in the accompanying financial statements for such contingencies. DART has entered into certain operating lease agreements. Operating lease expenses are approximately $817 and $782 in 2014 and 2013, respectively. Future minimum lease payments for all non-cancelable operating leases are as follows: Fiscal Year Minimum Lease Payments $439 $439 $439 $439 $439 DART owns and operates a number of facilities. It also acquires new properties for light rail expansion projects. In some of these properties DART has discovered contamination that may require pollution remediation activity. DART is working with relevant state and federal agencies on pollution remediation plans. Management does not believe that the outcome of these remediation activities will have a material adverse effect on DART s financial position. Management has accrued an estimate which is included in the accounts payable and accrued liabilities line item in the accompanying Statements of Net Position. 22. DERIVATIVE INSTRUMENTS Diesel Fuel Hedge As part of its normal business of providing public transportation services, DART operates a large fleet of buses, commuter rail cars, and paratransit and innovative service vans, that are currently operated with diesel fuel. DART has diesel fuel delivery contracts with suppliers; however, the price DART pays for the fuel fluctuates depending on market prices. This exposes DART to significant risk related to fluctuations in the amounts it pays for fuel. It also creates uncertainty in budgeting for fuel costs. In order to minimize the impact of fluctuating fuel market prices on its cash flow, DART has entered into diesel fuel hedge contracts. The diesel fuel hedge contract expired on September 30, 2013 and no fuel hedge contract is in place after this date. The fair values of the derivative instrument associated with this hedge contract were $0 as of 9/30/2014 and 9/30/
56 NOTES TO FINANCIAL STATEMENTS FOR THE YEARS ENDED SEPTEMBER 30, 2014 and 2013 (Dollars in Thousands) Objective and terms of the fuel hedge contracts The objective of each of the derivative instruments (diesel fuel hedge contracts) is to hedge changes in cash flows due to market price fluctuations related to expected purchases of diesel fuel for DART buses, commuter rail cars, and paratransit vans. The terms of the agreement include DART paying monthly fixed prices and receiving floating prices based on an average of daily mean of Platts US Gulf Coast ultra low sulfur diesel (ULSD) for each month. Risks Credit risk The derivative instrument for fiscal year 2013 was held by the same counterparty. During fiscal year 2013, DART s position in the derivative instrument was a potential inflow of resources. DART could have been exposed to credit risk if the counterparty to the transaction becomes insolvent but that did happen. The credit rating for the counterparty was A+/Aa3 during Termination risk DART or its counterparties may terminate a derivative instrument if the other party fails to perform under the terms of the contract. The effect of termination risk on DART is that it will pay market prices for diesel fuel purchased for its operations. No termination event has occurred during fiscal year 2013 and the contract expired on 9/30/2013. Contingencies The diesel fuel hedge contracts include provisions that require DART to post collateral in the event its credit rating falls below A- or A3 as issued by Standard & Poors or Moody s and if the exposure exceeds threshold amounts specified in the derivative instruments (contracts). DART s credit rating as of September 30, 2013 is AA+ as issued by Standards & Poor s or Aa2 as issued by Moody s. Compressed Natural Gas (CNG) Delivery Contract Starting from October 1, 2012, DART is replacing its existing diesel and liquefied natural gas operated fleet of buses with new buses that are operated with compressed natural gas (CNG). DART also buys CNG for contractor-owned and operated paratransit vehicles. During fiscal year 2010, DART entered into a fixed price and indexed price CNG delivery contract for the CNG needed to operate these vehicles. The contract specifies monthly volumes of CNG to be used by DART from October 1, 2012 to September 30, 2020 with 85% of the monthly volumes at a fixed price and 15% at an indexed price. When DART uses lower than the volumes specified in the contract, the excess CNG has to be sold back to market at market price. The market price could be lower or higher than the fixed price and indexed price specified in the contract. The difference between the contract and market price can result in an exposure for DART. The amount of this exposure for DART is not expected to be material and no liability is included in the Statements of Net Position as of September 30, 2014 and Objective and terms of the CNG delivery contract - The objectives of the CNG delivery contract are: to ensure that DART has delivery of natural gas for its transit buses and contractor owned and operated paratransit vehicles during the contract period; to fix the price for 85% of monthly volumes; and to minimize the fluctuations in cash flows caused by changes in market prices of CNG. Risks Early Termination subject to payment of early termination damages, either party to the delivery contract may terminate the CNG delivery contract by giving at least thirty (30) days written notice to the other party. The effect of termination risk on DART is that it will pay market prices for CNG purchased for its operations. No termination event occurred during fiscal years 2014 and NEW ACCOUNTING PRONOUNCEMENTS In June 2012, the GASB issued Statement No. 67, Financial Reporting for Pension Plans an amendment of GASB Statement No. 25. This Statement replaces the requirements of Statements No. 25, Financial Reporting for Defined Benefit Pension Plans and Note Disclosures for Defined Contribution Plans, and No. 50, Pension Disclosures, related to pensions that are administered as trusts or equivalent arrangements. The requirements of this Statement are effective for financial statements for periods beginning after June 15, 2013 which is fiscal year 2014 for the DART Employees Defined Benefit Retirement Plan and Trust (the DB Plan). 38
57 NOTES TO FINANCIAL STATEMENTS FOR THE YEARS ENDED SEPTEMBER 30, 2014 and 2013 (Dollars in Thousands) In June 2012, the GASB issued Statement No. 68, Accounting and Financial Reporting for Pension Plans an amendment of GASB Statement No. 27. This Statement replaces the requirements of Statement No. 27, Accounting for Pensions by State and Local Governmental Employers, as well as the requirements of Statement No. 50, Pension Disclosures, related to pensions that are administered as trusts or equivalent arrangements. The requirements of this Statement are effective for financial statements for periods beginning after June 15, 2014 which is fiscal year 2015 for DART. In November 2013, GASB issued Statement No. 71, Pension Transition for Contributions Made Subsequent to the Measurement Date. The objective of this Statement is to address an issue regarding application of the transition provisions of Statement No. 68, Accounting and Financial Reporting for Pensions. The requirements of this statement should be applied simultaneously with the provisions of Statement 68. Management has not yet determined the impact of these statements on the basic financial statements. 24. SPECIAL ITEM Loss on transfer of HOV Lane operations DART has been responsible for the operations, enforcement, and maintenance of the HOV lanes within the DART service area. During fiscal year 2014, DART and TXDOT entered into an agreement to transfer responsibilities for the operation and maintenance of HOV Lanes effective July 9, HOV related operating expenses during fiscal year 2014 were $3,386 compared to $13,099 during In anticipation of the upcoming transfer, a number of HOV employees were terminated in fiscal years 2013 and Termination benefit payments made to employees affected by the transfer have been accrued and included in the Statements of Net Position and Statements of Revenues, Expenses and Changes in Net Position as of September 30, 2014 and 2013 in accordance with GASB Statement No. 47, Accounting for Termination Benefits. There were no direct operating revenues generated by the HOV operations except for reimbursements of costs from NCTCOG for any HOV related service provided by DART outside the DART service area. As of the effective date of the agreement, DART HOV related capital assets had a carrying value of $20,392. This amount has been recorded as a loss on transfer of HOV operations in the Statements of Revenues, Expenses and Changes in Net Position in accordance with GASB Statement No. 69, Government Combinations and Disposals of Government. No financial consideration has been received by DART from TXDOT for these assets. However, DART will save future operating costs that it would have spent to provide HOV lane services. 25. SUBSEQUENT EVENT In December 2014, DART issued and sold $426,035 in Senior Lien Sales Tax Revenue Refunding Bonds ($379,480 as Series 2014A Bonds and $46,555 as Series 2014B Bonds). These refunding bonds are issued to partially refund existing Series 2007 and Series 2008 bonds and are secured by and payable from pledged revenues. Pledged revenues include sales and use tax and farebox revenues. The following table summarizes debt service requirements of the Senior Lien Sales Tax Revenue Bonds and TIFIA Loan including the bonds issued on December 11, 2014 Year Ended September 30 Total Bond Debt Service 2015 $189, , , , , , , , , , ,190 TOTAL $6,443,388 The debt service amounts shown above are net of expected federal subsidies payments on the Series 2009B and 2010B Bonds, with a 7.3% sequestration reduction projected until fiscal year It also includes debt service associated with full drawdown of $105 million TIFIA loan but does not include debt service for outstanding senior subordinate lien commercial paper notes. 39
58 REQUIRED SUPPLEMENTARY INFORMATION (UNAUDITED) DEFINED BENEFIT PENSION PLAN AND OTHER POST EMPLOYMENT BENEFITS SCHEDULE OF FUNDING PROGRESS September 30, 2014 (Dollars in Thousands) The schedule of funding progress for the DART Defined Benefit Pension Plan calculated by the actuaries is as follows: Actuarial Valuation Date 10/1/13 10/1/12 10/1/11 Actuarial Value of Assets $142,664 $137,946 $141,480 Actuarial Accrued Liability (AAL) 201, , ,504 Projected Unit Credit Unfunded AAL (UAAL) 59,042 61,501 54,024 Funded Ratio 70.7% 69.2% 72.4% Covered Payroll 19,438 19,467 19,306 UAAL as a % of Covered Payroll 303.7% 315.9% 279.8% Annual financial statements for the DART Defined Benefit Pension Plan may be obtained by contacting the Chief Financial Officer at Dallas Area Rapid Transit, 1401 Pacific Avenue, P.O. Box , Dallas, TX The schedule of funding progress for the DART Other Postemployment Benefits (OPEB) calculated by the actuaries is as follows: The data for the two most recent valuations is based on payroll information as of September 30, 2013 Actuarial Valuation Date 10/1/14 10/1/13 10/1/12 Actuarial Value of Assets $30,529 $24,162 $17,892 Actuarial Accrued Liability (AAL) $58,315 $52,676 $49,384 Unfunded AAL (UAAL) $27,786 $28,514 $31,493 Funded Ratio 52.4% 45.9% 36.2% Covered Payroll $174,557 $174,557 $169,196 UAAL as a % of Covered Payroll 15.9% 16.3% 18.6% * * * * * * * * 40

59 STATISTICAL SECTION
60 COMPREHENSIVE ANNUAL FINANCIAL REPORT STATISTICAL SECTION (Unaudited) The statistical section provides financial statement users with historical perspective and context for understanding the information presented in the financial statements, notes to financial statements, and required supplementary information. It includes five categories of trend information. Contents Pages Financial Trends - The schedules in this section assist users in understanding and assessing how DART s financial performance and position have changed over the last ten fiscal years. Net Position by Component 42 Changes in Net Position 43 Expenses by Function 44 Operating Expenses - Comparison to Industry Trend Data 45 Revenues by Source 46 Revenues by Source - Comparison to Industry Trend Data 47 Revenue Capacity The schedules in this section assist users in understanding and assessing DART s ability to generate revenues. It focuses on its two major sources of revenues: sales and use tax and passenger fare revenues. Sales and Use Tax Revenue and Service Area Population 48 Sales and Use Tax Revenue by Industry 50 Passenger Fare Revenue and Ridership 51 Fare Structure 53 Debt Capacity - These schedules present information to help the reader assess DART's current levels of outstanding debt and ability to issue additional debt in the future. Outstanding Debt Ratio 54 Debt Limit 55 Debt Coverage Ratio 56 Demographic and Economic Information - The schedules in this section assist users in understanding the socioeconomic environment in which DART operates. Economic and Demographic Information 57 Principal Employers 58 Operating Information - The schedules in this section provide information on the level of services provided by DART and resources used in providing the services. This section helps users understand how the information in the financial statements relates to the level of services provided and resources used in providing the services. Number of Employees by Function 59 Level of Service, Annual and Related Charts 60 Level of Service, Average Weekday 65 Capital Asset Information - Number of Vehicles and Operating Facilities 66 Capital Asset Information - Cost of Capital Assets 67 41
61 Financial Trends


62 NET POSITION BY COMPONENT LAST TEN FISCAL YEARS (Amounts In Thousands) Fiscal Year Components of Net Position Net investment in capital assets $1,615,195 $1,582,230 $1,627,343 $1,779,450 $2,030,937 $1,741,742 $1,515,210 $1,512,832 $1,320,349 $1,071,576 Restricted 9,621 9,666 11,827 12,612 15,065 15,765 18,104 21,303 37,633 47,345 Unrestricted 333, , , , , , , , , ,666 Total Net Position $1,958,508 $1,976,722 $2,093,675 $2,225,832 $2,418,464 $2,445,494 $2,373,611 $2,323,132 $2,185,147 $2,039, % 90.0% 80.0% 70.0% 60.0% 50.0% 17.0% 19.5% 21.7% 19.5% 15.4% 0.5% 0.6% 0.5% 0.6% 0.6% 28.1% 0.7% 35.4% 34.0% 37.9% 0.8% 0.9% 1.7% 45.2% 2.3% 40.0% 30.0% 20.0% 82.5% 80.0% 77.7% 79.9% 84.0% 71.2% 63.8% 65.1% 60.4% 52.5% 10.0% 0.0% Net investment in capital assets Restricted Unrestricted Source: Annual Financial Reports 42
63 CHANGES IN NET POSITION LAST TEN FISCAL YEARS (Amounts In Thousands) Fiscal Year OPERATING REVENUES Passenger (fare) revenues $37,131 $40,799 $41,114 $48,957 $46,712 $52,081 $57,329 $59,809 $67,569 $70,902 Advertising, rent and other 9,096 9,196 9,430 10,846 10,640 11,149 12,049 20,306 16,146 13,573 TOTAL OPERATING REVENUES 46,227 49,995 50,544 59,803 57,352 63,230 69,378 80,115 83,715 84,475 OPERATING EXPENSES Labor 151, , , , , , , , , ,188 Benefits 62,325 59,659 54,512 66,422 69,157 80,714 86,548 86,734 87,302 99,851 Services 24,291 27,511 27,919 32,156 31,894 32,323 33,832 30,153 34,775 33,869 Materials and Supplies 41,451 47,140 45,996 57,040 51,279 57,585 51,096 49,120 53,224 44,327 Purchased Transportation 38,071 41,172 42,411 46,749 47,291 50,452 53,466 55,640 43,716 46,900 Utilities 9,799 10,623 10,371 10,765 12,362 13,805 17,047 18,499 20,946 17,151 Taxes, Leases, and Other 5,478 4,806 4,773 5,305 5,685 5,288 5,737 5,732 5,604 5,245 Casualty and Liability 9,554 (1,183) 1,778 3,020 3,320 3,841 3,878 5,048 5,329 4,582 Operating Expenses (excluding depreciation and amortization) 342, , , , , , , , , ,113 Depreciation and amortization expense 106, , , , , , , , , ,406 TOTAL OPERATING EXPENSES* 448, , , , , , , , , ,519 NET OPERATING LOSS* (402,539) (397,130) (410,390) (452,363) (466,235) (509,315) (559,635) (565,695) (617,692) (620,044) NON-OPERATING REVENUES (EXPENSES) Sales and use tax 342, , , , , , , , , ,564 Investment income 32,855 42,463 47,506 44,947 48,985 29,539 28,434 27,315 2,272 4,037 Interest income from investments held to pay capital lease/leaseback 18,029 15,510 Interest expense on capital lease/leaseback (18,029) (15,510) Street improvement for member cities* (630) (2,242) (684) (683) (645) (1,010) (1,244) (5,615) (6,615) (2,127) Interest and financing expenses (52,053) (52,437) (52,688) (58,273) (78,873) (93,752) (145,514) (154,258) (160,824) (167,071) Build America Bonds tax credit 4,730 17,736 30,250 30,462 28,406 28,259 Other non-operating revenues* 10,822 8,960 9,784 17,446 11,997 12,039 13,562 11,392 12,226 15,760 Other non-operating expenses* (3,958) (11,143) (4,439) (7,636) (8,431) (7,251) (10,844) (3,445) (3,848) (1,621) NET OPERATING REVENUES, NET 329, , , , , , , , , ,801 LOSS BEFORE CAPITAL CONTRIBUTIONS AND GRANTS (72,833) (53,281) (20,958) (43,221) (110,051) (175,719) (241,763) (226,542) (289,551) (256,243) Capital Contributions 39,442 32,405 96, , , , , , ,148 38,864 Other federal and state grants 42,104 39,090 40,931 42,490 57,759 50,913 47,566 56,161 17,418 92,211 Total capital contribution and grants 81,546 71, , , , , , , , ,075 GAIN (LOSS) BEFORE SPECIAL ITEM 8,713 18, , , ,632 27,030 (71,883) (28,712) (137,985) (125,168) SPECIAL ITEM Loss on transfer of HOV operations (20,392) CHANGE IN NET POSITION 8,713 18, , , ,632 27,030 (71,883) (28,712) (137,985) (145,560) NET POSITION, BEGINNING OF YEAR 1,949,795 1,958,508 1,976,722 2,093,675 2,225,832 2,418,464 2,445,494 2,373,611 2,323,132 2,185,147 Adjustment Due to Change in Accounting Principles (GASB 65) (21,767) NET POSITION, END OF YEAR $1,958,508 $1,976,722 $2,093,675 $2,225,832 $2,418,464 $2,445,494 $2,373,611 2,323,132 2,185,147 $2,039,587 * Presentation of some line items for fiscal year 2005 are modified for consistency with the recent presentation format. 43
64 EXPENSES BY FUNCTION LAST TEN FISCAL YEARS (Amounts In Thousands) Fiscal Year FUNCTION Transportation $190,856 $201,239 $199,858 $228,431 $230,331 $246,631 $257,546 $267,001 $265,378 $271,425 Maintenance 89,627 92,478 94, , , , , , , ,154 Administration 66,646 62,200 59,194 66,005 69,876 75,255 78,658 70,286 68,636 82,674 Depreciation and Amortization 106, , , , , , , , , ,406 Interest and Financing Expenses 52,053 52,437 52,688 58,273 78,873 93, , , , ,581 TOTAL $505,407 $512,947 $518,745 $578,758 $611,536 $674,558 $786,615 $809,128 $890,723 $911, % 90.0% 80.0% 70.0% 60.0% 50.0% 40.0% 30.0% 20.0% 10.0% 0.0% 10.3% 10.2% 10.2% 10.1% 12.9% 13.9% 18.5% 19.1% 20.1% 20.0% 21.0% 20.4% 21.8% 20.5% 19.9% 20.1% 22.8% 23.8% 13.2% 12.2% 11.4% 11.4% 26.8% 25.9% 11.4% 11.2% 17.7% 18.0% 18.1% 10.0% 8.7% 18.5% 18.1% 7.7% 9.1% 18.2% 16.0% 15.5% 15.6% 15.2% 37.8% 39.2% 38.5% 39.5% 37.7% 36.6% 32.7% 32.9% 29.8% 29.8% Transportation Maintenance Administration Depreciation and amortization Interest and financing expenses Source: Annual Financial Reports 44
65 OPERATING EXPENSES COMPARISON TO INDUSTRY TREND DATA LAST TEN FISCAL YEARS Fiscal Year Dallas Area Rapid Transit 1 Labor and Benefits 62.4% 62.0% 61.7% 60.6% 62.2% 62.6% 63.3% 63.8% 64.6% 67.5% Materials and Supplies 12.1% 13.8% 13.2% 14.5% 12.8% 13.2% 11.3% 10.8% 11.5% 9.5% Services 7.1% 8.0% 8.0% 8.2% 7.9% 7.4% 7.5% 6.7% 7.5% 7.2% Utilities 2.9% 3.1% 3.0% 2.7% 3.1% 3.2% 3.8% 4.1% 4.5% 3.7% Casualty and Liability 2.8% -0.3% 0.5% 0.8% 0.8% 0.9% 0.9% 1.1% 1.2% 1.0% Purchased Transportation 11.1% 12.0% 12.2% 11.9% 11.8% 11.5% 11.9% 12.2% 9.5% 10.0% Others 1.6% 1.4% 1.4% 1.3% 1.4% 1.2% 1.3% 1.3% 1.2% 1.1% Total 100.0% 100.0% 100.0% 100.0% 100.0% 100.0% 100.0% 100.0% 100.0% 100.0% Transit Industry 2 Labor and Benefits 66.9% 66.0% 65.8% 63.9% 64.9% 65.2% 65.0% 64.1% N/A N/A Materials and Supplies 10.1% 11.2% 11.6% 12.8% 11.2% 10.7% 11.4% 11.7% N/A N/A Services 5.8% 5.9% 6.1% 6.3% 6.6% 6.6% 6.6% 6.9% N/A N/A Utilities 3.2% 3.2% 3.4% 3.4% 3.5% 3.4% 3.3% 3.2% N/A N/A Casualty and Liability 2.5% 2.5% 2.4% 2.2% 2.3% 2.6% 2.6% 2.2% N/A N/A Purchased Transportation 13.8% 13.4% 13.0% 13.7% 14.0% 13.8% 13.3% 13.8% N/A N/A Others -2.3% -2.2% -2.3% -2.3% -2.5% -2.3% -2.2% -1.9% N/A N/A Total 100.0% 100.0% 100.0% 100.0% 100.0% 100.0% 100.0% 100.0% N/A N/A Note - Operating expenses for which ratios are shown here do not include depreciation and amortization expenses. N/A= Industry information is not available for fiscal years 2013 and Source: (1) Ratios are calculated from amounts shown on page 43. (2) The American Public Transit Association, APTA 2014 Public Transportation Fact Book, Appendix A, Table
66 REVENUES BY SOURCE LAST TEN FISCAL YEARS (Amounts In Thousands) Revenue source Passenger (fare) revenues $37,131 $40,799 $41,114 $48,957 $46,712 $52,081 $57,329 $59,809 $67,569 $70,902 Advertising, rent and other 9,096 9,196 9,430 10,846 10,640 11,149 12,049 20,306 16,146 13,573 Sales and use tax 342, , , , , , , , , ,564 Federal operating grants 41,925 39,090 40,931 42,490 57,759 50,913 47,566 56,161 17,418 92,211 State operating grants Investment income 7,274 18,314 24,368 21,809 27,267 6,842 5,966 5,896 2,272 4,037 Interest income from investments held to pay capital lease/leaseback 25,581 24,149 23,138 23,138 21,718 22,697 22,468 21,419 18,029 15,510 Build America Bonds tax credit ,730 17,736 30,250 30,462 28,406 28,259 Other non-operating revenues 10,822 8,960 9,784 17,446 11,997 12,039 13,562 11,392 12,226 15,760 Capital contributions: Fiscal Year 474, , , , , , , , , ,816 Federal capital contributions 39,442 30,405 96, , , , , , ,877 36,023 State capital contributions , , ,865 2,676 1,596 Local capital contributions - 2, ,504 1,292 4,258 2,361 7,595 1,245 39,442 32,405 96, , , , , , ,148 38,864 Total revenues $514,120 $531,161 $635,698 $710,915 $804,168 $701,588 $714,732 $780,416 $752,738 $765,680 Source: Annual Financial Reports and internal financial records 46
67 REVENUE BY SOURCE COMPARISON TO INDUSTRY TREND DATA LAST TEN FISCAL YEARS Fiscal Year Dallas Area Rapid Transit Fare revenue (1) 7.9% 8.2% 7.6% 8.4% 8.3% 9.5% 9.7% 9.4% 10.9% 9.8% Other revenues (2) 11.1% 12.3% 12.4% 12.7% 13.7% 12.8% 14.2% 14.0% 12.5% 10.6% 19.0% 20.4% 20.0% 21.1% 22.0% 22.3% 23.9% 23.4% 23.4% 20.4% State and local operating assistance(3) 72.2% 71.8% 72.4% 71.5% 67.7% 68.4% 68.1% 67.8% 73.8% 66.9% Federal operating assistance (4) 8.8% 7.8% 7.6% 7.4% 10.3% 9.3% 8.0% 8.8% 2.8% 12.7% 81.0% 79.6% 80.0% 78.9% 78.0% 77.7% 76.1% 76.6% 76.6% 79.6% Total (5) 100.0% 100.0% 100.0% 100.0% 100.0% 100.0% 100.0% 100.0% 100.0% 100.0% Transit Industry (6) Fare revenue 32.4% 33.2% 31.4% 31.2% 31.5% 32.1% 32.8% 32.5% N/A N/A Other revenues 15.7% 15.3% 14.1% 12.9% 12.4% 11.9% 11.1% 11.1% N/A N/A 48.1% 48.5% 45.5% 44.1% 43.9% 44.0% 43.9% 43.6% N/A N/A State and local operating assistance 44.6% 43.8% 47.0% 48.8% 47.9% 46.6% 46.3% 47.5% N/A N/A Federal operating assistance 7.3% 7.7% 7.5% 7.1% 8.2% 9.4% 9.8% 8.9% N/A N/A 51.9% 51.5% 54.5% 55.9% 56.1% 56.0% 56.1% 56.4% N/A N/A Total 100.0% 100.0% 100.0% 100.0% 100.0% 100.0% 100.0% 100.0% N/A N/A N/A= Fiscal year 2013 and 2014 industry information is not available Notes (1) Fare revenue is reported as passenger revenue for DART. (2) Other revenues include Advertising, Rent and Other, Investment Income, Build America Tax Credit and other non-operating revenues. (3) State and local operating assistance includes sales and use tax revenues and state operating grants. (4) Federal operating assistance includes federal operating grants. (5) Revenues shown here do not include capital contributions. (6) The source for industry information is American Public Transit Association, APTA 2014 Public Transportation Fact Book, Appendix A, Table
68 Revenue Capacity
69 SALES AND USE TAX REVENUE AND SERVICE AREA POPULATION CURRENT FISCAL YEAR AND NINE YEARS AGO The major local source of revenues for DART is a 1% sales and use tax imposed on certain items within its service area. The table below shows estimated sales and use tax revenue and population by member city for fiscal year 2014 compared to 2005 to show how sales and use tax and population have changed. City Sales and Use Tax Revenue 1 (Amounts in Thousands) Population 2 Percentage Change from 2005 to 2014 Percentage of total in Percentage Change from 2005 to 2014 Percentage of total in 2014 Dallas $243,594 $178, % 50.1% 1,232,360 1,232, % 52.8% Plano 71,695 46, % 14.8% 269, , % 11.5% Irving 54,525 36, % 11.2% 227, , % 9.7% Richardson 28,481 19, % 5.9% 101,820 95, % 4.4% Carrollton 26,483 17, % 5.5% 124, , % 5.3% Garland 22,101 16, % 4.5% 231, , % 9.9% Farmers Branch 12,724 9, % 2.6% 29,660 27, % 1.3% Addison 13,083 8, % 2.7% 56,450 52, % 2.4% Rowlett 5,396 3, % 1.1% 15,180 14, % 0.6% University Park 3,639 3, % 0.7% 22,860 23, % 1.0% Highland Park 3,272 1, % 0.7% 8,480 8, % 0.4% Glenn Heights % 0.1% 11,440 9, % 0.5% Cockrell Hill % 0.1% 4,170 4, % 0.2% Total $485,740 $342, % 100.0% 2,334,880 2,250, % 100.0% Sources: (1) Sales and use tax revenue estimated allocation to each city is performed by DART based on sales tax information from the State Comptroller. (2) Population data is from the North Central Texas Council of Governments. 48
70 SALES AND USE TAX REVENUE AND SERVICE AREA POPULATION LAST TEN FISCAL YEARS Sales and use tax revenue estimated allocation by member city 1 (Amounts in thousands) Fiscal Year City Dallas $178,183 $184,100 $199,271 $212,863 $193,527 $189,773 $203,349 $218,561 $231,377 $243,594 Plano 46,951 52,163 56,484 59,039 53,246 54,921 59,510 67,745 66,524 71,695 Irving 36,903 38,382 41,806 46,876 44,391 41,127 45,392 45,940 50,282 54,525 Richardson 19,629 18,207 21,216 21,335 17,588 23,244 23,159 23,767 25,602 28,481 Carrollton 17,575 17,753 19,658 19,927 19,492 18,527 20,522 23,090 24,722 26,483 Garland 16,191 17,732 19,369 20,466 18,881 18,555 18,850 20,174 21,151 22,101 Farmers Branch 9,712 10,251 12,022 12,010 11,692 10,459 11,568 12,146 12,968 12,724 Addison 8,757 8,475 9,426 9,870 8,936 8,240 9,159 10,702 12,042 13,083 Rowlett 3,351 6,342 5,585 5,461 5,327 5,799 5,454 4,671 5,163 5,396 University Park 3,480 2,717 2,806 2,883 2,726 2,867 3,253 3,124 3,216 3,639 Highland Park 1,747 1,796 2,016 2,235 2,154 2,247 2,426 2,774 2,819 3,272 Glenn Heights Cockrell Hill Total $342,670 $358,247 $389,953 $413,343 $378,420 $376,294 $403,228 $433,302 $456,524 $485,740 Sales and use tax rate 1% 1% 1% 1% 1% 1% 1% 1% 1% 1% Estimated service area population 2 Fiscal Year City Dallas 1,232,100 1,260,950 1,280,500 1,300,350 1,306,350 1,197,816 1,205,490 1,207,420 1,213,600 1,232,360 Plano 247, , , , , , , , , ,330 Irving 197, , , , , , , , , ,030 Richardson 95,250 97,300 97,700 97,450 99,700 99,223 99, , , ,820 Carrollton 116, , , , , , , , , ,400 Garland 221, , , , , , , , , ,700 Farmers Branch 27,600 27,850 28,500 28,750 31,100 28,616 28,600 28,620 28,800 29,660 Rowlett 52,250 53,100 53,750 54,150 54,250 56,199 56,230 56,310 56,420 56,450 Addison 14,450 14,900 15,250 15,300 13,400 13,056 13,060 13,680 13,840 15,180 University Park 23,150 23,250 23,150 22,850 23,350 23,068 23,020 23,040 22,920 22,860 Highland Park 8,850 8,750 8,600 8,600 8,650 8,564 8,520 8,520 8,500 8,480 Glenn Heights 9,400 10,500 11,450 11,650 12,100 11,278 11,330 11,330 11,410 11,440 Cockrell Hill 4,400 4,400 4,400 4,450 4,450 4,193 4,200 4,200 4,180 4,170 Total 2,250,300 2,297,000 2,329,500 2,363,600 2,378,700 2,261,117 2,275,930 2,283,530 2,297,580 2,334,880 Sources: (1) Sales and use tax revenue estimated allocation to each city is performed by DART based on sales tax information from the State Comptroller. (2) Service area population estimate is from the North Central Texas Council of Governments except for fiscal year (3) Service area population for fiscal year 2010 is obtained from the US Census Bureau. 49
71 SALES AND USE TAX REVENUE BY INDUSTRY CURRENT FISCAL YEAR COMPARED TO SIX YEARS AGO Percentage Change from INDUSTRY Amount Percent Amount Percent 2008 to 2014 Retail Trade $161, % $145, % 10.9% Information Technology 51, % 41, % 24.1% Accommodation and Food Services 49, % 38, % 29.5% Wholesale Trade 48, % 41, % 15.2% Manufacturing 40, % 26, % 51.1% Professional, Scientific, and Technical Services 31, % 18, % 66.8% Construction 26, % 21, % 26.6% Administrative and Support and Waste Management and Remediation Services 21, % 17, % 20.5% Utilities 10, % 20, % -49.3% Real Estate and Rental and Leasing 12, % 11, % 6.6% Finance and Insurance 10, % 8, % 15.7% 463, % 392, % 18.1% Other industries 22, % 20, % 7.0% Total $485, % $413, % 17.5% Note information for fiscal years prior to 2008 is not available. Source: Texas State Comptroller 50
72 PASSENGER FARE REVENUE AND RIDERSHIP CURRENT FISCAL YEAR COMPARED TO TEN YEARS AGO The second major local source of revenue for DART is passenger revenues (fare revenues) collected from customers who use DART s public transportation services. The following table shows passenger revenues and ridership for fiscal year 2014 compared to Passenger Revenues (Amounts in Thousands) 1 Ridership 2 (Amounts in Thousands) Type of Service Percentage Change from 2005 to 2014 Percentage of total in Percentage Change from 2005 to 2014 Percentage of total in 2014 Bus $32,564 $25, % 45.9% 37,383 40, % 52.8% Light Rail 27,905 8, % 39.4% 29,458 17, % 41.6% Commuter Rail 3 7,366 1, % 10.4% 2,284 2, % 3.2% Demand Response 1,149 1, % 1.6% % 0.7% Demand Response-Taxi N/A 1.3% N/A 0.5% Van Pool % 1.4% % 1.2% Total $70,902 $37, % 100.0% 70,863 60, % 100.0% N/A= Not applicable Note: 1. The increase in total passenger revenue from $37.1 million in 2005 to $70.9 million in 2014 is due to increases in ridership and fares. 2. Ridership is reported as unlinked passenger trips. For example, a passenger who transfers from a bus to rail is counted as two unlinked passenger trips. The decrease in bus ridership and increase in light rail ridership in 2014 compared to 2005 is due to the replacement of some bus routes with light rail lines as a result the opening of the the Green Line light rail service, the Orange Line light rail service and the Blue line extension between 2009 and The increase in passenger revenue for the Commuter Rail mode is due to a change in the allocation method of passenger revenue to each mode in addition to fare increases. Source: National Transit Database and internal financial and ridership records 51
73 PASSENGER FARE REVENUE AND RIDERSHIP LAST TEN FISCAL YEARS (Amounts in Thousands) Fiscal Year Passenger revenues(1) Bus $25,751 $28,201 $28,141 $31,214 $29,236 $27,826 $28,245 $32,525 $37,133 $32,564 Light Rail 8,434 9,276 9,453 13,557 $13,041 13,140 17,788 17,962 20,435 27,905 Commuter Rail 1,036 1,203 1,284 1,954 $1,926 8,027 8,036 6,044 6,880 7,366 Demand Response 1,615 1,689 1,807 1,921 $1,976 2,493 2,506 2,465 2,154 1,149 Demand Response-Taxi Vanpool $ Total $37,131 $40,800 $41,115 $48,957 $46,712 $52,081 $57,329 $59,809 $67,569 $70,902 Ridership (2) Bus 40,089 44,693 44,690 44,752 42,517 37,693 36,971 38,379 37,937 37,383 Light Rail 17,487 18,581 17,893 19,438 18,965 17,799 22,302 27,654 29,472 29,458 Commuter Rail 2,151 2,410 2,475 2,717 2,739 2,432 2,388 2,252 2,093 2,284 Demand Response ,039 1,136 1,140 1, Demand Response-Taxi Vanpool , Total 60,814 66,829 66,372 68,514 66,141 59,985 63,786 70,459 71,281 70,863 Average fare per passenger (3) $0.61 $0.61 $0.62 $0.71 $0.71 $0.87 $0.90 $0.85 $0.95 $1.00 Average fare per passenger, Transit Industry - all agencies (4) $1.01 $1.04 $1.27 $1.07 $1.11 $1.17 $1.22 $1.31 $1.40 N/A $1.60 $1.40 $1.20 $1.00 $0.80 $0.60 $1.01 $1.04 $1.27 $0.61 $0.61 $0.62 $1.07 $1.11 $0.71 $0.71 $1.17 $1.22 $0.87 $0.90 $1.31 $0.85 $1.40 $0.95 $1.00 $0.40 $0.20 $ Average fare per passenger - DART Average fare per passenger - Transit Industry N/A = Fiscal year 2014 transit industry average fare information is not available. The decrease in bus ridership starting in 2010 is due to the replacement of some bus routes with light rail lines as a result the opening of the Green Line light rail service, Orange Line light rail service and Blue Line extension between 2009 and Sources: (1) National Transit Database (NTD) Report and internal financial records (2) National Transit Database (NTD) Report and internal ridership records (3) Calculated by dividing total passenger revenues by total ridership (4) National Transit Database (NTD) Report - National Transit Summary Profile 52
74 FARE STRUCTURE LAST TEN FISCAL FISCAL YEARS 2005 to to to 2014 Effective 10/1/07 Effective 9/14/09* Effective 10/1/09* Effective 10/1/10* Effective 12/3/12 BASE SINGLE RIDE FARE Local Service $1.25 $1.50 $1.50 $1.75 $1.75 $1.75 Commuter Rail - Zone 1 and Express Bus (1) $1.25 $1.50 $1.50 $2.50 $2.50 $3.50 Commuter Rail - Zone 2 and Express Bus (2) $2.25 $2.50 $2.50 $3.75 $3.75 $5.00 Reduced Fare $0.50 $0.75 $0.75 $0.85 $0.85 $0.85 Paratransit - Demand Response Van/Sedan Service $2.50 $2.75 $2.75 $2.75 $3.00 $3.00 Paratransit Trips to Fixed Route Stops $0.75 $0.75 $0.75 $0.75 $0.75 Paratransit Eligible Riders on Fixed Route Service Free Free Free Free Free Free BASE TWO-HOUR FARE Local Service (10) $2.50 Regional Service (11) $5.00 Reduced Fare $1.25 Paratransit - Demand Response Van/Sedan Service $3.00 Paratransit Trips to Fixed Route Stops $0.75 Paratransit Eligible Riders on Fixed Route Service Free MID-DAY FARE (9) Local Service (10) $1.75 Regional Service (11) $3.50 DAY PASS (5) Local Service (10) $2.50 $3.00 $3.00 $4.00 $4.00 $4.00 $5.00 Commuter Rail - Zone 1 and Express Bus (1) $2.50 $3.00 $3.00 $5.00 $5.00 $7.00 Commuter Rail - Zone 2 and Express Bus (2) $4.50 $5.00 $5.00 $7.50 $7.50 $10.00 Regional Service (11) $10.00 Reduced Fare $1.00 $1.50 $1.50 $2.00 $2.00 $2.00 $2.50 Regional Day Pass Book of Ten $ Ticket Paratransit Coupon Book $30.00 WEEKLY PASS (6) Local Service (11) $15.00 $15.00 $20.00 $20.00 $20.00 $25.00 Commuter Rail - Zone 1 and Express Bus (1) $15.00 $15.00 $25.00 $25.00 $35.00 Commuter Rail - Zone 2 and Express Bus (2) $25.00 $25.00 $37.50 $37.50 $50.00 Regional Service (11) $50.00 MONTHLY PASS (6) Local Service (10) $40.00 $50.00 $50.00 $65.00 $65.00 $65.00 $80.00 Commuter Rail - Zone 1 and Express Bus (1) $40.00 $50.00 $50.00 $75.00 $75.00 $ Commuter Rail - Zone 2 and Express Bus (2) $70.00 $80.00 $80.00 $ $ $ Regional Service (11) $ Reduced Fare (3) $15.00 $25.00 $25.00 $32.00 $32.00 $32.00 $40.00 Lone Star Card (8) 50% discount ANNUAL PASS (7) Local Service (10) $ $ $ $ $ $ $ Commuter Rail - Zone 1 and Express Bus (1) $ $ $ $ $ $1, Commuter Rail - Zone 2 and Express Bus (2) $ $ $ $1, $1, $1, Regional Service (11) $1, Senior $ During the last ten years, the DART Board approved five amendments to fare structures with the following effective dates: 10/1/2007, 9/14/2009, and 12/03/2012. *The September 14, 2009 amendment has three effective dates: 9/14/09, 10/01/09 & 10/01/10 with additional fare changes becoming effective on 10/1/09 and 10/1/10 as shown in the schedule above. Notes (1) Commuter Rail-Zone 1 level of service is for customers that use commuter rail (TRE) service between Union Station in Downtown Dallas and CentrePort/DFW Station. Express bus service is a bus service with fewer stops and providing trips during morning and afternoon rush hours. (2) Commuter Rail-Zone 2 level of service is for customers that use the commuter rail (TRE) service to travel to destinations on the commuter rail(tre) west of the CentrePort/DFW Station. (3) Reduced fares are applicable on bus and rail service to the following: seniors, non-paratransit disabled, high school students with valid identification, children age 5 through junior high school (children under age 5 ride free) and shuttle bus routes. Reduced passes are not available in the form of weekly passes and annual passes. (4) Day passes are valid for unlimited use on the date of purchase only through 3a.m. the following day. (5) Weekly passes are valid for seven consecutive days. Weekly pass fares were introduced on October 1, (6) Monthly passes available for calendar months or 31 consecutive days. (7) Annual passes are valid for a calendar year and expire at mid-night on December 31. Annual pass fares shown here are for individual customers. Pricing for annual passes bought by employers for their employees varies depending on the number of employees and the location of the employer within DART service area. The annual pass fare option for individuals was introduced on December 1, (8) Lone Star cardholders with Temporary Assistance for Needy Families (TANF) benefits are eligible to purchase Monthly Passes at a 50% discount from listed fares. This discount does not apply to Reduced or High School Monthly Pass (9) Mid-Day Pass allows unlimited travel between 9:30 a.m. and 2:30 p.m. Monday through Friday. (10) All DART buses and trains; TRE sevice between Union Station and CentrePort Station; DART On-Call and Flex service. (11) All DART buses and trains; all TRE sevices; The T in Fort Worth; the A-Train and DCTA in Denton. Source: DART Board Resolutions , , , , and
75 Debt Capacity
76 OUTSTANDING DEBT RATIO LAST TEN FISCAL YEARS OUTSTANDING DEBT RATIO Fiscal Year Total outstanding debt (in thousands) 1 Senior Lien Revenue Bonds* $486,008 $475,719 $943,861 $1,683,678 $2,680,675 $2,641,677 $3,361,548 $3,351,255 $3,550,250 $3,564,499 Senior Subordinate Lien Sales Tax Revenue Notes 297, , ,000 20, , , ,000 70, , ,000 Capital Lease Obligations 475, , , , , , , , , ,005 $1,258,575 $1,297,408 $1,557,598 $2,150,803 $3,166,834 $3,113,917 $3,835,451 $3,710,814 $3,870,954 $3,944,504 Total personal income (in thousands) 2 $60,202,901 $61,099,987 $64,577,303 $64,697,797 $68,217,198 $66,205,506 $66,007,116 $66,384,193 $68,328,835 $69,851,833 Outstanding debt ratio OUTSTANDING DEBT PER CAPITA Total outstanding debt (in thousands) as shown above Fiscal Year $1,258,575 $1,297,408 $1,557,598 $2,150,803 $3,166,834 $3,113,917 $3,835,451 $3,710,814 $3,870,954 $3,944,504 Service area population 3 2,250,300 2,297,000 2,329,500 2,363,600 2,378,700 2,261,117 2,275,930 2,283,530 2,297,580 2,334,880 Outstanding debt per capita $559 $565 $669 $910 $1,331 $1,377 $1,685 $1,625 $1,685 $1,689 *Includes Transit Infrastructure Financing Act (TIFIA) bonds at 9/30/2013 and 9/30/2014. Sources: (1) Outstanding debt information is obtained from annual financial reports and internal financial records. (2) Total personal income information for DART Service Area is obtained from the US Census Bearu and published reports of service area municipalities. (3) Service area population is obtained from the North Central Texas Council of Governments. 54
77 DEBT LIMIT LAST TEN FISCAL YEARS (Amounts In Thousands) Fiscal Year Senior Lien Revenue Bonds(1) Voted Debt Limit $2,900,000 $2,900,000 $2,900,000 $2,900,000 See note 1 See note 1 See note 1 See note 1 See note 1 See note 1 Debt Issuance Subject to Limit 499, , ,251 1,731,623 Limit Available 2,400,601 2,400,601 1,919,749 1,168,377 Percent of Limit Issued 17% 17% 34% 60% Subord Debt Limit (2) 600, , , , , , , , , ,000 Debt Issuance Subject to Limit 297, , ,000 20, , , ,000 70, , ,000 Limit Available 302, , , , , ,000 50,000 20,000 Percent of Limit Issued 50% 69% 30% 3% 25% 100% 100% 47% 67% 90% Total Debt Limit 3,500,000 3,500,000 3,500,000 3,500,000 See note 1 See note 1 See note 1 See note 1 See note 1 See note 1 Debt Issuance Subject to Limit 796, ,044 1,160,251 1,751,623 Limit Available 2,703,356 2,584,956 2,339,749 1,748,377 Percent of Limit Issued 23% 26% 33% 50% Notes: 1 N/A= Not Applicable In August 2000, the citizens of DART's members cities and towns voted to authorize DART to issue up to $2.9 billion in bonds secured solely by sales and use tax revenues. Bonds issued through and including the Series 2008 bonds were solely secured with a sales tax revenue pledge and therefore subject to the $2.9 billion voter authorized limit on sales tax only pledged bonds. Prior to the issuance of the Series 2009 bonds the security pledge for all bonds, retroactive to and including Series 2001, was expanded to include sales tax revenues and other pledged revenues. Therefore, new bonds issued with the expanded security pledge bonds are no longer subject to the $2.9 billion limitation. However, DART can only issue additional bonds if its projected gross pledged revenues exceed projected debt service requirements by 200%. Each issuance of DART's revenue bond is subject to approval by the Attorney General of the State of Texas. 2 The Senior Subordinate Lien Sales Tax Revenue notes is limited to the amount of the commercial paper line of credit agreement entered into between DART and the financial institutions. Source: Internal financial records 55
78 DEBT COVERAGE RATIO LAST TEN FISCAL YEARS (Amounts In Thousands) DEBT COVERAGE RATIO BASED ON PLEDGED REVENUES* Fiscal Year Pledged Revenues Sales and Use Tax $342,670 $358,248 $389,953 $413,341 $378,421 $376,295 $403,228 $433,302 $456,524 $486,564 Passenger (Fare) Revenue N/A N/A N/A N/A 52,081 57,329 59,809 59,809 67,569 70,902 $342,670 $358,248 $389,953 $413,341 $430,502 $433,624 $463,037 $493,111 $524,093 $557,466 Debt Service requirements** Principal - Bond $6,815 $10,470 $10,820 $13,680 $14,295 $17,935 $18,790 $8,370 $6,740 $33,175 Interest Payments 29,374 35,016 37,321 51,637 79, , , , , ,711 36,189 45,486 48,141 65,317 93, , , , , ,886 Less: Build America Bond Credit N/A N/A N/A N/A N/A (16,554) (26,008) (30,462) (28,406) (28,259) Net debt service $36,189 $45,486 $48,141 $65,317 $93,976 $137,816 $154,674 $152,030 $155,117 $185,627 Coverage Ratio*** N/A=Not applicable *Sales and Use Tax and fare revenues are pledged as securities for debt service. Passenger fare revenues were pledged for debt service starting fiscal year Gross revenues are not shown net of expense since the debt has a senior lien (priority claim) against the pledge revenues. ** Debt service requirements increased significantly starting in fiscal year 2008 because of additional issuances of revenue bonds each year between 2007 and Debt service requirements include actual principal and interest payments, net of the Build America Bond credit. *** The coverage ratios shown here differ from the coverage ratios that are included in DART's debt documents. The ratios in this schedule are not an attempt to calculate the additional bonds test coverage ratio included in DART's debt documents. Source: Annual financial statements and internal accounting records 56
79 Demographic and Economic Information
80 ECONOMIC AND DEMOGRAPHIC INFORMAITON LAST TEN FISCAL YEARS Fiscal Year Population (1) 2,250,300 2,297,000 2,329,500 2,363,600 2,378,700 2,261,117 2,275,930 2,283,530 2,297,580 2,334,880 Per Capita Income (2) $26,753 $26,600 $27,722 $27,373 $28,678 $29,280 $29,002 $29,071 $29,739 $29,917 Total Personal Income (in thousands) (2) $60,202,901 $61,099,987 $64,577,303 $64,697,797 $68,217,198 $66,205,506 $66,007,116 $66,384,193 $68,328,835 $69,851,833 Unemployment Rate (3) 5.2% 4.8% 4.3% 5.1% 7.8% 8.3% 7.8% 6.7% 6.2% 5.1% UNEMPLOYMENT RATE 9.0% 8.0% 7.0% 7.8% 8.3% 7.8% 6.7% 6.2% 6.0% 5.0% 5.2% 4.8% 4.3% 5.1% 5.1% 4.0% 3.0% 2.0% 1.0% 0.0% Sources: 1 North Central Texas Council of Governments (NCTCOG) except for 2010 which is based on census data. 2 Total personal income and per capita income for DART Service Area are obtained from the US Census Bureau and published reports of service area municipalities. 3 Texas Workforce Commission (unemployment rate information presented here is for the five counties where DART's member cities and towns are located). 57
81 PRINCIPAL EMPLOYERS IN DART SERVICE AREA CURRENT FISCAL YEAR AND TEN YEARS AGO Rank Name of Employer Number of Employees Percentage of Total Employment Rank Name of Employer Number of Employees Percentage of Total Employment 1 Baylor Health Care System 22, % 1 Dallas Independent School District 19, % 2 Dallas Independent School District 20, % 2 Baylor Health Care System 14, % 3 Bank of America 15, % 3 SBC Southwestern Bell 14, % 4 City of Dallas 13, % 4 Verizon Communications 14, % 5 JPMorgan Chase 13, % 5 City of Dallas 12, % 6 Texas Instruments Inc. 13, % 6 Brinker International 12, % 7 UT Southwestern Medical Center at Dallas 11, % 7 Texas Instruments 10, % 8 HCA North Texas Division 11, % 8 Electronic Data Systems (EDS) 8, % 9 Southwestern Airlines 8, % 9 Bank of America 8, % 10 Verizon Coummunity 8, % 10 J.C. Penney Co. Inc. 7, % Sources for 2014: Dallas Business Journal, Book of Lists 2014, Volume 38, Number 16 Sources for 2005: Dallas Business Journal's Elists 58
82 Operating Information
83 NUMBER OF EMPLOYEES BY FUNCTION LAST TEN FISCAL YEARS Fiscal Year FUNCTION Transport Operations Bus Operations 1,532 1,510 1,516 1,534 1,539 1,537 1,451 1,487 1,522 1,470 Commuter Rail Operations HOV Lane Operations Light Rail Operations Paratransit Operations Van Pool Operations ,833 1,801 1,834 1,881 1,922 1,959 1,859 1,942 1,944 1,839 Maintenance Vehicle Maintenance Non-vehicle Maintenance ,008 1,035 Public Safety and Fare Enforcement Operations Total 2,747 2,739 2,791 2,876 2,983 3,245 3,128 3,233 3,292 3,226 Administration Total 3,170 3,154 3,210 3,309 3,430 3,680 3,526 3,592 3,661 3,579 Note Number of employees presented here is actual head count of full-time, temporary and part-time employees at the end of each fiscal year. Source: DART's personnel data 59
84 LEVEL OF SERVICE - ANNUAL LAST TEN FISCAL YEARS Fiscal Year PASSENGERS (RIDERSHIP) Bus 40,089,100 44,693,400 44,689,900 44,752,343 42,517,272 37,693,438 36,971,366 38,378,872 37,937,209 37,383,043 Light Rail 17,487,057 18,581,066 17,892,532 19,437,603 18,965,249 17,799,186 22,302,390 27,653,893 29,471,890 29,458,289 Commuter Rail* 2,151,130 2,410,027 2,475,495 2,717,162 2,738,856 2,432,174 2,388,407 2,252,140 2,092,782 2,283,895 Demand Response 733, , , ,157 1,038,686 1,135,997 1,140,165 1,141, , ,964 Demand Response-Taxi ,174 Vanpool 354, , , , , , ,046 1,033, , ,966 60,815,108 66,829,539 66,372,391 68,514,315 66,140,741 59,985,395 63,787,374 70,458,962 71,281,128 70,863,331 REVENUE MILES Bus 30,406,714 27,675,007 27,666,962 27,781,344 27,547,241 27,323,659 25,727,585 27,144,101 27,250,680 26,847,955 Light Rail 5,174,725 5,096,186 5,224,548 5,250,953 5,007,225 4,941,155 6,897,909 7,560,914 9,123,662 9,198,085 Commuter Rail* 1,076,333 1,087,437 1,137,231 1,565,010 1,292,607 1,239,709 1,142,577 1,109,867 1,144,466 1,117,922 Demand Response 7,140,043 7,428,206 7,406,058 8,109,876 7,818,699 8,458,570 8,638,492 8,813,149 7,556,040 6,251,699 Demand Response-Taxi ,144,030 Vanpool 1,411,699 1,687,567 1,952,128 2,750,115 3,294,533 3,505,934 3,816,639 3,919,736 3,632,332 3,426,983 45,209,514 42,974,403 43,386,927 45,457,298 44,960,305 45,469,027 46,223,202 48,547,767 48,707,180 50,986,674 REVENUE HOURS Bus 2,130,533 1,984,900 1,990,866 2,028,437 2,021,031 2,009,486 1,953,954 2,010,240 2,100,705 2,082,551 Light Rail 242, , , , , , , , , ,931 Commuter Rail* 48,322 48,361 47,813 54,743 56,156 49,836 47,440 48,247 49,496 49,788 Demand Response 404, , , , , , , , , ,755 Demand Response-Taxi ,078 Vanpool 40,334 41,160 47,613 67,076 80,354 87,648 95,416 97,993 90,808 85,675 2,865,852 2,784,992 2,780,615 2,835,832 2,847,731 2,908,228 2,966,976 3,068,116 3,194,352 3,307,778 PASSENGERS PER REVENUE MILE Bus Light Rail Commuter Rail* Demand Response Demand Response-Taxi Vanpool PASSENGERS PER REVENUE HOUR Bus Light Rail Commuter Rail* Demand Response Demand Response-Taxi 1.56 Vanpool Operating expense** $342,541 $342,532 $347,969 $393,261 $401,822 $437,221 $449,894 $452,935 $462,697 $468,113 Operating expense per mile $7.58 $7.97 $8.02 $8.65 $8.94 $9.62 $9.73 $9.33 $9.50 $9.18 Operating expense per hour $ $ $ $ $ $ $ $ $ $ Operating expense per passenger $5.63 $5.13 $5.24 $5.74 $6.08 $7.29 $7.05 $6.43 $6.49 $6.61 Fare revenue per passenger $0.61 $0.61 $0.62 $0.71 $0.71 $0.87 $0.90 $0.85 $0.95 $1.00 * Commuter Rail service information shown here includes information reported to the National Transit Database by both DART and The Fort Worth Transportation Authority (The T). **Operating expense does not include depreciation and amortization, interest expense and non-operating expenses. Source: National Transit Database Bus ridership for fiscal year 2007 is based on internal ridership records 60
85 RIDERSHIP LAST TEN FISCAL YEARS RIDERSHIP (In Thousands) 80,000 75,000 70,000 66,830 66,372 68,514 66,141 70,459 71,281 70,863 65,000 63,787 60,000 60,815 59,985 55,000 50, Fiscal Year 61
86 REVENUE MILES LAST TEN FISCAL YEARS REVENUE MILES* (In Thousands) 52,000 51,000 50,987 50,000 49,000 48,548 48,707 48,000 47,000 46,000 45,210 45,457 44,960 45,469 46,223 45,000 44,000 43,000 42,974 43,387 42, Fiscal Year * Revenue miles for rail services are car revenue miles. 62
87 REVENUE HOURS LAST TEN FISCAL YEARS REVENUE HOURS* (In Thousands) 3,500 3,400 3,308 3,300 3,194 3,200 3,100 3,068 3,000 2,967 2,900 2,866 2,781 2,836 2,848 2,908 2,800 2,785 2, Fiscal Year * Revenue hours for rail services are car revenue hours. 63
88 PASSENGERS PER REVENUE MILE AND REVENUE HOUR LAST TEN FISCAL YEARS PASSENGERS PER REVENUE MILE Fiscal Year PASSENGERS PER REVENUE HOUR Fiscal Year 64
89 LEVEL OF SERVICE - AVERAGE WEEKDAY LAST TEN FISCAL YEARS Fiscal Year AVERAGE WEEKDAY PASSENGERS (RIDERSHIP) Bus 131, , , , , , , , , ,432 Light Rail 59,259 62,007 60,596 65,757 64,381 59,785 71,748 90,182 96,354 96,523 Commuter Rail (1) 4,748 5,218 5,357 5,371 5,839 8,689 8,482 8,080 7,556 8,229 Demand Response 2,559 2,695 2,899 3,150 3,662 4,004 4,001 4,001 1,845 2,549 Demand Response-Taxi ,796 Vanpool 1,390 1,741 1,969 2,755 3,481 3,640 3,893 4,067 3,728 3, , , , , , , , , , ,045 AVERAGE WEEKDAY REVENUE MILES Bus 99,413 90,962 90,600 90,302 89,839 89,626 84,194 87,949 88,750 87,178 Light Rail (2) 17,064 16,966 17,483 17,476 16,627 16,123 21,897 23,688 28,022 28,392 Commuter Rail (1) (2) 1,932 1,972 1,972 2,379 1,768 4,421 3,815 3,866 3,992 4,005 Demand Response 24,463 25,564 25,396 27,456 26,319 28,660 29,242 29,898 14,481 22,652 Demand Response-Taxi ,866 Vanpool 5,536 6,670 7,809 10,870 13,022 13,803 15,086 15,432 14,301 13, , , , , , , , , , ,585 AVERAGE WEEKDAY REVENUE HOURS Bus 6,904 6,422 6,462 6,547 6,545 6,552 6,353 6,468 6,792 6,707 Light Rail (2) ,105 1,194 1,377 1,383 Commuter Rail (1) (2) Demand Response 1,392 1,642 1,560 1,500 1,542 1,752 1,779 1,811 1,035 1,433 Demand Response-Taxi ,986 Vanpool ,337 9,105 9,114 9,221 9,270 9,633 9,780 10,028 9,733 26,018 AVERAGE WEEKDAY PASSENGERS PER REVENUE MILE Bus Light Rail Commuter Rail (1) Demand Response Demand Response-Taxi Vanpool AVERAGE WEEKDAY PASSENGERS PER REVENUE HOUR Bus Light Rail Commuter Rail (1) Demand Response Demand Response-Taxi Vanpool Notes (1) Average weekday information for commuter rail for fiscal years 2005 to 2009 does not include service provided outside DART Service Area. (2) Average weekday revenue miles and hours for rail services are car revenue miles and hours. Source: National Transit Database and internal records 65
90 NUMBER OF VEHICLES AND OPERATING FACILITIES LAST TEN FISCAL YEARS Fiscal Year Number of vehicles available for service (1) Bus Light Rail Commuter Rail Demand Response Demand Response-Taxi Vanpool Total 1,133 1,159 1,193 1,233 1,198 1,216 1,277 1,251 1,227 1,235 Number of vehicles operated during weekday (1) Bus Light Rail Commuter Rail Demand Response Demand Response-Taxi Vanpool Total ,019 1, Operating Facilities (2) Bus Number of operating garages Number of transit centers Number of bus stops 11,961 11,961 11,961 12,322 12,500 12,500 12,500 12,500 11,973 11,351 Light Rail Miles of tracks Number of stations Number of operating garages Commuter Rail Miles of tracks Number of stations Number of operating garages Demand Response Number of operating garages Sources: 1) National Transit Database 2) Quarterly Performance Reports for the 4th quarter of each fiscal year. 66
91 COST OF CAPITAL ASSETS LAST TEN FISCAL YEARS (Amounts In Thousands) Non-Depreciable Capital Assets Land and right-of-way $387,010 $387,009 $388,000 $387,934 $398,914 $397,997 $548,904 $554,714 $578,169 $609,498 Capital projects in progress 328, , ,171 1,210,357 1,755,739 2,305, , , ,542 70,845 Total Non-Depreciable Capital Assets 715, ,661 1,133,171 1,598,291 2,154,653 2,703,267 1,408,776 1,217, , ,343 Depreciable Capital Assets Transit-ways 1,348,788 1,371,496 1,369,288 1,408,118 1,607,364 1,631,987 2,779,751 3,188,305 3,696,268 3,845,836 Buildings and Improvements 364, , , , , , , , , ,585 Revenue and Non-Revenue Vehicles and Equipment 620, , , , , ,898 1,218,639 1,275,561 1,319,261 1,303,485 Furniture, Fixtures, and Leasehold Improvements 35,315 31,423 33,083 35,370 38,189 38,940 43,242 49,537 61,184 59,872 Total Depreciable Capital Assets 2,368,861 2,382,589 2,475,012 2,567,311 2,866,339 3,026,674 4,737,734 5,215,582 5,822,027 5,955,778 Less Accumulated Depreciation Fiscal Year Transit-ways 265, , , , , , , , , ,205 Buildings and Improvements 143, , , , , , , , , ,802 Revenue and Non-Revenue Vehicles and Equipment 252, , , , , , , , , ,137 Furniture, Fixtures, and Leasehold Improvements 32,398 29,740 31,244 29,214 31,868 31,939 36,569 38,929 46,450 50,973 Total Accumulated Depreciation 694, , , ,652 1,086,850 1,209,325 1,370,680 1,555,090 1,728,126 1,826,117 Net Depreciable Capital Assets 1,674,590 1,599,253 1,589,374 1,585,659 1,779,489 1,817,349 3,367,054 3,660,492 4,093,901 4,129,661 Net Capital Assets $ 2,390,070 $ 2,455,914 $ 2,722,545 $ 3,183,950 $ 3,934,142 $ 4,520,616 $ 4,775,830 $ 4,877,773 $ 4,877,612 $ 4,810,004 Source: Annual financial statements 67
92 This page intentionally left blank.


93 DART Board Members Jim Adams City of Dallas Richard Carrizales Secretary City of Dallas Michael T. Cheney City of Garland Jerry L. Christian City of Dallas Amanda Moreno Cross City of Dallas Mark C. Enoch Cities of Garland, Rowlett and Glenn Heights Pamela Dunlop Gates City of Dallas Tim Hayden Cities of Carrollton and Irving Michele Wong Krause City of Dallas Gary A. Slagel Assistant Secretary Cities of Richardson and University Park, Towns of Addison and Highland Park Rick Stopfer City of Irving Robert W. Strauss Chairman City of Dallas William Velasco, II Cities of Dallas and Cockrell Hill Paul N. Wageman City of Plano Faye Moses Wilkins Vice Chairman Cities of Plano and Farmers Branch Rev 3/15
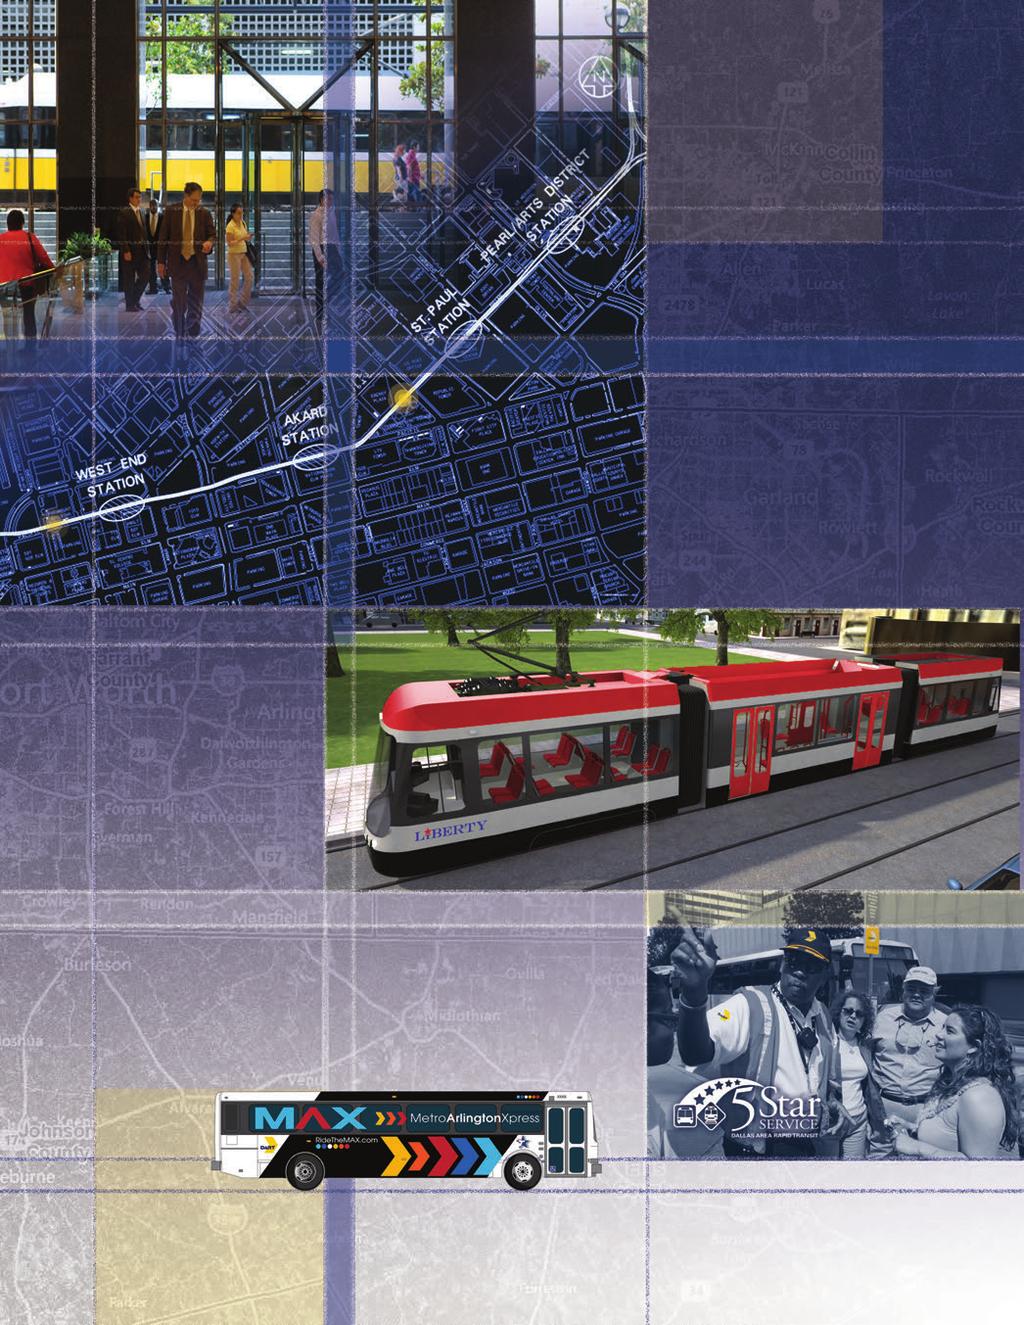
94 CW
Dallas Area Rapid Transit Dallas, Texas. Financial Statements Years Ended September 30, 2016 and 2015 and Independent Auditor s Report
 Dallas Area Rapid Transit Dallas, Texas Financial Statements Years Ended September 30, 2016 and 2015 and Independent Auditor s Report DALLAS, TEXAS FINANCIAL STATEMENTS AS OF AND FOR THE YEARS ENDED SEPTEMBER
Comprehensive Annual Financial Report
 Comprehensive Annual Financial Report For the Fiscal Year Ended September 30, 2012 Dallas, Texas This page intentionally left blank. COMPREHENSIVE ANNUAL FINANCIAL REPORT For the Fiscal Year Ended September
PLANO. President George Bush Turnpike ADDISON. Dallas North Tollway. Walnut Hill/Denton. Bachman UNIVERSITY LOVE PARK FIELD PARK.
 DALL AS AR E A R API D T R AN S IT C O M PR E H EN S I VE AN N UAL FI N AN C I AL R E P O R T Fiscal Year Ended September 30, 2016 Dallas, Texas to Denton (operated by DCTA) PLANO PARKER ROAD FARMERS BRANCH
Dallas Area Rapid Transit. Financial Statements Years Ended September 30,2002 and 2007 and Independent Auditors Report
 Dallas Area Rapid Transit Financial Statements Years Ended September 30,2002 and 2007 and Independent Auditors Report Deloitte 8. Touche LLP Suite 1600 JPMorgan ChaseTower 2200 Ross Avenue Dallas,Texas
DALLAS AREA RAPID TRANSIT. Quarterly Disclosure Update for the nine-month period ended June 30, 2017
 DALLAS AREA RAPID TRANSIT Quarterly Disclosure Update for the nine-month period ended June 30, 2017 This Quarterly Disclosure Update supplements the information contained in our Annual Disclosure Statement
ASSETS TOTAL CURRENT ASSETS 289, ,987 RESTRICTED ASSETS 146,836 31,045 PROPERTY, PLANT, AND EQUIPMENT, NET 1,960,410 1,632,326
 CONSOLIDATED BALANCE SHEETS (In Thousands) ASSETS 2000 1999 CURRENT ASSETS: Cash and cash equivalents $48,358 $95,394 Investments 51,187 38,488 Sales tax receivable 64,194 51,589 Transit revenue receivable,
Washington Metropolitan Area Transit Authority
 Washington Metropolitan Area Transit Authority Financial Report For the Fiscal Years Ended June 30, 2017 and 2016 Table of Contents Washington Metropolitan Area Transit Authority Financial Report For the
ASSETS TOTAL CURRENT ASSETS 303, ,236 RESTRICTED ASSETS 116, ,836 PROPERTY, PLANT, AND EQUIPMENT, NET 2,155,514 1,960,410
 CONSOLIDATED BALANCE SHEETS (In Thousands) ASSETS 2001 2000 CURRENT ASSETS Cash and cash equivalents $77,275 $48,358 Investments 53,568 51,187 Sales tax receivable 58,426 64,194 Transit revenue receivable,
DALLAS AREA RAPID TRANSIT. Quarterly Disclosure Update for the nine-month period ended June 30, 2003
 DALLAS AREA RAPID TRANSIT Quarterly Disclosure Update for the nine-month period ended June 30, 2003 This Quarterly Disclosure Update (this Quarterly Disclosure Update ) supplements the information contained
TEXAS DEPARTMENT OF TRANSPORTATION. Annual Financial Report For The Fiscal Year Ended August 31, (With Independent Auditor s Report)
") TEXAS DEPARTMENT OF TRANSPORTATION Annual Financial Report For The Fiscal Year Ended August 31, 2018 (With Independent Auditor s Report) Texas Department of Transportation Annual Financial Report (With
TEXAS DEPARTMENT OF TRANSPORTATION Annual Financial Report For The Fiscal Year Ended August 31, 2018 (With Independent Auditor s Report) Texas Department of Transportation Annual Financial Report (With
Washington Metropolitan Area Transit Authority
 Washington Metropolitan Area Transit Authority Financial Report issued in Accordance with Government Auditing Standards For the Years Ended June 30, 2016 and 2015 Single Audit Reports issued in Accordance
DALLAS AREA RAPID TRANSIT. Quarterly Disclosure Update for the three-month period ended March 31, 2005
 Quarterly Disclosure Update for the three-month period ended March 31, 2005 This Quarterly Disclosure Update supplements the information contained in our 2005 Annual Disclosure Statement dated March 22,
CHICAGO TRANSIT AUTHORITY CHICAGO, ILLINOIS
 CHICAGO, ILLINOIS FINANCIAL STATEMENTS AND SUPPLEMENTARY INFORMATION Years Ended (With Independent Auditor s Report Thereon) Chicago, Illinois FINANCIAL STATEMENTS Years Ended TABLE OF CONTENTS Independent
TEXAS DEPARTMENT OF TRANSPORTATION. Annual Financial Report For The Fiscal Year Ended August 31, (With Independent Auditor s Report)
") TEXAS DEPARTMENT OF TRANSPORTATION Annual Financial Report For The Fiscal Year Ended August 31, 2017 (With Independent Auditor s Report) Texas Department of Transportation Annual Financial Report (With
TEXAS DEPARTMENT OF TRANSPORTATION Annual Financial Report For The Fiscal Year Ended August 31, 2017 (With Independent Auditor s Report) Texas Department of Transportation Annual Financial Report (With
CHICAGO TRANSIT AUTHORITY. FINANCIAL STATEMENTS AND SUPPLEMENTARY INFORMATION December 31, 2011 and 2010 (With Independent Auditors Report Thereon)
") FINANCIAL STATEMENTS AND SUPPLEMENTARY INFORMATION (With Independent Auditors Report Thereon) Chicago, Illinois FINANCIAL STATEMENTS CONTENTS Independent Auditors Report... 1 Management s Discussion and
FINANCIAL STATEMENTS AND SUPPLEMENTARY INFORMATION (With Independent Auditors Report Thereon) Chicago, Illinois FINANCIAL STATEMENTS CONTENTS Independent Auditors Report... 1 Management s Discussion and
DENTON COUNTY TRANSPORTATION AUTHORITY COMPREHENSIVE ANNUAL FINANCIAL REPORT
 COMPREHENSIVE ANNUAL FINANCIAL REPORT FISCAL YEAR ENDED SEPTEMBER 30, 2013 INTRODUCTORY SECTION Transmittal Letter GFOA Certificate of Achievement Organizational Chart List of Principal Officials FINANCIAL
DALLAS AREA RAPID TRANSIT. Quarterly Disclosure Update for the nine-month period ended June 30, 2004
 DALLAS AREA RAPID TRANSIT Quarterly Disclosure Update for the nine-month period ended June 30, 2004 This Quarterly Disclosure Update supplements the information contained in our 2004 Annual Disclosure
CHICAGO TRANSIT AUTHORITY. FINANCIAL STATEMENTS AND SUPPLEMENTARY INFORMATION December 31, 2010 and 2009 (With Independent Auditors Report Thereon)
") FINANCIAL STATEMENTS AND SUPPLEMENTARY INFORMATION (With Independent Auditors Report Thereon) Chicago, Illinois FINANCIAL STATEMENTS CONTENTS Independent Auditors Report... 1 Management s Discussion and
FINANCIAL STATEMENTS AND SUPPLEMENTARY INFORMATION (With Independent Auditors Report Thereon) Chicago, Illinois FINANCIAL STATEMENTS CONTENTS Independent Auditors Report... 1 Management s Discussion and
FORT WORTH TRANSPORTATION AUTHORITY
 FINANCIAL REPORT SEPTEMBER 30, 2010 C O N T E N T S INDEPENDENT AUDITOR'S REPORT... 1 MANAGEMENT'S DISCUSSION AND ANALYSIS... 3 Page BASIC FINANCIAL STATEMENTS Statements of Net Assets... 8 Statements
Report of Independent Auditors and Financial Statements with Supplementary Information June 30, 2017 and 2016
 Report of Independent Auditors and Financial Statements with Supplementary Information June 30, 2017 and 2016 (including Audit Comments and Disclosures Required by State Regulations) Board of Directors
Tri-County Metropolitan Transportation District of Oregon 2014 Annual Report
 Report of Independent Auditors and Financial Statements with Supplementary Information June 30, 2014 and 2013 Board of Directors Name District Bruce Warner, President #1 Joe Esmonde #2 Vacant #3 Consuelo
METROPOLITAN TRANSIT AUTHORITY NASHVILLE, TENNESSEE AUDITED FINANCIAL STATEMENTS AND OTHER FINANCIAL INFORMATION JUNE 30, 2017 AND 2016
 NASHVILLE, TENNESSEE AUDITED FINANCIAL STATEMENTS AND OTHER FINANCIAL INFORMATION JUNE 30, 2017 AND 2016 Table of Contents Page INTRODUCTION... 1-2 INDEPENDENT AUDITOR S REPORT... 3-5 MANAGEMENT S DISCUSSION
SOUTHEASTERN PENNSYLVANIA TRANSPORTATION AUTHORITY. Financial Statements June 30, 2018 and (With Independent Auditors Report Thereon)
") SOUTHEASTERN PENNSYLVANIA TRANSPORTATION AUTHORITY Financial Statements June 30, 2018 and 2017 (With Independent Auditors Report Thereon) SOUTHEASTERN PENNSYLVANIA TRANSPORTATION AUTHORITY YEARS ENDED
SOUTHEASTERN PENNSYLVANIA TRANSPORTATION AUTHORITY Financial Statements June 30, 2018 and 2017 (With Independent Auditors Report Thereon) SOUTHEASTERN PENNSYLVANIA TRANSPORTATION AUTHORITY YEARS ENDED
Central Puget Sound Regional Transit Authority
 Central Puget Sound Regional Transit Authority Single Audit Reports for the Year Ended December 31, 2013 TABLE OF CONTENTS Audited Financial Statements Management s Discussion and Analysis...1 Independent
City of Merced, California
 For the Fiscal Year Ended June 30, 2015 Basic Financial Statements, California Merced, California Annual Financial Report For the year ended June 30, 2015 This page intentionally left blank Annual Financial
DENTON COUNTY TRANSPORTATION AUTHORITY
 DENTON COUNTY TRANSPORTATION AUTHORITY COMPREHENSIVE ANNUAL FINANCIAL REPORT FISCAL YEAR ENDED SEPTEMBER 30, 2016 AS PREPARED BY DCTA FINANCE DEPARTMENT LEWISVILLE, TX DENTON COUNTY TRANSPORTATION AUTHORITY
Central Puget Sound Regional Transit Authority
 Central Puget Sound Regional Transit Authority Single Audit Reports for the Year Ended December 31, 2014 TABLE OF CONTENTS Audited Financial Statements Management s Discussion and Analysis... 1 Independent
DENTON COUNTY TRANSPORTATION AUTHORITY
 COMPREHENSIVE ANNUAL FINANCIAL REPORT FOR THE FISCAL YEAR ENDED SEPTEMBER 30, 2015 AS PREPARED BY: DCTA FINANCE DEPARTMENT LEWISVILLE, TEXAS COMPREHENSIVE ANNUAL FINANCIAL REPORT FOR THE FISCAL YEAR ENDED
Central Puget Sound Regional Transit Authority
 Central Puget Sound Regional Transit Authority Single Audit Reports for the Year Ended December 31, 2017 This page intentionally left blank. TABLE OF CONTENTS Audited Financial Statements Statement of
STATE ROAD AND TOLLWAY AUTHORITY (A Component Unit of the State of Georgia)
") STATE ROAD AND TOLLWAY AUTHORITY (A Component Unit of the State of Georgia) FINANCIAL REPORT FOR THE FISCAL YEAR ENDED JUNE 30, 2012 STATE ROAD AND TOLLWAY AUTHORITY FINANCIAL REPORT JUNE 30, 2012 TABLE
STATE ROAD AND TOLLWAY AUTHORITY (A Component Unit of the State of Georgia) FINANCIAL REPORT FOR THE FISCAL YEAR ENDED JUNE 30, 2012 STATE ROAD AND TOLLWAY AUTHORITY FINANCIAL REPORT JUNE 30, 2012 TABLE
NORTHERN VIRGINIA TRANSPORTATION COMMISSION
 NORTHERN VIRGINIA TRANSPORTATION COMMISSION Financial and Compliance Reports Year Ended June 30, 2018 ASSURANCE, TAX & ADVISORY SERVICES Table of Contents Page Independent Auditor s Report 1-3 Required
ST. CLOUD METROPOLITAN TRANSIT COMMISSION St. Cloud, Minnesota AUDITED FINANCIAL STATEMENTS. For the Year Ended September 30, 2015
 ST. CLOUD METROPOLITAN TRANSIT COMMISSION St. Cloud, Minnesota AUDITED FINANCIAL STATEMENTS For the Year Ended TABLE OF CONTENTS BOARD OF COMMISSIONERS, ADMINISTRATION AND OTHER DATA... 1 INDEPENDENT AUDITOR
SOUTHEASTERN PENNSYLVANIA TRANSPORTATION AUTHORITY. Financial Statements June 30, 2017 and (With Independent Auditors Report Thereon)
") SOUTHEASTERN PENNSYLVANIA TRANSPORTATION AUTHORITY Financial Statements June 30, 2017 and 2016 (With Independent Auditors Report Thereon) SOUTHEASTERN PENNSYLVANIA TRANSPORTATION AUTHORITY YEARS ENDED
SOUTHEASTERN PENNSYLVANIA TRANSPORTATION AUTHORITY Financial Statements June 30, 2017 and 2016 (With Independent Auditors Report Thereon) SOUTHEASTERN PENNSYLVANIA TRANSPORTATION AUTHORITY YEARS ENDED
MONTGOMERY INDEPENDENT SCHOOL DISTRICT
 MONTGOMERY INDEPENDENT SCHOOL DISTRICT COMPREHENSIVE ANNUAL FINANCIAL REPORT FOR THE FISCAL YEAR ENDED AUGUST 31, 2016 PREPARED BY THE MONTGOMERY INDEPENDENT SCHOOL DISTRICT FINANCE DEPARTMENT MONTGOMERY,
Revenue Fund Annual Financial Report For the years ended June 30, 2016 and 2015
 Revenue Fund Annual Financial Report For the years ended June 30, 2016 and 2015 Minnesota State is an affirmative action, equal opportunity employer and educator. REVENUE FUND MINNESOTA STATE COLLEGES
FY 2018 BUSINESS PLAN
 Dallas Area Rapid Transit FY 2018 BUSINESS PLAN Including FY 2018 Annual Budget and Twenty-Year Financial Plan DART BOARD MEMBERS Sue Bauman Dallas Catherine Cuellar Dallas and Cockrell Hill Mark C. Enoch
CITY OF CHEYENNE FINANCIAL & COMPLIANCE REPORT
 CITY OF CHEYENNE FINANCIAL & COMPLIANCE REPORT Cheyenne, Wyoming Year Ended Prepared by City Treasurer s Office This page is intentionally left blank 2 City of Cheyenne Financial and Compliance Report
CITY OF HEALDSBURG HEALDSBURG, CALIFORNIA COMPREHENSIVE ANNUAL FINANCIAL REPORT WITH REPORT ON AUDIT BY INDEPENDENT CERTIFIED PUBLIC ACCOUNTANTS
 HEALDSBURG, CALIFORNIA COMPREHENSIVE ANNUAL FINANCIAL REPORT WITH REPORT ON AUDIT BY INDEPENDENT CERTIFIED PUBLIC ACCOUNTANTS FISCAL YEAR ENDED JUNE 30, 2008 Prepared by the Finance Department COMPREHENSIVE
ROCHESTER-GENESEE REGIONAL TRANSPORTATION AUTHORITY (A Component Unit of the State of New York)
") ROCHESTER-GENESEE REGIONAL TRANSPORTATION AUTHORITY (A Component Unit of the State of New York) Financial Statements as of March 31, 2013 Together with Independent Auditor s Report ROCHESTER-GENESEE REGIONAL
ROCHESTER-GENESEE REGIONAL TRANSPORTATION AUTHORITY (A Component Unit of the State of New York) Financial Statements as of March 31, 2013 Together with Independent Auditor s Report ROCHESTER-GENESEE REGIONAL
TOWN OF JUPITER ISLAND, FLORIDA. Audited Financial Statements And Supplementary Financial Information
 TOWN OF JUPITER ISLAND, FLORIDA Audited Financial Statements And Supplementary Financial Information SEPTEMBER 30, 2013 TOWN OF JUPITER ISLAND, FLORIDA AUDITED FINANCIAL STATEMENTS AND SUPPLEMENTARY FINANCIAL
City of North Chicago, Illinois
 Annual Financial Report Year Ended April 30, 2015 Annual Financial Report Table of Contents For the Year Ended April 30, 2015 Page INDEPENDENT AUDITORS' REPORT 1-3 MANAGEMENT'S DISCUSSION AND ANALYSIS
CHATHAM AREA TRANSIT CHATHAM AREA TRANSIT AUTHORITY FINANCIAL REPORT
 CHATHAM AREA TRANSIT CHATHAM AREA TRANSIT AUTHORITY FINANCIAL REPORT Years Ended June 30, 2017 and 2016 CHATHAM AREA TRANSIT AUTHORITY TABLE OF CONTENTS Pages FINANCIAL SECTION: Independent Auditor s Report
Interurban Transit Partnership
 Single Audit Report Years Ended September 30, 2016 and 2015 The report accompanying these financial statements was issued by BDO USA, LLP, a Delaware limited liability partnership and the U.S. member of
Revenue Fund Annual Financial Report For the years ended June 30, 2017 and 2016
 Revenue Fund Annual Financial Report For the years ended June 30, 2017 and 2016 Minnesota State is an affirmative action, equal opportunity employer and educator. REVENUE FUND MINNESOTA STATE COLLEGES
City of Chicago Chicago Midway International Airport An Enterprise Fund of the City of Chicago
 City of Chicago Chicago Midway International Airport An Enterprise Fund of the City of Chicago Comprehensive Annual Financial Report For the Years Ended December 31, 2017 and 2016 Rahm Emanuel, Mayor Carole
Whatcom Transportation Authority
 Financial Statements Audit Report Whatcom Transportation Authority Whatcom County For the period January 1, 2016 through December 31, 2017 Published April 30, 2018 Report No. 1021200 April 30, 2018 Office
Partial Fiscal Year 2017 Urbanized Area Formula Program (Section 5307) Programs of Projects (POPs)
 Programs of Projects (POPs)") Partial Fiscal Year 2017 Urbanized Area Formula Program (Section 5307) Programs of Projects (POPs) Agency: City of Arlington Service Area: City of Arlington 2017 Purchase Replacement Vehicles Capital $950,000
Partial Fiscal Year 2017 Urbanized Area Formula Program (Section 5307) Programs of Projects (POPs) Agency: City of Arlington Service Area: City of Arlington 2017 Purchase Replacement Vehicles Capital $950,000
THE SUBURBAN BUS DIVISION OF THE REGIONAL TRANSPORTATION AUTHORITY SERVING NORTHEASTERN ILLINOIS
 THE SUBURBAN BUS DIVISION OF THE REGIONAL TRANSPORTATION AUTHORITY SERVING NORTHEASTERN ILLINOIS COMPREHENSIVE ANNUAL FINANCIAL REPORT FOR THE YEAR ENDED DECEMBER 31, 2013 2013 Comprehensive Annual Financial
City of Chicago Department of Water Management Sewer Fund Comprehensive Annual Financial Report For the Year Ended December 31, 2012
 City of Chicago Department of Water Management Sewer Fund Comprehensive Annual Financial Report For the Year Ended December 31, 2012 Rahm Emanuel, Mayor Lois Scott, Chief Financial Officer Amer Ahmad,
City of Bentonville, Arkansas
 Comprehensive Annual Financial Report For the Year Ended December 31, 2016 Prepared by: Denise Land Finance Director Jake Harper Assistant Finance Director Visit our web site at: www.bentonvillear.com
Independent Auditor s Report
 Independent Auditor s Report Board of Education Davis School District Report on the Basic Financial Statements We have audited the accompanying financial statements of the governmental activities, the
DALLAS AREA RAPID TRANSIT
 DALLAS AREA RAPID TRANSIT 2006 Annual Disclosure Statement This 2006 Annual Disclosure Statement replaces our 2005 Annual Disclosure Statement, dated March 22, 2005. This 2006 Annual Disclosure Statement
SAN FRANCISCO MUNICIPAL TRANSPORTATION AGENCY. Financial Statements and Supplemental Schedules. June 30, 2016 and 2015
 Financial Statements and Supplemental Schedules (With Independent Auditors Report Thereon) Table of Contents Page Independent Auditors Report 1 Management s Discussion and Analysis (Unaudited) 4 Financial
City of Elko, Nevada FINANCIAL STATEMENTS FISCAL YEAR ENDED JUNE 30, 2018
 City of Elko, Nevada FINANCIAL STATEMENTS FISCAL YEAR ENDED JUNE 30, 2018 Table of Contents Page FINANCIAL SECTION Independent Auditors Report... 1 Management s Discussion and Analysis... 4 Basic Financial
DALLAS / FORT WORTH DISTRICT
 -2014 STIP STATEWIDE TRANSPORTATION IMPROVEMENT PROGRAM TRANSIT DALLAS / FORT WORTH DISTRICT - 2014 TIP 7-2010 2014 Transportation Improvement Program Chapter VI Public Transportation Services Within North
Borough of East Stroudsburg East Stroudsburg, Pennsylvania Monroe County. Financial Statements Year Ended December 31, 2015
 Borough of East Stroudsburg East Stroudsburg, Pennsylvania Monroe County Financial Statements Year Ended CONTENTS INDEPENDENT AUDITOR'S REPORT 1 MANAGEMENT S DISCUSSION AND ANALYSIS 3 BASIC FINANCIAL STATEMENTS
City of Chicago Department of Water Management Water Fund Comprehensive Annual Financial Report For the Years Ended December 31, 2016 and 2015
 City of Chicago Department of Water Management Water Fund Comprehensive Annual Financial Report For the Years Ended December 31, 2016 and 2015 Rahm Emanuel, Mayor Carole L. Brown, Chief Financial Officer
WESTERN KENTUCKY UNIVERSITY WKYU-TV Bowling Green, Kentucky. FINANCIAL STATEMENTS June 30, 2013 and 2012
 Bowling Green, Kentucky FINANCIAL STATEMENTS Bowling Green, Kentucky FINANCIAL STATEMENTS CONTENTS INDEPENDENT AUDITOR S REPORT... 1 MANAGEMENT S DISCUSSION AND ANALYSIS... 3 BASIC FINANCIAL STATEMENTS
2040 Transit System Plan
 2040 Transit System Plan City of Dallas Transportation and Trinity River Project Committee Briefing April 11, 2016 Agenda Background Plan Development Process Phase 1 - Comprehensive Operations Analysis
Jefferson County Public Transportation Benefit Area (Jefferson Transit Authority)
") Financial Statements and Federal Single Audit Report Jefferson County Public Transportation Benefit Area (Jefferson Transit Authority) For the period January 1, 2015 through December 31, 2015 Published
Financial Statements and Federal Single Audit Report Jefferson County Public Transportation Benefit Area (Jefferson Transit Authority) For the period January 1, 2015 through December 31, 2015 Published
POTOMAC AND RAPPAHANNOCK TRANSPORTATION COMMISSION
 POTOMAC AND RAPPAHANNOCK TRANSPORTATION COMMISSION FINANCIAL AND COMPLIANCE REPORTS YEAR ENDED JUNE 30, 2017 ASSURANCE, TAX & ADVISORY SERVICES TABLE OF CONTENTS FINANCIAL SECTION INDEPENDENT AUDITOR S
Town of Waterford, Connecticut. Annual Financial Report
 Town of Waterford, Connecticut Annual Financial Report Fiscal Year Ended June 30, 2017 Town of Waterford, Connecticut Annual Financial Report Fiscal Year Ended June 30, 2017 Finance Department Contents
Revenue Fund Annual Financial Report For the years ended June 30, 2018 and 2017
 Revenue Fund Annual Financial Report For the years ended June 30, 2018 and 2017 Minnesota State is an affirmative action, equal opportunity employer and educator. REVENUE FUND MINNESOTA STATE COLLEGES
CITY OF RACINE. Racine, Wisconsin FINANCIAL STATEMENTS. Including Independent Auditors' Report. As of and for the Year Ended December 31, 2013
 Racine, Wisconsin FINANCIAL STATEMENTS Including Independent Auditors' Report As of and for the Year Ended December 31, 2013 TABLE OF CONTENTS As of and for the Year Ended December 31, 2013 Independent
MARYLAND TRANSPORTATION AUTHORITY. An Enterprise Fund of the State of Maryland. FINANCIAL STATEMENTS For the Fiscal Year Ended June 30, 2015
 MARYLAND TRANSPORTATION AUTHORITY An Enterprise Fund of the State of Maryland FINANCIAL STATEMENTS For the Fiscal Year Ended TABLE OF CONTENTS PAGE INDEPENDENT AUDITORS REPORT... 1 MANAGEMENT S DISCUSSION
WESTERN KENTUCKY UNIVERSITY Bowling Green, Kentucky
 Bowling Green, Kentucky REPORT ON AUDIT OF INSTITUTION OF HIGHER EDUCATION IN ACCORDANCE WITH UNIFORM GUIDANCE June 30, 2016 Bowling Green, Kentucky REPORT ON AUDIT OF INSTITUTION OF HIGHER EDUCATION IN
City of North Chicago, Illinois
 Annual Financial Report Year Ended Annual Financial Report Table of Contents For the Year Ended Page INDEPENDENT AUDITORS' REPORT 1-3 MANAGEMENT'S DISCUSSION AND ANALYSIS (UNAUDITED) 4-13 BASIC FINANCIAL
AREA METROPOLITAN AMBULANCE AUTHORITY
 AREA METROPOLITAN AMBULANCE AUTHORITY FINANCIAL STATEMENTS AND SUPPLEMENTAL INFORMATION Year ended September 30, 2016 with Report of Independent Auditors AREA METROPOLITAN AMBULANCE AUTHORITY FINANCIAL
Dallas Area Rapid Transit COMMITTEE-OF-THE-WHOLE Tuesday, March 13, 2018, 5:30 P.M. - Conference Room C 1401 Pacific Ave.
 Quorum = 8 Agenda Dallas Area Rapid Transit COMMITTEE-OF-THE-WHOLE Tuesday, March 13, 2018, 5:30 P.M. - Conference Room C 1401 Pacific Ave., Dallas, TX 75202 General Items: 1. Approval of Minutes: February
WESTERN KENTUCKY UNIVERSITY Bowling Green, Kentucky
 Bowling Green, Kentucky REPORT ON AUDIT OF INSTITUTION OF HIGHER EDUCATION IN ACCORDANCE WITH UNIFORM GUIDANCE June 30, 2018 Bowling Green, Kentucky REPORT ON AUDIT OF INSTITUTION OF HIGHER EDUCATION IN
Clay County, Florida. County Audit Report September 30, 2014
 Clay County, Florida County Audit Report September 30, 2014 Clay County, Florida County Audit Report September 30, 2014 Table of Contents Section Financial Report 1 County-Wide 3 Clerk of the Circuit Court
Report of Independent Auditors and Financial Statements with Supplementary Information June 30, 2016 and 2015
 Report of Independent Auditors and Financial Statements with Supplementary Information and 2015 Board of Directors Name District Bruce Warner, President #1 Joe Esmonde #2 Vacant #3 Lori Irish Bauman #4
TEX Rail Fort Worth, Texas Project Development (Rating Assigned November 2012)
") TEX Rail Fort Worth, Texas Project Development (Rating Assigned November 2012) Summary Description Proposed Project: Commuter Rail 37.6 Miles, 14 Stations (12 new, two existing) Total Capital Cost ($YOE):
TEX Rail Fort Worth, Texas Project Development (Rating Assigned November 2012) Summary Description Proposed Project: Commuter Rail 37.6 Miles, 14 Stations (12 new, two existing) Total Capital Cost ($YOE):
FRIENDSWOOD INDEPENDENT SCHOOL DISTRICT
 FRIENDSWOOD INDEPENDENT SCHOOL DISTRICT ANNUAL FINANCIAL AND COMPLIANCE REPORT For The Year Ended August 31, 2018 FRIENDSWOOD INDEPENDENT SCHOOL DISTRICT TABLE OF CONTENTS Certificate of Board Page i
FOREST PRESERVE DISTRICT OF DuPAGE COUNTY, ILLINOIS COMPREHENSIVE ANNUAL FINANCIAL REPORT
 FOREST PRESERVE DISTRICT OF DuPAGE COUNTY, ILLINOIS COMPREHENSIVE ANNUAL FINANCIAL REPORT FOR THE FISCAL YEAR ENDED JUNE 30, 2015 FOREST PRESERVE DISTRICT OF DUPAGE COUNTY, ILLINOIS COMPREHENSIVE ANNUAL
SAN PERLITA INDEPENDENT SCHOOL DISTRICT
 SAN PERLITA INDEPENDENT SCHOOL DISTRICT ANNUAL FINANCIAL REPORT AND COMPLIANCE REPORT JUNE 30, 2018 Board of Trustees June 30, 2018 TRUSTEES Melissa Guadiana President Nora Vasquez Vice President Maggie
CITY OF SOUTH GATE, CALIFORNIA COMPREHENSIVE ANNUAL FINANCIAL REPORT JUNE 30, 2014
 , CALIFORNIA COMPREHENSIVE ANNUAL FINANCIAL REPORT JUNE 30, 2014 , CALIFORNIA COMPREHENSIVE ANNUAL FINANCIAL REPORT JUNE 30, 2014 PREPARED BY: DEPARTMENT OF FINANCE THIS PAGE INTENTIONALLY LEFT BLANK COMPREHENSIVE
City of Sachse, Texas As Prepared by The Finance Department
 COMPREHENSIVE ANNUAL FINANCIAL REPORT Fiscal Year Ended September 30, 2017 City of Sachse, Texas As Prepared by The Finance Department Sachse is a tranquil community welcoming the future while offering
VILLAGE CENTER COMMUNITY DEVELOPMENT DISTRICT. Basic Financial Statements. September 30, (With Independent Auditors Report Thereon)
") Basic Financial Statements (With Independent Auditors Report Thereon) Table of Contents Financial Section Independent Auditors Report on the Financial Statements 1 Management s Discussion and Analysis
Basic Financial Statements (With Independent Auditors Report Thereon) Table of Contents Financial Section Independent Auditors Report on the Financial Statements 1 Management s Discussion and Analysis
MUSTANG SPECIAL UTILITY DISTRICT
 MUSTANG SPECIAL UTILITY DISTRICT of Denton County, Texas COMPREHENSIVE ANNUAL FINANCIAL REPORT FOR THE FISCAL YEAR ENDED SEPTEMBER 30, 2016 General Manager Chris Boyd Finance Director Patty Parks MUSTANG
CITY OF CHARLESTON, ILLINOIS. FINANCIAL STATEMENTS For the Year Ended April 30, 2015
 FINANCIAL STATEMENTS For the Year Ended April 30, 2015 TABLE OF CONTENTS Page No. INDEPENDENT AUDITOR'S REPORT... 1 INDEPENDENT AUDITOR'S REPORT ON INTERNAL CONTROL OVER FINANCIAL REPORTING AND ON COMPLIANCE
Comprehensive Annual Financial Report
 Comprehensive Annual Financial Report For the Year Ended September 30, 2015 Capital Metropolitan Transportation Authority 2910 E. 5th Street Austin, Texas 78702 2 COMPREHENSIVE ANNUAL FINANCIAL REPORT
Tri-County Metropolitan Transportation District of Oregon 2013 Annual Report
 Report of Independent Auditors and Financial Statements with Supplementary Information June 30, 2013 and 2012 Board of Directors Name District Bruce Warner, President #1 Tiffany Sweitzer, Vice President
VILLAGE OF FOREST PARK, ILLINOIS. ANNUAL FINANCIAL REPORT Year Ended April 30, 2013
 ANNUAL FINANCIAL REPORT ANNUAL FINANCIAL REPORT CONTENTS Independent Auditor s Report... 1 REQUIRED SUPPLEMENTARY INFORMATION: Management s Discussion and Analysis... 3 BASIC FINANCIAL STATEMENTS: Government-wide
Minnesota State Colleges & Universities
 This document is made available electronically by the Minnesota Legislative Reference Library as part of an ongoing digital archiving project. http://www.leg.state.mn.us/lrl/lrl.asp Minnesota State Colleges
St. Cloud Metropolitan Transit Commission St. Cloud, Minnesota. Financial Statements. September 30, 2016
 St. Cloud Metropolitan Transit Commission St. Cloud, Minnesota Financial Statements September 30, 2016 Table of Contents Board of Commissioners, Administration and Other Data 1 Independent Auditor's Report
Eden Prairie, Minnesota
 Comprehensive Annual Financial Report For the Fiscal Year Ended December 31, 2017 SOUTHWEST TRANSIT Comprehensive Annual Financial Report For the Year Ended December 31, 2017 Mission Statement SouthWest
Comprehensive Annual Financial Report. Fiscal Year Ended June 30, 2017
 Comprehensive Annual Financial Report Fiscal Year Ended June 30, 2017 CITY OF COVINGTON, GEORGIA COMPREHENSIVE ANNUAL FINANCIAL REPORT FOR THE FISCAL YEAR ENDED JUNE 30, 2017 Prepared by: Randy Smith,
City of North Chicago, Illinois
 Annual Financial Report Year Ended Annual Financial Report Table of Contents For the Year Ended Page INDEPENDENT AUDITORS' REPORT 1-3 MANAGEMENT'S DISCUSSION AND ANALYSIS (UNAUDITED) 4-12 BASIC FINANCIAL
St. Cloud Metropolitan Transit Commission St. Cloud, Minnesota. Financial Statements. September 30, 2017
 St. Cloud Metropolitan Transit Commission St. Cloud, Minnesota Financial Statements September 30, 2017 Table of Contents Board of Commissioners, Administration, and Other Data 1 Independent Auditor's Report
City of Grand Ledge. FINANCIAL STATEMENTS (With Required Supplementary Information) June 30, 2018
 June 30, 2018") FINANCIAL STATEMENTS (With Required Supplementary Information) TABLE OF CONTENTS Page INDEPENDENT AUDITOR S REPORT MANAGEMENT S DISCUSSION AND ANALYSIS i-iii iv-x BASIC FINANCIAL STATEMENTS Government-wide
FINANCIAL STATEMENTS (With Required Supplementary Information) TABLE OF CONTENTS Page INDEPENDENT AUDITOR S REPORT MANAGEMENT S DISCUSSION AND ANALYSIS i-iii iv-x BASIC FINANCIAL STATEMENTS Government-wide
SCHAUMBURG PARK DISTRICT, ILLINOIS COMPREHENSIVE ANNUAL FINANCIAL REPORT
 SCHAUMBURG PARK DISTRICT, ILLINOIS COMPREHENSIVE ANNUAL FINANCIAL REPORT FOR THE FISCAL YEAR ENDED MARCH 31, 2017 COMPREHENSIVE ANNUAL FINANCIAL REPORT FOR THE FISCAL YEAR ENDED MARCH 31, 2017 Prepared
NIAGARA FRONTIER TRANSPORTATION AUTHORITY (A Component Unit of the State of New York) FINANCIAL STATEMENTS. MARCH 31, 2018 and 2017
 FINANCIAL STATEMENTS. MARCH 31, 2018 and 2017") NIAGARA FRONTIER TRANSPORTATION AUTHORITY FINANCIAL STATEMENTS MARCH 31, 2018 and 2017 Table of Contents Page Independent Auditors Report 1 Management Certification: Management s Certification of the Financial
NIAGARA FRONTIER TRANSPORTATION AUTHORITY FINANCIAL STATEMENTS MARCH 31, 2018 and 2017 Table of Contents Page Independent Auditors Report 1 Management Certification: Management s Certification of the Financial
Comprehensive Annual Financial Report. City of Medford Oregon
 Comprehensive Annual Financial Report City of Medford Oregon For the Fiscal Year Ended June 30, 2015 , OREGON COMPREHENSIVE ANNUAL FINANCIAL REPORT FOR THE FISCAL YEAR ENDED JUNE 30, 2015 Prepared by:
METROPOLITAN ATLANTA RAPID TRANSIT AUTHORITY FINANCIAL STATEMENTS AND SUPPLEMENTAL SCHEDULE. And. Independent Auditors Report
 FINANCIAL STATEMENTS AND SUPPLEMENTAL SCHEDULE And Independent Auditors Report TABLE OF CONTENTS INDEPENDENT AUDITORS REPORT... 1-2 MANAGEMENT S DISCUSSION AND ANALYSIS... 3-9 FINANCIAL STATEMENTS Statements
City of Niles Berrien County, Michigan FINANCIAL STATEMENTS. September 30, 2012
 Berrien County, Michigan FINANCIAL STATEMENTS September 30, 2012 TABLE OF CONTENTS September 30, 2012 Page INDEPENDENT AUDITOR S REPORT MANAGEMENT S DISCUSSION AND ANALYSIS i-ii iii-xi BASIC FINANCIAL
BUCKEYE ELEMENTARY SCHOOL DISTRICT NO. 33
 BUCKEYE ELEMENTARY SCHOOL DISTRICT NO. 33 Comprehensive Annual Financial Report Fiscal Year Ended June 30, 2016 25555 West Durango Street Buckeye, Arizona 85326 BUCKEYE, ARIZONA COMPREHENSIVE ANNUAL FINANCIAL
FINANCIAL STATEMENTS. Rochester Genesee Regional Transportation Authority FOR THE YEARS ENDED MARCH 31, 2014 AND 2013
 Rochester Genesee Regional Transportation Authority FINANCIAL STATEMENTS FOR THE YEARS ENDED MARCH 31, 2014 AND 2013 A Component Unit of the State of New York ROCHESTER-GENESEE REGIONAL TRANSPORTATION
GEORGETOWN INDEPENDENT SCHOOL DISTRICT. Annual Financial Report for the Fiscal Year Ended June 30, 2015
 GEORGETOWN INDEPENDENT SCHOOL DISTRICT Annual Financial Report for the Fiscal Year Ended June 30, 2015 GEORGETOWN INDEPENDENT SCHOOL DISTRICT Annual Financial Report Year Ended June 30, 2015 Table of Contents
Texas Department of Transportation
 ANNUAL FINANCIAL REPORT Texas Department of Transportation (With Independent Auditor s Report) For the Fiscal Year Ended August 31, 2016 Texas Department of Transportation Annual Financial Report (With