Prepared for: Pennsylvania Utility Law Project (PULP) Harry Geller, Executive Director
|
|
|
- Cornelius Garrett
- 5 years ago
- Views:
Transcription
1 Section 8 Utility Allowances and Changes in Home Energy Prices In Pennsylvania January 2011 Prepared for: Pennsylvania Utility Law Project (PULP) Harry Geller, Executive Director Prepared by: Roger D. Colton Fisher, Sheehan & Colton Public Finance and General Economics Belmont, MA
2 Section 8 Utility Allowances and Changes in Home Energy Prices In Pennsylvania Prepared for: Pennsylvania Utility Law Project (PULP) Harry Geller, Executive Director The information and opinions presented in this report are exclusively the responsibility of the author and do not necessarily represent the opinions of the Public Utility Law Project (PULP) or any employee thereof. January 2011
3 TABLE OF CONTENTS Table of Contents... i Executive Summary... iii The Income Status of Section 8 Tenants... iv Changes in Utility Allowances vs. Changes in Utility Prices... vi Changes in Utility Allowances vs. 10%+ Changes in Utility Prices... vii SEMAP and Section 8 Utility Allowances in Pennsylvania.... viii Summary and Conclusions... xi Introduction... 1 An Overview of Section 8 Utility Allowances... 1 Energy Usage Characteristics of Assisted Housing Units... 2 Part 1: An Overview of Section 8 Voucher Housing in Pennsylvania... 6 Relative Income: Distribution by Congressional District... 8 Absolute Income: Distribution by Congressional District... 9 Part 2: Utility Allowances Relative to Utility Bills in Pennsylvania Direction of Changes in Utility Allowances when Energy Bills Increased Changes in Natural Gas Heating Bills Changes in Electric Heating Bills Changes in Electric NonHeating Bills Changes in Utility Allowances Relative to 10% Change in Energy Price % Change in Natural Gas Heating Bills % Change in Electric Heating Bills % Change in Electric NonHeating Bills Ratio of 1Year Change in Utility Allowances to 1Year Change in Energy Prices Year Change in Natural Gas Heating Utility Allowances to 1Year Change in Natural Gas Heating Bills Year Change in Electric Heating Utility Allowances to 1Year Change in Electric Heating Bills Page i
4 1Year Change in Electric NonHeating Utility Allowances to 1Year Change in Electric NonHeating Bills Ratio of 2Year Change in Utility Allowances to 2Year Change in Energy Prices Year Change in Natural Gas Heating Utility Allowances to 2Year Change in Natural Gas Heating Bills Year Change in Electric Heating Utility Allowances to 2Year Change in Electric Heating Bills Year Change in Electric NonHeating Utility Allowances to 2Year Change in Electric NonHeating Bills LongTerm Lack of Change in Utility Allowances Part 3: HUD S Annual SEMAP Reviews of The LHA SEMAP Process The HUD SEMAP Process The HUD SEMAP Review of Natural Gas Space Heating Utility Allowances and SEMAP Ratings Electric Space Heating Utility Allowances and SEMAP Ratings Summary and Conclusions Part 4: Findings and Conclusions Part 5: Recommendations Appendix A: Pennsylvania Housing Authorities Providing Utility Allowance Schedules Upon Request Appendix B: Pennsylvania Housing Authorities Either Unwilling or Unable to Provide Utility Allowance Schedules upon Request Appendix C: Public Records Request to and Response From Philadelphia HUD Office Regarding SEMAP Ratings Appendix D: Public Records Request to and Response From Pittsburgh HUD Office Regarding SEMAP Ratings Page ii
5 EXECUTIVE SUMMARY This report examines Section 8 utility allowances in Pennsylvania. Section 8 is a federal housing subsidy program for lowincome renters. Through the largest component of the program, involving the most units of housing, Section 8 provides housing vouchers to participating tenants. Those tenants use their Section 8 vouchers to find housing in the private market. Within certain limits not relevant to this discussion, Section 8 tenants pay 30% of their income toward their contract rent. The difference between their full contract rent and this percentage of income payment represents the housing subsidy paid by the Section 8 program. In addition to the housing subsidy, Section 8 tenants receive what is termed a utility allowance each month (assuming the tenant pays his or her own utility costs). The utility allowance is designed to cover the tenant s entire utility bill. Rather than being simply a heating allowance, in other words, a utility allowance is designed to pay for all utilities (energy, water/sewer, trash) except telephone service. Since by law the tenant s total shelter expenses (which are to include contract rent plus all utilities except telephone) are to be limited to 30% of income, and since the household s contract rent is set equal to 30% of income, in order for the Section 8 program to comply with the federal statute, the utility allowance must pay a tenant s entire utility bill to keep total shelter costs under the statutory ceiling. Providing adequate utility allowances to Section 8 housing units is particularly important in Pennsylvania given the age and relative energy inefficiency of assisted housing units. The age of housing structures subsidized through an assisted housing program reveals an older housing stock that is likely to be energy inefficient. Roughly half of all assisted housing is 60 years old Page iii
6 or older, while more than 60% is at least 50 years old. Very few assisted housing units have been built in the past 25 years. Corresponding to the age of the housing unit is the age of the heating unit. A substantial proportion of assisted housing tenants do not know the age of their heating unit. Of those who do know, however, the number of heating units aged 20 years or older was by far the largest proportion of heating units by age. Indeed, the number of heating units aged 20 years or older is nearly twice the number of heating units aged 10 years or younger. Similar results exist for domestic hot water heaters. While a sizable proportion of assisted housing tenants do not know the age of their water heater (or do not use a separate water heater for their unit), nearly onein seven of the total assisted housing tenants report having water heaters age 10years old or older. The need for adequate utility allowances is particularly important in Pennsylvania s Section 8 housing. While direct information on the energy efficiency of existing systems is not available for Section 8 housing, the extent to which tenants of assisted housing are vulnerable to changes in prices can nonetheless be reasonably inferred from the data that is available. In particular, the age of the building structure, the age of the heating system, and the age of the hot water system used in Section 8 housing makes clear the risk of uncompensated bills if utility allowances are not set to appropriately reflect underlying energy prices. Moreover, the risk of uncompensated bills is significant if utility allowances are not appropriately updated to track changes in prices over time. The Income Status of Section 8 Tenants. Section 8 housing serves some of the lowest income households in the State of Pennsylvania. Income is examined from three perspectives. First, the discussion below disaggregates income by the three categories used by the U.S. Department of Housing and Urban Development (HUD) in its housing programs. Under HUD s system of income categorization: Extremely lowincome refers to households with income at or below 30% of area median income (AMI); Very lowincome refers to households with income above 30% of AMI but at or below 50%; Lowincome refers to households with income above 50% of AMI but at or below 80%. Pennsylvania s Section 8 tenants are overwhelmingly extremely lowincome households (with income at or below 30% of AMI). The categorization of Section 8 tenants relative to area median income is an important indicator of how poor these tenants are. It is generally the case that Page iv
7 area median income reasonably reflects the costofliving in a specified geographic region. If the cost of living is higher in one area, the area median income tends to be higher as well. Using Congressional districts as the mechanism to distribute Section 8 tenants geographically, the analysis finds that in all but two of Pennsylvania s 19 Congressional districts, between 90% and 100% of Section 8 tenants were either extremely lowincome (at or below 30% of AMI) or very lowincome (at or below 50% of AMI but greater than 30%). The highest income Section 8 tenants statewide in Pennsylvania, in other words, nonetheless live with incomes less than half of area median income. Second, aside from this relative measure of income, the dollars of income provide an absolute measure of lowincome status. The dollar income of Pennsylvania s Section 8 tenants tends to be just over $10,000, supporting average household sizes of between two and three persons. The average income of Section 8 tenants in Pennsylvania ranges from a low of $10,500 to a high of $15,370. In 13 of Pennsylvania s 19 Congressional districts, average annual income for Section 8 tenants was less than $13,000. Third, looking only at dollar incomes does not fully capture the lowincome status of tenants living in Pennsylvania s Section 8 housing. Household size in Section 8 units, by Congressional districts, ranges between 1.9 and 3.2 persons per household. Household size is an important factor to consider as a corollary of income. A threeperson household with an income of $10,000 is considered to be poorer than a twoperson household with an income of $10,000. This impact of household size is reflected in the Federal Poverty Level. Poverty Level sets out income as a function of household size. 1 Pennsylvania s Section 8 tenants, on average, have income well below the Federal Poverty Level. In only one Congressional district did the average annual income of Section 8 tenants approach 100% of the Federal Poverty Level. In virtually every other Congressional district, the average annual income of Section 8 tenants placed them between 70% and 80% of the Poverty Level. The significance of the lowincome status of Section 8 tenants is severalfold. By the very nature of their poverty, Section 8 tenants do not have access to high quality housing. While housing units that are subsidized by the federal Section 8 program must comply with certain federallyprescribed minimum Housing Quality Standards (HQSs), the units nonetheless tend to be older and lower quality (even if meeting minimum HQSs). Despite this lower quality housing, for reasons relating to the very fact of their poverty, Section 8 tenants do not have the financial capacity to improve the quality of their housing. Accordingly, if Section 8 utility allowances are not adequately set and updated, usage reduction is not reasonably available as a mechanism to protect against unaffordable home energy bills. 1 The 2009 Federal Poverty Level for a twoperson household was $14,570; the 2009 Federal Poverty Level for a threeperson household was $18,310. Page v
8 Changes in Utility Allowances vs. Changes in Utility Prices The analysis below examines utility allowances promulgated by Local Housing Authorities (LHAs) throughout Pennsylvania for the four years 2006 through 2009 inclusive. A list of the Pennsylvania LHAs was obtained from the U.S. Department of Housing and Urban Development (HUD). In May 2009, a written request was submitted to the Executive Director of each LHA, pursuant to Pennsylvania s Public Records Act, asking for a single written copy of all utility allowance schedules for either Section 8 or Public Housing units, or both, as applicable, in effect for Fiscal Years 2006, 2007, 2008 and 2009 inclusive. 2 Sixty (60) LHAs responded to the public records request. The data provided by these LHAs documents that Pennsylvania housing authorities frequently failed to adjust their utility allowances in years in which home energy bills increased. Data was first examined with respect to the direction of change in the utility allowance in those instances where the energy bill increased from one year to the next. In the light of an increased utility bill, the utility allowances could remain the same, increase or decrease. Natural gas space heating: Pennsylvania s Local Housing Authorities did not consistently respond to higher natural gas heating bills with increased natural gas heating utility allowances. Matched with the 246 instances of increased natural gas prices were only 148 corresponding instances of increased natural gas heating utility allowances (60%). 3 In contrast, a substantial proportion of increased natural gas prices were met with a lower utility allowance. Oneinfive instances (19%) of increased natural gas heating prices were associated with a decreased natural gas heating utility allowance. A roughly equal proportion (21%) of instances of increased natural gas bills were matched with utility allowances that remained identical to the preceding year with lower utility bills. Electric Space heating: Pennsylvania s Local Housing Authorities increased their utility allowances in response to higher electric heating prices at about the same rate as they increased their natural gas heating utility allowances. In only 60% of the 355 instances of higher electric heating prices, Pennsylvania s LHAs also implemented higher electric heating utility allowances. That does not mean, however, that electric heating tenants faced identical LHA responses to increased electric prices. Only half as many electric space heating utility allowances decreased (11%) in the face of increasing electric prices as did natural gas utility allowances in light of increased natural gas prices (19%). Substantially more electric heating utility allowances remained constant than did natural gas utility allowances. In nearly threeoften instances of increased electric heating prices (29%), electric space heating utility allowances remained identical to the preceding year. 2 Some Local Housing Authorities administer Section 8 units but not public housing units. Some Local Housing Authorities administer public housing units but not Section 8 units. 3 Each instance involves both a year and a housing type. Since three housing types were selected for each Local Housing Authority studied, each Local Housing Authority could provide three instances per year. Page vi
9 Electric nonheating: Annual changes in electric nonheating utility allowances, in light of corresponding increases in bills for nonheating electricity usage, mirrored the treatment of space heating bills. In the three comparison study periods, electric nonheating bills increased in 355 instances. Pennsylvania s LHAs, however, increased their utility allowances for miscellaneous electric usage (generally referred to as other electric usage), in only three of every five instances where electric nonheating bills increased. 4 In contrast, it was uncommon for electric utility allowances to decrease when nonheating electric bills were escalating. Such decreases occurred in only six percent (6%) of all instances of increased bills. In 120 instances of increased bills (34%), utility allowances for other electric use remained the same from one year to the next even though the underlying nonheating electric bills increased. Changes in Utility Allowances vs. 10%+ Changes in Utility Prices Unlike the section above, which considered only the direction of change in utility allowances and energy prices, the discussion below considers changes in utility allowances promulgated by Pennsylvania s Local Housing Authorities while also accounting for the magnitude of the change in the underlying home energy bill. While the discussion above considers whether utility allowances changed at all (of any magnitude, up or down) to reflect a change (of any magnitude) in home energy bills, this section considers the change in utility allowances limited to those years in which the underlying bill increased by 10% or more relative to the immediately preceding year. 5 The ten percent figure has legal significance. Under HUD regulations, a Local Housing Authority is required to revise its Section 8 utility allowances whenever the underlying utility prices have changed by 10% or more, retroactive to the date of the change in prices. 6 The discussion below considers the direction of change, if any, in the utility allowance in those instances where the 10% price threshold was met in the study years of 2006 through As above, the discussion at this point does not consider the magnitude of the change, if any, in the utility allowance, merely the direction of change. 4 Other electric usage stands in contrast to electric space heating and electric water heating. Other electric use involves appliances, which also includes lighting and refrigeration. 5 For example, if the 2009 natural gas heating prices were 10% higher than the 2008 natural gas heating prices, this section considers whether the corresponding 2009 natural gas heating utility allowance was higher or lower than the 2008 natural gas heating utility allowance. 6 According to HUD regulations, a PHA must review its schedule of utility allowances each year, and must revise its allowance if there has been a change of 10 percent or more in the utility rate since the last time the utility allowance schedule was revised. 24 CFR (b)(4) (2009). Moreover, the Housing Authority s SEMAP Rating is supposed to be based in part on whether the PHA s SEMAP certification states that the PHA reviewed utility rate data within the last 12 months and adjusted its utility allowance schedule if there has been a change of 10 percent or more in a utility rate since the last time the utility allowance schedule was revised. 24 CFR 985.3(d) (2009). Page vii
10 Natural gas space heating: Pennsylvania LHAs frequently failed to modify their utility allowances in years in which the underlying utility rates increased by 10% or more. In 77 instances from 2006 to 2009, natural gas prices increased by 10% or more from the preceding year. When natural gas heating bills increased by 10% or more in a given year, utility allowances were also increased in only 60% of the cases. When natural gas heating utility allowances did not increase in response to 10% increases in natural gas prices, the number of instances when utility allowances remained identical outnumbered those instances where allowances actually decreased in response to increasing bills by a twotoone ratio. In 21 instances (27%), the utility allowance remained the same in light of an increase in natural gas space heating prices. In 10 instances (13%), the utility allowance decreased in light of an increase in natural gas space heating prices of 10% or more. Electric space heating: Changes in electric space heating utility allowances relative to 10% changes in the underlying electricity bill closely mirrored changes in natural gas heating allowances and bills. A nearly identical proportion of electric space heating utility allowances (61%) increased in those instances where electric space heating bills increased by 10% or more. Roughly onethird of utility allowances stayed the same (31%) when the corresponding electric heating bill increased by at least 10%. Proportionately, somewhat fewer electric space heating utility allowances decreased (8%) when electric heating bills increased. Electric nonspace heating: Pennsylvania s LHAs were much more likely to make no change in electric nonheating utility allowances, 7 even when the underlying electric bill increased by 10% or more. A noticeably smaller proportion (51%) of electric nonheating utility allowances increased when the underlying bill increased by 10% or more. Moreover, the proportion of utility allowances that stayed constant in light of increasing electric nonheating bills was substantially greater (46%). It is not the case that LHAs were more likely (or even as likely) to reduce their utility allowances in light of increasing prices for electric nonheating consumption. The difference in LHA behavior involved the propensity of LHAs to do nothing, even when electric nonheating prices increased by 10% or more. While there were fewer overall instances of increased electric nonheating prices of 10% or more, in nearly half of those instances with price increases, the corresponding utility allowance remained identical to the prior year. SEMAP and Section 8 Utility Allowances in Pennsylvania. The discussion below examines how HUD s Section 8 Management Assessment Program (SEMAP) was used to monitor the compliance by Pennsylvania s Local Housing Authorities (LHA) with federal regulations regarding the promulgation of utility allowances. The purpose of SEMAP is to assess whether the Section 8 tenantbased assistance programs operate to help eligible families afford decent rental units at the correct subsidy cost. SEMAP identifies 14 key 7 As noted above, nonheating usage does not include domestic hot water consumption. Page viii
11 indicators through which to measure LHA performance. Indicator #4 is to report whether the LHA maintains a current schedule of allowances for tenant utility costs. The SEMAP utility allowance indicator allows for no ambiguity. The SEMAP rating is based on whether: The PHA s certification states that the PHA reviewed utility rate data within the last 12 months and adjusted its utility allowance schedule if there has been a change of 10 percent or more in a utility rate since the last time the utility allowance schedule was revised. 8 The SEMAP utility allowance indicator is an either/or proposition. If the LHA has made a review within the past twelve months and adjusted its utility allowances, it receives a full SEMAP score of five (5) points; if it has not, it receives a SEMAP rating of 0 points. The SEMAP rating is based initially on an annual selfcertification by the local LHA to HUD. Each local LHA distributing $300,000 or more in tenant assistance must submit a SEMAP certification form within 60 days after the end of its fiscal year. The certification must be approved by a resolution of the LHA s board of directors (or board of commissioners) and signed by both the LHA board chair and the LHA executive director, unless the LHA is a unit of local government or a state. In that instance, no resolution is needed, but the LHA certification must be signed by the chief executive officer of the unit of government (or his/her designee) and the Section 8 program director. HUD verifies the LHA s certification by comparing the LHA s independent audit to the SEMAP certification. LHAs are required to submit independent audits under the Single Audit Act. A SEMAP score based on an LHA s certification will be subject to change based on HUD s review of the LHA s annual audit. A review of the SEMAP ratings for the years 2006 through 2009 inclusive reveals that HUD gave no SEMAP rating of 0 to a Pennsylvania LHA in that fouryear period for SEMAP Indicator #4, the SEMAP indicator involving utility allowances. Since SEMAP ratings for Indicator #4 are either/or propositions (i.e., either the LHA has reviewed utility data and made adjustments to its utility allowances where appropriate, thus receiving a SEMAP rating of 5, or it has not, thus receiving a SEMAP rating of 0, for Indicator #4), by necessary implication, the full SEMAP rating given to Pennsylvania LHAs further indicates that: HUD found that each Pennsylvania LHA submitted a resolution passed by the LHA board indicating the LHA s compliance with SEMAP Indicator #4 for all four years ( inclusive); 8 24 CFR 985.3(d)(3)(i). Page ix
12 HUD found that each Pennsylvania LHA certified to HUD, signed by the LHA board chair and executive director, its compliance with SEMAP Indicator #4 for all four years ( inclusive); Each Independent Auditor provided an independent basis to HUD upon which HUD could verify each LHA s full compliance with SEMAP Indicator #4 for all four years ( inclusive). A review of the data places the accuracy of these Pennsylvania SEMAP findings and certifications in doubt. The fact that full SEMAP scores were given to all Pennsylvania LHAs for all four years calls into question the viability and legitimacy of the SEMAP process and HUD s administration of that process in Pennsylvania. Natural gas heating: A review of changes in natural gas heating allowances reveals that numerous Local Housing Authorities in Pennsylvania received positive SEMAP ratings even when the natural gas utility allowances of those LHAs were not modified to reflect increases in the underlying natural gas heating bills. Over the study period, eight of the 59 LHAs providing data used in this examination maintained a constant natural gas heating utility allowance notwithstanding the fact that the corresponding natural gas bill increased by 10% or more in the same time period. Other Local Housing Authorities did not merely keep their utility allowances constant, but reduced their natural gas heating utility allowances in years when natural gas heating prices increased. Four housing authorities received a positive SEMAP rating for having reviewed their utility allowances in light of utility data and made appropriate adjustments even though their natural gas heating utility allowances were decreased in a year that natural gas heating prices increased by more than 10%. In sum, the SEMAP process did not accurately identify Pennsylvania LHAs who failed to review actual utility data and make appropriate adjustments to their Section 8 utility allowances when the corresponding natural gas prices were increasing. Out of the 59 Pennsylvania LHAs providing data, 12 (20%) either maintained an identical natural gas heating utility allowance or reduced their utility allowance in years in which the corresponding natural gas heating bill increased by more than 10%. Despite this, in each year, each LHA received a positive SEMAP rating for the utility allowance indicator. Electric space heating: Pennsylvania s LHAs were more likely to maintain a constant utility allowance for electric heating units in light of increasing electric space heating bills than they were for natural gas space heating bills. Nine of the 59 LHAs studied kept their electric space heating utility allowances constant even while electric space heating bills were increasing. As with the natural gas utility allowances, an additional group of four LHAs did not merely keep their electric space heating utility allowances constant, but reduced their utility allowances in years when the corresponding electric space heating prices increased by 10% or more. Page x
13 Overall, the SEMAP ratings given to Pennsylvania LHAs on the utility allowance SEMAP indicator (Indicator #4) routinely failed to accurately reflect whether local housing authorities performed adequately in reviewing and adjusting utility allowances. Of the 59 LHAs studied from 2006 to 2009, four (4) received positive SEMAP ratings in all years, even though neither their natural gas nor their electric space heating utility allowances reflected the direction of change in the corresponding home energy bills. In each of these four instances, while the home energy bill (natural gas heating, electric space heating) increased by more than 10%, both the natural gas and electric space heating utility allowances either remained constant or decreased. In an additional 17 instances, the LHA received a positive SEMAP rating even though either its natural gas space heating utility allowance or its electric space heating utility allowance (but not both) failed to reflect changes in the corresponding home energy prices. In sum, overall, more than oneofthree housing authorities (21 of 59) received a positive SEMAP rating even when the LHA maintained a constant, or implemented a reduced, utility allowance in years when the corresponding energy bills increased by 10% or more. This figure does not include either: (1) LHAs that increased their utility allowances at a rate less than the corresponding energy bill increased; or (2) reduced their utility allowances in a year when energy prices increased, but increased by less than 10%. Summary and Conclusions Utility allowances for Section 8 tenants represent a critical source of energy assistance to some of Pennsylvania s lowest income households. Section 8 tenants in Pennsylvania tend to live with income considerably below the Federal Poverty Level. In dollar terms, incomes are below $10,000 a year in a substantial majority of cases. For these lowincome households, unless utility allowances are properly set (and maintained), shelter costs will routinely exceed the statutory affordability standard of 30% of income. Pennsylvania s Local Housing Authorities (LHAs) routinely fail to adjust their home energy utility allowances when the underlying home energy bills escalate. Whether for natural gas space heating, electric space heating, or miscellaneous electric usage, changes in home energy bills are not reflected in changes in utility allowances. This conclusion flows from a multifaceted review of utility allowances and home energy bills over a four year period ( ). The HUD process charged with enforcing LHA requirements designed to maintain adequate utility allowances is a failure. Over the four year period 2006 through 2009, not one Pennsylvania LHA received a rating indicating a failure to comply with federal Section 8 utility allowance regulations. The HUD finding of 100% compliance came in the Section 8 Management Assessment Program (SEMAP) which, by law, is designed to assess whether the Section 8 tenantbased assistance programs operate to help eligible families afford decent rental units at the correct subsidy cost. Page xi
14 HUD s finding of 100% compliance with SEMAP Rating #4, relating to utility allowances, despite the routine failure of Pennsylvania LHAs to appropriately adjust their home energy utility allowances, calls into question both the efficacy of the SEMAP selfcertification process and the efficacy of the HUD review of that selfcertification. Overall, the utility allowance program in Pennsylvania needs significant reform. It is not doing what the law, on its face, requires to be done. Page xii
15 INTRODUCTION Section 8 is a federal housing subsidy program. Through the largest component of the program, involving the most units of housing, Section 8 provides housing vouchers to participating tenants. Those tenants use their Section 8 vouchers to find rental housing in the private market. Within certain limits not relevant to this discussion, Section 8 tenants pay 30% of their income toward their contract rent. The difference between their full contract rent and this percentage of income payment represents the housing subsidy paid by the Section 8 program. For example, if a tenant s contract rent is $600 per month, and the percentage of incomebased rent is $250 per month, the property owner receives a $350 monthly housing subsidy through the Section 8 program. An Overview of Section 8 Utility Allowances In addition to the housing subsidy, Section 8 tenants receive what is termed a utility allowance each month (assuming the tenant pays his or her own utility costs). The utility allowance is designed to cover the tenant s entire utility bill. Rather than being simply a heating allowance, in other words, a utility allowance is designed to pay for all utilities (energy, water/sewer, trash) except telephone service. Since by law the tenant s total shelter expenses (which are to include contract rent plus all utilities except telephone) are to be limited to 30% of income, and since the household s contract rent is set equal to 30% of income, in order for the Section 8 program to comply with the federal statute, the utility allowance must pay a tenant s entire utility bill to keep total shelter costs under the statutory ceiling. 1 P a g e
16 Utility allowances are promulgated for each specific enduse. Different dollar allowances are, for example, promulgated for space heating, water heating, cooling, refrigerators, lighting and electric appliances. Allowances further vary by fuel. Each local housing authority would, in other words, have a natural gas heating allowance, an electric heating allowance, and a fuel oil heating allowance (assuming the presence of oil heat in the jurisdiction). Utility allowances also vary by the size of the house (measured by number of bedrooms) and type of building structure (e.g., a singlefamily attached home would have a different utility allowance from a singlefamily detached home which would have a different allowance from an apartment in a multifamily building). The utility allowance for Local Housing Authorities, in other words, is not a single number, but many. The set of numbers is referred to as a utility allowance schedule that identifies the dollar amount by enduse and fuel. A Section 8 utility allowance is generally not paid directly to the utility company. Instead, utility allowances are paid as a credit against percentageofincome based contract rents that would otherwise be the outofpocket responsibility of the Section 8 tenant. For example, in the illustration immediately above, if the tenant was entitled to receive a monthly utility allowance of $150, the percentage of incomebased rent for which the tenant bears outofpocket responsibility is reduced to $100 ($250 percentage of income based rent minus the $150 utility allowance) and the housing subsidy to the Section 8 property owner is increased by a corresponding amount (in this case, the property owner receives a $500 subsidy: $350 rent subsidy plus $150 utility allowance). The freedup money in the household s budget occasioned by the $150 reduction in tenant outofpocket expenses is then assumed to be used to pay the tenant s actual utility bills. Energy Usage Characteristics of Assisted Housing Units Providing adequate utility allowances to Section 8 housing units is particularly important in Pennsylvania given the age and relative energy inefficiency of assisted housing units. No way exists to directly measure the energy efficiency of Section 8 housing units. The inability to measure the energy efficiency of Section 8 housing units is exacerbated by the lack of statespecific information on energy consumption overall. Nonetheless, the U.S. Department of Energy (DOE) Residential Energy Consumption Survey (RECS) reports data at a regional level. The RECS divides the country into four Census Regions (Northeast, South, North Central, West) and nine Census Divisions. Pennsylvania is part of the MidAtlantic Division that, in turn, is part of the Northeast Region. Data on several aspects of assisted housing can be obtained from the RECS. The most recent RECS (2005) reports data on: the age of the housing unit; 2 P a g e
17 the age of the heating unit; the age of the water heating unit; and the age and Energy Star status of the refrigerator(s). The data for the Northeast Region and MidAtlantic Division are reasonably consistent with each other, making it more likely that it accurately portrays assisted housing in Pennsylvania. The Table below sets forth the data. The age of housing structures subsidized through an assisted housing program 9 reveals an older housing stock that is likely to be energy inefficient. Roughly half of all assisted housing is 60 years old or older, while more than 60% is at least 50 years old. Very few assisted housing units have been built in the past 25 years. Corresponding to the age of the housing unit is the age of the heating unit. A substantial proportion of assisted housing tenants do not know the age of their heating unit. Of those who do know, however, the number of heating units aged 20 years or older was by far the largest proportion of heating units by age. Indeed, the number of heating units aged 20 years or older was nearly twice the number of heating units aged 10 years or younger. Similar results exist for domestic hot water heaters. While a sizable proportion of assisted housing tenants (both in the Northeast and in the MidAtlantic) do not know the age of their water heater (or do not use a separate water heater for their unit), nearly onein seven of the total assisted housing tenants report having water heaters aged 10years old or older. The lack of attention paid to energy efficiency in assisted housing is evident in the data on appliances as well. As of the 2005 RECS, most refrigerators in the Northeast Region were too old to be Energy Star rated. Even within the population of refrigerators that had been purchased recently enough to potentially be Energy Star, only half were. Roughly half of assisted housing tenants reported having an Energy Star refrigerator when the refrigerator had been purchased within the past four years (and Energy Star units were available). 9 The RECS does not reference Section 8 in particular. While Section 8 is, by far, the largest assisted housing program in the country, it is not the only such program. 3 P a g e
18 Attributes of Assisted Housing Affecting Energy Consumption by Census Division and Census Region (2005) Before Age of Housing Units Northeast 32% 17% 12% 6% 8% 15% 2% 6% 2% MidAtlantic 32% 21% 12% 5% 4% 19% 7% Age of Heating Unit or later <2 years 2 4 years 5 9 years years 20 or more years Don t Know Northeast 9% 3% 5% 8% 31% 43% MidAtlantic 11% 1% 7% 7% 36% 38% No separate DHW Age of Domestic Hot Water Heater (DHW) < 2 years 2 4 years 5 9 years years 20 or more years Don t Know Northeast 18% 12% 1% 11% 10% 3% 38% 6% MidAtlantic 18% 15% 1% 14% 9% 4% 32% 7% Whether Refrigerator Energy Star by Age of Refrigerator Don t Use DHW No Yes Don t Know Too Old to be Energy Star Northeast (all ages) 17% 20% 5% 58% Less than 2 years old 49% 47% 4% 0% 2 4 years old 25% 51% 24% 0% SOURCE: 2005 Residential Energy Consumption Survey (U.S. Department of Energy). The need for adequate utility allowances is particularly important in Pennsylvania s Section 8 housing. While direct information on the efficiency of existing energyconsuming systems is not available for Section 8 housing, the extent to which tenants of assisted housing are vulnerable to changes in prices can nonetheless be reasonably inferred from the data that is available. In particular, the age of the building structure, the heating system, the hot water system, and the refrigerators used in Section 8 housing makes clear the risk of uncompensated bills if utility allowances are not set to appropriately reflect underlying energy prices. Moreover, the risk of uncompensated bills is significant if utility allowances are not appropriately updated to track changes in prices over time. In light of this overview, this report is divided into four parts. Part 1 provides a brief examination of the resident characteristics of Section 8 tenants in Pennsylvania. 4 P a g e
19 Part 2 examines the relationship between changes in the utility allowances promulgated for Section 8 units relative to changes in the underlying home energy prices. Prices are examined for three enduses: natural gas space heating; electric space heating; and electric nonheating (not including hot water). Part 3 examines the extent to which the Section 8 Management Assessment Program (SEMAP) provides adequate oversight of the extent to which Local Housing Authorities maintain uptodate utility allowances. Annual SEMAP ratings on SEMAP Indicator #4, utility allowances, are compared to the actual performance of LHAs in updating their utility allowances. Part 4 summarizes and draws conclusions. 5 P a g e
20 PART 1: AN OVERVIEW OF SECTION 8 VOUCHER HOUSING IN PENNSYLVANIA Section 8 housing serves some of the lowest income households in the State of Pennsylvania. This chapter considers the income distribution of Section 8 tenants in Pennsylvania. Low levels of income are consistently found to be a significant driver of high home energy burdens. 10 The discussion below disaggregates income by the three categories used by the U.S. Department of Housing and Urban Development (HUD) in its housing programs. Under HUD s system of income categorization: Extremely lowincome refers to households with income at or below 30% of area median income (AMI); Very lowincome refers to households with income above 30% of AMI but at or below 50%; Lowincome refers to households with income above 50% of AMI but at or below 80%. Data in this section is largely assessed by Congressional district. A map of Pennsylvania s Congressional districts is set forth as Figure Home energy burdens are bills as a percentage of income. If, for example, a household has an annual income of $8,000 and a home energy bill of $1,600, the household has a home energy burden of 20% ($1,600 / $8,000 = 0.20). For information on home energy burdens by income and geographic area, see generally, 6 P a g e
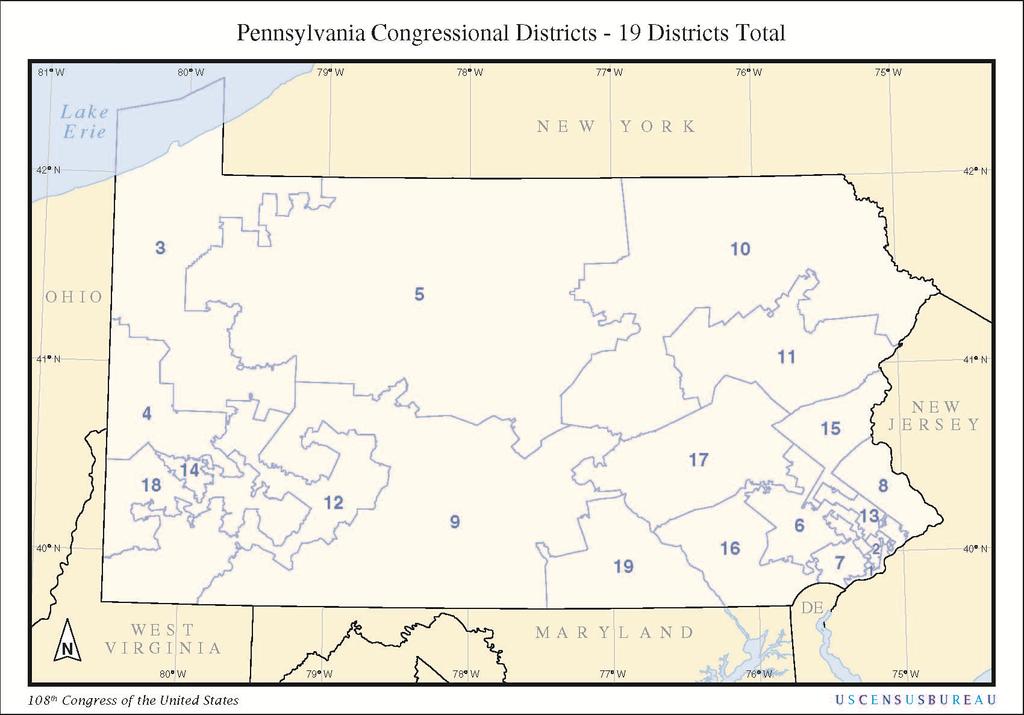
21 7 Page
22 Relative Income: Distribution by Congressional District Pennsylvania s Section 8 tenants are overwhelmingly extremely lowincome households (with income at or below 30% of AMI). Table 1 presents information by Congressional district to allow the reader to understand the geographic implications of the data. Table 1. Distribution of Section 8 Tenants by Income Categorization (All Voucher Assisted Units) (Pennsylvania) Congressional District Extremely Low Income Very Low Income Low Income Income Category Above Low Income Unavailable Income Total /a/ 60% 23% 4% 0% 13% 100% 77% 17% 4% 0% 1% 99% 79% 18% 2% 0% 1% 100% 69% 25% 4% 0% 2% 100% 69% 25% 4% 0% 2% 100% 62% 32% 4% 0% 1% 99% 71% 24% 4% 0% 1% 100% 76% 18% 3% 0% 2% 99% 67% 24% 4% 0% 4% 99% 59% 31% 7% 0% 3% 100% 61% 30% 5% 0% 3% 99% 64% 28% 4% 0% 3% 99% 68% 21% 4% 0% 7% 100% 74% 21% 3% 0% 2% 100% 71% 22% 4% 0% 3% 100% 64% 30% 5% 0% 2% 101% 71% 20% 3% 0% 6% 100% 72% 24% 2% 0% 2% 100% 19 71% 23% 4% 0% 2% 100% SOURCE: Residential Characteristics Report, U.S. Department of Housing and Urban Development (HUD). NOTES: /a/ Some totals may not add to 100% because of rounding. 8 P a g e
23 The lowest penetration of extremely lowincome Section 8 tenants occurred in Congressional district #9 with 59%, followed closely by Congressional districts #10 (61%) and #5 (62%). In contrast, the highest penetration of extremely lowincome Section 8 tenants occurred in Congressional district #2, with 79%. In 14 of Pennsylvania s 19 Congressional districts, the penetration of extremely lowincome households within the Section 8 voucher population was between 65% and 80%. As shown in Table 1, in all but two of Pennsylvania s 19 Congressional districts (District #1 and #13), between 90% and 100% of Section 8 tenants were either extremely lowincome (at or below 30% of AMI) or very lowincome (at or below 50% of AMI but greater than 30%); the penetration in District 13 was 89%. The highest income Section 8 tenants statewide in Pennsylvania, in other words, nonetheless live with incomes less than half of area median income. This income status is consistent throughout the state, whether rural areas or urban; whether east or west; whether small town or large city. The categorization of Section 8 tenants relative to area median income is an important indicator of how poor those tenants are. It is generally the case that area median income reasonably reflects the costofliving in a specified geographic region. If the cost of living is higher in one area, the area median income tends to be higher as well. Accordingly, the income of Section 8 tenants as a percent of area median income is a good relative measure of how poor Section 8 tenants are. Aside from the relative income of Section 8 tenants, however, examining Section 8 income by reference only to median income does not provide insights into the absolute dollar income of these tenants. Data on absolute dollars of income is considered next. Absolute Income: Distribution by Congressional District The dollar income of Pennsylvania s Section 8 tenants tends to be just over $10,000, supporting average household sizes of between two and three persons. Table 2 presents the distribution of income for Pennsylvania s Section 8 tenants by dollars, along with average income and average household size. The average income of Section 8 tenants in Pennsylvania ranges from a low of $10,500 (Congressional District #12) to a high of $15,370 (Congressional District #8). In 13 of Pennsylvania s 19 Congressional districts, average annual income for Section 8 tenants was less than $13,000. In only one Congressional district did average income exceed $15,000 (District #8). 9 P a g e
24 Table 2 shows further, however, that the bulk of Section 8 tenants have income between $5,000 and $15,000. Indeed, in all but one Congressional district (District #8), between 40% and 60% of Section 8 tenants have annual incomes of less than $10,000. In only two Congressional districts do fewer than 65% of Section 8 tenants have income less than $15,000. Table 2. Distribution of Income by Congressional District (Pennsylvania VoucherBased Assistance) District $0 $1 $5,000 $5,001 $10,000 Distribution of Annual Income (percentage) $10,001 $15,000 $15,001 $20,000 $20,001 $25,000 Above $25,000 Total Annual Income Average HH Size 1 5% 12% 27% 19% 14% 9% 14% 100% $13, % 2 4% 14% 32% 19% 13% 10% 8% 100% $12, % 3 2% 11% 38% 24% 15% 5% 4% 99% $11, % 4 2% 10% 37% 26% 16% 6% 4% 101% $11, % 5 2% 9% 40% 28% 14% 5% 3% 101% $11, % 6 3% 10% 32% 24% 15% 7% 8% 99% $12, % 7 3% 9% 32% 21% 14% 9% 12% 100% $13, % 8 0% 4% 32% 22% 15% 12% 14% 99% $15, % 9 2% 8% 41% 27% 15% 4% 2% 99% $11, % 10 1% 8% 39% 27% 15% 7% 3% 100% $11, % 11 3% 9% 35% 26% 16% 6% 4% 99% $11, % 12 3% 12% 42% 23% 13% 5% 2% 100% $10, % 13 6% 7% 31% 20% 15% 9% 12% 100% $13, % 14 6% 15% 33% 21% 13% 7% 5% 100% $10, % 15 2% 8% 31% 25% 19% 8% 7% 100% $13, % 16 2% 8% 34% 23% 15% 9% 9% 100% $13, % 17 4% 9% 35% 21% 15% 8% 7% 99% $12, % 18 4% 12% 35% 22% 14% 7% 5% 99% $11, % 19 1% 8% 34% 27% 16% 8% 6% 100% $12, % NOTES: Federal Poverty Level in 2009 was as follows: 1person household: $10,830; 2person household: $14,570; 3person household: $18,310; 4person household: $22,050. Federal Poverty Level 10 P a g e
25 Looking only at dollar incomes does not fully capture the lowincome status of tenants living in Pennsylvania s Section 8 housing. Household size in Section 8 units, by Congressional districts, ranges between 1.9 and 3.2 persons per household. Household size is an important factor to consider as a corollary of income. The relative lowincome status of a household varies by income and household size. A threeperson household with an income of $10,000 is considered to be poorer than a twoperson household with an income of $10,000. This impact of household size is reflected in the Federal Poverty Level. Poverty Level sets out income as a function of household size. 11 Pennsylvania s Section 8 tenants, on average, have income well below the Federal Poverty Level. In only one Congressional district (District #8) does the average annual income of Section 8 tenants approach 100% of the Federal Poverty Level. In virtually every other Congressional district, the average annual income of Section 8 tenants places them between 70% and 80% of the Poverty Level, with one district dipping slightly below 70% (District #14) and a few going slightly above 80% (Districts #13, #15, #19). Several conclusions can be drawn from the income data presented in Table 2: Section 8 tenants are amongst the lowest income households in the State of Pennsylvania. On average, Section 8 tenants have annual incomes below 75% of Federal Poverty Level. They frequently, but not on average, have income between 25% and 30% of Federal Poverty Level. The lowincome status of Section 8 tenants is not confined to large urban areas. Dividing the state into regions by reference to Congressional districts, the low average income, as well as the distribution of income below $5,000, below $10,000, and below $15,000 a year, is reasonably consistent throughout the state. As can be seen, by the very nature of their poverty, Section 8 tenants do not have access to high quality housing. While housing units that are subsidized by the federal Section 8 program must comply with certain federallyprescribed minimum Housing Quality Standards (HQSs), the units nonetheless tend to be older and lower quality (even if meeting minimum HQSs). They do not represent high quality housing. Moreover, Section 8 tenants do not have the capacity to improve the quality of their housing. Their inability to make energy efficiency investments, sometimes referred to as usage reduction measures, is of particular importance for this analysis. Despite their lower quality housing, because of the very fact of their poverty, Pennsylvania s Section 8 tenants would be financially 11 The 2009 Federal Poverty Level for a twoperson household was $14,570; the 2009 Federal Poverty Level for a threeperson household was $18, P a g e
26 unable to pursue efficiency measures on their own, even should they have the authority to do so in their rental housing. One major limitation on energy efficiency investments is the payback period. The payback period is that time over which the initial investment in the efficiency measures will generate sufficient savings to allow the customer to recoup his or her initial financial outlay and to begin to pocket savings. The payback period for any particular energy efficiency measure, however, becomes irrelevant if the household does not have the investment capital with which to begin. In addition, a Section 8 tenant would rarely have the decisionmaking authority (sometimes referred to as the dominion interest ) over his or her major energyconsuming systems in any event. Whether or not a usage reduction measure makes economic sense, or falls within the financial wherewithal of the tenant to implement, the tenant does not generally have the authority to implement major usage reduction strategies in his or her home. With these observations in mind, the remainder of this study examines utility allowances in Pennsylvania relative to the cost of utility service charged to Section 8 tenants. The lack of ability to implement usage reduction measures means that Section 8 tenants must accept the bills they receive. These tenants do not have the financial capacity to invest in measures that would reduce their bills by reducing their consumption. Even if they did have that financial capacity, they would lack the authority to make a decision to replace, repair or modify the housing systems (heating system, hot water system) that drive their energy consumption levels. Accordingly, if Section 8 utility allowances are not adequately set and updated, usage reduction is not reasonably available as a mechanism to protect against unaffordable home energy bills. As a result, the first line of defense against unaffordable bills for Section 8 tenants involves the utility allowances that are to be provided as described in the Introduction above. The remainder of this paper will examine, over a multiyear period of time, changes in natural gas and electric utility rates in Pennsylvania relative to changes in utility allowances provided for natural gas and electric space heating as well as electric appliances (including lighting and refrigeration). 12 P a g e
27 PART 2: UTILITY ALLOWANCES RELATIVE TO UTILITY BILLS IN PENNSYLVANIA This chapter examines utility allowances promulgated by Local Housing Authorities (LHAs) throughout Pennsylvania for the four years 2006 through 2009 inclusive. A list of the Pennsylvania LHAs was obtained from the U.S. Department of Housing and Urban Development (HUD). In May 2009, a written request was submitted to the Executive Director of each LHA, pursuant to Pennsylvania s Public Records Act, asking for a single written copy of all utility allowance schedules for either Section 8 or Public Housing units, or both, as applicable: 12 In effect for Fiscal Year 2009 In effect for Fiscal Year 2008 In effect for Fiscal Year 2007; and In effect for Fiscal Year Each LHA was given the opportunity to respond by hard copies conveyed via facsimile or U.S. mail or by providing electronic copies by . A followup written request was made via e mail in June 2009 to LHAs not responding to the first request for the utility allowance schedules. A second followup contact was made by letter in September Utility allowances were obtained from 60 of Pennsylvania s 90 LHAs. A list of LHAs providing utility allowance schedules is attached as Appendix A. A list of the LHAs either refusing or unable to provide copies of their utility allowance schedules is attached to this analysis as Appendix B. 12 Some Local Housing Authorities administer Section 8 units but not public housing units. Some Local Housing Authorities administer public housing units but not Section 8 units. 13 P a g e
28 After receiving the utility allowance schedules, each LHA was matched to both a local distribution natural gas company and a local distribution electric company. This match was made by comparing the community in which each LHA maintains the U.S. Postal Service mailing address for its main administrative office with the service territories reported by each distribution utility in its published tariff. Pennsylvania tariffs for each utility were obtained from each utility s World Wide Web site. Having matched each LHA with a corresponding distribution gas and electric utility, utility rates were obtained for each utility through the Pennsylvania Public Utilities Commission annual Rate Comparison Report. 13 The PUC releases rate comparisons in April of each year both for heating and for nonheating consumption using the following consumption levels: Electric consumption, assuming 500 kwh/month for nonheating and 2,000 kwh/month for heating; and Natural gas consumption, assuming 2 MCF/month for nonheating and 15 MCF/month for heating. 14 Since the PUC s rate comparisons use constant consumption levels as their base, any change identified between the annual rate comparison publications can be attributed to a change in price. A change in price could occur because of any one factor, or a combination of multiple factors, including a change in the level of base rates, a change in rate design or a change in fuel or commodity costs collected through an automatic adjustment clause. The annual natural gas and electric bills obtained from the Pennsylvania PUC were compared to the utility allowances for twobedroom units for: Natural gas and electric space heating; and Electric appliances (including lights and refrigerators). Considering space heating along with electric appliances covers most energy use in the home. According to the Energy Information Administration (EIA) of the U.S. Department of Energy (DOE), 41% of a home s total energy consumption is devoted to space heating, while 39% is 13 See, e.g., Pennsylvania Public Utilities Commission: Rate Comparison Report, April 15, 2009 (identical reports examined for 2008, 2007, 2006 and 2005). 14 See e.g., Pennsylvania Public Utilities Commission: Rate Comparison Report: 2009, at 4 (April 15, 2009). Rates were established as of January 31, Rates were based on Provider of Last Resort (POLR) default service for electricity and for Supplier of Last Resort (SOLR) service for natural gas service. 14 P a g e
29 devoted to electricity (including 26% for appliances, 8% for air conditioning, and 5% for refrigeration). 15 Annual utility allowances were selected for two bedroom units. The utility allowances were reviewed over the fouryear period to assess the extent to which, if at all, modifications in the utility allowances tracked changes in the underlying rates. 16 The utility allowances examined in the discussion below are limited to utility allowances promulgated for Section 8 housing. 17 Direction of Changes in Utility Allowances when Energy Bills Increased. Pennsylvania housing authorities frequently failed to adjust their utility allowances in years in which home energy bills increased. In particular, Pennsylvania LHAs failed to increase utility allowances for electric usage for appliances, refrigerators and lighting. The discussion below considers changes in utility allowances relative to changes in the corresponding electric and natural gas bills. Table 3 below presents data on the direction of change in the utility allowance in those instances where the energy bill increased from one year to the next. In the light of an increased utility bill, the utility allowances could: Remain the same; 18 Increase; 19 or Decrease. 20 References to bills throughout this report are not intended to reflect actual local bills. Instead, the bills refer to the total charges for specific uniform consumption levels reported by the Pennsylvania Public Utilities Commission (PUC) on an annual basis. Since the PUC reports such uniform consumption figures each year, any increase or decrease in the bills must necessarily reflect changes, up or down respectively, in the underlying prices. Changes in prices 15 Energy Information Administration, U.S. Department of Energy. How Energy is Used in the Homes: 2005, accessed January 15, The utility allowances were not reviewed to determine the underlying reasonableness of their dollar value. This discussion examines only the extent to which the utility allowances either increased or decreased, and by how much, as compared to the direction and magnitude of any change in the underlying natural gas and electric rates. 17 Utility allowances for public housing are not discussed. 18 Remain the same means that the utility allowance was identical in one year relative to the immediately preceding year. 19 No assessment of the magnitude of the increase is performed in this discussion. Only the direction of change, if any, is considered. 20 No assessment of the magnitude of the decrease is performed in this discussion. Only the direction of change, if any, is considered. 15 P a g e
30 may occur not only due to increases up or down, but due to changes in the rate design of the underlying utility as well. Given that this discussion considers four years of data ( ), three different opportunities are presented to determine the extent to which, if at all, the direction of change in the utility allowance tracks the direction of change in the corresponding home energy bill. 21 The unit of measurement used throughout this report is an instance. 22 Again, in looking at each instance of increased bills, as compared to changes in utility allowances, only the direction of change is considered in this section, not the magnitude of change. Table 3. Direction of Change in Utility Allowance Relative to Direction of Changes in Bills for Specified Home Energy Services (Pennsylvania Local Housing Authorities: ) Bills increased for: Instances where Utility Allowances: Increased Stayed the Same Decreased Total Instances of Increased Bills No. Pct No. Pct No. Pct No. Pct Natural gas space heating % 51 21% 47 19% % Electric space heating % % 38 11% % Electric nonheating % % 21 6% % Utility allowances are compared for natural gas space heating, electric space heating, and electricity for miscellaneous appliances. 23 Utility allowances for hot water, as well as prices and allowances for bulk fuels (e.g., fuel oil), are not considered in this analysis. Changes in Natural Gas Heating Bills Pennsylvania s Local Housing Authorities did not consistently respond to higher natural gas heating bills with increased natural gas heating utility allowances. Matched with the 246 instances of increased natural gas prices were 148 corresponding instances of increased natural gas heating utility allowances (60%). In contrast, a substantial proportion of increased natural gas prices were met with a lower utility allowance. Oneinfive instances of increased natural gas heating prices were associated with a 21 The three potential changes would be: 2007 relative to 2006; 2008 relative to 2007; and 2009 relative to Each instance involves both a year and a housing type. Since three housing types were selected for each Local Housing Authority studied, each Local Housing Authority could provide three instances. 23 The miscellaneous appliance usage includes lighting and refrigerators in addition to small appliances. 16 P a g e
31 decreased natural gas heating utility allowance (19%). A roughly equal proportion (21%) of instances of increased natural gas bills were matched with utility allowances that remained identical to the preceding year with lower utility bills. Changes in Electric Heating Bills Pennsylvania s Local Housing Authorities increased their utility allowances in response to higher electric heating prices at about the same rate as they increased natural gas heating utility allowances. In 60% of the instances of higher electric heating prices, Pennsylvania s LHAs also implemented higher electric heating utility allowances. Out of the 355 instances of increased electric heating bills, the rate at which utility allowances were also increased was the same for electric heating bills (60%) as existed for natural gas heating bills. That does not mean, however, that electric heating tenants faced identical LHA responses to increased electric prices. Only half as many electric space heating utility allowances decreased (11%) in the face of increasing electric prices as did natural gas utility allowances in light of increased natural gas prices (19%). Substantially more electric heating utility allowances remained constant than did natural gas utility allowances. In nearly threeoften instances of increased electric heating prices (29%), electric space heating utility allowances remained identical to the preceding year. Changes in Electric NonHeating Bills Annual changes in electric nonheating utility allowances, in light of corresponding increases in bills for nonheating electricity usage, mirrored the treatment of space heating bills. In the three comparison study periods (2007 vs. 2006; 2008 vs. 2007; 2009 vs. 2008), electric nonheating bills increased in 355 instances. For the population of Local Housing Authorities as a whole, utility allowances for miscellaneous electric usage (generally referred to as other electric usage) increased in three of every five instances where electric nonheating bills increased. 24 In contrast, it was uncommon for electric utility allowances to decrease when nonheating electric bills were escalating. Such decreases occurred in only six percent (6%) of all instances of increased bills. In 120 instances of increased bills (34%), however, utility allowances for other electric use remained the same from one year to the next even though the underlying nonheating electric bills increased. 24 Other electric usage stands in contrast to electric space heating and electric water heating. Other electric use involves appliances, which also includes lighting and refrigeration. 17 P a g e
32 Changes in Utility Allowances Relative to 10% Change in Energy Price This section considers changes in utility allowances promulgated by Pennsylvania s Local Housing Authorities while accounting for the magnitude of the change in the underlying home energy bill. While the discussion above considers whether utility allowances changed at all (of any magnitude, up or down) to reflect a change (of any magnitude) in home energy bills, this section is limited to a consideration of the change in utility allowances in those years in which the underlying bill increased by 10% or more relative to the immediately preceding year. 25 Not surprisingly, there are fewer instances where utility prices increased by 10% or more than instances where utility prices increased at all. This indicates simply that in some years, home energy prices increased, but increased by less than ten percent. The data is set forth in Table 4. The ten percent figure has legal significance. Under HUD regulations, a Local Housing Authority is required to revise its Section 8 utility allowances whenever the underlying utility prices have changed by 10% or more, retroactive to the date of the change in prices. 26 The discussion below considers the direction of change, if any, in the utility allowance in those instances where the 10% price threshold was met in the study years of 2006 through As above, the discussion at this point does not consider the magnitude of the change in the utility allowance, if any, merely the direction of change. In addition, the data presented in Table 4 is limited to an examination of yeartoyear changes in utility bills. It does not consider cumulative changes. Thus, for example, if utility prices increased by 7% from Year 1 to Year 2, and by an additional 5% from Year 2 to Year 3, this section does not address the cumulative 12% increase. To this extent, the discussion below will understate the degree to which utility bills have increased along with whether utility allowances have correspondingly increased For example, if the 2009 natural gas heating prices were 10% higher than the 2008 natural gas heating prices, this section considers whether the corresponding 2009 natural gas heating utility allowance was higher or lower than the 2008 natural gas heating utility allowance. 26 According to HUD regulations, a PHA must review its schedule of utility allowances each year, and must revise its allowance if there has been a change of 10 percent or more in the utility rate since the last time the utility allowance schedule was revised. 24 CFR (b)(4) (2009). Moreover, the Housing Authority s SEMAP Rating is supposed to be based in part on whether the PHA s SEMAP certification states that the PHA reviewed utility rate data within the last 12 months and adjusted its utility allowance schedule if there has been a change of 10 percent or more in a utility rate since the last time the utility allowance schedule was revised. 24 CFR 985.3(d) (2009). 27 Multiyear changes in utility prices are discussed below. 18 P a g e
33 Table 4. Change in Utility Allowance in Years When Home Energy Bills Increased by 10% or More In Single Year (Pennsylvania Local Housing Authorities) ( ) Bills increased 10% or more for: Utility Allowances Increased Stayed the Same Decreased Total Instances of 10%+ Bill Increases No. Pct No. Pct No. Pct No. Pct Natural gas space heating 46 60% 21 27% 10 13% % Electric space heating 66 61% 34 31% 9 8% % Electric nonheating 20 51% 18 46% 1 3% % 10% Change in Natural Gas Heating Bills Pennsylvania LHAs frequently failed to modify their utility allowances in years in which the underlying utility rates increased by 10% or more. In 77 instances from 2006 to 2009, natural gas prices increased by 10% or more from the preceding year. When natural gas heating bills increased by 10% or more in a given year, utility allowances were also increased in 60% of the cases. Of the 77 instances when natural gas heating bills increased by 10% or more, the corresponding natural gas heating utility allowances was also increased in 46 instances. No assessment is made of the magnitude of the increase in the utility allowances in this section. When natural gas heating utility allowances did not increase in response to 10% increases in natural gas prices, the number of instances when utility allowances remained identical outnumbered those instances where allowances actually decreased in response to increasing bills by a twotoone ratio. In 21 instances (27%), the utility allowance remained the same in light of an increase in natural gas space heating prices. In 10 instances (13%), the utility allowance decreased in light of an increase in natural gas space heating prices of 10% or more. In sum, during the period 2006 through 2009 in Pennsylvania, natural gas space heating rates increased from one year to the next in nearly 80 instances. Where such increases occurred, however, Pennsylvania LHAs did not provide any increase in their natural gas space heating utility allowance in four of ten cases. Indeed, in more than one out of every eight instances when natural gas space heating bills increased by 10% or more (10 of 77), natural gas space heating utility allowances decreased. 19 P a g e
34 10% Change in Electric Heating Bills Changes in electric space heating utility allowances relative to 10% changes in the underlying electricity bill closely mirrored changes in natural gas heating allowances and bills. A nearly identical proportion of electric space heating utility allowances (61%) increased in those instances where electric space heating bills increased by 10% or more. Roughly onethird of utility allowances stayed the same (31%) when the corresponding electric heating bill increased by at least 10%. Proportionately, somewhat fewer electric space heating utility allowances decreased (8%) when electric bills increased, compared to the proportion of natural gas heating utility allowances that decreased (13%) in response to increased gas bills. While nearly 50% more instances of significantly increased electric bills (10%+) existed in the fouryear period studied (as compared to increased natural gas bills), the higher absolute incidence of increasing bills did not appear to result in a higher relative incidence of a mismatch in the direction of change for utility allowances (relative to the direction of change in the price of the corresponding space heating bill). 10% Change in Electric NonHeating Bills Electric nonheating utility allowances 28 present a somewhat different picture than either natural gas or electric heating allowances. Pennsylvania s LHAs were much more likely to make no change in electric nonheating utility allowances, even when the underlying electric bill increased by 10% or more. A noticeably smaller proportion (51%) of electric nonheating utility allowances increased when the underlying bill increased by 10% or more. Moreover, the proportion of utility allowances that stayed constant in light of increasing electric nonheating bills was substantially greater (46%). It is not the case that LHAs were more likely (or even as likely) to reduce their utility allowances in light of increasing prices for nonheating consumption. The difference in LHA behavior was the propensity of LHAs to do nothing, even when electric nonheating prices increased by 10% or more. While there were fewer overall instances of increased electric nonheating prices of 10% or more, in nearly half of those instances, the corresponding utility allowance remained identical to the prior year. Ratio of 1Year Change in Utility Allowances to 1Year Change in Energy Prices This section of the analysis considers the extent to which changes in utility allowances reflect changes in the underlying utility bills given the treatment of the utility allowance as the starting point. Unlike the discussion above, which considered only the direction of change, the analysis in this section considers the magnitude of yeartoyear changes in utility allowances and utility 28 As noted above, nonheating usage does not include domestic hot water consumption. 20 P a g e
35 bills. It examines the three different treatments that can be accorded a utility allowance relative to changes in the underlying utility bill: The utility allowance could stay the same; 29 The utility allowance could decrease; 30 The utility allowance could increase. 31 In the following analysis, each of these three categories of utility allowances (unchanged, decreased, increased) is matched with the direction and magnitude of the underlying changes in the corresponding home energy costs. The objective is to determine whether the Section 8 tenant receiving the utility allowance is better off, worse off, or in the same circumstances given the extent to which the utility allowance covers the underlying bill. The discussion below accomplishes this objective by comparing a series of ratios. The analysis uses a sidebyside comparison of utility allowances and utility bills in one year with the corresponding utility allowances and utility bills from the immediately preceding year. The comparison finds the percentage which the Year 2 data point is of the Year 1 data point. For example: If a 2008 natural gas heating utility allowance was $100 and the corresponding 2007 natural gas heating utility allowance was $80, the percentage would be 125% ($100 / $80 = 1.25). If the 2008 natural gas heating bill was $60 and the corresponding 2007 natural gas heating bill was $90, the percent would be 67% ($60 / $90 = 0.67). If the 2008 natural gas heating bill was $80 and the corresponding 2007 natural gas heating bill was $80, the percentage would be 100% ($80 / $80 = 1.00). Given the calculation of both of these percentages (that of the utility allowance; that of the utility bill), the relative standing of the Section 8 tenant can be determined by calculating a ratio of the two percentages. This calculation places the utility allowance percentage in the numerator and the utility bill percentage in the denominator. If the ratio is less than 1.0, the Tenant has lost ground in having his or her utility allowance cover the corresponding utility bill; If the ratio is greater than 1.0, the Tenant has gained ground; 29 For example, if the utility allowance in 2007 was $100, the utility allowance in 2008 would also be $ For example, if the utility allowance in 2007 was $100, the utility allowance in 2008 would be $ For example, if the utility allowance in 2007 was $100, the utility allowance in 2008 would be $ P a g e
36 If the ratio is exactly 1.0, the Tenant is in the same relative position. The analysis does not undertake a substantive review of whether the utility allowance was adequate, or sufficient, or reasonable with which to begin. Rather, the analysis looks only at the relative change in utility allowances compared to changes in the underlying utility bills during the same time periods. A hypothetical example illustrates how the calculation works: 1. The 2007 electric heating bill is $60, and the 2008 electric heating bill is $80, a percentage of 133% (80 / 60 = 1.33); 2. The 2007 electric heating utility allowance is $50, and the 2008 electric heating utility allowance is $75, a percentage of 150% (50 / 75 = 1.50); 3. The sidebyside ratio is thus 150% / 133%, which is more than 1.0. In this illustration, the Section 8 tenant is better off in The utility allowance increased by a greater relative extent than did the corresponding utility bill. In contrast, consider the opposite circumstances. Again, the numbers are hypothetical and presented only for purposes of illustrating the calculation. 1. The electric nonheating electric bill is $30 in 2007 and $40 in 2008, a percentage of 133% (40 / 30 = 1.33); 2. The corresponding nonheating electric utility allowance is $25 in 2007 and $30 in 2008, a percentage of 120% (30 / 25 = 1.20); 3. The sidebyside ratio is thus 120% / 133%, which is less than 1.0. In this illustration, the Section 8 tenant lost ground in The utility bill increased by a greater relative extent than the corresponding utility allowance did. Any combination of changes can be examined in the sidebyside comparison, irrespective of the direction or magnitude of the changes in the utility allowances and the corresponding utility bills. As in the discussion above, no substantive analysis is undertaken in this section to assess the adequacy of the utility allowance relative to the level of the corresponding utility bills. This analysis considers only the direction and magnitude of the change in the utility allowances and bills over the four year study period. If the utility allowance was reasonably reflective of the 22 P a g e
37 underlying utility bills with which to begin, a ratio of 1.0 means the utility allowance remained reasonably reflective. If the utility allowance was too low to cover the underlying utility bills, a ratio of 1.0 means the allowance remained too low. A ratio of less than 1.0 would mean the utility allowance became even more inadequate. With this introduction, the relative changes in utility allowances and utility bills are considered for natural gas space heating, electric space heating, and electric nonheating. 1Year Change in Natural Gas Heating Utility Allowances to 1Year Change in Natural Gas Heating Bills Pennsylvania LHAs adopted natural gas heating utility allowances that resulted in an improvement in the position of Section 8 tenants more often than not, even when a utility allowance decreased or remained the same from one year to the next. The improvement, however, did not occur in significantly more than half of the instances. When natural gas utility allowances stayed the same from one year to the next, which happened in more than 100 instances, tenants were nonetheless better off in 54% of the instances. 32 Tenants were worse off in 45% of the cases. 33 In Pennsylvania, in other words, in slightly over half the instances when LHAs maintained a constant natural gas heating utility allowance from one year to the next (54%), the corresponding utility bills declined, while in slightly less than half the instances (45%), utility bills increased. Even when utility allowances were reduced from one year to the next, Pennsylvania Section 8 tenants improved their position in slightly more than half of the instances (53%). The only way for this to occur is for the underlying utility prices to decrease to an even greater extent than the utility allowances decreased. In contrast, the reduction of utility allowances from one year to the next resulted in Section 8 tenants being worse off in 46% of the instances. This result arises in any instance where the utility allowance decreases more than the utility bill does. When the utility allowance goes down, the bills might increase, might remain the same, or might decrease to a lesser extent that the utility allowance did. 32 If utility allowances remained the same, in order for the tenant position to have improved, the underlying utility bills must have decreased in the same time period. 33 If utility allowances remained the same, in order for the tenant position to have deteriorated, the underlying utility bills must have increased in the same time period. 23 P a g e
38 Table 5. 1Year Change in Natural Gas Heating Utility Allowance to 1Year Change in Natural Gas Heating Bills ( ) Gas Heating Utility Allowance This Year Relative to Last Year SidebySide Ratios /a/ Totals > 1.0 = 1.0 => 0.9 < 1.0 = 0 < 0.9 No. Pct. No. Pct. No. Pct. No. Pct. No. Pct. Same as last year 55 54% 1 1% 28 28% 17 17% % Less than last year 77 53% 0 0% 34 23% 34 23% % Greater than last year % 0 0% 51 25% 9 4% % NOTES: /a/ Calculation of the sidebyside ratio was explained in the text. Finally, when natural gas heating utility allowances were increased from one year to the next, they were increased at a rate higher than the corresponding change in energy prices. In more than 70% of the instances, Section 8 tenants were better off as shown by the sidebyside ratios. The assistance provided by increased utility allowances is even more evident by the observation that in only four percent (4%) of the instances where utility allowances were increased did the increase in the allowance result in a sidebyside ratio of less than 90%. In addition to the 71% of instances where the sidebyside ratio improved, in 25% more instances, while the ratio was less than 1.0, the sidebyside ratio was nonetheless still between 90% and 100%. 1Year Change in Electric Heating Utility Allowances to 1Year Change in Electric Heating Bills Pennsylvania LHAs adopted electric heating utility allowances that generally did not reflect underlying changes in the corresponding electric heating bills. In threeoffour instances where electric heating utility allowances remained the same from one year to the next, Section 8 tenants were worse off. Of the 137 instances where electric heating utility allowances remained the same, 103 resulted in a sidebyside ratio of less than 1.0. Indeed, 34 instances resulted in a sidebyside ratio of less than The only way for a sidebyside ratio to be less than 1.0 in these circumstances is for the utility allowance to remain the same at a time the corresponding utility bill was increasing. 24 P a g e
39 Table 6. 1Year Change in Electric Heating Utility Allowance to 1Year Change in Electric Heating Bills ( ) Electric Heating Utility Allowance This Year Relative to Last Year SidebySide Ratios /a/ Totals > 1.0 = 1.0 => 0.9 < 1.0 = 0 < 0.9 No. Pct. No. Pct. No. Pct. No. Pct. No. Pct. Same 33 24% 1 1% 69 50% 34 25% % Less 1 2% 0 0% 24 47% 26 51% % Greater % 0 0% 49 18% 35 13% % NOTES: /a/ The calculation of sidebyside ratios was explained in the text. Pennsylvania LHAs performed even more poorly in instances where the electric heating utility allowance was decreased from one year to the next. In 98% of the instances of reduced utility allowances, the position of the Section 8 tenant deteriorated. In more than half of the instances of reduced electric heating utility allowances, the sidebyside ratio was less than Tenant circumstances can deteriorate when utility allowances are reduced under any one of three different scenarios: (1) the utility allowance decreases more than the corresponding bill decreases; (2) the utility allowance decreases while the bill remains constant; or (3) the utility allowance decreases while the bill increases. 34 Finally, in contrast, Pennsylvania s Section 8 tenants were more often than not in a better position when utility electric heating allowances were increased from one year to the next. In nearly 70% of the instances where utility allowances were increased, the sidebyside ratio increased as well. This increase in the sidebyside ratio occurs when the utility allowances goes up while the corresponding bill either goes down, remains constant, or goes up to a lesser extent. Despite frequent improvement in tenant circumstances when electric heating utility allowances increase, in nearly oneofthree instances (31%), Section 8 circumstances deteriorated even though utility allowances were increased. The only way this could occur is for utility allowances to increase to a lesser extent than the corresponding bills increase. In this situation, even though the utility allowance has been increased, it falls further behind the corresponding utility bill. 34 It should be noted, however, that while the percentages are higher for instances when the utility allowance was reduced, the absolute numbers are lower. 25 P a g e
40 1Year Change in Electric NonHeating Utility Allowances to 1Year Change in Electric NonHeating Bills Pennsylvania LHAs overwhelmingly failed to reflect changes in electric nonheating prices in instances where the LHAs did not increase the electric nonheating utility allowances from one year to the next. In nearly threeoffour of the instances where utility allowances remained constant (74%), and in 100% of the instances where electric nonheating utility allowances were decreased, Pennsylvania s Section 8 tenants fell further behind in the extent to which their utility allowances covered their utility bills. In only 20% of the instances where electric nonheating utility allowances remained constant, did the position of Section 8 tenants improve (i.e., utility allowances remained constant while bills decreased). These outcomes, however, do not seem to represent such underperformance when considered in other lights. When utility allowances remained the same, the sidebyside ratio fell between 0.9 and 1.0 in 63% of the instances, In more than eightoften instances (83%), in other words, a constant utility allowance resulted in either an improvement or a nearstable situation for Section 8 tenants. In addition, while the percentage of instances with a deteriorating position was high when utility allowances were decreased, there were few overall instances (n=36) when utility allowances were decreased. Electric NonHeating Utility Allowance This Year Relative to Last Year Table 7. 1Year Change in Electric NonHeating Utility Allowance to 1Year Change in Electric NonHeating Bills ( ) Sidebyside Ratios /a/ > 1.0 = 1.0 => 0.9 < 1.0 = 0 < 0.9 Totals No. Pct. No. Pct. No. Pct. No. Pct. No. Pct. Same 33 20% 8 5% % 18 11% % Less than 0 0% 0 0% 15 42% 21 58% % Greater than % 0 0% 85 32% 6 2% % NOTES: /a/ The calculation of sidebyside ratios is explained in the text. In contrast, increasing electric nonheating utility allowances tended to improve the circumstances of Pennsylvania s Section 8 tenants. In 65% of instances where electric utility allowances were increased, the sidebyside ratio increased as well. Moreover, in 32% of the instances where utility allowances were increased, while the tenant circumstances deteriorated, the sidebyside ratio was nonetheless greater than P a g e
41 Overall, with the exception of when LHAs decreased their Section 8 electric nonheating utility allowances, which happened relatively infrequently, Section 8 tenants did not experience a significant decline in relative coverage of the electric nonheating bills. In only 24 instances of the 424 instances where utility allowances increased or remained the same did the sidebybyside ratio from one year to the next fall below Ratio of 2Year Change in Utility Allowances to 2Year Change in Energy Prices In a period of escalating energy prices, it is more likely that prices will increase over a twoyear period than over simply a one year period. In this section of the review of Pennsylvania utility allowances, therefore, the relative changes in utility allowances are compared to the relative changes in the underlying utility bills during the same twoyear period. The same process of creating a sidebyside ratio is used in the twoyear analysis. A ratio is created using two percentages. The numerator consists of the percent which the existing utility allowance is of the utility allowance from two year s prior. The denominator is comprised of the percentage of the current year bill of the bill from two years prior. To illustrate: If the 2008 natural gas heating utility allowance was $75 and the 2006 natural gas utility allowance was $60, the numerator would be 1.25 (75 /60 = 1.25). If the 2008 natural gas heating bill was $120 and the 2006 natural gas heating bill was $80, the denominator would be 1.50 (120 / 80 = 1.50). In this illustration, since the sidebyside ratio is less than 1.0 (1.25 / 1.50 < 1.0), the Section 8 tenant is worse off in 2008 relative to Over the twoyear comparison period, the natural gas heating bill increased at a proportionately greater rate than did the corresponding natural gas heating utility allowance. As in the oneyear sidebyside comparisons: If the sidebyside ratio is less than 1.0, the Section 8 tenant is worse off over the twoyear period; If the sidebyside ratio is greater than 1.0, the Section 8 tenant is better off. If the sidebyside ratio is exactly 1.0, the Section 8 tenant is neither worse, nor better, off over the twoyear period. The discussion below examines bills and utility allowances for natural gas heating, electric heating, and miscellaneous electric usage. 27 P a g e
42 2Year Change in Natural Gas Heating Utility Allowances to 2Year Change in Natural Gas Heating Bills Pennsylvania Section 8 tenants who heat with natural gas tended to be better off over a twoyear period. Over the study period, there were only 28 instances where utility allowances remained the same for three straight years. 35 In 22 of those 28 instances (79%), the Section 8 tenant experienced an improvement in circumstances. The only way for an improvement to occur when the utility allowance remained the same is for natural gas bills to have decreased in the same period. While the percentage of cases involving improved circumstances is high, the absolute number of instances is relatively small. Natural Gas Heating Utility Allowance This Year Relative to Two Years Ago Table 8. 2Year Change in Natural Gas Heating Utility Allowance to 2Year Change in Natural Gas Heating Bills SidebySide Ratios /a/ > 1.0 = 1.0 => 0.9 < 1.0 = 0 < 0.9 Totals No. Pct. No. Pct. No. Pct. No. Pct. No. Pct. Same 22 79% 0 0% 0 0% 6 21% % Less than 56 51% 0 0% 7 6% 46 42% % Greater than % 0 0% 40 24% 3 2% % NOTES: /a/ The calculation of sidebyside ratios was explained in the text. The absolute number of instances where utility allowances were either increased or decreased was far higher for natural gas heating than the number of instances where the utility allowance remained the same. Compared to the 28 instances where utility allowances remained constant, in 109 instances the utility allowances were decreased while in 166 instances, the utility allowances were increased. When natural gas heating utility allowances were decreased relative to two years prior, Section 8 tenants had a nearly equal chance that their circumstances would improve or deteriorate. In 51% of the instances where utility allowances were decreased, the tenants were still better off. This would necessarily mean that, in the same time period, natural gas heating bills decreased to a greater extent than did the corresponding utility allowance. In 48% of the instances of a 35 For utility allowances to be the same relative to two years ago, the allowances must be the same for four years in a row: 2009 vs. 2007; 2008 vs. 2006; In this illustration, the allowances were the same in 2006, 2007, 2008 and P a g e
43 decreased utility allowance, Section 8 tenants were worse off. 36 When Pennsylvania Housing Authorities increased their utility allowances, Section 8 tenants were almost always better off, or at least as well off, relative to any change in the underlying utility bills. In 74% of the 166 instances of increased natural gas heating utility allowances (n=123), an increased utility allowance resulted in the Section 8 tenant being in improved circumstances 2Year Change in Electric Heating Utility Allowances to 2Year Change in Electric Heating Bills In situations where Section 8 tenants heat with electricity, Pennsylvania LHAs overwhelmingly increased the electric space heating utility allowances over the multiyear period studied. While in 294 instances, electric space heating utility allowances increased, in only 65 instances did the utility allowance decrease (n=33) or remain the same (n=32). Electric Heating Utility Allowance This Year Relative to Two Years Ago Table 9. 2Year Change in Electric Heating Utility Allowance to 2Year Change in Electric Heating Bills SidebySide Ratios /a/ > 1.0 /b/ = 1.0 /c/ => 0.9 < 1.0 /d/ = 0 < 0.9 /d/ Totals No. Pct. No. Pct. No. Pct. No. Pct. No. Pct. Same 10 31% 0 0% 7 22% 15 47% % Less than 3 9% 0 0% 4 12% 26 79% % Greater than % 0 0% 59 24% 35 14% % NOTES: /a/ The calculation of sidebyside ratios was explained in the text. When utility allowances decreased or remained the same, Section 8 tenants heating with electricity were generally worse off. In 91% of the instances where electric heating utility allowances decreased, the sidebyside ratio with the corresponding electric heating bill was less than 1.0. In 69% of the instances where electric heating utility allowances remained the same, the sidebyside ratio with the corresponding bill was less than 1.0. While the percentages are high, however, the absolute numbers are low. 36 If utility allowances decreased and tenant circumstances improved, one of two circumstances prevail. Either, bills remained constant or bills decreased by an amount less than the utility allowance decreased. 29 P a g e
44 Increasing electric utility allowances, however, still resulted in a deteriorated position for Section 8 tenants heating with electricity in a significant number of instances. In only 61% of the instances where utility allowances were increased did Section 8 tenants improve their position. In fouroften instances, in other words, where electric heating utility allowances were increased, electric heating bills increased to an even greater relative extent. The increases in the utility allowances did not keep pace with the increases in the corresponding utility bills. Unlike natural gas heating, the absolute numbers are not small. Section 8 tenants were worse off in 94 out of 244 instances of increased electric heating utility allowances. 2Year Change in Electric NonHeating Utility Allowances to 2Year Change in Electric NonHeating Bills Fundamentally, the same results appertain to the twoyear changes in electric nonheating utility allowances as applied to electric heating allowances. The lack of improved circumstances where utility allowances were increased, however, is even more pronounced. Overall, Pennsylvania LHAs did not reduce their electric nonheating utility allowances, or leave them unchanged, over a twoyear period. In only 38 instances did electric nonheating utility allowances remain the same, while in only 26 instances did electric nonheating utility allowances decrease. While limited in number, in both circumstances, Section 8 tenants were almost universally worse off. In 92% of the instances where electric nonheating utility allowances remained the same, and in 100% of the instances where electric nonheating utility allowances decreased, the position of Section 8 tenants deteriorated relative to the changes in the underlying electric utility bills. Electric NonHeating Utility Allowance This Year Relative to Two Years Ago Table 10. 2Year Change in Electric NonHeating Utility Allowance to 2Year Change in Electric NonHeating Bills SidebySide Ratios /a/ > 1.0 /b/ = 1.0 /c/ => 0.9 < 1.0 /d/ = 0 < 0.9 /d/ Totals No. Pct. No. Pct. No. Pct. No. Pct. No. Pct. Same 3 8% 0 0% 24 63% 11 29% % Less than 0 0% 0 0% 1 4% 25 96% % Greater than % 0 0% % 9 4% % NOTES: /a/ The calculation of sidebyside ratios was explained in the text. 30 P a g e
45 Even when electric nonheating utility allowances were increased, the position of Section 8 tenants deteriorated more often than not. Unlike increased heating utility allowances (both natural gas and electricity), in only 45% of the instances of increased electric nonheating utility allowances did the circumstances of Pennsylvania s Section 8 tenants improve. The necessary conclusion is that in 55% of all instances where electric nonheating utility allowances increased vis a vis two years prior, electric nonheating utility bills increased to an even greater extent. In Pennsylvania, electric nonheating utility allowances, even when increasing, were not keeping up with increasing electricity prices. LongTerm Lack of Change in Utility Allowances This final section considers one aspect of the longterm performance of Pennsylvania LHAs in setting utility allowances. The data below indicates the number of instances in which LHA utility allowances remained identical from one year to the next in consecutive years, notwithstanding changes (up or down) in the underlying utility bill. For example, if Whiteacre Housing Authority left its natural gas space heating utility allowance the same in the years 2006, 2007 and 2008, even though natural gas space heating prices increased in each of those year, Whiteacre would appear in the 2 Consecutive Years column (2007 vs. 2006; 2008 vs. 2007). In contrast, if Blackacre Housing Authority left its natural gas utility allowance the same in 2007, increased it in 2008, and left it the same in 2009, even though its natural gas space heating prices increased in each of those years, Blackacre would not appear in the 2 Consecutive Years column, since the years in which it failed to modify its utility allowance were not consecutive (2007 vs. 2006, 2009 vs. 2008). An LHA would also be excluded from this analysis if its utility allowances were identical in each of the five study years, but the underlying bills did not change in one or more of those years. In sum, the only way for an LHA to appear in the 4 Consecutive Years column would be for the LHA to have left its utility allowance identical for five consecutive years (2005, 2006, 2007, 2008, 2009) despite changes (up or down) in the underlying utility bills every year. By definition, an LHA appearing in one of the multiple consecutive year columns also appears in each of prior multiple consecutive year columns as well (e.g., someone appearing in the 4 Consecutive Year column necessarily also appears in the 3 Consecutive Year column). 31 P a g e
46 Table 11. Instances of Consecutive Years in which Utility Allowance Did Not Change when Underlying Utility Bill Changed (up or down) (Pennsylvania LHAs) ( ) In years utility bill increased or decreased, instances where Utility Allowance was identical in: 0 Consecutive Years 2 Consecutive Years 3 Consecutive Years 4 Consecutive Years Natural Gas Heating Electric Space Heating Electric NonHeating Pennsylvania s LHAs were considerably more likely to fail to modify utility allowances for space heating bills in light of changes in underlying utility rates than they were to fail to modify electric utility allowances for miscellaneous (nonheating) end uses (including lighting and refrigerators). LHAs failed to modify both electric and natural gas space heating utility allowances in two consecutive years, despite changing bills, in twoandahalf times more instances than they failed to modify electric nonheating utility allowances in two consecutive years. 37 While somewhat less frequent overall, LHAs failed to modify electric space heating utility allowances in three consecutive years nearly ten (10) times more often than electric nonspace heating. The failure to modify natural gas space heating allowances for three consecutive years occurred almost fifteen (15) times more frequently than the failure to modify electric nonheating. Over time, LHAs appear to be more likely to leave space heating utility allowances untouched relative to nonheating utility allowances. LHAs are more likely to leave natural gas utility allowances untouched relative to electric allowances. Again, it should be noted, only instances where the utility allowance remained identical in light of changes in the underlying bills are considered. Instances where the utility allowances remained identical, but the underlying bill also remained the same, were excluded from this analysis. 37 The failure to modify allowances in two consecutive years means that the LHA had utility allowances that were identical in three consecutive years. For example, a utility allowance was $100 in 2006, remained $100 in 2007 (resulting in the first failure to modify ), and remained $100 in 2008 (resulting in the second failure to modify ). 32 P a g e
47 PART 3: HUD S ANNUAL SEMAP REVIEWS OF PENNSYLVANIA SECTION 8 UTILITY ALLOWANCES The discussion below examines how HUD s Section 8 Management Assessment Program (SEMAP) was used to monitor the compliance by Pennsylvania s Local Housing Authorities (LHA) with federal regulations regarding the promulgation of utility allowances. The purpose of SEMAP is to assess whether the Section 8 tenantbased assistance programs operate to help eligible families afford decent rental units at the correct subsidy cost. 38 SEMAP identifies 14 key indicators through which to measure LHA performance. Indicator #4 is to report whether the LHA maintains a current schedule of allowances for tenant utility costs. 39 The SEMAP utility allowance indicator allows for no ambiguity. The LHA s SEMAP rating is based on whether: The PHA s certification states that the PHA reviewed utility rate data within the last 12 months and adjusted its utility allowance schedule if there has been a change of 10 percent or more in a utility rate since the last time the utility allowance schedule was revised CFR (2009) CFR 985.3(d), citing 24 CFR CFR 985.3(d)(3)(i). 33 P a g e
48 If the LHA cannot make that statement, it receives a score of 0 points on this SEMAP indicator. 41 The SEMAP utility allowance indicator is an either/or proposition. If the LHA has made a review within the past twelve months and adjusted its utility allowances, it receives a full SEMAP score of five (5) points; if it has not, it receives a SEMAP rating of 0 points. It is important to note the multiple aspects of the SEMAP utility allowance indicator. First, the SEMAP indicator creates a conjunctive test which the LHA must certify has been met. The regulation uses the word and. The local LHA must have reviewed utility rate data and adjusted its utility allowance schedule if appropriate. Second, the SEMAP indicator imposes a specific time frame within which the conjunctive test is to be measured. In order for the LHA to certify that it has met this SEMAP indicator, its review and adjustment of the utility allowance schedule must have occurred within the last 12 months. A review and adjustment of utility allowances 15 or 18 or 24months ago does not allow the LHA to certify its compliance with this SEMAP indicator any more than no review at all. Finally, the SEMAP indicator imposes a specific requirement of what must be reviewed. According to the regulation, the LHA must have reviewed utility rate data. The LHA cannot have examined some costofliving data; it cannot make decisions based on some articulated (or unarticulated) policy determination; it may not consider simply the rate of inflation. Within the last twelve months, the LHA must have reviewed utility rate data and made adjustments to its utility allowance schedule if that utility rate data reveals a change in rates of 10 percent or more since the last time the rate schedules have been adjusted. 42 The review is not to determine whether there was a change relative to last year, but rather relative to determine whether there was a change relative to the last time the utility allowances were adjusted. The LHA SEMAP Process The SEMAP rating is based initially on an annual selfcertification by the local LHA to HUD. Each local LHA distributing $300,000 or more in tenant assistance must submit a SEMAP certification form 43 within 60 days after the end of its fiscal year. 44 The certification must be approved by a resolution of the LHA s board of directors (or board of commissioners) and signed by both the LHA board chair and the LHA executive director, unless the LHA is a unit CFR 985.3(d)(3)(iii) CFR (d)(2). 43 See, 24 CFR (defining SEMAP certification ) CFR (a). 34 P a g e
49 of local government or a state. 45 In that instance, no resolution is needed, but the LHA certification must be signed by the chief executive officer of the unit of government (or his/her designee) and the Section 8 program director. 46 HUD verifies the LHA s certification by comparing the LHA s independent audit (IA) to the SEMAP certification. 47 LHAs are required to submit independent audits under the Single Audit Act. 48 A SEMAP score based on an LHA s certification will be subject to change based on HUD s review of the LHA s annual audit. 49 In sum, the SEMAP process creates a substantial paper trail that documents the extent to which, if at all, a local LHA has complied with federal regulations regarding the updating of Section 8 utility allowances. 50 The series of local signoffs on the SEMAP utility allowance indicator includes: The LHA s Board must adopt a resolution saying that the LHA has reviewed utility rate data and made changes to the LHA s utility allowance schedules based on that review within the previous twelve months. The LHA board chair and the LHA executive director must both sign the certification saying that the LHA has reviewed utility rate data and made changes to the LHA s utility allowance schedules based on that review within the previous twelve months. The independent auditor must provide an independent basis upon which HUD can confirm that the LHA has reviewed utility rate data and made changes to the LHA s utility allowance schedules based on that review within the previous twelve months. The HUD SEMAP Process Once the local LHA submits its SEMAP certification to HUD, HUD (through its regional staff) 51 must give an initial SEMAP score on each SEMAP indicator within 120 days after the end of the LHA s fiscal year. 52 The HUD notice must be in writing and give a score on each indicator in addition to an overall SEMAP score CFR (a)(i) CFR (a)(i) CFR 985.3(d)(2). 48 See e.g., 24 CFR (2) CFR (1)(d). 50 This discussion relates only to Section 8. It does not encompass public housing utility allowances. 51 Notice PIH (HA), at CFR (b). 53 Id. 35 P a g e
50 The HUD notification letter must identify any indicator on which the LHA received a score of 0 points 54 and require the LHA to correct the deficiency within 45 days. 55 Upon receiving the HUD notification letter, the LHA must correct any deficiency a deficiency is an indicator on which the LHA received a score of 0 points within 45 days; 56 it must provide a written report to HUD describing its correction. 57 If the LHA fails to correct the deficiency within 45 days, HUD may require the LHA to submit a corrective action plan. 58 Note, however, that while the corrective action plan provision is in a section titled required actions for SEMAP deficiencies, 59 the permissive use of the word may in this regulation might seem to allow HUD the discretion either to require a corrective action plan or not. The PIH notice on SEMAP procedures further buttresses this nonmandatory nature of corrective action plans. That PIH notice provides that HUD Directors and Program Center Coordinators may require, where warranted nontroubled LHAs...that do not correct all SEMAP deficiencies during the 45 calendar day period following notification to submit a corrective action plan. 60 As can be seen, a corrective action plan is not automatic. It may be required where warranted as determined by HUD. Whether or not a corrective action plan is ordered, however, HUD is not without recourse against an LHA that fails to adjust its utility allowance (and thus receives a SEMAP score of 0 points on Indicator #4). The HUD regulations provide that HUD may determine that an LHA s failure to correct identified SEMAP deficiencies or to prepare and implement a corrective action plan required by HUD constitutes a default under the [Annual Contributions Contract]. 61 Moreover, in identifying what enforcement HUD may take, the PIH notice setting forth SEMAP procedures states: HUD may take further enforcement action against the PHA if it does not correct identified SEMAP deficiencies or prepare and implement a viable corrective action plan where required, or demonstrate sufficient program improvement by the third SEMAP reporting cycle. HUD may determine that these actions constitute a default under the Annual Contributions Contract (ACC). Enforcement action by HUD may include a transfer of the troubled PHA s 54 Remember, the utility allowance indicator is all or nothing. Either a review of utility rates has been performed, and appropriate adjustments made to the utility allowance schedule (providing for a full SEMAP score of five points), or it has not (providing for a SEMAP score of 0 points on this indicator) CFR (b) CFR (a) CFR (b) CFR (c) CFR (emphasis added). 60 PIH Notice (HA), at 5 (October 25, 2005) CFR (emphasis added). 36 P a g e
51 housing choice voucher program to another PHA, or HUD may solicit bids from contractors to manage the PHA s troubled housing choice vendor program. 62 As can be seen, HUD is not without ability to respond to the inability or unwillingness of an LHA to correct SEMAP utility allowance deficiencies. 63 While corrective action plans do not appear to be mandatory in the face of the failure of an LHA to remedy a SEMAP deficiency, should such a corrective action plan be ordered by HUD, certain obligations attach to HUD. In particular, once a corrective action plan is submitted, HUD must review the adequacy and monitor implementation of LHA corrective action plans...and provide technical assistance to help the LHA improve program management. 64 In sum, there is a series of mandatory HUD actions relating to utility allowances and Section 8 programs. In particular: HUD must review each LHA s independent audit and compare that audit on each SEMAP indicator for which the audit is the method of verification to determine if the SEMAP score based on the LHA s selfcertification is warranted. HUD must notify each LHA of any SEMAP deficiency, with a deficiency being a SEMAP indicator generating a score of 0 points. HUD must give each LHA notice of the LHA s obligation to remedy the deficiency within 45 days. Should HUD order a corrective action plan for a SEMAP deficiency, HUD must require such plan to be submitted within 30 days. HUD must subsequently review the adequacy of the corrective action plan and monitor the implementation of any such corrective action plan. The HUD SEMAP Review of The discussion below examines the extent to which HUD has reviewed the annual SEMAP filings by Pennsylvania s LHAs with respect to the adjustment of Section 8 utility allowances. Each SEMAP rating for a Pennsylvania LHA was obtained through a federal public records request to the Philadelphia HUD regional office and Pittsburgh HUD regional office respectively. Appendix C sets forth both the request to and response from the Philadelphia HUD 62 Id. 63 Presumably, the authority to transfer management of the entire program to another LHA would include the lesserincluded authority to transfer the authority to review and set utility allowances to another LHA CFR (f). (emphasis added). 37 P a g e
52 regional office. Appendix D sets forth both the request to and response from the Pittsburgh HUD regional office. 65 A review of the SEMAP ratings for the years 2006 through 2009 inclusive reveals that HUD gave no SEMAP rating of 0 to a Pennsylvania LHA in that fouryear period for SEMAP Indicator #4 (i.e., the SEMAP indicator involving utility allowances). Since SEMAP ratings for Indicator #4 are either/or propositions (i.e., either the LHA has reviewed utility data and made adjustments to its utility allowances where appropriate, thus receiving a SEMAP rating of 5, or it has not, thus receiving a SEMAP rating of 0, for Indicator #4), by necessary implication, the full SEMAP rating necessarily indicates that: HUD found that each Pennsylvania LHA submitted a resolution passed by the LHA board indicating the LHA s compliance with SEMAP Indicator #4 for all four years ( inclusive); HUD found that each Pennsylvania LHA certified to HUD, signed by the LHA board chair and executive director, its compliance with SEMAP Indicator #4 for all four years ( inclusive); That each Independent Auditor provided an independent basis to HUD upon which HUD could verify each LHA s full compliance with SEMAP Indicator #4 for all four years ( inclusive). The review of the data discussed above, however, places the accuracy of these findings and certifications in doubt. The fact that full SEMAP scores were given to all Pennsylvania LHAs for all four years calls into question the viability and legitimacy of the SEMAP process and HUD s administration of that process. The discussion below considers the utility allowances for Pennsylvania s LHAs on a yearbyyear basis along with the resulting SEMAP score for Indicator #4. Again, utility allowances for twobedroom units are considered for natural gas space heating, for electric space heating, and for electric nonheating (appliances, including refrigeration and lighting, but not hot water). Natural Gas Space Heating Utility Allowances and SEMAP Ratings A review of changes in natural gas heating allowances reveals that numerous Local Housing Authorities in Pennsylvania received positive SEMAP ratings even when the natural gas utility allowances of those LHAs were not modified to reflect increases in the underlying natural gas 65 Because of the volume of the response, the attachments to the HUD responses are omitted. 38 P a g e
53 heating bills. Over the study period, eight of the 59 LHAs providing data 66 used in this examination 67 maintained a constant natural gas heating utility allowance notwithstanding the fact that the corresponding natural gas bill increased by 10% or more in the same time period. As the Table below shows, for example: Both the Pottsville and the Huntingdon housing authorities maintained identical natural gas heating allowances for their singlefamily detached, inner row and end row units from 2008 to 2009, even though natural gas heating prices increased by 17%; The Bedford housing authority maintained an identical natural gas heating utility allowance for its singlefamily, duplex and town house units from 2008 to 2009, even though antural gas heating prices increased by 17%; The Mercer housing authority maintained an identical natural gas heating utility allowance for its inner row, town house and duplex units from 2008 to 2009 even though natural gas prices increased by 11%; The Lawrence, Adams County and Beaver County housing authorities all maintained constant natural gas heating utility allowances from 2007 to 2008, even though natural gas prices increased 13%. Despite the failure of these housing authorities to make any change in their Section 8 utility allowances, each of the housing authorities received a positive SEMAP rating for having reviewed their utility allowances in light of utility data and for having made appropriate adjustments. 66 An additional 30 LHAs were either unable or unwilling to provide data on the utility allowances that they had adopted during the study period. 67 For reasons previously explained, the Philadelphia PHA data was excluded from this analysis. 39 P a g e
54 Table 12. Constant Utility Allowance in Light of 1Year 10%+ Increase in Natural Gas Heating Bill LHA Year Year 1 Year 2 Percent Change Utility Allowance Utility Bill Year Utility Allowance Utility Bill Utility Allowance Utility Bill Unit Type Lawrence 2007 $33 $ $33 $ % 13% Apts Pottsville 2008 $119 $ $119 $ % 17% 1Family Detached Pottsville 2008 $93 $ $93 $ % 17% Inner Row Pottsville 2008 $105 $ $105 $ % 17% End Row Mercer 2008 $34 $ $34 $ % 11% Inner Row Mercer 2008 $38 $ $38 $ % 11% Town House Mercer 2008 $41 $ $41 $ % 11% Duplex Bedford 2008 $102 $ $102 $ % 17% 1Family Detached Bedford 2008 $98 $ $98 $ % 17% Duplex Bedford 2008 $86 $ $86 $ % 17% Huntingdon 2008 $132 $ $132 $ % 17% Town House 1Family Detached Huntingdon 2008 $102 $ $102 $ % 17% Inner Row Huntingdon 2008 $116 $ $116 $ % 17% End Row Adams County Beaver County Beaver County 2007 $56 $ $56 $ % 13% End Row 2008 $43 $ $43 $ % 19% 2007 $43 $ $43 $ % 13% 1Family Detached 1 Family Detached Titusville 2008 $75.24 $ $75.24 $ % 11% All Other Local Housing Authorities did not merely keep their utility allowances constant, but reduced their natural gas heating utility allowances in years when natural gas heating prices increased. Four housing authorities received a positive SEMAP rating for having reviewed their 40 P a g e
55 utility allowances in light of utility data and made appropriate adjustments even though their natural gas heating utility allowances were decreased in a year that natural gas heating prices increased by more than 10%. For example: The Fayette County housing authority reduced its natural gas heating utility allowance by 22% from 2008 to 2009 at the same time natural gas heating prices increased by 19%; The Shamokin housing authority reduced its natural gas heating utility allowance by 22% from 2008 to 2009 even though natural gas heating prices increased by 17%; The York housing authority reduced its natural gas heating utility allowance by 13% from 2008 to 2009 even though natural gas heating prices increased by 19%; The Greene County housing authority reduced its natural gas heating utility allowances by 13% from 2007 to 2008 even though natural gas heating bills increased by 13%. Despite the fact that each of these LHAs reduced their natural gas heating utility allowances in years when natural gas heating prices increased by 10% or more, each LHA received a positive SEMAP score for engaging in a utility allowance review and making an appropriate adjustment to their utility allowances in light of that review. 41 P a g e
56 Table 13. Decreased Utility Allowance in Light of 1Year Increase in Natural Gas Heating Bill LHA Year Year 1 Year 2 Percent Change Utility Allowance Utility Bill Year Utility Allowance Utility Bill Utility Allowance Utility Bill Unit Type Fayette County 2008 $168 $ $129 $ % 19% 1Family Detached Fayette County 2008 $144 $ $112 $ % 19% Duplex Fayette County 2008 $112 $ $87 $ % 19% Apts Shamokin 2008 $156 $ $122 $ % 17% 1Family Detached Shamokin 2008 $116 $ $91 $ % 17% Inner Row Shamokin 2008 $133 $ $104 $ % 17% End Row York 2008 $99 $ $86 $ % 19% 1Family Detached York 2008 $71 $ $62 $ % 19% Inner Row York 2008 $84 $ $73 $ % 19% End Row Greene County 2007 $83 $ $72 $ % 13% Unspecified Greene County 2007 $79 $ $69 $ % 13% Multi Family The failure of the SEMAP process to identify housing authorities who either failed, or refused, to adjust their utility allowances in light of increasing bills is further demonstrated by an identification of housing authorities who kept their utility allowances constant over a twoyear period even while the corresponding energy prices were going up. Keeping utility allowances constant for a twoyear period in fact means that the LHA retained an identical utility allowance for three consecutive years. As shown in the Table below, the fact that the Mercer County and Beaver County housing authorities kept their natural gas heating allowances constant in both 2008 and 2009 means that the utility allowances were the same in 2007, 2008 and The 2008 utility allowance was constant relative to 2007; the utility allowance was again constant in 2008 relative to P a g e
57 Table 14. Constant Utility Allowance in Light of 2Year 10%+ Increase in Natural Gas Heating Bill LHA Mercer County Mercer County Mercer County Beaver County Year Year 1 Year 2 Percent Change Utility Allowance Utility Bill Year Utility Allowance Utility Bill Utility Allowance Utility Bill Unit Type 2007 $34 $ $34 $ % 16% Inner Row 2007 $38 $ $38 $ % 16% Town House 2007 $41 $ $41 $ % 16% Duplex 2007 $43 $ $43 $ % 35% 1Family Detached In sum, the SEMAP process did not accurately identify Pennsylvania LHAs who failed to review actual utility data and make appropriate adjustments to their Section 8 utility allowances when the corresponding natural gas prices were increasing. Out of the 59 Pennsylvania LHAs providing data, 12 (20%) either maintained an identical natural gas heating utility allowance or reduced their utility allowance in years in which the corresponding natural gas heating bill increased by more than 10%. Despite this, in each year, each LHA received a positive SEMAP rating for the utility allowance indicator. Electric Space Heating Utility Allowances and SEMAP Ratings Pennsylvania s LHAs were more likely to maintain a constant utility allowance for electric heating units in light of increasing electric space heating bills than they were for natural gas space heating bills. Nine of the 59 LHAs studied kept their electric space heating utility allowances constant even while electric space heating bills were increasing. For example, as Table 15 below shows: The Nantucket housing authority kept its electric space heating utility allowance constant from 2006 to 2007 even though the electric space heating prices increased by 37%; The Shamokin housing authority kept its electric space heating utility allowance constant from 2007 to 2008 even though the electric space heating prices increased by 18%; The Allegheny County housing authority kept its electric space heating utility allowance constant from 2006 to 2007 even though the electric space heating prices increased by 34%. 43 P a g e
58 Unlike the natural gas analysis, the review of electric space heating utility allowances found a failure to adjust in multiple years. For example: The Beaver county housing authority kept its electric space heating utility allowance constant from 2006 through 2009 even though the corresponding bill increased by 34% from 2006 to 2007; by an additional 26% from 2007 to 2008; and by an additional 14% from 2008 to The Pittsburgh housing authority maintained its electric space heating utility allowance constant from 2006 to 2007 even though electric space heating bills increased by 34%, and again maintained its electric space heating utility allowances constant from 2008 to 2009 even though the corresponding electric space heating bills increased by an additional 14%. Table 15. Constant Utility Allowance in Light of 1Year 10%+ Increase in Electric Heating Bill LHA Year Year 1 Year 2 Percent Change Utility Allowance Utility Bill Year Utility Allowance Utility Bill Utility Allowance Utility Bill Unit Type Bethlehem 2007 $59 $ $59 $ % 18% End Row Bethlehem 2007 $52 $ $52 $ % 18% Inner Row Nantucket 2006 $104 $ $104 $ % 37% 1Family Detached Nantucket 2006 $75 $ $75 $ % 37% Inner Row Nantucket 2006 $89 $ $89 $ % 37% End Row Fayette County Fayette County Fayette County 2008 $86 $ $86 $ % 12% 1Family Detached 2008 $73 $ $73 $ % 12% Duplex 2008 $55 $ $55 $ % 12% Apts Shamokin 2007 $133 $ $133 $ % 18% 1Family Detached Shamokin 2007 $93 $ $93 $ % 18% Inner Row Shamokin 2007 $108 $ $108 $ % 18% End Row Carbon County 2007 $93 $ $93 $ % 18% Apts 44 P a g e
59 Lehigh County Lehigh County Lehigh County Allegheny County Allegheny County Allegheny County Allegheny County Beaver County Beaver County Beaver County Table 15. Constant Utility Allowance in Light of 1Year 10%+ Increase in Electric Heating Bill 2007 $100 $ $100 $ % 18% 1Family Detached 2007 $74 $ $74 $ % 18% Inner Row 2007 $86 $ $86 $ % 18% End Row 2006 $59 $ $59 $ % 34% 2006 $50 $ $50 $ % 34% 1Family Detached Town House 2006 $43 $ $43 $ % 34% Apts 2008 $44 $ $44 $ % 14% Apts 2006 $63 $ $63 $ % 34% Apts 2007 $63 $ $63 $ % 26% Apts 2008 $63 $ $63 $ % 14% Apts Pittsburgh 2006 $102 $ $102 $ % 34% 1Family Detached Pittsburgh 2008 $111 $ $111 $ % 14% Pittsburgh 2006 $86 $ $86 $ % 34% Pittsburgh 2008 $95 $ $95 $ % 14% 1Family Detached Town House Town House Pittsburgh 2006 $73 $ $73 $ % 34% Apts Pittsburgh 2008 $80 $ $80 $ % 14% Apts As with the natural gas utility allowances, an additional group of four LHAs did not merely keep their electric space heating utility allowances constant, but reduced their utility allowances in years when the corresponding electric space heating prices increased by 10% or more. For example, as the Table below shows: The Columbia County housing authority reduced its electric space heating utility allowances by between 3% and 6% from 2007 to 2008 while electric space heating bills increased by 18%; 45 P a g e
60 The Allegheny County housing authority reduced its electric space heating utility allowances by 2% from 2008 to 2009 while electric space heating bills increased by 14%; The Greene County housing authority reduced its electric space heating utility allowance by 10% to 11% while electric space heating bills increased by 12%. Table 16. Decreased Utility Allowance in Light of 1Year 10%+ Increase in Electric Heating Bill LHA Columbia County Columbia County Columbia County Allegheny County Allegheny County Cumberland County Cumberland County Cumberland County Greene County Greene County Year Year 1 Year 2 Percent Change Utility Allowance Utility Bill Year Utility Allowance Utility Bill Utility Allowance Utility Bill 2007 $150 $ $142 $ % 18% Unit Type 1Family Detached 2007 $108 $ $102 $ % 18% Inner Row 2007 $129 $ $125 $ % 18% End Row 2008 $61 $ $60 $ % 14% 2008 $52 $ $51 $ % 14% 2007 $79 $ $77 $ % 18% 1Family Detached Town House 1Family Detached 2007 $58 $ $56 $ % 18% Inner Row 2007 $67 $ $66 $ % 18% End Row 2008 $75 $ $67 $ % 12% 2008 $72 $ $65 $ % 12% Unspecifie d Multi Family Multiple Pennsylvania LHAs received positive SEMAP ratings for the fouryear study period despite maintaining constant electric heating utility allowances in the face of increasing electric heating bills. The data is set forth in Table 17. Consider that: The 2009 Bethlehem electric space heating utility allowance was identical to the 2007 electric space heating utility allowance even though electric space heating prices increased by 19%. 46 P a g e
61 The 2009 electric space heating utility allowances in the Shamokin, Lehigh County and Cumberland County LHAs were identical to the 2007 electric space heating allowance despite electric space heating prices have escalated by 19%. The 2009 electric space heating utility allowance in the Beaver County LHA was identical the 2007 utility allowance even though electric space heating prices increased by between 44% and 68%. For each of these four LHAs, there appears to be a disconnect between the positive SEMAP ratings granted by HUD and the actual performance of the housing authority in adjusting its respective utility allowances when the corresponding electric space heating bill increased. Table 17. Constant Utility Allowance in Light of 2Year 10%+ Increase in Electric Heating Bill LHA Year Year 1 Year 2 Percent Change Utility Allowance Utility Bill Year Utility Allowance Utility Bill Utility Allowance Utility Bill Unit Type Bethlehem 2007 $59 $ $59 $ % 19% End Row Bethlehem 2007 $52 $ $52 $ % 19% Inner Row Shamokin 2007 $133 $ $133 $ % 19% 1Family Detached Shamokin 2007 $93 $ $93 $ % 19% Inner Row Shamokin 2007 $108 $ $108 $ % 19% End Row Lehigh County Lehigh County Lehigh County Beaver County Beaver County Cumberland County 2007 $100 $ $100 $ % 19% 1Family Detached 2007 $74 $ $74 $ % 19% Inner row 2007 $86 $ $86 $ % 19% End Row 2006 $63 $ $63 $ % 68% 2007 $63 $ $63 $ % 44% 1Family Detached 1Family Detached 2007 $67 $ $67 $ % 19% End Row Summary and Conclusions 47 P a g e
62 The SEMAP ratings given to Pennsylvania LHAs on the utility allowance SEMAP indicator (Indicator #4) routinely failed to accurately reflect whether local housing authorities performed adequately in reviewing and adjusting utility allowances. Of the 59 LHAs studied from 2006 to 2009, four (4) received positive SEMAP ratings in all years, even though neither their natural gas nor their electric space heating utility allowances reflected the direction of change in the corresponding home energy bills. In each of these four instances, while the home energy bill (natural gas heating, electric space heating) increased by more than 10%, both the natural gas and electric space heating utility allowances either remained constant or decreased. In an additional 17 instances, the LHA received a positive SEMAP rating even though either its natural gas space heating utility allowance or its electric space heating utility allowance (but not both) failed to reflect changes in the corresponding home energy prices. Overall, more than oneofthree housing authorities (21 of 59) in Pennsylvania received a positive SEMAP rating even when the LHA maintained a constant, or implemented a reduced, utility allowance in years when the corresponding energy bills increased by 10% or more. This figure does not include either: (1) LHAs that increased their utility allowances at a rate less than the corresponding energy bill increased; or (2) reduced their utility allowances in a year when energy prices increased, but increased by less than 10%; or (3) failed to respond to increases in home energy bills over a multiyear period rather than simply the prior year. 48 P a g e
63 PART 4: FINDINGS AND CONCLUSIONS Based on the data and analysis presented above, this report concludes that the following findings are supported: Conclusion #1: Providing adequate utility allowances to Section 8 housing units is particularly important in Pennsylvania given the age and relative energy inefficiency of assisted housing units. 1. The age of housing structures subsidized through an assisted housing program reveals an older housing stock that is likely to be energy inefficient. Roughly half of all assisted housing is 60 years old or older, while more than 60% is at least 50 years old. Very few assisted housing units have been built in the past 25 years. 2. A substantial proportion of assisted housing tenants did not know the age of their heating unit. Of those who did know, the number of heating units aged 20 years or older was by far the largest proportion of heating units by age. Indeed, the number of heating units aged 20 years or older was nearly twice the number of heating units aged 10 year or younger. 3. While a sizable proportion of assisted housing tenants (both in the Northeast and in the MidAtlantic) do not know the age of their water heater (or do not use a separate water 49 P a g e
64 heater for their unit), nearly onein seven of the total assisted housing tenants report having water heaters aged 10years old or older. Conclusion #2: Section 8 housing serves some of the lowest income households in the State of Pennsylvania. 1. Pennsylvania s Section 8 tenants are overwhelmingly extremely lowincome households (with income at or below 30% of AMI). Using Congressional districts as the mechanism to distribute Section 8 tenants geographically, in all but two of Pennsylvania s Congressional districts, between 90% and 100% of Section 8 tenants were either extremely lowincome (at or below 30% of AMI) or very lowincome (at or below 50% of AMI but greater than 30%). 2. The dollars of income provide an absolute measure of lowincome status. The dollar income of Pennsylvania s Section 8 tenants tends to be just over $10,000, supporting average household sizes of between two and three persons. In 13 of Pennsylvania s 19 Congressional districts, average annual income for Section 8 tenants was less than $13, Pennsylvania s Section 8 tenants, on average, have income well below the Federal Poverty Level. In virtually every Congressional district, the average annual income of Section 8 tenants placed them between 70% and 80% of the Poverty Level. Conclusion #3: Pennsylvania s Local Housing Authorities routinely failed to increase Section 8 utility allowances in response to increased home energy bills of any magnitude. 1. Pennsylvania s Local Housing Authorities did not consistently respond to higher natural gas heating bills with increased natural gas heating utility allowances. In only 148 of the 246 instances of increased natural gas prices (60%) did LHAs respond with corresponding increases in natural gas heating utility allowances. 2. In contrast, oneinfive instances of increased natural gas heating prices were associated with a decreased natural gas heating utility allowance (19%). A roughly equal proportion (21%) of instances of increased natural gas bills were matched with utility allowances that remained identical to the preceding year with lower utility bills. 50 P a g e
65 3. In only 60% of the 355 instances of higher electric heating prices, did Pennsylvania s LHAs also implement higher electric heating utility allowances. In 11% of the instances of higher electric space heating prices, electric space heating utility allowances decreased in the face of increasing electric prices as did natural gas utility allowances in light of increased natural gas prices (19%). In nearly threeoften instances of increased electric heating prices (29%), electric space heating utility allowances remained identical to the preceding year. 4. Annual changes in electric nonheating utility allowances, in light of corresponding increases in bills for nonheating electricity usage, mirrored the treatment of space heating bills. Utility allowances for miscellaneous electric usage (generally referred to as other electric usage), increased in only three of every five instances where electric nonheating bills increased. 5. In contrast, it was uncommon for electric utility allowances to decrease when nonheating electric bills were escalating. Such decreases occurred in only six percent (6%) of all instances of increased bills. In 34% of the instances of increased nonheating electric bills, utility allowances for other electric use remained the same from one year to the next. Conclusion #4: Pennsylvania s Local Housing Authorities routinely failed to increase Section 8 utility allowances in response to increased home energy bills of 10% or more. 1. Pennsylvania LHAs frequently failed to modify their natural gas utility allowances in years in which the underlying utility rates increased by 10% or more. When natural gas heating bills increased by 10% or more in a given year, utility allowances were also increased in only 60% of the cases. No assessment is made of the magnitude of the increase in the utility allowances in this section. 2. When natural gas heating utility allowances did not increase in response to 10% increases in natural gas prices, the number of instances when utility allowances remained identical outnumbered those instances where allowances actually decreased in response to increasing bills by a twotoone ratio. In 27% of those instances, the utility allowance remained the same in light of an increase in natural gas space heating prices. In 13% of those instances, the utility allowance decreased in light of an increase in natural gas space heating prices of 10% or more. 51 P a g e
66 3. A nearly identical proportion of electric space heating utility allowances (61%) increased in those instances where electric space heating bills increased by 10% or more. Roughly onethird of utility allowances stayed the same (31%) when the corresponding electric heating bill increased by at least 10%. Proportionately, somewhat fewer electric space heating utility allowances decreased (8%) when electric heating bills increased. 4. Pennsylvania s LHAs were much more likely to make no change in electric nonheating utility allowances, even when the underlying electric bill increased by 10% or more. A noticeably smaller proportion (51%) of electric nonheating utility allowances increased when the underlying bill increased by 10% or more. Moreover, the proportion of utility allowances that stayed constant in light of increasing electric nonheating bills was substantially greater (46%). 5. It is not the case that LHAs were more likely (or even as likely) to reduce their utility allowances in light of increasing prices for nonheating consumption. The difference in LHA behavior involved the propensity of LHAs to do nothing, even when electric nonheating prices increased by 10% or more. In nearly half of the instances when nonheating electric bills increased by 10% or more, the corresponding utility allowance remained identical to the prior year. Conclusion #5: A review of the SEMAP ratings for the years 2006 through 2009 reveals that HUD gave no SEMAP rating of 0 to a Pennsylvania LHA in that fouryear period for the SEMAP Indicator involving utility allowances. A review of the data places the accuracy of these Pennsylvania findings and certifications in doubt. 1. The SEMAP process did not accurately identify Pennsylvania LHAs who failed to review actual utility data and make appropriate adjustments to their Section 8 utility allowances when the corresponding natural gas prices were increasing. Out of the 59 Pennsylvania LHAs providing data, 12 (20%) either maintained an identical natural gas heating utility allowance or reduced their utility allowance in years in which the corresponding natural gas heating bill increased by more than 10%. Despite this, in each year, each LHA received a positive SEMAP rating for the utility allowance indicator. 2. The SEMAP process did not accurately identify Pennsylvania LHAs who failed to review actual utility data and make appropriate adjustments to their Section 8 utility allowances when the corresponding electric space heating prices were increasing. Nine of the 59 LHAs studied kept their electric space heating utility allowances constant even while electric space heating bills were increasing. An additional group of four LHAs did not merely keep their electric space heating utility allowances constant, but reduced their utility allowances in years when the corresponding electric space heating prices increased 52 P a g e
67 by 10% or more. Despite this, in each year, each LHA received a positive SEMAP rating for the utility allowance indicator. 3. The SEMAP ratings given to Pennsylvania LHAs on the utility allowance indicator routinely failed to accurately reflect whether local housing authorities performed adequately in reviewing and adjusting utility allowances. Of the 59 LHAs studied from 2006 to 2009, four (4) received positive SEMAP ratings in all years, even though neither their natural gas nor their electric space heating utility allowances reflected the direction of change in the corresponding home energy bills. In each of these four instances, while the home energy bill (natural gas heating, electric space heating) increased by more than 10%, both the natural gas and electric space heating utility allowances either remained constant or decreased. 4. In an additional 17 instances, the LHA received a positive SEMAP rating even though either its natural gas space heating utility allowance or its electric space heating utility allowance (but not both) failed to reflect changes in the corresponding home energy prices. 53 P a g e
68 PART 5: RECOMMENDATIONS This review examined section 8 utility allowances set by Pennsylvania s Local Housing Authorities (LHA). Pursuant to federal regulations, each LHA is, at a minimum, supposed to review (and revise where appropriate) its utility allowance on an annual basis. In addition, under federal law, each LHA is supposed to adjust its utility allowance whenever there is a rate change of 10% or more. LHAs in Pennsylvania, however, all too frequently fail to comply with these requirements (and lowincome tenants simply do not have the resources to constantly challenge LHA inaction). Under federal statutes and regulations, the legal test for the substantive adequacy of a utility allowance is whether the utility allowance will be sufficient to cover the utility bill of an energy conservative household of modest means. Much can be written about what that phrase means. The basic message, however, is that while there is no guarantee that the entire bill will be paid, LHA discretion is not absolute. If the tenant uses more energy than is paid by the utility allowance, that energy consumption must be more than what would be used by an energy conservative household of modest means. In addition, federal law provides that a utility allowance is to cover all energy consumption that is not within the ability of the tenant to control. Despite these legal constraints, as documented in this report, Pennsylvania s Local Housing Authorities often set utility allowances so as to substantially underpay tenants of public and assisted housing. 54 P a g e
69 This failure of LHAs to comply with federal law imposes substantial costs on the public utilities charged with serving these lowincome customers. As a result of inadequate utility allowances, these tenants are required to pay much of what is supposed to be covered by a utility allowance out of their own pocket. These utility costs can be devastating to a tenant of assisted housing. The analysis above finds that Section 8 housing tenants, on average, live with incomes of below 100% of Poverty Level. 68 It is not clear why HUD utility allowances receive so little attention by persons interested in seeing that the government programs designed to help lowincome customers pay their home energy bills are adequately funded and appropriately administered. Consider that: Unlike LIHEAP, 69 utility allowances are not seasonal benefits, but are yearround; Unlike LIHEAP, utility allowances are intended to cover all types of enduse energy consumption, including electricity and space heating, not simply home heating (or cooling); Unlike LIHEAP, utility allowances are intended to pay the entire bill of a tenant, not merely some portion of it. 70 Given this overview, the data and analysis presented above support implementation of the following remedial actions in Pennsylvania: 1. Electric and natural gas Section 8 utility allowances for Pennsylvania s Local Housing Authorities (LHAs) should be indexed to prices reported by the Pennsylvania Public Utility Commission s (PUC) annual report of prices. 71 The annual PUC reports separately document prices for both heating and nonheating usage. Utility allowances for hot water consumption should also be tied to space heating prices. Each LHA whose administrative office, or its largest complement of units, is in a community served by an electric or natural gas utility whose prices are not reported by the PUC should be exempt from this provision. Otherwise, the LHA should index its utility allowances to the prices reported for the utility serving the community in which the primary administrative office of the LHA is located. 68 General Accounting Office (March 1991). Assisted Housing: Utility Allowances Often Fall Short of Actual Utility Expenses: Volume I, General Accounting Office: Washington D.C. General Accounting Office (March 1991). Assisted Housing: Utility Allowances Often Fall Short of Actual Utility Expenses: Volume II, General Accounting Office: Washington D.C. 69 The federal LowIncome Home Energy Assistance Program (LIHEAP). 70 This is, of course, subject to the constraints mentioned earlier in this section. 71 See, e.g., Pennsylvania Public Utilities Commission: Rate Comparison Report, April 2010 (reports issued annually). 55 P a g e
70 2. Each LHA retaining an identical Section 8 utility allowance for two or more consecutive years for a particular end use and/or housing unit type should be required to publish the utility rates upon which the decision to retain the identical utility allowance was based, including an identification of the tariff(s) used and a calculation of a bill at typical consumption levels by enduse applying those tariff(s), including all riders. 3. Each Pennsylvania LHA s Section 8 utility allowance should be independently audited for the years 2005 through 2011 inclusive to determine the extent to which, if at all, the allowance was modified under circumstances when it should have been. In those instances when a utility allowance inappropriately failed to increase when underlying prices indicated they should have, a calculation of the payment necessary to fully compensate the tenants, including a payment increment reflecting the lost time value of the allowances inappropriately withheld, should be made. Payment of the benefit inappropriately withheld should be made immediately. Evictions for nonpayment of rent should be stayed pending the payment of the compensation. 4. Act 129 energy efficiency dollars should be directed toward Pennsylvania Section 8 housing units. 72 Not only should LHAs aggressively seek out energy efficiency dollars to be directed toward Section 8 units, but LHAs should also work with Pennsylvania natural gas and electric utilities to design and implement energy efficient utility allowances to incentivize improvements in the efficiency of energy consuming systems in Pennsylvania s Section 8 housing. California s Designed for Comfort (DfC) energy efficient utility allowance program can serve as a basis upon which to model a Pennsylvania counterpart. Finally, the State of Pennsylvania should take an active role in ensuring that its Local Housing Authorities comply with federal regulatory requirements regarding the promulgation of utility allowances. LHAs are, after all, creatures of state law. While they are independent local authorities, it is not inappropriate for the State to take an active role in enforcing compliance with requirements that adequate and appropriate energy assistance be provided, both to ensure the affordability of housing and to ensure the affordability of home energy. The State, through either regulatory or legislative action, should adopt the following procedures: Each natural gas and electric utility shall, whenever it implements a retail residential rate change, including any rate change attributable to fuel costs or purchased gas costs, notify all LHAs within their service territory of the rate change. 72 See, Roger Colton (2009). Energy Efficient Utility Allowances as a Usage Reduction Tool in Pennsylvania, prepared for Pennsylvania Utility Law Project, Harrisburg: PA. See also, Roger Colton (2009). The Contribution of Utility Bills to the Unaffordability of Lowincome Rental Housing in Pennsylvania, prepared for Pennsylvania Utility Law Project, Harrisburg: PA. 56 P a g e
71 Each LHA shall, by September 1 of each year, submit to the Pennsylvania Department of Community and Economic Development (DCED) each schedule of utility allowances to be in effect for the immediately upcoming year. Each LHA filing shall document the adjustments to be made for changes in home energy prices, including adjustments for rate changes of 10% or more retroactive to the first month in which the rate change became effective. If an LHA fails to make its annual filing, or fails to adjust its utility allowances to reflect rate changes during the year, including adjustments for rate changes of 10% or more retroactive to the first month in which the rate change became effective, the Department of Community and Economic Development shall promulgate utility allowances for the LHA and shall mandate their implementation effective October 1 of the filing year and retroactive, if appropriate, to the first month after a rate change of 10% or more became effective. Each LHA should be required to post on a web site, in a conspicuous location, the utility allowances in effect for the current fiscal year and prior fiscal year, along with the utility rates upon which those allowances are based. The report of each LHA s Independent Auditor documenting compliance with all SEMAP ratings, including SEMAP Indicator #4 (relating to utility allowances) shall also be available on each LHA s web site. 73 Any tenant adversely affected by the failure of an LHA to promulgate or revise a utility allowance may, upon complaint to DCED, seek DCED review of whether a LHA has complied with requirements that utility allowances be adequately promulgated and updated. Upon finding that an LHA has not adequately promulgated and/or updated a utility allowance, DCED shall promulgate utility allowances for the LHA effective immediately going forward as well as effective retroactive to the date on which such utility allowance should have been placed into effect. Board members, staff and Independent Auditors, should share in the liability to tenants for underpaid utility allowances in the event that an LHA s SEMAP certifications are found to be false, inaccurate or misleading with respect to SEMAP Indicator #4 (relating to utility allowances). 73 In the event that an LHA does not maintain a web site, the LHA should make this material publicly accessible in a manner acceptable to DCED. 57 P a g e
72 APPENDIX A: PENNSYLVANIA HOUSING AUTHORITIES PROVIDING UTILITY ALLOWANCE SCHEDULES UPON REQUEST Housing Authority Identification Housing Authority Name Town (Pennsylvania) PA004 Allentown HA Allentown PA014 Beaver County Housing Authority Beaver PA085 Bedford County Housing Authority Bedford PA088 Centre County HA Bellefonte PA011 Bethlehem HA Bethlehem PA083 Columbia County HA Bloomsburg PA064 Bradford HA Blossburg PA050 Tioga County HA Blossburg PA030 Carbondale HA Carbondale PA075 Cumberland County HA Carlisle PA007 Chester HA Chester PA086 Clarion County Housing Authority Clarion 58 P a g e
73 PA051 Bucks County HA Doylestown PA038 Lackawanna County HA Dunmore PA081 Lehigh County HA Emmaus PA013 Erie City Housing Authority Erie PA091 Adams County HA Gettysburg PA018 Westmoreland County Hsg Authority Greensburg PA008 Harrisburg HA Harrisburg PA044 Hazleton HA Hazleton PA069 Blair County Housing Authority Hollidaysburg PA048 Indiana Co HA Indiana PA019 Johnstown Housing Authority Johnstown PA039 Armstrong County Housing Authority Kittanning PA036 Lancaster City HA Lancaster PA090 Lancaster County HA Lancaster PA068 Sullivan County HA Laporte PA052 Lebanon County HA Lebanon PA067 Carbon County HA Lehighton PA041 Mifflin County HA Lewistown PA040 Clinton County HA Lock Haven PA033 Meadville Housing Authority Meadville PA092 Snyder County HA Middleburg PA027 Huntingdon County Housing Authority Mount Union PA043 Nanticoke HA Nanticoke PA076 Northampton County HA Nazareth PA026 Housing Authorrity Co of Lawrence New Castle PA073 Wyoming County HA Nicholson 59 P a g e
74 PA059 Oil City Housing Authority Oil City PA002 Philadelphia HA Philadelphia PA006 Allegheny County Housing Authority Pittsburgh PA001 Pittsburgh HA Pittsburgh PA037 Pottsville HA Pottsville PA061 Jefferson County Housing Authority Punxsutawney PA009 Reading HA Reading PA003 Scranton HA Scranton PA055 Shamokin HA Shamokin PA020 Mercer County Housing Authority Sharon PA035 Dauphin County HA Steelton PA028 Monroe County HA Stroudsburg PA074 Susquehanna County HA Susquehanna PA058 Titusville Housing Authority Titusville PA015 Fayette County Housing Authority Uniontown PA078 Wayne County HA Waymart PA045 Greene County Housing Authority Waynesburg PA046 Chester County HA West Chester PA047 Wilkes Barre HA Wilkes Barre PA021 Lycoming County HA Williamsport PA023 Delaware County HA Woodlyn PA022 York HA York 60 P a g e
75 APPENDIX B: PENNSYLVANIA HOUSING AUTHORITIES EITHER UNWILLING OR UNABLE TO PROVIDE UTILITY ALLOWANCE SCHEDULES UPON REQUEST HA Identification HA name Town (Pennsylvania) PA031 Altoona Housing Authority Altoona PA029 Somerset County Housing Authority Boswell PA049 Bradford City Housing Authority Bradford PA010 Butler County Housing Authority Butler PA034 Franklin County HA Chambersburg PA065 Clearfield County Housing Authority Clearfield PA025 Connellsville Housing Authority Connellsville PA066 Corry Housing Authority Corry PA087 Erie County HA Corry PA077 Potter County Housing Authority Coudersport PA032 Montour County HA Danville 61 P a g e
76 PA063 Dubois Housing Authority Du Bois PA024 Easton HA Easton PA056 Franklin City Housing Authority Franklin PA054 Elk County Housing Authority Johnsonburg PA057 Luzerne County HA Kingston PA082 Union County HA Lewisburg PA005 McKeesport HA Mc Keesport PA072 Fulton County Housing Authority McConnellsburg PA060 Northumberland County HA Milton PA012 Montgomery County HA Norristown PA089 Venango County Housing Authority Oil City PA Hsg Dev Corp Philadelphia PA042 Pittston HA Pittston PA071 Berks County HA Reading PA016 Schuylkill County HA Schuylkill Haven PA080 McKean County Housing Authority Smethport PA053 Sunbury HA Sunbury PA079 Warren County Housing Authority Warren PA017 Washington County Housing Authority Washington 62 P a g e

77 APPENDIX C: PUBLIC RECORDS REQUEST TO AND RESPONSE FROM PHILADELPHIA HUD OFFICE REGARDING SEMAP RATINGS 63 P a g e
HOME ENERGY AFFORDABILITY
 HOME ENERGY AFFORDABILITY IN NEW YORK: The Affordability Gap (2011) Prepared for: New York State Energy Research Development Authority (NYSERDA) Albany, New York Prepared by: Roger D. Colton Fisher, Sheehan
HOME ENERGY CONSUMPTION EXPENDITURES BY INCOME (PENNSYLVANIA) May Prepared For: Pennsylvania Utility Law Project (PULP Harrisburg, Pennsylvania
 May Prepared For: Pennsylvania Utility Law Project (PULP Harrisburg, Pennsylvania") HOME ENERGY CONSUMPTION EXPENDITURES BY INCOME (PENNSYLVANIA) May 2009 Prepared For: Pennsylvania Utility Law Project (PULP Harrisburg, Pennsylvania May 2009 HOME ENERGY CONSUMPTION AND EXPENDITURES BY
HOME ENERGY CONSUMPTION EXPENDITURES BY INCOME (PENNSYLVANIA) May 2009 Prepared For: Pennsylvania Utility Law Project (PULP Harrisburg, Pennsylvania May 2009 HOME ENERGY CONSUMPTION AND EXPENDITURES BY
Prepared By. Roger Colton Fisher, Sheehan & Colton Belmont, Massachusetts. Interim Report on Xcel Energy s Pilot Energy Assistance Program (PEAP):
:") Interim Report on Xcel Energy s Pilot Energy Assistance Program (PEAP): 2010 Interim Evaluation Prepared For: Xcel Energy Company Denver, Colorado Prepared By Roger Colton Fisher, Sheehan & Colton Belmont,
Interim Report on Xcel Energy s Pilot Energy Assistance Program (PEAP): 2010 Interim Evaluation Prepared For: Xcel Energy Company Denver, Colorado Prepared By Roger Colton Fisher, Sheehan & Colton Belmont,
STRUCTURING A LOW-INCOME "WIRES CHARGE"
 STRUCTURING A LOW-INCOME "WIRES CHARGE" FOR NEW JERSEY Prepared For: Citizens Against Rate Escalation Camden, New Jersey (CARE) Prepared By: Roger D. Colton Fisher, Sheehan & Colton Public Finance and
FSC S LAW & ECONOMICS INSIGHTS
 FSC S LAW & ECONOMICS INSIGHTS Issue 16-1 Fisher, Sheehan & Colton, Public Finance and General Economics Jan/Feb 2016 IN THIS ISSUE Data and theory, both, support conclusion that utility bills do not effectively
Indiana Billing and Collection Reporting: Natural Gas and Electric Utilities (2007)
") Indiana Billing and Collection Reporting: Natural Gas and Electric Utilities (2007) Prepared For: Coalition to Keep Indiana Warm Indianapolis, Indiana Prepared By: Roger D. Colton Fisher, Sheehan & Colton
Indiana Billing and Collection Reporting: Natural Gas and Electric Utilities (2007) Prepared For: Coalition to Keep Indiana Warm Indianapolis, Indiana Prepared By: Roger D. Colton Fisher, Sheehan & Colton
Colorado PUC E-Filings System
 Page 1 of 134 Public Service Company of Colorado s (PSCo) Pilot Energy Assistance Program (PEAP) and Electric Assistance Program (EAP) 2011 Final Evaluation Report Colorado PUC E-Filings System Prepared
HOME ENERGY AFFORDABILITY
 HOME ENERGY AFFORDABILITY IN NEW YORK: The Affordability Gap (2008 2010) Prepared for: New York State Energy Research Development Authority (NYSERDA) Albany, New York Prepared by: Roger D. Colton Fisher,
STRUCTURING A LOW-INCOME "WIRES CHARGE"
 STRUCTURING A LOW-INCOME "WIRES CHARGE" FOR OHIO Prepared For: Ohio State Legal Services Columbus, Ohio For Presentation To: Ohio Electric Competition Roundtable On Universal Service Prepared By: Roger
AN OUTCOMES PLANNING APPROACH
 AN OUTCOMES PLANNING APPROACH TO SERVING TPU LOW-INCOME CUSTOMERS Prepared for: Tacoma Public Utilities (TPU) City of Tacoma (Washington) PREPARED BY: ROGER COLTON FISHER, SHEEHAN & COLTON PUBLIC FINANCE
THE HOME ENERGY AFFORDABILITY GAP 2012
 TOTAL US $38,597,642,593 $38,573,122,158 99.9 The Index (2 nd Series) indicates the extent to which the has increased between the base year and the current year. In the total United States this Index was
STRUCTURING A LOW-INCOME "WIRES CHARGE"
 STRUCTURING A LOW-INCOME "WIRES CHARGE" FOR INDIANA Prepared For: Indiana Citizens Action Campaign Indianapolis, Indiana For Presentation To: Indiana Forum on Electric Industry Restructuring Indiana Utility
WRONG-WAY STREET: REVERSING THE SUBSIDY FLOWING FROM LOW-INCOME CUSTOMERS IN A COMPETITIVE ELECTRIC INDUSTRY. By:
 WRONG-WAY STREET: REVERSING THE SUBSIDY FLOWING FROM LOW-INCOME CUSTOMERS IN A COMPETITIVE ELECTRIC INDUSTRY By: Roger D. Colton Fisher, Sheehan & Colton Public Finance and General Economics 34 Warwick
PECO Energy Customer Assistance Program For Customers Below 50 Percent of Poverty Final Evaluation Report
 PECO Energy Customer Assistance Program For Customers Below 50 Percent of Poverty Final Evaluation Report October 2006 Table of Contents Table of Contents Executive Summary... i Introduction...i Evaluation...
SOURCES AND METHODS USED TO ESTIMATE COMPONENTS OF CHANGES IN SECTION 8 EXPENDITURES FROM 1996 TO 2003 by Will Fischer and Barbara Sard
 820 First Street NE, Suite 510 Washington, DC 20002 Tel: 202-408-1080 Fax: 202-408-1056 center@cbpp.org www.cbpp.org Revised August 23, 2005 SOURCES AND METHODS USED TO ESTIMATE COMPONENTS OF CHANGES IN
Meeting the Energy Needs of Low-Income Households in Connecticut Final Report
 Meeting the Energy Needs of Low-Income Households in Connecticut Final Report Prepared for Operation Fuel, Inc / December 2016 Table of Contents Table of Contents Executive Summary... i Study Methodology...
BEFORE THE NEW JERSEY BOARD OF PUBLIC UTILITIES
 Exhibit RA- BEFORE THE NEW JERSEY BOARD OF PUBLIC UTILITIES IN THE MATTER OF ESTABLISHMENT OF A UNIVERSAL SERVICE FUND PURSUANT TO SECTION OF THE ELECTRIC DISCOUNT AND ENERGY COMPETITION ACT OF BPU Docket
Prepared for: Iowa Department of Human Rights Des Moines, Iowa WINTER WEATHER PAYMENTS:
 WINTER WEATHER PAYMENTS: The Impact of Iowa s Winter Utility Shutoff Moratorium On Utility Bill Payments by Low-Income Customers February 2002 PREPARED BY: Roger D. Colton Fisher Sheehan & Colton Public
The Burden of FY 2008 Residential Energy Bills on Low-Income Consumers
 ECONOMIC OPPORTUNITY STUDIES 400 NORTH CAPIT OL STREET, SUITE G-80, WASHINGTON, D.C. 20001 Tel. (202) 628 4900 Fax (202) 393 1831 E -mail info@opportunitystudies.org The Burden of FY 2008 Residential Energy
HOME ENERGY AFFORDABILITY
 HOME ENERGY AFFORDABILITY IN NEW YORK: The Affordability Gap (2012) Prepared for: New York State Energy Research Development Authority (NYSERDA) Albany, New York Prepared by: Roger D. Colton Fisher, Sheehan
Risks of On-Bill Financing
 MODEL TESTIMONY Risks of On-Bill Financing Fisher, Sheehan & Colton Weatherization Leveraged Partnerships Project FSC S LAW & ECONOMICS INSIGHTS Issue 15-04 Fisher, Sheehan & Colton, Public Finance and
Comment to the President s Advisory Panel on Tax Reform Submitted by The Enterprise Foundation/Enterprise Social Investment Corporation June 10, 2005
 Comment to the President s Advisory Panel on Tax Reform Submitted by The Enterprise Foundation/Enterprise Social Investment Corporation June 10, 2005 Introduction and Overview The Enterprise Foundation
Poverty in the United States in 2014: In Brief
 Joseph Dalaker Analyst in Social Policy September 30, 2015 Congressional Research Service 7-5700 www.crs.gov R44211 Contents Introduction... 1 How the Official Poverty Measure is Computed... 1 Historical
Department of State Affairs
 Department of State Affairs Model Legislation for Fair Share Payment Program to Assure Affordable Electric and Natural Gas Services DEVELOPED FOR AARP By: Barbara R. Alexander Consumer Affairs Consultant
Research Library. Treasury-Federal Reserve Study of the U. S. Government Securities Market
 Treasury-Federal Reserve Study of the U. S. Government Securities Market INSTITUTIONAL INVESTORS AND THE U. S. GOVERNMENT SECURITIES MARKET THE FEDERAL RESERVE RANK of SE LOUIS Research Library Staff study
UGI Utilities, Inc. Gas Division And UGI Penn Natural Gas, Inc. Universal Service Program. Final Evaluation Report
 UGI Utilities, Inc. Gas Division And UGI Penn Natural Gas, Inc. Universal Service Program Final Evaluation Report July 2012 Table of Contents Table of Contents Executive Summary... i Evaluation Questions
Employer-Sponsored Health Insurance in the Minnesota Long-Term Care Industry:
 Minnesota Department of Health Employer-Sponsored Health Insurance in the Minnesota Long-Term Care Industry: Status of Coverage and Policy Options Report to the Minnesota Legislature January, 2002 Health
EXECUTIVE SUMMARY. Introduction
 EXECUTIVE SUMMARY Introduction Interest in employer-sponsored retiree health plans remains very high as coverage under the new Medicare prescription drug benefit begins. Employers, retirees and their families,
Implementing Small Area Fair Market Rents (SAFMRs) Implementation Guidebook
 Implementation Guidebook") Implementing Small Area Fair Market Rents (SAFMRs) Implementation Guidebook Contents Guidebook overview... 2 1. What are SAFMRs, where do they apply, and when do they need to be implemented?... 5 1.1 Background...
Implementing Small Area Fair Market Rents (SAFMRs) Implementation Guidebook Contents Guidebook overview... 2 1. What are SAFMRs, where do they apply, and when do they need to be implemented?... 5 1.1 Background...
Moving Forward. Moving to Work Program. Annual Plan for Fiscal Year 2011
 Moving Forward Moving to Work Program Annual Plan for Fiscal Year 2011 San Diego Housing Commission 1122 Broadway, Suite 300 San Diego, CA 92101 www.sdhc.org TABLE OF CONTENTS Section I: Introduction
LIHEAP Targeting Performance Measurement Statistics:
 LIHEAP Targeting Performance Measurement Statistics: GPRA Validation of Estimation Procedures Final Report Prepared for: Division of Energy Assistance Office of Community Services Administration for Children
State of New Mexico 2017 National Housing Trust Fund Allocation Plan
 State of New Mexico 2017 National Housing Trust Fund Allocation Plan The National Housing Trust Fund (NHTF) was established under Title I of the Housing and Economic Recovery Act of 2008, Section 1131.
MEDFORD HOUSING AUTHORITY Medford, Massachusetts FINANCIAL STATEMENTS
 Medford, Massachusetts FINANCIAL STATEMENTS TABLE OF CONTENTS Independent Auditors' Report... 4 Management s Discussion and Analysis... 7 Basic Financial Statements Statement of Net Position... 5 Statement
HOUSING AUTHORITY OF WASHINGTON COUNTY, OREGON BOND ISSUANCE GUIDELINES
 HOUSING AUTHORITY OF WASHINGTON COUNTY, OREGON BOND ISSUANCE GUIDELINES 2016 PAB GUIDE Page 1 TABLE OF CONTENTS I. INTRODUCTION.... 3 II. III. IV. POLICY STATEMENT...3 TENANT INCOME REQUIREMENTS.. 4 BOND
Housing Authority of the Town of Vernon Financial Statements and Supplemental Data With Independent Auditors Reports December 31, 2016
 Financial Statements and Supplemental Data With Independent Auditors Reports December 31, 2016 209 State St Bangor, Maine 04401-5412 TABLE OF CONTENTS PAGE Management's Discussion & Analysis i-x Independent
PROGRAM ON HOUSING AND URBAN POLICY
 Institute of Business and Economic Research Fisher Center for Real Estate and Urban Economics PROGRAM ON HOUSING AND URBAN POLICY WORKING PAPER SERIES WORKING PAPER NO. W06-001B HOUSING POLICY IN THE UNITED
A RATEPAYER FUNDED HOME ENERGY AFFORDABILITY PROGRAM
 EB-00-00 Exhibit K. A RATEPAYER FUNDED HOME ENERGY AFFORDABILITY PROGRAM FOR LOW-INCOME HOUSEHOLDS: A Universal Service Program for Ontario s Energy Utilities Prepared for: Low-Income Energy Network (LIEN)
Peoples Natural Gas 2017 Universal Service Program Evaluation Final Report
 Peoples Natural Gas 2017 Universal Service Program Evaluation Final Report August 2017 Table of Contents Table of Contents Executive Summary... i Evaluation... i Evaluation Questions... ii Peoples Universal
Determinants of Federal and State Community Development Spending:
 Determinants of Federal and State Community Development Spending: 1981 2004 by David Cashin, Julie Gerenrot, and Anna Paulson Introduction Federal and state community development spending is an important
RESIDENTIAL ASSISTANCE FOR FAMILIES IN TRANSITION (RAFT) FY07 ADMINISTRATIVE GUIDELINES
 FY07 ADMINISTRATIVE GUIDELINES") RESIDENTIAL ASSISTANCE FOR FAMILIES IN TRANSITION (RAFT) FY07 ADMINISTRATIVE GUIDELINES These guidelines will govern the administration of the program and will be incorporated into the Commonwealth of
RESIDENTIAL ASSISTANCE FOR FAMILIES IN TRANSITION (RAFT) FY07 ADMINISTRATIVE GUIDELINES These guidelines will govern the administration of the program and will be incorporated into the Commonwealth of
PECO Energy Universal Services Program. Final Evaluation Report
 PECO Energy Universal Services Program Final Evaluation Report April 2006 Table of Contents Table of Contents Executive Summary... i Introduction...i Customer Needs Assessment...v PECO s Universal Service
HOUSING AUTHORITY OF THE CITY OF DANBURY FINANCIAL STATEMENTS AND SUPPLEMENTARY INFORMATION FOR THE YEAR ENDED DECEMBER 31, 2016
 FINANCIAL STATEMENTS AND SUPPLEMENTARY INFORMATION FOR THE YEAR ENDED DECEMBER 31, 2016 WITH REPORT OF INDEPENDENT AUDITORS TABLE OF CONTENTS FOR THE YEAR ENDED DECEMBER 31, 2016 Contents Page Report of
THE HOME ENERGY AFFORDABILITY GAP 2017
 TOTAL US $38,597,642,593 $47,648,609,571 123.4 The Index (2 nd Series) indicates the extent to which the has increased between the base year and the current year. In the total United States this Index
Insert the following text (underlined) Chapter 14: Payment Standards and Utility Allowances and in Chapter 22: Project-Based Vouchers
 Chapter 14: Payment Standards and Utility Allowances and in Chapter 22: Project-Based Vouchers") Pg. 1 Insert the following text (underlined) Chapter 14: Payment Standards and Utility Allowances and in Chapter 22: Project-Based Vouchers 1) Chapter 14 will be amended to include: UTILITY ALLOWANCES
Pg. 1 Insert the following text (underlined) Chapter 14: Payment Standards and Utility Allowances and in Chapter 22: Project-Based Vouchers 1) Chapter 14 will be amended to include: UTILITY ALLOWANCES
Analysis of Affordability of Cost Recovery: Communal and Network Energy Services. September 30, By Clare T. Romanik The Urban Institute
 Analysis of Affordability of Cost Recovery: Communal and Network Energy Services September 0, 1998 By Clare T. Romanik The Urban Institute under contract to The World Bank EXECUTIVE SUMMARY The following
Florida s Assisted Housing Tenants:
 Florida s Assisted Housing Tenants: Income, Rent and Demographics Prepared by Shimberg Center for Housing Studies University of Florida P.O. Box 115703 Gainesville, Florida 32611 Florida s Assisted Housing
Mashpee Housing Authority For the period July 1, 2010 through September 30, 2012
 Official Audit Report Issued April 24, 2014 Mashpee Housing Authority For the period July 1, 2010 through September 30, 2012 State House Room 230 Boston, MA 02133 auditor@sao.state.ma.us www.mass.gov/auditor
Allegheny County Housing Authority
 Allegheny County Housing Authority Single Audit September 30, 2016 FOR THE YEARS ENDED SEPTEMBER 30, 2016 AND 2015 TABLE OF CONTENTS Independent Auditor s Report Management s Discussion and Analysis i
HOUSING AFFORDABILITY IN MAINE: TAKING STOCK
 HOUSING AFFORDABILITY IN MAINE: TAKING STOCK March 2009 This study was conducted by the Housing Affordability Initiative at the MIT Center for Real Estate for the Maine Affordable Housing Coalition. Contributors:
FSC'S LAW & ECONOMICS INSIGHTS
 FSC'S LAW & ECONOMICS INSIGHTS Issue 02-1 Fisher, Sheehan & Colton, Public Finance and General Economics Jan/Feb 2002 IN THIS ISSUE Payment patterns and Iowa s winter shutoff moratorium NOTE TO READERS
Volume Author/Editor: John F. Kain and John M. Quigley. Volume URL:
 This PDF is a selection from an out-of-print volume from the National Bureau of Economic Research Volume Title: Housing Markets and Racial Discrimination: A Microeconomic Analysis Volume Author/Editor:
Home Energy Reports of Low-Income vs. Standard Households: A Parable of the Tortoise and the Hare?
 Home Energy Reports of Low-Income vs. Standard Households: A Parable of the Tortoise and the Hare? Anne West, Cadmus, Portland, OR Jim Stewart, Ph.D., Cadmus, Portland, OR Masumi Izawa, Cadmus, Portland,
FSC S LAW & ECONOMICS INSIGHTS
 FSC S LAW & ECONOMICS INSIGHTS Issue 12-6 Fisher, Sheehan & Colton, Public Finance and General Economics Nov/Dec 2012 IN THIS ISSUE What Does a Utility Buy through a Low-Income Rate Affordability Program?
National Housing Trust Fund Allocation Plan
 National Housing Trust Fund Allocation Plan Community Economic Development Association of Michigan June 14, 2016 Ed Gramlich National Low Income Housing Coalition A Very Brief Overview National Housing
September 14, Declines in Tenant Incomes Have Exacerbated Voucher Funding Shortfall
 820 First Street NE, Suite 510 Washington, DC 20002 Tel: 202-408-1080 Fax: 202-408-1056 center@cbpp.org www.cbpp.org September 14, 2009 FUNDING SHORTFALLS CAUSING CUTS IN HOUSING VOUCHERS Tens of Thousands
DEPARTMENT OF HOUSING AND URBAN DEVELOPMENT
 DEPARTMENT OF HOUSING AND URBAN DEVELOPMENT This chapter presents the budget and program estimates for the Department of Housing and Urban Development. In order to better address the needs of communities
Section Eight Management Assessment Program (SEMAP) Reform Discussion
 Reform Discussion") Section Eight Public Housing Assessment Systems: Section Eight Management Assessment Program (SEMAP) Reform Discussion U.S. DEPARTMENT OF HOUSING AND URBAN DEVELOPMENT September 2016 Rationale For Change
Section Eight Public Housing Assessment Systems: Section Eight Management Assessment Program (SEMAP) Reform Discussion U.S. DEPARTMENT OF HOUSING AND URBAN DEVELOPMENT September 2016 Rationale For Change
AGENCY: Office of Assistant Secretary for Policy Development and Research, HUD.
 This document is scheduled to be published in the Federal Register on 02/18/2014 and available online at http://federalregister.gov/a/2014-03461, and on FDsys.gov Billing Code 4210-67 DEPARTMENT OF HOUSING
MISSISSIPPI REGIONAL HOUSING AUTHORITY IV ANNUAL REPORT AND RECOMMENDATIONS
 MISSISSIPPI REGIONAL HOUSING AUTHORITY IV ANNUAL REPORT AND RECOMMENDATIONS 2016 O n behalf of the Mississippi Regional Housing Authority IV s Board of Commissioners, staff, and residents it is our pleasure
Seattle Community Power Works
 Home Program Non-Participant Survey Seattle Community Power Works WSU Energy Program Evaluation Team WSUEEP13-010 February 25, 2013 The Demographics of Owner and Renter-Occupied Households in Seattle Differ
West Valley City: Fair Housing Equity Assessment
 West Valley City: Fair Housing Equity Assessment Prepared by Bureau of Economic and Business Research David Eccles School of Business University of Utah James Wood John Downen DJ Benway Darius Li April
TACOMA HOUSING AUTHORITY
 TACOMA HOUSING AUTHORITY To: Northwest Justice Project THA Housing Choice Voucher Landlord Advisory Group Community Partners From: April Black, Director of Real Estate Management and Housing Services Date:
Are Affordability Perceptions Reducing Household Mobility and Exacerbating the Housing Shortage?
 Are Affordability Perceptions Reducing Household Mobility and Exacerbating the Housing Shortage? National Housing Survey Topic Analysis Q4 2017 Published on June 27, 2018 2018 Fannie Mae. Trademarks of
Allegheny Power Universal Service Programs. Final Evaluation Report
 Allegheny Power Universal Service Programs Final Evaluation Report July 2010 Table of Contents Table of Contents Executive Summary... ES1 Introduction... ES1 Evaluation Questions... ES2 Customer Needs
The Affordable Housing Crisis and the People it Affects. February America s Neighbors
 America s Neighbors: The Affordable Crisis and the People it Affects February 2004 1 [This page intentionally left blank] 2 : The Affordable Crisis and the People it Affects Executive Summary The true
Water and Sewer Utility Rate Studies
 Final Report Water and Sewer Utility Rate Studies July 2012 Prepared by: HDR Engineering, Inc. July 27, 2012 Mr. Mark Brannigan Director of Utilities 591 Martin Street Lakeport, CA 95453 Subject: Comprehensive
PECO Energy Universal Services Program. Final Evaluation Report
 PECO Energy Universal Services Program Final Evaluation Report October 2012 Table of Contents Table of Contents Executive Summary... i Introduction... i Customer Needs Assessment... iv PECO s Universal
NJ Comfort Partners Affordability Evaluation Final Report
 NJ Comfort Partners Affordability Evaluation Final Report Prepared for the New Jersey Comfort Partners Working Group February 2004 Table of Contents Table of Contents Executive Summary... i Introduction...i
Philadelphia Gas Works Customer Responsibility Program. Final Evaluation Report
 Philadelphia Gas Works Customer Responsibility Program Final Evaluation Report February 2006 Table of Contents Table of Contents Executive Summary... i Introduction...i Customer Responsibility Program...
RED WING HOUSING AND REDEVELOPMENT AUTHORITY RED WING, MINNESOTA FINANCIAL STATEMENTS DECEMBER 31, 2017
 RED WING, MINNESOTA FINANCIAL STATEMENTS DECEMBER 31, 2017 TABLE OF CONTENTS INDEPENDENT AUDITOR'S REPORT 1-2 MANAGEMENT S DISCUSSION AND ANALYSIS 3-8 FINANCIAL STATEMENTS Statement of Net Position 9-10
Position Paper on Income and Wages Approved August 4, 2016
 Position Paper on Income and Wages Approved August 4, 2016 1. The Context on Income and Wages Lack of sufficient income and household savings are the main reasons people seek help from EFAA to meet their
Low-Income Housing Tax Credit (LIHTC) Program. Guideline. This Guideline is Effective September 12, 2018
 Program. Guideline. This Guideline is Effective September 12, 2018") Low-Income Housing Tax Credit (LIHTC) Program Guideline 2018 This Guideline is Effective September 12, 2018 Table of Contents PREFACE... 3 I. Background... 3 II. Pre-Application Meeting... 4 III. Submission
Low-Income Housing Tax Credit (LIHTC) Program Guideline 2018 This Guideline is Effective September 12, 2018 Table of Contents PREFACE... 3 I. Background... 3 II. Pre-Application Meeting... 4 III. Submission
PULP PENNSYLVANIA UTILITY LAW PROJECT
 BEFORE THE PENNSYLVANIA HOUSE OF REPRESENTATIVES LOCAL GOVERNMENT COMMITTEE Testimony of Patrick M. Cicero, Esq. Executive Director Pennsylvania Utility Law Project Regarding HB 1405 February 13, 2018
FirstEnergy Universal Service Programs. Final Evaluation Report
 FirstEnergy Universal Service Programs Final Evaluation Report January 2017 Table of Contents Table of Contents Executive Summary... i Introduction... i Evaluation Questions... ii Pennsylvania Customer
Puerto Rico Department of Housing 5 Year Plan for Fiscal Years Annual Plan for Fiscal Year 2000
 U.S. Department of Housing and Urban Development Office of Public and Indian Housing Puerto Rico Department of Housing 5 Year Plan for Fiscal Years 2000-2004 Annual Plan for Fiscal Year 2000 NOTE: THIS
USDA RURAL DEVELOPMENT HOUSING PROGRAMS
 Housing Assistance Council 1025 Vermont Ave. NW Suite 606 Washington DC 20005 Phone: (202) 842-8600 Fax: (202) 347-3441 E-mail: hac@ruralhome.org USDA RURAL DEVELOPMENT HOUSING PROGRAMS FY 2009 Year-End
760 CMR 65.00: REGULATION GOVERNING THE MASSACHUSETTS SHORT-TERM HOUSING TRANSITION PROGRAM Section
 760 CMR 65.00: REGULATION GOVERNING THE MASSACHUSETTS SHORT-TERM HOUSING TRANSITION PROGRAM Section 65.01 Application 65.02 Definitions 65.03 Eligibility for Program Participation 65.04 Determination of
Multifamily Buildings (5 or more units)
") May 2017 Multifamily Buildings (5 or more units) Full-Service Energy Efficient Building Services Authorization and Agreement for Multifamily Rental Building Energy Assessment Building Contact Information
May 2017 Multifamily Buildings (5 or more units) Full-Service Energy Efficient Building Services Authorization and Agreement for Multifamily Rental Building Energy Assessment Building Contact Information
HUD Seeks Significant Improvements to Moving to Work Demonstration, But Additional Changes Needed
 820 First Street NE, Suite 510 Washington, DC 20002 Tel: 202-408-1080 Fax: 202-408-1056 center@cbpp.org www.cbpp.org January 21, 2015 HUD Seeks Significant Improvements to Moving to Work Demonstration,
November 5, Dear Sir or Madam:
 Regulations Division Office of the General Counsel U.S. Department of Housing and Urban Development 451 7th Street, S.W. Room 10276 Washington, DC 20410-0500 Subject: Request for Comments on Ending Hold
MONROE COUNTY HOUSING AUTHORITY FINANCIAL STATEMENTS AND SUPPLEMENTARY INFORMATION AND REPORTS YEAR ENDED DECEMBER 31, 2017
 FINANCIAL STATEMENTS AND SUPPLEMENTARY INFORMATION AND REPORTS YEAR ENDED DECEMBER 31, 2017 TABLE OF CONTENTS YEAR ENDED DECEMBER 31, 2017 INDEPENDENT AUDITORS' REPORT 1 MANAGEMENT S DISCUSSION AND ANALYSIS
STATE OF NEW MEXICO ARTESIA HOUSING AUTHORITY ANNUAL FINANCIAL REPORT FOR THE YEAR ENDED JUNE 30, 2016
 STATE OF NEW MEXICO ANNUAL FINANCIAL REPORT FOR THE YEAR ENDED JUNE 30, 2016 INTRODUCTORY SECTION STATE OF NEW MEXICO Board of Commissioners and Management June 30, 2016 Board of Directors Chairperson
INTRODUCTION TO LOW INCOME HOUSING TAX CREDITS. Claudia O Grady, Vice President Multifamily Finance Utah Housing Corporation
 INTRODUCTION TO LOW INCOME HOUSING TAX CREDITS Claudia O Grady, Vice President Multifamily Finance Utah Housing Corporation Low Income Housing Tax Credits The LIHTC Program was created by the 1986 Tax
Program Assessment Report 2017
 This document is made available electronically by the Minnesota Legislative Reference Library as part of an ongoing digital archiving project. http://www.leg.state.mn.us/lrl/lrl.asp Evaluating Affordable
James G. Zupka, CPA, Inc. Certified Public Accountants
 CLERMONT METROPOLITAN HOUSING AUTHORITY AUDIT REPORT FOR THE YEAR ENDED SEPTEMBER 30, 2017 James G. Zupka, CPA, Inc. Certified Public Accountants BASIC FINANCIAL STATEMENTS AND SINGLE AUDIT TABLE OF CONTENTS
Financial Statements March 31, 2016 Housing Authority of the City of Pueblo
 Financial Statements Housing Authority of the City of Pueblo Table of Contents Independent Auditor s Report... 1 Management's Discussion and Analysis... 4 Basic Financial Statements Statement of Net Position...
May 17, Housing Sector Overview
 May 17, 2017 Housing Sector Overview Housing Finance Policy Center May 17, 2017 AFFORDABLE HOUSING: In general, housing for which the occupant(s) is/are paying no more than 30 percent of his or her income
NATIONAL ENERGY ASSISTANCE DIRECTORS ASSOCIATION 2011 NATIONAL ENERGY ASSISTANCE SURVEY FINAL REPORT
 NATIONAL ENERGY ASSISTANCE DIRECTORS ASSOCIATION 2011 NATIONAL ENERGY ASSISTANCE SURVEY FINAL REPORT The National Energy Assistance Directors Association The National Energy Assistance Directors Association
A $7.25 MINIMUM WAGE WOULD BE A USEFUL STEP IN HELPING WORKING FAMILIES ESCAPE POVERTY by Jason Furman and Sharon Parrott
 820 First Street NE, Suite 510 Washington, DC 20002 Tel: 202-408-1080 Fax: 202-408-1056 center@cbpp.org www.cbpp.org January 5, 2007 A $7.25 MINIMUM WAGE WOULD BE A USEFUL STEP IN HELPING WORKING FAMILIES
Summary of Building Together Summit III October 12-13, 2011
 BTS III Summary Page 1 November 16, 211 Summary of Building Together Summit III October 12-13, 211 Context Based on widely held concerns that the Qualified Allocation Plan (QAP) in Michigan had become
OKLAHOMA HOUSING FINANCE AGENCY Affordable Housing Tax Credits Program (AHTC) Carryover Application Form
 Carryover Application Form") OKLAHOMA HOUSING FINANCE AGENCY Affordable Housing Tax Credits Program (AHTC) Carryover Application Form 100 N.W. 63 rd St., Suite 200 Oklahoma City, OK 73116 or P.O. Box 26720 Oklahoma City, OK 73126-0720
OKLAHOMA HOUSING FINANCE AGENCY Affordable Housing Tax Credits Program (AHTC) Carryover Application Form 100 N.W. 63 rd St., Suite 200 Oklahoma City, OK 73116 or P.O. Box 26720 Oklahoma City, OK 73126-0720
Rental Assistance Division of the Georgia Department of Community Affairs
 Financial Statements (With Supplementary Information) and Independent Auditor's Report June 30, 2016 Index Page Financial Section Independent Auditor's Report 3 Managements' Discussion and Analysis 6 Basic
Financial Statements December 31, 2017 and 2016 Wisconsin Good Samaritan Housing, Inc. D/B/A Sunset Fields HUD Project No. 075-EE058 Fennimore,
 Financial Statements December 31, 2017 and 2016 Wisconsin Good Samaritan Housing, Inc. D/B/A HUD Project No. 075-EE058 Fennimore, Wisconsin Table of Contents December 31, 2017 and 2016 Independent Auditor
Socio-economic Series Changes in Household Net Worth in Canada:
 research highlight October 2010 Socio-economic Series 10-018 Changes in Household Net Worth in Canada: 1990-2009 introduction For many households, buying a home is the largest single purchase they will
BOULDER COUNTY HOUSING AUTHORITY Boulder, Colorado. FINANCIAL STATEMENTS December 31, 2011
 Boulder, Colorado FINANCIAL STATEMENTS December 31, 2011 Table of Contents Page Independent Auditor s Report Management s Discussion and Analysis i iii Basic Financial Statements Balance Sheet 1 Statement
Baltimore s Conundrum:
 Baltimore s Conundrum: Charging for Water / Wastewater Services that Community Residents Cannot Afford to Pay November 2017 Prepared for: Food and Water Watch Baltimore, Maryland Prepared by: Roger Colton
Housing Commission Report
 Housing Commission Report To: From: Subject: Housing Commission Meeting: April 20, 2017 Agenda Item: 5B Chair and Housing Commission Barbara Collins, Housing Manager Preserving Our Diversity (POD) Subsidy
U.S. Department of Housing and Urban Development Community Planning and Development IX. FIELD OFFICE REVIEW OF RESALE/RECAPTURE PROVISIONS...
 U.S. Department of Housing and Urban Development Community Planning and Development Special Attention of: Notice: CPD 12-003 All Secretary's Representatives All State/Area Coordinators Issued: January,
HOUSING AUTHORITY OF THE CITY OF MERIDEN Meriden, Connecticut FINANCIAL STATEMENTS
 Meriden, Connecticut FINANCIAL STATEMENTS TABLE OF CONTENTS Page Independent Auditors' Report... 4 Management s Discussion and Analysis... 8 Basic Financial Statements Statement of Net Position... 8 Statement
Roger D. Colton, Fisher, Sheehan & Colton Beth Sachs, Vermont Energy Investment Corporation Janice DeBarros, Citizens Conservation Corporation
 Models of Public and for Private Investment in Energy Efficiency Low-Income Housing Roger D. Colton, Fisher, Sheehan & Colton Beth Sachs, Vermont Energy Investment Corporation Janice DeBarros, Citizens