REPORT OF THE WORKING GROUP EMPLOYMENT, PLANNING & POLICY FOR THE TWELFTH FIVE YEAR PLAN ( )
|
|
|
- Kristian Williams
- 5 years ago
- Views:
Transcription
1 REPORT OF THE WORKING GROUP ON EMPLOYMENT, PLANNING & POLICY FOR THE TWELFTH FIVE YEAR PLAN ( ) GOVERNMENT OF INDIA LABOUR, EMPLOYMENT & MANPOWER (LEM) DIVISION PLANNING COMMISSION DECEMBER 2011
2 FOREWORD The Approach Paper for the Twelfth Five Year Plan ( ) emphasizes the need for achieving faster, sustainable and more inclusive growth. Inclusiveness as a multidimensional concept needs to be translated into employment and livelihood opportunities. The demographic dividend, which the country presently enjoys, if properly harnessed can add to the growth potential. Accordingly, Labour and Employment sector is likely to play a crucial role in the planning process. The Steering Committee on Labour, Employment & Skill Development for the Twelfth Five Year Plan ( ) under the chairpersonship of Dr. Narendra Jadhav, Member, Planning Commission, had set up six Working Groups, one of them being the Working Group on Employment, Planning & Policy. The Working Group further set up two Sub Groups, namely, (i) Sub Group on Employment/Unemployment Projections under chairpersonship of Dr. Arup Mitra, Professor, Institute of Economic Growth and (ii) Sub Group on Creation of Employment Opportunities under chairpersonship of Dr. Santosh Mehrotra, DG, Institute of Applied Manpower Research. Three meetings of the Working Group were held on , and The final report of the Working Group is based on the reports of the two Sub Groups and detailed deliberations of the three meetings. Visions enshrined in the Approach Paper for the Twelfth Five Year Plan and draft National Employment Policy of the Ministry of Labour & Employment etc. have also been taken into account. I would like to acknowledge with gratitude the contribution of Dr. Arup Mitra and Dr. Santosh Mehrotra, chairpersons of the two Sub Groups for preparing their respective reports, Dr. T.S. Papola and other members of the Working Group/ Sub Groups for valuable guidance and participation. Smt. Sunita Sanghi, Adviser(LEM) for her insight, Shri K.N. Pathak, Joint Adviser (LEM)/ Convener for necessary coordination, Shri K.Sensarma, Director(LEM) for providing technical inputs and officials of the LEM Division for their active involvement and support. (Dr. Ashok Sahu) Principal Adviser & Chairperson of the Working Group Planning Commission New Delhi December, 2011
3 Contents Chapter/ Table PAGE NO. no. I. Introduction 1-6 II. Employment Challenges for the Twelfth Five Year 7-9 Plan III. Major Findings of the Report of Sub-Group on Employment/Unemployment Projections IV. Major Findings of the Report of Sub-Group for Creation of Employment Opportunities V. Major Recommendations for the Twelfth Five Year Plan Appendix All India Employment and Unemployment Indicators 38 Table A 1 (per 1000) Appendix Estimated persons/ person-days (in million) in broad 38 Table A II activity status Annexure-I Constitution of Working Group on Employment, Planning & Policy for the Twelfth Five Year Plan ( ) Annexure-II Constitution of Sub-Group on Employment/ Unemployment Projections Annexure-III Constitution of Sub-Group on Creation of Employment Opportunities Annexure-IV Report of Sub-Group on Employment/Unemployment Projections Annexure-V Report of Sub-Group on Creation on Employment Opportunities Annexure-VI Minutes of the 1 st Meeting of the Working Group held on Annexure-VII Minutes of the 2 nd Meeting of the Working Group held on Annexure-VIII Minutes of the 3 rd Meeting of the Working Group held on Table 1a Average Annual Long Term Growth Rates of Labour 10 Force Table 1b Labour Force Projection based on the Annual Average 10 Growth Rate Table 2 Trends in Population 11 Table 3 Estimated Population and Labour Force 11 Table 4 Long Term Growth Rate in Employment 12 Table 5 Sectoral Growth Rate in Value Added and 12 Employment Table 6 a Estimates of Workers based on Long Term Growth 13 Rate in Employment Table 6 b Sectoral Distribution of Employment 13 Table 6 c Sectoral Employment 14 Table 7 a Employment Elasticity from Past Data 15 Table 7 b Employment Projection 15
4 Table 7 c Sectoral Employment for VA growth of 8% 15 Table 7d Sectoral Employment for VA growth of 9% 16 Table 8 a Employment Projection with Changing TFPG 17 Table 8 b Sectoral Employment with VA growth rates under 18 changing TFPG Table 9 Workforce Estimates for , & Table 10 Employment across various sectors, , &
5 I. Introduction 1.1 Background A Working Group on Employment, Planning & Policy for the 12 th Five Year Plan ( ) was set up under the Steering Committee on Labour, Employment & Skill Development by the Planning Commission with Dr. Ashok Sahu, Principal Adviser (Labour, Employment & Manpower), Planning Commission, as the Chairman. The constitution of the Working Group and the Terms of Reference are given in Annexure- I. The Working Group subsequently co-opted Smt. Amarjeet Kaur, DDG, Ministry of Labour & Employment and Shri B.N. Nanda, DG, Labour Bureau as Members The Working Group in its first meeting set up two sub Groups viz. (i) Sub Group on Employment/Unemployment Projections with Dr. Arup Mitra, Professor, Institute of Economic Growth(IEG), as the Chairman; and (ii) Sub Group on Creation of Employment Opportunities with Dr. Santosh Mehrotra, DG, Institute of Applied Manpower Research (IAMR) as the Chairman. The constitution of the Sub-Groups with their Terms of Reference is given in Annexure II and III respectively. The Reports of the Sub-Groups are given at Annexure IV and V The Working Group held three meetings on , and The minutes of these meetings are given in Annexure VI, VII and VIII respectively. Based on the Reports/Materials received and the deliberations made, the Report of the Working Group has been prepared. In addition, certain strategies indicated in the Approach Paper to the Twelfth Five Year Plan and Draft National Employment Policy have also been utilized The Working Group has taken cognizance to the issue of inclusive growth which is one of the key components identified for 11 th Five Year Plan and to be carried with added strength in the 12 th Five Year Plan. It lays emphasis on the view that employment generation should be focused on different segments of labour force organized, unorganized, rural, urban, educated, uneducated, skilled, unskilled, male, female and youth and that employment will be source of livelihood for all. Never the less, priority needs to be accorded to the disadvantaged sections of society such as SC/ST/OBC/minorities/women and differently abled. This could be better ensured through generation of sustainable and good quality 1
6 employment as a substantial number of such households employed even though might be living below poverty line. The Working Group also underlined the significance of adoption of labour intensive technology. Based on its review of the trends of employment and unemployment, the Working Group suggested policy initiatives required to stimulate decent jobs during the 12 th Five Year Plan period. 1.2 Economic Planning and Employment Achieving a high rate of growth of GDP has been the focus of the Indian planning process along with substantial employment generation for creating adequate work opportunities for the rising labour force. Prevalence of unemployment leads to poverty entailed with numerous social problems. In the background of this, providing employment to the labour force has been an area of central concern in all Five Year Plans which have been according due priority to achieve this goal. Initially the generation of employment was viewed as a part of the process of development and not as a goal to be pursued independently of economic growth. The general impression was that employment growth would trickle down resulting in improvement of employment situation. Though employment is treated as a corollary to growth, the trends of the last two decades show that growth has not yielded desired results in the area of employment generation. The rate of growth of employment was found to be slower than the rate of growth of economy. In the light of that, successive plans, strategies, policies and programmes were designed and redesigned to bring about a focus on employment generation as a specific objective The employment situation in the Indian context has not been quite impressive particularly keeping in view the unskilled and semi-skilled work force. During , Indian economy grew by 3.5 per cent against the projected growth of 5 per cent.per annum. Employment grew by 2 per cent per annum while the growth in labor force was 2.5 per cent, thus, resulting in overall increase in unemployment. During 1970s, 1980s, and 1990s, a number of employment generation and poverty alleviation schemes were implemented with thrusts on gainful employment to the people in the labour force on one hand and improvement in level of income on the other. Some such schemes like Integrated Rural Development Programme, National Rural Employment Programme and Mahatma Gandhi National Rural Employment Guarantee Act (MGNREGA) etc. being presently pursued emerged as a vehicle to provide wage employment through public works programme. It also 2
7 saw emergence of schemes to promote self employment and entrepreneurship through provision of assets, skills and other support to the unemployed and the poor. These steps led to steady expansion of employment levels. However, the rate of growth of employment lagged behind the rate of growth of labour force. A notable rising trend has been observed in unemployment among educated youth. Another area of major concern has been the quality of employment and level of productivity. These developments are indicative of the fact that growth alone cannot generate sustainable and quality employment opportunities. 1.3 Employment Situation in India A comparison of major employment-unemployment indicators between (NSS 61 st round) and (NSS 66 th round) brings out some important facts: As per the usual principal and subsidiary status (UPSS) {usual principal status (UPS) + subsidiary status (SS)} or usual status (US), 40% of the population belonged to the labour force in against 43% in The labour force participation rate (LFPR) for females was significantly lower than that of males both in rural and urban areas both during and Similarly, both as per the current weekly status (CWS) and current daily status (CDS) the LFPR had declined in vis-à-vis LFPR was 38.4% as per CWS while it was 36.5% (CDS) in vis-à-vis 40.7% and 38.1% during respectively. Work force participation (WPR) was again lower in vis-à-vis irrespective of the approach for measurement. WPR was 39.2%, 37% and 34.1% respectively as per the UPSS, CWS and CDS during In comparison, the rates were 42%, 38.9% and 35% during respectively. The WPR for males was marginally higher in rural areas than urban areas as per UPSS in but was lower in rural areas under the CWS and CDS approaches. But for females, WPR was higher in rural areas under all the three approaches. Unemployment rate (UR) had declined during vis-à-vis under all the three approaches. However, the extent of decline was maximum under CDS 6.6% in as compared to 8.2% in Under UPSS, the decline was only from 2.3% to 2% while the decline was from 4.4% to 3.6% under CWS. 3
8 During , UR was significantly lower in rural areas (1.6%) vis-à-vis urban areas (3.4%) under UPSS. Under CWS, rural areas had an UR of 3.3% as compared to 4.2%. In sharp contrast, under CDS, UR was higher in rural areas (6.8%) than urban areas (5.8%) A comparison of estimated persons in the labour force, work force and those unemployed between and brings out certain important facts: While under UPSS, the number of persons in the labour force remained nearly same (468.8 million persons in and 469 million persons in ), the increase in labour force during vis-à-vis was more pronounced under CDS than under CWS. Under CWS, the labour force increased from million persons in to million persons in i.e. by 5.2 million persons. Under CDS, the increase was from million person-days on a day to million person-days on a day i.e. by 11.7 million person-days on a day. The work force expansion was also maximum under CDS. It increased from million person-days on a day in to million persons-days on a day i.e. by 18 million person-days. Under CWS, the increase was to the tune of 9 million persons from million persons in to million persons in In contrast, under UPSS, the increase was only 1.1 million persons from million persons in to 459 million persons in In line with the above data, estimated number of unemployed people declined sharply by 6.3 million person-days under CDS it was 28 million person-days on a day in vis-à-vis 34.3 million person-days on a day in Under UPSS, the decline was to the tune of 1.5 million persons while under CWS it was 3.9 million persons over this 5 year period. Under all the three approaches, number of persons/ person-days in the labour force and work force were higher in rural areas vis-à-vis urban areas. The number of females in work force has declined both for rural areas and urban areas under all the three approaches during vis-à-vis Details can be seen at Appendix Table A.1 and A.II 4
9 1.4 Women Workers As per UPSS approach, million women in rural areas and 22.8 million in urban areas were in the workforce in This implied decline in women workforce vis-à-vis when 124 million rural and 24.6 million urban women were working. The NSS 66 th round has indicated that an estimated million women in rural areas were neither working nor available for work as they attended educational institutions (as per the UPSS approach) in Similarly, in urban areas, million women were neither working nor available for work as they attended educational institutions In the rural areas, women are mainly involved as cultivators and agricultural labourers. In the urban areas, almost 80 per cent of the women workers are working in the unorganized sectors such as household industries, petty trades and services, buildings and construction. The khadi and village industries are one of the largest employers of women workers Casualisation among women workers is rising. During the period to , the proportion of casual workers among rural females increased from 32.6% to 39.9% and among urban females from 16.7% to 19.6%. The corresponding figures are 32.9% and 38% for rural males and 14.6% and 17% for urban males for the years and respectively. 1.5 Relevance of different Approaches for Measurement of Labour Force, Work Force and Unemployment National Sample Survey Organisation (NSSO) has been conducting quinquennial surveys on a regular basis since to generate national level data on employment and unemployment in India. The NSSO has, over time, developed and standardized measures of employment and unemployment. The NSSO collects data on employment and unemployment using three broad measures or approaches: (i) Usual Principal & Subsidiary Status; (ii) Current Weekly Status; and (iii) Current Daily Status Usual Principal & Subsidiary Status (UPSS) has two components, viz., Usual Principal Status and Subsidiary Status. It relates to the activity status of a person during the reference period of last 365 days preceding the date of survey. The activity status on which a person spent relatively longer time (major time criterion) is considered the Usual Principal Status 5
10 (UPS). To decide the usual principal activity status of a person, a two-stage classification is used to determine the broad activity status, viz., employed, unemployed and out of labour force within which, the detailed activity status is determined depending on the relatively longer time spent in the activities. Besides the usual principal activity status, a person could have pursued some economic activity for a smaller period, not less than 30 days. The status in which such economic activity is pursued is the subsidiary economic status of that person. If these two are taken together, the measure of Usual Principal & Subsidiary Status (UPSS) i.e. Usual Status (US) is obtained Current Weekly Status (CWS) of a person is the activity status obtained for a person during a reference period of 7 days preceding the date of survey. According to this, a person is considered as a worker if he/she has performed any economic activity at least for one hour on any day of the reference week, and is obtained on the basis of daily activities performed on each day of the reference period Current Daily Status (CDS) of a person is determined on the basis of his/her activity status on each day of the reference week using a priority-cum-major time criterion (day to day labour time disposition). Broadly, a person is considered working (employed) for the full day if he/she worked for 4 hours or more during the day Estimates of workforce on UPSS basis can be interpreted as the maximum possible number of workers within a broad based definition. It, therefore, captures chronic unemployment. On the other hand, CWS measures seasonality of employment better; the difference between the unemployment rates on UPSS and CWS basis would provide one measure of seasonal unemployment. CDS captures quality of employment better as it does not treat the underemployed as the employed, effectively tackling the issue of disguised unemployment. Therefore, all the three approaches UPSS, CWS and CDS are complementary to each other. 6
11 2. Employment Challenges for the Twelfth Five Year Plan 2.1 Need for correct estimates/projection of employment and unemployment at frequent intervals Correct estimation of employment and unemployment is essential for proper planning and policy recommendation for a Five Year Plan. Normally there are three approaches (UPSS, CWS and CDS) used in estimating employment/unemployment. Decision on the proper approach to be followed would help in correct estimation and planning. The current employment/ unemployment situation should form the basis for projections for the 12 th Plan period. At the same time the estimates of employment/ unemployment should be available at frequent intervals for more effective policy interventions. 2.2 Expand employment opportunities in the formal sector, including the Services Sector One major challenge to be addressed for the 12 th Plan period is how to increase the share of formal sector employment opportunities. Movements and transformation of employment from informal sector to formal sector needs to be analysed. Incentives have to be given for expanding organized sector employment. Employment interventions already initiated by the Government need to be evaluated. Service sectors like insurance, finance and banking, tourism are going to major generator of employment opportunities. Sector specific strategies need to be adopted generate employment opportunities. Rigidity in labour laws is often quoted as a major constraint in augmenting organized sector employment. However, the focus should be to promote labour market flexibility without compromising fairness to labour. 2.3 Expand employment opportunities especially in the manufacturing sector When any economy grows, over a period of time the contribution of agriculture sector to GDP should decline while that of manufacturing and services sectors should increase. Concomitant with this the share of employment should also increase in manufacturing and services sector. Unfortunately, for the Indian economy although contribution to GDP from the agriculture has declined sharply (less than 20%) but the number of people employed in 7
12 agriculture continues to be very high. Although some expansion in employment has taken place in the manufacturing and non-manufacturing sectors, however, a large part of the same falls under informal employment. It is necessary to have urban and rural labour market planning for shifting surplus work force from rural areas. However, option for geographic targeting is limited considering the endowment of different States. Manufacturing sector, however, would have limits in generating new employment as more and more industries adopt capital intensive technologies. Global trends in employment indicate that employment in service sector has increased. Hence, strategies in India must lay emphasis on the service sector for generating more employment. 2.4 Addressing the Issue of Productivity, both in the formal and informal sectors Increasing employment as well as productivity is equally important. Productivity is a relationship between output and inputs. Productivity can be measured either in terms of all factors of production combined (total factor productivity) or in terms of labour productivity alone. In the long term, productivity is the main determinant of income growth. Productivity gains increase real income in the economy which can be distributed through higher wages. Strategy for employment generation must be to augment productive employment opportunities during the 12 th Plan period both in in the formal and informal sectors. Innovation would have to play a major role for augmenting productivity. 2.5 Address problems of specific categories gender, educated, youth, minorities, SC/ST, differently abled people NSS data shows that female employment has declined both in rural areas and urban areas in recent years. This is a major concern and needs to be addressed during the 12 th Plan period. Women workers are the most vulnerable to job losses in case of any global crisis. Unemployment among educated people is going to be a major issue during the 12 th Plan period. India is one of the few countries which have the phenomenon of educated unemployment in large number numbers. The major reason behind this is the dearth of vocational and technical education among youths. Similarly, the issue of promoting employment opportunities for minorities, SC/ST and differently abled people assumes importance. Employment needs and education provided need to be matched. Hence, the role 8
13 of skill development programmes would occupy centrestage in any employment strategy for the 12 th Plan period. This will help in harnessing the demographic dividend. 2.6 Problems of the Working Poor Problems of the working poor need to be highlighted as there is always the possibility of this segment to relapse into distress and unemployment unless they are given due attention and protection. 2.7 Employment in the face Recurrent Economic Crises Issues of infrastructure, economies of scale and management needs to be addressed for meeting any subsequent global economic crisis. Any global crisis is bound to have some impact on the Indian economy as the level of international integration increases. Service sectors including IT, tourism, civil aviation and banking and real sector involving manufacturing exports are likely to be impacted. Downsizing in sectors like IT and finance would be common. Indian workers in sectors with high exposure to global markets including those employing large number of women workers have faced job cuts during the last global crisis of 2008 civil aviation, textiles, leather, marine products, gems & jewellery. Employment and income should be the central focus of government s stimulus package. Priority should be given to public spending programmes that have high multiplier effect on employment. However, scope for fiscal stimulus to deal with such crises would be limited given the high level of fiscal deficits at the Centre and in States. Hence, fiscal sustainability becomes a major challenge to be tackled through effective resource generation and expenditure measures. 9
14 3. Major Findings of the Report of the Sub-Group on Employment/Unemployment Projections 3.1Projection/ Estimation of Labour Force during the Twelfth Five Year Plan Based on the population census data (and census projections) the population figures are derived for the NSS survey years 1983, , and (as given by Sundaram, 2007) and The figures are taken for rural male, rural female, urban male and urban female separately In order to project the labour force for the 12 th Plan period, the NSS labour force participation rate was applied to the absolute number of population, arriving at the absolute number of persons in the labour force. Based on these figures the average annual long term growth rates (Table 1a) have been calculated which are used for projection (Table 1b). Table 1a: Average Annual Long Term Growth Rates of Labour Force Year Rural Male Rural Urban Male Urban Female Female Usual Status 1983 to Weekly Status 1983 to Daily Status 1983 to Table 1b: Labour Force Projection Based on the Annual Average Growth Rate (1983 to ) (in Million) Year Rural Male Rural Urban Urban Total Female Male Female Usual Status Weekly Status Daily Status
15 3.1.3 An alternative set of estimate has been offered by the EPW Research Foundation (EPWRF): The EPWRF Estimate of Population: India has seen a deceleration in population growth rate since The population and the population growth rates between the censuses since 1951 are presented in Table 2. Assuming the rate of decline in growth rate to be in line with the past trend, the population growth rate for 2021 is projected by EPWRF at 13.2% (Figure 1A). Based on this, the population figures for the Twelfth Five Year Plan period have been estimated further. Table 2: Trends in Population Census Population (in million) Percentage Growth in Population Source: Census of India as reported by EPWRF Labour Force Projection by EPWRF: It is assumed that growth in labor force will be higher than the population growth rate given the country s demographic structure. Given the high growth prospects as well as stress on employment creation by the policy makers, it is expected that the elasticity would rise gradually. Though the 64 th and 66 th rounds have shown a decline in female participation, it may pick up in a couple of years to come considering the movements of past rounds. Based on these assumptions, the population, labour force, work force and unemployment for the Twelfth Five Year Plan is expected to be as shown in Table 3. Table 3: Estimated Population and Labour Force Population (in million) Labour Force (in million) Per '000 population (410) (413) (417) (420) (423) Source: Estimated by EPWRF Work Force Projection In the first step, the NSS work participation rates has been applied to the absolute numbers of population derived from the census results. As regards the work participation the usual 11
16 principal-cum-subsidiary status, weekly status and the daily status rates have been considered. Three sets of absolute numbers of work force are then derived The long run employment growth has been calculated based on the absolute numbers of work force for the NSS survey years. The growth rates are reported in Table 4. On the other hand from the national accounts data, the growth rates in aggregate GDP and sectoral GDP have been derived for the period through (Table 5). Table 4: Long Run Growth Rate in Employment (1983 to ) (% p.a) Categories Usual Status Weekly Status Daily Status (ps+ss) Rural Male Rural Female Urban Male Urban Female Total Based on NSS per thousand distribution applied to population figures derived from census estimates. Table 5: Sectoral Growth Rate (% per annum) in Value Added ( to ) and Employment (1983 to ) Value Added Growth Employment Growth (usual status: ps+ss) Agriculture Mining Manufacturing Utilities Const- Ruction Trade etc. Transport etc. Other Services Total
17 3.2 Alternative Projections A. Projection: Set One set of estimate is worked out by simply extrapolating on the basis of the long term growth rate in employment (1983 to ). Table 6a: Estimates of Workers Based on Long Term Growth Rate in Employment Year Rural Male Usual Status Rural Female Urban Male Urban Female Total Weekly Status Daily Status However, to work out the projected figures at the sectoral level it was presumed that the sectoral shares have to undergo changes over time. For example, the share of agriculture has to decline over time and that of manufacturing has to increase. The desired sectoral distribution at the beginning and at the end of the 12 th plan is expected to be as follows: Year Agriculture Mining and Table 6b: Sectoral Distribution of Employment (%) Manufacturing Utilities Construction Trade etc. Transport etc. Other Services Quarrying Total Based on the desired sectoral distribution and the projected total employment figures, the sectoral employment figures in absolute terms have been worked out (Table 6c). 13
18 Table 6c: Sectoral Employment (in million) Year Manufacturing Agriculture Mining and Quarrying Utilities Construction Usual Status Trade etc. Transport etc. Other Services Total Weekly Status Daily Status B. Projection: Set The second set calculates the gross employment elasticity based on the GDP growth rates and the employment growth rates. Using the employment elasticity from the past data it works out the employment projections both for 8 and 9 per cent growth rates in aggregate value added and the implied sectoral growth rates accordingly Given the employment growth rate and the value added growth rate as given in Table 4 and 5 respectively over the past years, the employment elasticity has been calculated. If the aggregate value added growth is expected to be 8 or 9 per cent during the 12 th Plan then what would be the sectoral growth rates? The sectoral growth rates have been calculated under the assumption that sectoral composition is going to be the same as observed in the past. Given the employment elasticity from the past data the implied employment growth rates over the 12 th Plan have been worked out. Based on the implied growth rate the employment in absolute terms for the year and has been worked out. Given the projected total employment, the sectoral figures have been generated by applying the desired sectoral shares (Table 7c for 8% growth and Table 7d for 9% growth). 14
19 Employment Elasticity based on Past Data Table 7a: Employment Elasticity from Past Data Agriculture Mining and Quarrying Manufacturing Utilities Construction Trade etc. Transport etc. Other Services Total For a projected growth rate of 8 per cent p.a. the implied employment growth rate turns out to be 2.62 per cent p.a. over the 12 th Five Year Plan period, given the past employment elasticity. Similarly, for a projected growth rate of 9 per cent p.a., the implied employment growth rate worked out as 2.94 per cent p.a. Table 7b: Employment Projection (in million) Year Usual Status Weekly Status Daily Status VA Growth 8 % Same Employment Elasticity(0.33) Employment Growth 2.62% VA Growth 9 % Same Employment Growth Employment 2.94% Elasticity(0.33) Year Table 7c: Sectoral Employment (in million) for VA Growth of 8 % Agriculture Mining and Quarrying Manufacturing Utilities Construction Trade etc. Transport etc. Other Services Usual Status Weekly Status Daily Status Total 15
20 Table 7d: Sectoral Employment (in million) for VA Growth of 9 % Year Agriculture Mining and Quarrying Manufacturing Utilities Construction Usual Status Trade etc. Transport etc. Other Services Total Weekly Status Daily Status C. Projection: Set In the estimate provided above it was presumed that the employment elasticity would not change in the future years. However what has been noticed from the past data is that the employment elasticity has been declining steadily. This is partly because of rise in capital intensity and partly because of rise in the total factor productivity growth. Hence, the assumption of constant employment elasticity may be unrealistic because of the rapid technological progress that is taking place as a result of technology import. A third set of estimate is derived by presuming that employment elasticity would decline and total factor productivity growth may shoot up in the future years. This would mean lesser employment growth unless the overall output growth accelerates considerably. In the past ( ), the total factor productivity growth (TFPG) was experienced at 2 per cent per annum (Goldar and Mitra, 2010). If TFP is expected to grow at a rate of 3 per cent per annum and the overall employment elasticity declines to 0.24 over the 12 th plan period, then a third set of estimate of employment is provided for and under the assumption that the value added continues to follow the long term average growth rate of 5.87 per cent per annum Alternately it is presumed that the TFPG rises to 3 per cent per annum, the employment elasticity declines only marginally to 0.31 from 0.33 as observed over the period (
21 through ) and the overall value added growth rate picks up to 8 or 9 per cent per annum. The overall employment growth rates then turns out as 2.48 and 2.79 per cent per annum respectively for VA growth rate of 8 per cent and 9 per cent. Accordingly the sectoral employment figures have been worked out by applying the desired sectoral shares to the projected total (Table 8b). Table 8a: Employment Projection with Changing TFPG (in million) VA Growth : 5.87 % p.a. over 12th Plan TFPG : 3 per cent per annum Employment Elasticity: 0.24 Year Usual Status Weekly Status Daily Status Implied Employment Growth VA Growth of 8 % p.a. over 12 th Plan TFPG : 3 per cent per annum Employment Elasticity: Implied Employment Growth TFPG : 3 per cent per annum VA Growth of 9 % p.a. over 12 th Plan Employment Elasticity: Implied Employment Growth
22 Year Table 8b: Sectoral Employment with VA growth rates under changing TFPG(in million) Mining and Trade Transport Other Agriculture Manufacturing Utilities Construction Total Quarrying etc. etc. Services Usual Status Sectoral Employment when VA grows at 5.87 per cent p.a. and Employment at 1.42 per cent p.a Weekly Status Sectoral Employment when VA grows at 5.87 per cent p.a. and Employment at 1.42 per cent p.a Daily Status Sectoral Employment when VA grows at 5.87 per cent p.a. and Employment at 1.42 per cent p.a Usual Status Sectoral Employment when VA grows at 8 per cent p.a. and Employment at 2.48 per cent p.a Weekly Status Sectoral Employment when VA grows at 8 per cent p.a. and Employment at 2.48 per cent p.a Daily Status Sectoral Employment when VA grows at 8 per cent p.a. and Employment at 2.48 per cent p.a Usual Status Sectoral Employment when VA grows at 9.0 per cent p.a. and Employment at 2.79 per cent p.a Weekly Status Sectoral Employment when VA grows at 9.0 per cent p.a. and Employment at 2.79 per cent p.a Daily Status Sectoral Employment when VA grows at 9.0 per cent p.a. and Employment at 2.79 per cent p.a The estimates of work force given on the basis of the usual principal-cum- subsidiary concept can be interpreted as the maximum possible number of workers with a definition of worker which is very broad-based. Quite possible that many of them are not gainfully employed or not engaged in work on full-time basis thus involving underutilization of labour. Based on the same concept the measured unemployment rate captures the open unemployment only. It obviously cannot capture any underutilization of labour even when he/she is employed. In other words, the set of working poor is not included in the set of unemployed at all By and large the work force estimates are likely to be highest as per the usual principalcum-subsidiary status and lowest as per the daily status concept, the weekly status estimates lying between the two. This is because a person who has been broadly defined as a worker as per the principal-cum-subsidiary status may turn out to be unemployed or outside the labour 18
23 force as per the weekly status concept and the daily status concept. Similarly a person who has been identified as a worker as per the weekly status concept may turn out to be a nonworker (either unemployed or outside the labour force) based on a stricter criterion of daily status. Those who are broadly defined as worker as per the usual status might have been grossly underemployed. Thus the unemployment rate as per the daily status concept would capture the extent of underutilization of the working persons in addition to those who are openly unemployed. The unemployment rate as per the daily status would be highest and the principal-cum-subsidiary status would be lowest while the weekly status would lie between the two Keeping in view the differences in the concept, all three sets of projections have been provided in the preceding section for being used considering their relative importance and relevance for policy prescriptions. 3.3 Need for Annual Data on Employment/Unemployment With a major concern for pro-poor growth it is indeed important to know how much employment gets generated in the due course of growth. This would enable the government to develop effective employment planning and initiate several short term supportive measures in response to growth fluctuations, which are endemic to a market economy. Thus employment figures on annual basis are a pre-requisite. Though for past several years the NSSO has been collecting the employment-unemployment figures on annual basis the comparability problems have posed a serious concern. The thin rounds results tend to vary substantially from those of the large surveys of the quinquennium rounds even at the all-india level. 3.4 Working Poor The person day unemployment rate indeed covers those who are purely unemployed and in addition, those who may be working but their employment is characterized by underemployment. Thus, though the person day unemployment rate is likely to capture the working poor it is not entirely exhaustive. There are workers who are not underemployed but engaged in low productivity activities. Thus the remunerations they receive may not be adequate to meet the minimum subsistence level of consumption. In fact, that there are 19
24 several workers who cannot afford to remain openly unemployed and thus they would fall into the category of working poor A rough estimate of the working poor in India can be obtained by looking into the relative size of the informal sector which is extremely large even in the non-agricultural sector. However, not all informal sector workers are poor. Nor is it true that all poor are engaged in the informal sector itself. There can be workers in the formal sector engaged informally and lying below the poverty line A second estimate of the working poor can be obtained by considering the relative size of self-employment and casual employment in the rural and urban areas. Much of the poverty is identified among the self-employed households as they are often grossly under-employed or engaged in low productivity activities. Similarly the casual labour dependent households constitute poverty due to the lack of sustainable employment, poor bargaining power and poor levels of skill The best way of considering the set of working poor is to analyse the consumer expenditure data collected in the employment-unemployment surveys. This can also throw light on poor engaged across various activities. The 11 th Plan document recorded the incidence of poverty across various employment categories such as regular wage employment, self-employment and casual wage employment for the year and Measuring Productivity Instead of merely looking at the value added per unit of labour for policy purposes it will be desirable to focus on additional indicators such as labour share in value added, wage rate per worker and growth in real wage and employment growth. The elasticity of wage with respect to productivity will be indicative of the extent of productivity gains that are being transferred to the workers. 20
25 4. Major Findings of the Sub-Group for Creation of Employment Opportunities 4.1 Basic Issues One of the objectives in the 12 th Five Year Plan, while creating employment, needs to be that the work created should be (a) decent work and (b) productive employment. To achieve the latter objective transfer of surplus labour out of low productivity agriculture to industry or services would lead to an overall increase in productivity. In order to achieve the first objective two kinds of transitions would be needed: first, movement of unskilled labour from agriculture to unorganized industry or unorganized services; second, movement of labour from informal employment in the unorganized sectors to either formal employment in organized sectors (preferably), or at least informal employment in the organized sectors Creating employment during the 12 th Five Year Plan would require enhancement of the rate of migration of labour out of agriculture to industry and services. Till two decades ago the share of agriculture in total employment was nearly 70% in the Indian economy. The most recent NSSO survey suggests that this share has declined over time to 53%. But given the fact that 53% of the Indian workforce is producing barely 15% of GDP (which is the current share of agriculture share to GDP), the decline in the share of agriculture in total employment is nowhere close to fast enough. Therefore, increasing employment outside of agriculture must be a desirable goal in and of itself. That means that, while increasing the share of productive employment in all sectors of the economy is the most desirable goal, one concern is that some of the employment generated in the growth process could well lead to employment growing faster in certain sectors than does Gross Value Added (GVA) There are several dimensions to ensuring more decent work at the current stage of development of the Indian economy. First, when agriculture labour migrates to urban areas in search of work and finds employment, even if it may be casual work in unorganised services or industry, it does so because urban wage rates in even the unorganized sector are better than those prevailing in agriculture (or there may be an absence of work opportunities in agriculture in his district or state). Otherwise labour is unlikely to migrate to uncertain informal employment in urban areas. This is in fact one kind of transition to more decent work than agriculture labour, merely because the wages are likely to be higher. This kind of work is still not such as to provide employment security or income security or social security which is our definition of decent work but it is still better than work in agriculture (which may or may not be available) There is a second transition which is a positive step in the direction of decent work, which involves the transition from informal jobs in the unorganized sector to informal organized sector employment. Some 7% of total organised sector employment in the Indian economy consists of informal employment. Informal employment (e.g. as contract labour) in the organized sector would be superior in terms of security of work because there is likely to be a written contract as opposed to a verbal one in the unorganized sector, some benefits (e.g. 21
26 assured leave and health benefits) other than salary are likely to be involved, and some degree of security of tenure would be available as opposed to complete uncertainty of tenure of employment that characterizes informal employment in unorganized enterprises The third, or ideal type of employment creation that policy makers would like to see during the 12 th Plan, is growth in the size and share of formal employment in organized sector enterprises. This is the case because such employment would be characterized by security of tenure and wage rates well above agricultural labour, neither of which prevail in informal work in unorganized enterprises, and informal employment in the organized sector. In addition, it would be characterized by nearly complete social insurance (i.e., death and disability benefits, old age pension, maternity leave and health benefits). None of these three are likely to prevail to the same extent in the remaining three types of employment in the economy, which together account for 93% of the total employment in the country The analysis suggests that whether one examines manufacturing, or non-manufacturing industry, or services, there is a consistent pattern in regard to the organized and unorganized segments of these non-agricultural sectors of the economy in that while in respect of employment the share of unorganized segments predominates, in respect of output (or GVA) it is the organized segment that contributes much more than the unorganized segment. The contrasts are most striking in regard to industry. Thus, Table 9 shows that unorganized manufacturing contributes to 85 per cent of total manufacturing employment in the Indian economy, while organized manufacturing s contribution is only 15 per cent ( ). On the other hand, for GVA the contribution of the organized segment is the exact opposite, i.e., 78 per cent, while the share of unorganized segment of manufacturing is 22 per cent to total GVA in manufacturing in the economy. Similarly, in non-manufacturing industry (i.e. gas, electricity, mining and construction), the share of the unorganized segment is 69 per cent in employment, but only 32 per cent in GVA. On the contrary, for GVA the contribution of the organized segment is 68 per cent for GVA while the unorganized segment employs 69 per cent of all workers engaged in non-manufacturing industry For services, the contributions to employment and GVA of the organized and unorganized segments are very different as well. Organized services contribute 27 per cent of all employment in services, but twice as much to total GVA produced by services in the economy. Unorganized services, on the other hand, are very significant in terms of employment generation (73 per cent of all services sector employment), but contribute much less (45 per cent) than organized services (55 per cent) of all service sector GVA (Table 9). 22
27 Table 9: Workforce Estimates for , and (in millions) Principal status Principal status Subsidiary status Subsidiary status Age Group 0 to to Rural male Rural female Urban male Urban female Rural male Rural female Urban male Urban female Rural male Rural female Urban male Urban female Source: NSS 66 th Round, Employment growth in non-agricultural sectors The strategy for increasing employment during 12 th Five Year Plan must rely upon an analysis of how employment trends have evolved over the last decade However, it needs to be emphasized at the outset that the 23 sectors identified in the 11 th Five Year Plan potential growth sectors for output and employment have had a rather mixed experience over the 11 th Plan period, and one should be quite cautious in recommending with any degree of certainty what could be potential growth sectors in the 12 th Plan period. This cautious approach is necessary because over the course of the 11 th Plan period these sectors have been repeatedly coming up in the policy discourse within government and among the academia However, the fundamental issue facing the Indian economy at the commencement of the 12 th Plan period is whether more rapid employment growth can be combined with the on rapid growth of output in industry and in services. One of the main objectives of the growth strategy in the 12 th Plan period must be to ensure that the process of structural change in terms of employment is accelerated. So what is the nature of the structural change that is taking place in employment that we observe from examination of the data for 3 points of time (as shown in Table 10)? Agriculture saw an absolute increase in employment in the first half 23
28 of the decade from 238 million in to nearly 259 million in This increase in agriculture, at face value, cannot be seen to be a positive development, if the expected structural transformation with growth is that there would be a shift of labour from agriculture to non-agricultural employment. However, if the increase in employment in agriculture in first half of the decade is accounted for by a diversification into allied economic activities like fishery, dairying, poultry, sericulture, horticulture and floriculture, it is indeed a welcome development However, while in the latter half of the decade there was a decline in absolute numbers employed in agriculture from 259 million to 243 million, the problem remains that total agricultural employment at the end of the decade was still higher than at the beginning of the decade. That means that the process of structural change in employment that one would expect with a period of very rapid, in fact unprecedented, growth rate in output in the economy outside of agriculture, is not occurring. In fact, if anything that process of structural change is stalled at least as far as the employment structure in the economy is concerned In manufacturing, there is an absolute increase in employment in the first half of the decade from 44 million to nearly 56 million in This increase by nearly 12 million in manufacturing in the first half of the decade was, however, off-set by a decline by 7 million in the second half of the decade. What is interesting is that the absolute size of employment in (48.54 million) was up by about 10% from total manufacturing employment of 44 million at the beginning of the decade Non-manufacturing industry has been the star performer in terms of generating employment in the decade. In the first half of the decade non-manufacturing employment increased from 21 million in to 30 million in , or nearly 50% increase on the base of employment in But in the second half of the decade the absolute size of employment in non-manufacturing doubled by the end of the decade compared to , or tripled relative to the level in In fact over the entire decade there was an increase in non-manufacturing employment by a total of 34 million jobs The total contribution of services to employment in India is 24.5% (while that of industry is 21.5%, of which 11% is accounted for by manufacturing). The share of services in total GDP is more than double (55% in ) its share of employment. Given the fact 24
29 that output growth in the Indian economy in the 2000s has been led by both services and industry, we should be particularly interested in the outcomes in services in respect of employment. Table 10 shows that in the first half of the decade total employment in services increased from 94.2 million to million (an increase of 18.8 million in the first half of the decade). However, in the latter half of the decade there was no increase whatsoever (in fact a marginal decline) in total employment in services Total employment in manufacturing in India increased from 44 million in to 55 million in , thereafter declining to 48 million ins Most of the increase in the first half and decrease in the second half of the decade was accounted for by manufacturing employment in the organized segment of the industry, although there was some increase in the organized segment as well. However, if we are interested in analyzing the implications for the quality of work of these quantitative changes over the decade, we should examine not only the trends for the organized and the unorganized segments separately but also assess whether, within the organized segment formal employment has been growing at the expanse of the informal employment. The conclusion appears to be not only that the organized segments growth in employment has been marginal, despite a growth rate of manufacturing GVA over the decade, the distribution of segment employment between formal and informal suggests that at least half of employment in organised manufacturing has remain of an informal nature. The reasons for this trend, continuing from an earlier period, cold lie in a number of factors (labour laws, technology upgradation being largely confined to the oragnised segment, tax laws, among other reasons), but that is a subject for further research, which must be undertaken if appropriate policy response by state governments and the central government during the 10 th Five Year Plan. 25
30 Table 10: Employment across various sectors (in millions) , and Absolute increase in employment (in Employment across various sectors (in millions) millions) Sectors Agriculture Manufacturing Mining & quarrying Electricity, gas & water supply Construction Non manufacturing Trade Hotels & restaurants Transport, storage & communication Banking (& insurance) Real estate public administration & defence Education Health Other community, social & personal services Other services Services Total Employment for Marginalised Groups Scheduled Castes, Scheduled Tribes and Muslims Creating employment during the 12 th Five Year Plan for all these vulnerable groups SCs, STs and Muslims is going to be a challenge. The challenge derives from multiple factors. First, the educational level of all these groups is lower than for the rest of social groups or religious communities in India. This fact is going to remain a constraint upon the ability of these groups to take advantage of opportunities emerging in a market oriented pattern of development to a greater extent than prevailed in the first four decades of development. This is one reason that the pressure is growing for reservation for these social groups even in the private sector which the private sector has resisted. 26
31 4.3.2 The implication of low levels of education, and the fact that SCs and STs in particular are concentrated in rural areas/agriculture, implies that the way in which they will get absorbed into the non-agricultural sectors is through casual labour in the unorganized segments of industry and services in low productivity, low-wage jobs. The main growth sector for unskilled labour has been construction and that will remain the main escape route route for SC/ST rural labour out of agriculture-based livelihoods A second constraint arises from the fact that a very significant share of the total population of SCs, STs and Muslims happens to be concentrated in 8 States of India( U.P., Bihar, A.P., West Bengal, Tamil Nadu, Rajasthan, Chhattisgarh and Jharkhand) most of which have experienced GDP growth rates which are lower than the national average. 4.4 Women s Employment Since the 1980s there has been a near-consistent decline in workforce participation rate (WPR) of women. Even more remarkably, in the latter half of 2000s (i.e. between and ) both the labour force participation rate (LFPR) and workforce participation rate (WPR) of women has declined sharply, as a result of which the total LFPR and WPR of the population has declined. Male LFPR and WPR has pretty much remained constant over the same period (LFPR for males was 55.1% and WPR was 55%). The sharp decline in female labour force participation has happened in both rural and urban areas, though the decline is much sharper in rural compared to urban areas. This suggests strongly that in both urban and rural areas girls over 14 years of age (i.e. of working age) are remaining in school, more than ever before. As a result, the LFPR of women in India, which is already low by Asian standards, has fallen further However, this decline should be seen in a positive light precisely because it suggests that girls, after completing elementary schooling are making the transition to secondary schooling in much larger numbers than ever before. In other words, these girls will be available to enter the workforce at a slightly later age better qualified than an earlier cohort. Since they will be better educated they are likely to be able to make the transition out of agriculture into non-agricultural employment, even though it may be in the unorganized sector. Given the fact that the female employment is even more concentrated in informal work than male employment outside of agriculture, their greater participation in schooling 27
32 indeed is a positive development. However, the much higher rate of education participation of girls augurs well for improvement in their labour force participation The most serious problem that women in the work force face is that it is not decent work. For the vast majority of women in non-agricultural employment they tend to work from home in home-based work, usually subcontracted to them by male contractors in a variety of low-productivity work (e.g., bidi-making, zari-making, etc) in the NSS Round had estimated that 29 million in the country were making as home-workers; assuming that such women live in a family of five members, a total of 150 million persons are at least part-dependent upon this kind of work. 4.5 Child Labour A child is classified as labour if she is in age group 5 to 14 and is economically active. The incidence of child labour had systematically declined in 1990s and 2000s. In % of 6 to 14 years old were working. That share had fallen to 3.3% of all children by to 2.4% in and further to 2% in If we aim to nearly eliminating child labour and the phenomenon of nowhere children during the 12th Five Year Plan it is imperative that the Right to Education Act (RTE) has to be implemented in letter as well as in spirit. By achieving the norms (list in schedule 1) of the Act the RTE can be implemented during the 12th Plan period. 4.6 Preparing for Global Economic Crises Employment Implications Integration into the global economy has its benefits as well as disadvantages from the view point of labour. Increasing labour-intensive exports can generate employment. At the same time, excessive dependence on international markets can lead to vulnerability to exogenous shocks, such as global economic rises. The objective of policy during the 12 th Plan has to be to maximize the benefits while minimizing the risks of international economic integration for labour Labour is an abundant factor in the Indian economy, and theoretically it should be possible for India to adopt the path that successful East Asian exporters followed from the early 1970s onwards, i.e. labour intensive manufacturing exports which enabled them to 28
33 absorb surplus labour from agriculture, raise wages throughout the economy and raise productivity overall. While it is true that export to GDP ratio in India has increased, the commodity composition of India s exports has not been such as to absorb labour as much, especially not on the scale required in a labour abundant economy, whose comparative advantage should lie in low wage, labour-absorbing exports of manufacturing and services. Labour absorbing exports can grow only if the exportables are competitive. One of the factors that have proven a constraint upon India s export growth is the fact that the other large labour abundant economy, China, has managed to be more competitive. As a result, they have managed to penetrate not only the market of OECD countries but have provided very strong competition to domestic companies in the Indian domestic market Superior infrastructure, economies of scale and management need to be addressed if Indian companies are to meet the Chinese challenge in both the domestic and the international markets The lesson from the global economic crisis and its impact on employment in India during 2008 to 2010 is that domestic consumption needs to be sustained. However, the difficulty at the commencement of the 12 th Five Year Plan is that now the economy faces a combined (centre and states) fiscal deficit of the order of 10% of GDP a situation very different from that prevailing in September 2008 when the last global economic crisis erupted (when it was 6% GDP). Such a large fiscal deficit will need to be contained progressively over time, and this time may well extend into at least the middle of the 12 th Five Year Plan period. This macro-economic constraint does not bode well for demand (and employment) sustaining public expenditure. Sustaining domestic demand will be the key to growth of investment output and employment especially since the international environment has worsened again in mid It is essential that special effort is made to increase tax revenues to GDP ratio over the 12th Plan period. An important policy step for India to increase tax revenues is to implement the goods and service tax (GST). A simple GST can strengthen revenues and rationalize certain aspects of doing business, while decreasing the distortions that beset consumption taxes in India. 29
34 4.6.6 Finally, if India is to respond adequately to the next global crisis the wide gap between existing skill sets and what the economy needs have to be filled. This requires reforms to be rapidly implemented to expand the scope and outreach of vocational education in secondary and higher secondary schools, reforming the government Industrial Training Institutes (ITIs) and private ITIs, and improving the quality of both publicly and privately provided higher technical education. A second component of these reforms is to rapidly implement the National Vocational Education Qualification Framework (NVEQF). 30
35 5. Projections and Recommendations 5.1 Projections of Labour Force and Work Force Labour Force Projections Based on the Annual Average Growth Rate (1983 to ) (in Million) Year Rural Male Rural Female Urban Male Urban Female Total Person Usual Status Weekly Status Daily Status Estimates of Workers/ Employment Projection-I based on Long Term Growth Rate in Employment (in million) Year Rural Male Rural Female Urban Male Urban Female Total Person Usual Status Weekly Status Daily Status
36 5.1.3 Employment Projection II (in million) Same Employment Elasticity as in the past(0.327) Same Employment Elasticity as in the past(0.327) Assumptions Year Usual Status Weekly Status Daily Status Value Added Growth 8.0 % Employment Growth 2.62 % Value Added Growth 9.0 % Employment Growth 2.94 % Employment Projection-III (with Total Factor Productivity Growth (TFPG) (in million) Assumptions Year Usual Status Weekly Status Daily Status V.A. Growth: 5.87 % p.a. over 12th Plan TFPG: 3% p.a. Employment Elasticity Implied Employment Growth:1.42% V.A. Growth: 8 % p.a. over 12th Plan TFPG: 3% p.a. Employment Elasticity Implied Employment Growth:2.48% V.A. Growth: 9 % p.a. over 12th Plan TFPG: 3% p.a. Employment Elasticity Implied Employment Growth:2.79% Recommendations General Recommendations The National Employment Policy (NEP), already drafted, may be finalized at the earliest Employment figures on an annual basis are a pre-requisite to enable the government to develop effective employment planning and initiate several short term supportive measures in response to growth fluctuations. However, the need for annual or frequent labour force surveys is more important for urban areas The best way of considering the set of working poor is to analyse the consumer expenditure data collected in the employment-unemployment surveys. 32
37 There is a major need to strengthen self-employment and entrepreneurship programmes as it will go a long way in resolving educated and youth unemployment problem Creation of a portal for employment-unemployment data on a national basis to bridge the demand-supply gap is essential There is need for flexible labour laws without compromising fairness to labour The disconnection between industries and manpower should be addressed Employment needs and education provided need to match Labour market information cell should be established in each State A combination of more effective school education on the one hand, and better vocational education and training on the other with geographic targeting of districts where the marginalized groups (like SCs/ STs/ Muslims) are concentrated would be critical for their employability Backward regions/ backward States are often not getting benefits of employment schemes hence, special emphasis of policy is required for such regions/ States Several support services have to be extended to the informal sector workers in order to enhance their productivity and well-being levels The self-help group approach of supporting women s work has been extremely successful in Andhra Pradesh and Kerala and needs to be replicated in other States/UTs Expand the scope and outreach of vocational education in secondary and higher secondary schools, reforming the government Industrial Training Institutes (ITIs) and private Industrial Training Centres (ITCs), raising the standard of polytechnics and improving quality of both publicly and privately provided higher technical education. A second component of this reform is to rapidly formulate and implement the National Qualification Framework. 33
38 The Employment Exchanges may be upgraded, computerized and be used as Vocational Counselling Centres It must be realized that the employment guarantee programmes are only a short-run respite and, therefore, from the long run point of view the growth itself has to be made more employment intensive Recommendations for the Agriculture Sector Non-crop activities like poultry, dairying, fisheries, horticulture, floriculture, animal husbandry have scope for generating more employment The draft NEP has suggested that in agriculture existing policy packages need to strengthened and new ones evolved to facilitate diversification or agricultural products and shift from on-firm to off-firm activities. Overwhelming majority of farmers in India consist of small and marginal farmers, for whom a strong package of support in respect of credit, inputs, technology and marketing should be devised to enable them to realize their productive potential and enhance their remuneration from employment Recommendations for the Manufacturing Sector A structural shift in the employment composition can be possible through rural industrialization - agro-based industries and other light goods industries have to be created in the rural areas to ensure rural diversification Government policy during the 12 th Plan must focus on the four requirements viz. credit from formal banking sources, support for marketing efforts, design innovation and technology upgradation, for promotion of the traditional industries, using the cluster approach The small and medium sized enterprises have to grow sizably and attempts have to be made to make them economically viable. Ensuring credit for micro, small and medium 34
39 enterprises (MSMEs) from banks and financial institutions will remain a major priority during the 12 th Plan period The draft NEP mentions that a sub-sectoral approach to policy making is necessary to improve employment intensity of manufacturing. Labour intensive industries (textile products, leather products, beverages, food products and wood products) need to be given special policy support and incentives to grow faster. The micro and small enterprises need to be provided strong technology and skill support through a package of extension services and training to suit their requirements The draft NEP further suggests that a special package of support should be developed for small, multi product clusters in backward areas particularly utilizing the forward and backward linkages that could be locally realized National Rural Livelihood Mission has a potential roll in enhancing employment of women in non-farm sector The National Manufacturing Policy 2011 has identified the following sectors that will create large employment-(i) Textiles and Garments, (ii) Leather and Footwear, (iii) Gems and Jewellery, (iv) Food Processing Industries, and (v) Handlooms and Handicrafts. The MSME sector the base for the manufacturing sector has also been identified for employment and enterprise generation. The Approach Paper to the Twelfth Five Year Plan ( ) mentions that these sectors need to be encouraged The Approach Paper to the Twelfth Five Year Plan ( ) mentions that unless manufacturing becomes an engine of growth, providing at least 100 million additional decent jobs, it will be difficult for India s growth to be inclusive Recommendations for the Services Sector The IT sector and IT-related services have to grow so that they provide a major outlet to the skilled manpower of the country. Besides, they are expected to create secondary employment in which the semi-skilled and unskilled work force can be engaged. 35
40 Increase productive employment in employment generating services sector like hotels, IT, transport, financial institutions and construction sector The draft NEP has indicated certain sector specific policy for their faster growth and greater employment orientation. The sectors that can be easily identified for special treatment from the employment view point are agriculture, manufacturing, construction, retail trade, tourism and information and communication technologies (ICT) The draft NEP mentions that although the construction sector has registered high employment growth and high employment elasticity, poor quality of employment is a matter of serious concern. Implementation of various provisions of labour regulation, minimum wages, safety and welfare, need to be implemented. A special programme for development of skills to meet the requirements of changing technology in the construction sector needs to be developed The draft NEP further mentions that the trade sector has experienced one of the fastest growth in employment over the past decade; and is likely to sustain this growth in coming years. The quality of employment especially in retail trade needs improvement The draft NEP also states that tourism industry has grown rapidly and so has employment in the sector. Tourism projects that integrate local socio-economic development, through forward and backward linkages, should be encouraged. Capacity for training tourism personnel at different levels needs to be vastly expanded The Approach Paper mentions that the potential of tourism to provide income opportunities must be seized too. Along with construction, it is one of the largest sectors of the service industry in India. It is capable of providing employment to a wide spectrum of job seekers from the unskilled to the specialised, even in the remote parts of the country. Finally, compared to other modern sectors, a higher proportion of tourism benefits (jobs, petty trade opportunities) accrue to women The Approach Paper also mentions that construction sector provides direct/indirect employment to about 35 million people and is expected to employ about 92 million persons by Hence, better managed processes are required for the development and deployment 36
41 of human resources for this industry. Considering the demand for workforce for construction, the industry and government should further strengthen the mechanism for providing training to unskilled workers who constitute bulk of the workforce. Such efforts need to be further expanded in order to meet the workforce requirement of the sector In order to provide a boost to the construction sector, rural irrigation programmes and major infrastructure building programmes both in the rural and urban areas have to be initiated in a significant way. The Working Group endorsed the above mentioned recommendations for being implemented during the Twelfth Plan. 37
42 Appendix Table AI Appendix Table A-I. All-India employment and unemployment indicators (per 1000) NSS66th Round ( ) NSS 61st Round ( ) rural urban rural+urban rural urban rural+urban indicator male female person male female person male female person male female person male female person male female person Usual Status(ps+ss) LFPR WPR UR Current weekly status LFPR WPR UR Current daily status LFPR WPR UR Source: Key Indicators of Employment and Unemployment in India, (NSS66th Round) Current Weekly Status Appendix Table AII Appendix table A-II. Estimated persons/person-days (in million) in different broad activity statuses NSS 66th Round( ) 61st Round ( ) Rural Male Rural Female Rural Total Urban Male Urban Female Urban Total Total Person Rural Male Rural Female Rural Total Urban Male Urban Female Urban Total Total Person Usual In the Labour Force Status In the work force (ps+ss) unemployed In the Labour Force In the work force unemployed Current In the Labour Force Daily In the work force Status unemployed Source: Key Indicators of Employment and Unemployment in India, (NSS 66th Round) 38
43 Annexure-I No. Q-20017/2/2011/LEM/LP Government of India Planning Commission (Labour, Employment &Manpower Division) Order Yojana Bhavan, Sansad Marg, New Delhi Dated 07/04/2011. Constitution of Working Group on Employment, Planning & Policy for the Twelfth Five Year Plan ( ). In the context of preparation of 12 th Five Year Plan it has been decided to set up a Working Group on Employment, Planning & Policy. The composition of the Working Group on Employment, Planning & Policy will be as follows: 1. Dr. Ashok Sahu, Principal Adviser, Planning Commission, 2. DG & CEO(NSSO), Ministry of Statistics & Programme Implementation, Sardar Patel Bhawan, New Delhi Dr. C. Chandramouli, Registrar General of India, 2A, Man Singh Road, New Delhi Pr. Secretary (Labour & Employment), Govt. of Maharashtra, Mantralaya, Mumbai Pr. Secretary (Labour & Employment), Govt. of Bihar, Vikas Bhawan, New Secretariat, Patna Pr. Secretary (Labour), Govt. of Gujarat 5 th Block, 6 th Floor, Chairman Member Member Member Member Member 39
44 Sachivalaya, Gandhinagar Secretary (Labour), Govt. of Tamil Nadu Secretariat, Fort St. George, Chennai Pr. Secretary(Labour), Govt. of Madhya Pradesh, Mantralaya, Vallabh Bhavan, Bhopal Secretary (Labour), Govt. of Orissa Secretariat office, Bhubaneswar Member Member Member 10. Dr. T.S.Papola, Director, Institute for studies in Industrial Development, Institutional Area P B No Vasant Kunj, near The Grand Hotel New Delhi Dr. Jeemol Unni, Expert on Employment, A-10, Faculty Quarters, IRMA Campus, IRMA, Anand, Gujarat Prof. Amit Bhaduri, Council for Social Development, Sangha Rachna 53, Lodi Estate New Delhi Prof. Arup Mitra, Institute of Economic Growth, University Enclave University of Delhi (North Campus) Delhi Secretary General, FICCI, Federation House, Tansen Marg, New Delhi Member Member Member Member Member 40
45 15. Shri Chandrajeet Banerjee, Director General, Confederation of Indian Industry (CII), The Mantosh Sondhi Centre, 23, Institutional Area, Lodhi Road, New Delhi Dr. D.M. Diwakar, Director, A. N. Sinha Institute of Social Studies, Patna Member Member 17. Ms. Kumud Joshi, Chairperson, KVIC, 3, Irla Road, Vile Parle (West), Mumbai DG, IAMR or the nominee, Institute of Applied Manpower Research, Sec-A-7, Institutional Area, Narela, Delhi Director, V.V. Giri National Labour Institute Sector-24, Noida, District Gautam Budh Nagar, UP Dr. A.N. Sharma, Director, Institute of Human Development, NIDM Building IIPA Campus, IP Estate, New Delhi. 21. Dr. Rajesh Shukla, Director, NCAER-CMCR, Parisila Bhawan, 11, Indraprastha Estate, New Delhi Shri K. Kanagasabapathy, Director, Economic & Political Weekly, Research Foundation, C-212 Akurli Industrial Estate, Kandivli East, Mumbai Dr. Chandrahas Deshpande, Executive Director, MEDC, Member Member Member Member Member Member Member 41
46 Y.B. Chavan Centre, 3 rd Floor, Nariman Point, Mumbai Shri R.M. Ajgaonkar, Chartered Accountant, Sambava Chambers, SIR, PM, RD, Fort, Mumbai Adviser(LEM), Planning Commission 26. Joint Adviser(LEM), Planning Commission Member Member Convener 2. The Terms of Reference of the Working Group will be as under: a) To review the employment situation in general and with special focus on women and educated persons, in different regions of the country. b) To project the labour force and work opportunities which could form the basis of the strategy for 12 th Five Year Plan. c) To suggest the strategies and policies for creating work opportunities. d) To make an assessment of employment situation in general and among groups such as youth and the educated and to suggest ways and means to deal with it. e) Any other issue(s) concerning employment policy and programmes with the consent of the Chairman of the Working Group. 3. The Chairman of the Working Group may co-opt any other person as Member of the Working Group if considered necessary. 4. The Working Group will submit its report by 31 st July, LEM Division of the Planning Commission will provide secretarial service for the Working Group. 5. The expense towards TA/DA of the official members will be met by respective Govt. Departments /Institutions to which they belong. The TA/DA of non-official members shall be governed by the provisions of SR190(A) as per the entitlement of Group-A officers of the Govt. They shall be permitted to travel to & fro for the meeting by Air (cheapest economy class only by Air India). 6. Shri K.N.Pathak, Joint Adviser (Labour, Employment & Manpower), Room No. 512, Yojana Bhawan, New Delhi, (Tel or ) will be the nodal officer for this Working Group. (Jeewan Sharma) Deputy Secretary to the Government of India To 42
47 Chairman and all the Members (incl. Convener) of the Working Group. Copy to : 1. PS to DCH/ MOS (Planning)/ Members/Member-Secretary, Planning Commission. 2. All Principal Advisers/ Sr. Consultants/ Sr. Advisers/Advisers/ HODs in Planning Commission. 3. Prime Minister s Office, South Block, New Delhi. 4. Cabinet Secretariat, Rashtrapati Bhawan, New Delhi. 5. Information Officer, Planning Commission. 6. Joint Secretary (Administration), M/o Labour & Employment. 7. Director (Finance), Planning Commission. (Jeewan Sharma) Deputy Secretary to the Government of India ******* 43
48 No. Q-20017/2/2011/LEM/LP Planning Commission (Labour, Employment &Manpower Division) Annexure II Subject: Yojana Bhavan, Sansad Marg, New Delhi Dated 16/06/2011. Order Constitution of Sub-Group on Employment/Unemployment Projections. The Pr. Adviser (LEM), Planning Commission as the Chairman of the Working Group on Employment, Planning & Policy for the Twelfth Five Year Plan ( ) has approved the constitution of Sub-Group on employment/unemployment Projections. The composition of Sub-Group on Employment/Unemployment projections is as follows: Sub-Group on Employment/ Unemployment Projections Sr.No. Name 1. Prof. Arup Mitra, IEG, Delhi Chairman 2. Dr. T. S. Papola, Member Director, Institute for Studies in Industrial Development, Institutional Area, P B No. 7513, Vasant Kunj, near The Grand Hotel, New Delhi Shri J. Dash, DG, NSSO, New Delhi Member 4. Dr. Faujdar Ram, Director, IIPS, Member Deonar, Mumbai Shri K. Kanagasabapathy, Director, Member Economic & Political Weekly, Research Foundation, C-212 Akurli Industrial Estate, Kandivli East, Mumbai Ms. Amarjeet Kaur, DDG(E), Ministry of Labour & Member Employment, SS Bhawan, New Delhi. 7. Dr. J.S. Tomar, Research Officer(LEM), Planning Commission. Member convener The Terms of Reference for the above said Sub- Group is as follows: 1. To make a review of the present employment and unemployment situation and make a projection in this regard for the Twelfth Five Year Plan. 2. Among various parameters available for estimating employment/ unemployment like UPS, US(adj.), CWS and CDS which one makes the most realistic assessment may be deliberated. 3. The frequency with which the employment/unemployment data is to be generated and the agency which should be assigned this task may be discussed. 44
49 4. Measurement of the productivity of labour. How can it be improved? 5. Estimation of the working poor in India. The Sub-Group will submit its report by the first week of July, 2011 to the Working Group. The expense towards TA/DA of the official members will be met by respective Govt. Departments /Institutions to which they belong. The TA/DA of non-official members shall be governed by the provisions of SR190(A) as per the entitlement of Group-A officers of the Govt., which will be paid by Planning Commission. They shall be permitted to travel to & fro for the meeting by Air (cheapest economy class only by Air India). To Chairman and all the Members (incl. Convener) of the Sub-Group. (J.S. Tomar) Research Officer (LEM) Copy to : 1. Pr. Adviser(LEM), 2. Adviser (LEM). (J.S. Tomar) Research Officer (LEM) 45
50 Annexure III No. Q-20017/2/2011/LEM/LP Government of India Planning Commission (Labour, Employment &Manpower Division) Order Yojana Bhavan, Sansad Marg, New Delhi Dated 16/06/2011. Subject : Constitution of Sub-Group on Creation of Employment Opportunities. The Pr. Adviser (LEM), Planning Commission as the Chairman of the Working Group on Employment, Planning & Policy for the Twelfth Five Year Plan ( ) has approved the constitution of Sub-Group on Creation of Employment Opportunities. The composition of Sub-Group on Creation of Employment Opportunities is as follows: Sub-Group on Creation of Employment Opportunities Sr. No. Name 1 Dr. Santosh Mehrotra, DG, IAMR Chairman 2 Dr. Kavita Gupta, Pr. Secy, (labour) Member Govt. of Maharashtra 3 Dr. D.M. Diwakar, Director, ANS Instt. Of Social Studies, Patna. Member 4 Dr. Chandrahas Deshpande, Executive Member Director, MEDC 5 Shri R.M. Ajgaonkar, CA, Mumbai Member 6 Shri A.K. Satpathy, Faculty, VVGNLI, Noida. Member 7 Shri B.P. Pant, Director, FICCI, Tansen Member Marg, New Delhi. 8 Shri Santosh K. Misra, Director of Emp & Member Trg., Tamil Nadu, 9 Shri K.N.Pathak, Joint Adviser Member convener The Terms of Reference for the above said Sub- Group is as follows: 1. To lay down a strategy as to how the Twelfth Five Year Plan, while achieving 9 to 9.5% GDP growth rate, can generate adequate employment opportunities. 2. To prepare a framework as to how job requirement of certain segments like youth, educated persons, women, minorities, SC, ST and backward classes, unorganized sector and laggard regions can be met. 46
51 3. In the past more jobs have been created in the unorganized sector. A blueprint needs to be prepared as to how more organized sector jobs can also be created. 4. In view of recurrent economic crisis, laying down of a framework to place employment generation/protection at the heart of revival strategy or stimulus packages may be undertaken. The Sub-Group will submit its report by the first week of July, 2011 to the Working Group. The expense towards TA/DA of the official members will be met by respective Govt. Departments /Institutions to which they belong. The TA/DA of non-official members shall be governed by the provisions of SR190(A) as per the entitlement of Group-A officers of the Govt., which will be paid by Planning Commission. They shall be permitted to travel to & fro for the meeting by Air (cheapest economy class only by Air India). To Chairman and all the Members (incl. Convener) of the Sub-Group. (J.S. Tomar) Research Officer (LEM) Telefax : Copy to : 3. Pr. Adviser(LEM), 4. Adviser (LEM). (J.S. Tomar) Research Officer (LEM) Telefax :
52 Annexure IV Report of the Sub-Group on Employment/ Unemployment Projections An important dimension of pro-poor or inclusive growth is productive employment generation through which the objectives of growth and poverty reduction can be achieved simultaneously. Hence, in the broad context of the Twelfth Five Year Plan ( ) employment planning is one of the crucial issues. As an integral part of employment planning it is inevitable to have a broad assessment of the employment situation likely to emerge in the coming years. This report broadly focuses on this aspect. And issues relating to productivity enhancement, particularly in the informal sector, are also considered. The employment situation in the Indian context has not been quite impressive particularly keeping in view the unskilled and semi-skilled work force. During , Indian economy grew by 3.5 per cent against the projected growth of 5 per cent.per annum. Employment grew by 2 per cent per annum while the growth in labor force was 2.5 per cent, thus, resulting in overall increase in unemployment. The increase in unemployment was nearly double during from 5 million to 10 million (Papola, Given the growth profile, which has been quite robust in the recent years, one pertinent question is whether India has experienced pro-poor growth. Examining a wide range of indicators, including worker population ratio, sectoral shifts in the value added composition and occupational structure, growth in value added and employment, employment status in terms of self-employment, regular wage employment and casual employment, unemployment rates, formal-informal division of employment, employment elasticity and labour productivity, and finally, the head count measure of poverty we note that there was a missing link in terms of employment between the rise in economic growth and the reduction in poverty that took place in the past. Though researchers believed that this was an outcome of rising income and other positive changes taking place in the economy, the empirical evidence is not convincing. After the nineties employment growth has picked up, but economic growth and employment generation both seem to be more beneficial to those located in the upper income strata than the poor. The relatively faster employment growth between and was partly because of the revival of agriculture employment, which had decelerated considerably during the 1990s. The other feature is that some of the dynamic activities within the services sector continued to grow rapidly, generating employment opportunities. However, most of these activities are less likely to absorb directly the poor who are mostly unskilled, and hence the direct effects of growth on poverty are still not spectacular (Mitra, 2008). All this is compatible with the fact that the incidence of poverty is still sizeable and the extent of decline has not been satisfactory. The 'employment problem' cannot be gauged merely in terms of open unemployment rate. It is rather the relative size of the low productivity informal sector that can throw light on the gravity of this problem. Even within the organized or formal sector, informal employment is on the rise, reducing the bargaining power of the labour considerably. Surprisingly, the composition of the workforce as per the status of employment shows a major shift in favour of self employment in Besides, with the exception of , the long term trend shows that casualization is on the rise in the case of rural males, rural females and urban males. And this has been by and large accompanied by a declining trend in regular wage employment among rural and urban males. On the other hand in , the relative size of self-employment increased among males and females in both rural and urban areas, which is 48
53 accompanied by a rise in the current daily status unemployment rate among females in both rural and urban areas and among males in rural areas. Between and the work participation rate of females (based on usual principal status and weekly status both) declined in the rural and urban areas both. This has, however, been accompanied by a rise in the male work participation rate in the rural areas though there is a decline in the urban areas as per the same criteria. Though the decline in the women work participation rate to some extent may be justified in terms of a rising enrolment ratio in education, the phenomenon of discouraged drop-outs cannot be ignored completely. In other words, part of the decline in the work participation rate of females (rural and urban) and males (urban) is due to deceleration in labour demand. One silver lining is of course a distinct drop in the person day unemployment rate both in the rural and urban areas. But the growth rate in total employment turns out to be around half a per cent per annum as per the weekly status criterion and 0.15 per cent per annum as per the usual (principalcum-subsidiary) status criterion between and Among the workers in the rural areas around 54.2 per cent are engaged in self-employment, 38.6 per cent as casual workers and only 7.3 per cent in regular wage employment. In the urban areas the share of self-employment turns out to be 41.1 per cent and that that of casual employment 17.5 per cent. This is indicative of a decline in selfemployment both in the rural and urban areas, a rise in casualization in the rural areas and a rise in casual as well as regular wage employment in the urban areas, compared to However, on the whole it is difficult to conclude that the employment scenario for the poor is improving sizably over the years. 1. For labour force and employment projections the following steps are adopted: Based on the population census data (and census projections) the population figures are derived for the NSS survey years 1983, , and (as given by Sundaram, 2007) and The figures are taken for rural male, rural female, urban male and urban female separately. In order to project the labour force for the 12 th Plan period we have first applied the NSS labour force participation rate to the absolute number of population, arriving at the absolute number of persons in the labour force. Based on these figures the average annual long term growth rates (Table 1a) have been calculated which are used for projection (Table 1b). Rural Male Rural Female Urban Male Urban Female Usual Status Weekly Status Daily Status
54 Table 1b: Labour Force Projection Based on the Annual Average Growth Rate (1983 to ) Rural Male Rural Urban Urban Total Female Male Female Usual Status Weekly Status Daily Status An alternative set of estimate has been offered by the EPW research foundation (EPWRF): The EPWRF Estimate of Population India has seen a deceleration in population growth rate since The population and the population growth rates between the censuses since 1951 are presented in Table 2. Assuming the rate of decline in growth rate to be in line with the past trend, the population growth rate for 2021 is projected by EPWRF at 13.2% (Figure 1A). Based on this, the population figures for the Twelfth Five Year Plan period have been estimated further Figure 1A: Population Growth Rate So far and Projected Censuses Table 2 : Trends in Population Percentage Census Population (in million) Growth in Population Source: Census of India as reported by EPWRF Labour Force Projection by EPWRF As mentioned before, LFPR and WFPR follow a cyclical pattern. The only exception to the cyclical pattern is the urban male participation which has seen a gradual increase over the period. Taking these characteristics into account as well as the figures from 66 th NSS round, the LFPR and WFPR for the 12 th FYP have been estimated. 50
55 It is assumed that growth in LF will be higher than the population growth rate given the country s demographic structure. Given the high growth prospects as well as stress on employment creation by the policy makers, we expect elasticity to rise gradually. Though the 64 th and 66 th rounds have shown a decline in female participation, it may pick up in a couple of years to come considering the movements of past rounds. Based on these assumptions, the population, labour force, work force and unemployment for the 12 th FYP is expected to be as shown in Table 3. Table 3: Estimated Population and Labour Force Population (in million) Labour Force (in million) Per '000 population (410) (413) (417) (420) (423) Source: Estimated by EPWRF Work Force Projection In the first step we have applied the NSS work participation rates to the absolute numbers of population derived from the census results. As regards the work participation we have considered the usual principal-cum-subsidiary status, weekly status and the daily status rates. The former tends to offer an estimate on the higher side because of a long reference period. Besides, it also includes those who have not worked in a sustained manner for a long time. On the other hand, the weekly status rate tends to exclude to some extent those who are underemployed. Three sets of absolute numbers of work force are then derived. The long run employment growth has been calculated based on the absolute numbers of work force for the NSS survey years. The growth rates are reported in Table 4. On the other hand from the national accounts data we have derived the growth rates in aggregate GDP and sectoral GDP for the period through (Table 5). Table 4: Long Run Growth Rate in Employment ( ) % p.a. Categories Usual Status Weekly Status Daily Status (ps+ss) Rural Male Rural Female Urban Male Urban Female Total Based on NSS per thousand distribution applied to population figures derived from census estimates. 51
56 Table 5: Sectoral Growth Rate (% per annum) in Value Added ( to ) and Employment ( ) Valu Added Growth Emp Growth (usual status: ps+ss) Agriculture Mining Manufacturing Utilities Const- Ruction Trade etc. Transport etc. Other Services Total Projection: Set 1 One set of estimate is worked out by simply extrapolating on the basis of the long term growth rate in employment ( ). Set 1a: Estimates of Workers Based on Long Term Growth Rate in Employment Usual Status Year Rural Male Rural Female Urban Male Urban Total Female Weekly Status Daily Status However, to work out the projected figures at the sectoral level we presume that the sectoral shares have to undergo changes over time. For example, the share of agriculture has to decline over time and that of manufacturing has to increase. The desired sectoral distribution at the beginning and at the end of the 12 th plan is expected to be as follows: Agriculture Mining and Quarrying Manufacturing Utilities Construction Trade etc. Transport etc. Other Services Based on the desired sectoral distribution and the projected total employment figures, the sectoral employment figures in absolute terms have been worked out (Set 1b). Total 52
57 Set 1b: Sectoral Employment Agriculture Mining and Quarrying Manufacturing Utilities Construction Trade etc. Usual Status Transport etc. Other Services Weekly Status Daily Status Projection: Set 2 The second set calculates the gross employment elasticity based on the GDP growth rates and the employment growth rates. And using the employment elasticity from the past data it works out the employment projections for 8 per cent growth rate in aggregate value added and the implied sectoral growth rate accordingly. Given the employment growth rate and the value added growth rate as given in Table 4 and 5 respectively over the past years the employment elasticity has been calculated. If the aggregate value added growth is expected to be 8 per cent during the 12 th plan then what would be the sectoral growth rates? The sectoral growth rates have been calculated under the assumption that sectoral composition is going to be the same as observed in the past. And given the employment elasticity from the past data we have then worked out the implied employment growth rates over the 12 th plan. Based on the implied growth rate the employment in absolute terms for the year and has been worked out. Given the projected total the sectoral figures have been generated by applying the desired sectoral shares. Set 2a: Employment Elasticity from Past Data Agriculture Mining and Quarrying Manufacturing Utilities Emp. Elasticity Based on Past Data (Table 2) Construction Trade etc. Transport Etc. Other Services Total Total Note: For a projected growth rate of 8 per cent p.a. the implied employment growth rate turns out to be per cent per annum over the 12 th Five Year Plan Period, given the past employment elasticity. 53
58 Set 2b.1: Employment Projection with 8 per cent Value Added Growth Usual Weekly Daily Status Status Status VA Growth 8 % Same Employment Employment Growth 2.62% Elasticity Set 2c.1: Sectoral Employment with 8 per cent Value Added Growth Agriculture Mining and Quarrying Manufacturing Utilities Construction Trade etc. Transport etc. Other Services Usual Status Weekly Status Daily Status Presuming that the value added growth would pick up to 9 per cent per annum during the 12 th plan period another set of optimistic projection is included below: Total Set 2b.2: Employment Projection with 9 per cent Value Added Growth Usual Weekly Daily Status Status Status VA Growth 9 % Same Employment Employment Growth 2.94% Elasticity
59 Set 2c.2: Sectoral Employment with 9 per cent Value Added Growth Agriculture Mining and Quarrying Manufac- Turing Utilities Construction Trade etc. Usual Status Transport etc. Other Services Weekly Status Daily Status Total Projection: Set 3 In the estimate provided above we presume that the employment elasticity would not change in the future years. However what we have noticed from the past data that the employment elasticity has been declining steadily. This is partly because of rise in capital intensity and partly because of rise in the total factor productivity growth. Hence, the assumption of constant employment elasticity may be unrealistic because of the rapid technological progress that is taking place as a result of technology import. A third set of estimate is derived by presuming that employment elasticity would decline and total factor productivity growth may shoot up in the future years. This would mean lesser employment growth unless the overall output growth accelerates considerably. In the past ( ), the total factor productivity growth (TFPG) was experienced at 2 per cent per annum (see Goldar and Mitra, 2010). If TFP is expected to grow at a rate of 3 per cent per annum and the overall employment elasticity declines to 0.24 over the 12 the Plan then a third set of estimate of employment is provided for 2012/13 and 2016/17 under the assumption that the value added continues to follow the long term average growth rate of 5.87 per cent per annum. Alternately we presume that the TFPG rises to 3 per cent per annum, the employment elasticity declines only marginally to 0.3 from 0.33 as observed over the period ( through ) and the overall value added growth rate picks up to 8 per cent per annum, which is closer to the government s projected figure of 9 to 10 per cent per annum. The overall employment growth rate then turns out to be 2.48 per cent per annum. Accordingly the sectoral employment figures have been worked out by applying the desired sectoral shares to the projected total. 55
60 Set 3a.1: Employment Projection with Changing TFPG (Value Added Growth Rate: 5.67 and 8 %) Year Usual Status Weekly Status Daily Status VA Growth : 5.87 % p.a. over 12th Plan Implied Employment Growth VA Growth of 8 % p.a. over 12 th Plan Implied Employment Growth TFPG : 3 per cent per annum Employment Elasticity: TFPG : 3 per cent per annum Employment Elasticity: Set 3b.1: Sectoral Employment with Changing TFPG (Value Added Growth Rate: 5.67 and 8 %) Agriculture Mining and Quarrying Manufacturing Utilities Construction Trade etc. Transport etc. Other Services Usual Status Sectoral Employment when VA grows at 5.87 per cent p.a. and Employment at 1.42 per cent p.a Weekly Status Sectoral Employment when VA grows at 5.87 per cent p.a. and Employment at 1.42 per cent p.a Daily Status Sectoral Employment when VA grows at 5.87 per cent p.a. and Employment at 1.42 per cent p.a Usual Status Sectoral Employment when VA grows at 8.0 per cent p.a. and Employment at 2.48 per cent p.a Weekly Status Sectoral Employment when VA grows at 8.0 per cent p.a. and Employment at 2.48 per cent p.a Daily Status Sectoral Employment when VA grows at 8.0 per cent p.a. and Employment at 2.48 per cent p.a Total 56
61 Again presuming that the value added growth rate would shoot up to 9 per cent per annum another set of optimistic projection has been included below: Set 3a.2: Employment Projection with Changing TFPG (Value Added Growth: 9 %) Year Usual Status Weekly Status Daily Status VA Growth of 9 % p.a. over 12 th Plan TFPG : 3 per cent per annum Implied Employment Growth Employment Elasticity: Set 3b.2: Sectoral Employment with Changing TFPG (Value Added Growth: 9 %) Agriculture Mining and Quarrying Manufacturing Utilities Construction Trade etc. Transport etc. Other Services Usual Status Sectoral Employment when VA grows at 9.0 per cent p.a. and Employment at 2.79 per cent p.a Weekly Status Sectoral Employment when VA grows at 9.0 per cent p.a. and Employment at 2.79 per cent p.a Daily Status Sectoral Employment when VA grows at 9.0 per cent p.a. and Employment at 2.79 per cent p.a Among various criteria available for measuring employment-unemployment the usual status employment rates (principal cum subsidiary) are likely to give the estimates on the higher side. The usual activity status relates to the activity status of a person during the reference period of 365 days preceding the date of survey. The activity status on which a person spent relatively longer time (i.e. major time criterion) during the 365 days preceding the date of survey is considered as the usual principal activity status of the person. To decide the usual principal activity of a person, first a two stage dichotomous classification was followed for determining the broad usual principal activity status of the person viz. (i) employed, (ii) unemployed, and (iii) not in labour force. Persons were first categorised as those in the labour force and those not in the labour force depending on the major time spent during the 365 days preceding the date of survey. Persons thus adjudged as not belonging to the labour force were assigned the broad activity status 'neither working nor available for work' (not in the labour force). For persons belonging to the labour force, the broad activity status of either 'working' (employed) or not working but seeking 57 Total
62 and/or available for work (unemployed) was ascertained based on the same criterion viz. relatively longer time spent in accordance with either of the two broad statuses within the labour force during the 365 days preceding the date of survey. Turning to usual subsidiary economic activity status we note that a person whose usual principal status is determined on the basis of the major time criterion could have pursued some economic activity for a shorter time throughout the reference year of 365 days preceding the date of survey or for a minor period, which is not less than 30 days, during the reference year. The status in which such economic activity was pursued was the subsidiary economic activity status of that person. It is quite possible that a person who is not a worker as per the usual principal status may be considered as worker according to the usual status (ps+ss), if the person pursued some subsidiary economic activity for 30 days or more during 365 days preceding the date of survey. Hence, the estimates of work force given on the basis of the usual principal-cum- subsidiary concept can be interpreted as the maximum possible number of workers with a definition of worker which is very broad-based. Quite possible that many of them are not gainfully employed or not engaged in work on full-time basis thus involving underutilization of labour. Based on the same concept the measured unemployment rate captures the open unemployment only. It obviously cannot capture any underutilization of labour even when he/she is employed. In other words, the set of working poor is not included in the set of unemployed at all. The current weekly activity status of a person is the activity status during a reference period of 7 days preceding the date of survey. It is decided on the basis of a certain priority cum major time criterion. On the other hand the current daily activity status for a person is determined on the basis of his/her activity status on each day of the reference week using a priority-cum-major time criterion (day to day labour time disposition).the activity pattern of the population, particularly in the informal sector, is such that during a week, and sometimes, even during a day, a person could pursue more than one activity. Moreover, many people could even undertake both economic and non-economic activities on the same day of a reference week. Time disposition is recorded for every member of the sample households. By and large the work force estimates are likely to be highest as per the usual principal-cumsubsidiary status and lowest as per the daily status concept, the weekly status estimates lying between the two. This is because a person who has been broadly defined as a worker as per the principal-cum-subsidiary status may turn out to be unemployed or outside the labour force as per the weekly status concept and the daily status concept. Similarly a person who has been identified as a worker as per the weekly status concept may turn out to be a nonworker (either unemployed or outside the labour force) based on a stricter criterion of daily status. Those who are broadly defined as worker as per the usual status might have been grossly underemployed. Thus the unemployment rate as per the daily status concept would capture the extent of underutilization of the working persons in addition to those who are openly unemployed. The unemployment rate as per the daily status would be highest and the principal-cum-subsidiary status would be lowest while the weekly status would lie between the two. Keeping in view the differences in the concept it may be noted that the principal-cumsubsidiary based estimates are likely to draw a rosy picture of the employment scenario which may not be a realistic one. Thus there is a need to consider the weekly status based 58
63 estimates which may not overestimate the workforce. In fact, this the reason why we have provided all three sets of projections in the preceding section. While the usual status estimates tend to offer an outcome that may be interpreted as most optimistic one the weekly status estimates are more probable to capture those who have been pursuing work in a sustained manner. 3. With a major concern for pro-poor growth it is indeed important to know how much employment gets generated in the due course of growth. This would enable the government to develop effective employment planning and initiate several short term supportive measures in response to growth fluctuations, which are endemic to a market economy. Thus employment figures on annual basis are a pre-requisite. Though for past several years the NSSO has been collecting the employment-unemployment figures on annual basis the comparability problems have posed a serious concern. The thin rounds results tend to vary substantially from those of the large surveys of the quinquennium rounds even at the all-india level. 4. An important indicator of performance is labour productivity. Usually it is measured as the ratio of value added to labour. However, the problem with this approach is that if a unit adopts a highly capital intensive technology the value added per worker would naturally would turn out to be enormously high. From this if one tries to infer that labour earnings are going to be proportionately high, then it would be erroneous. Hence, there is a need to evolve new ways of capturing the contribution of labour. Instead of merely looking at the value added per labour for policy purposes it will be desirable to focus on additional indicators such as labour share in value added, wage rate per worker and growth in real wage and employment growth. The elasticity of wage with respect to productivity will be indicative of the extent of productivity gains that are being transferred to the workers. Below we present from Goldar (2011) the share of labour in the organized manufacturing, calculated as the ratio wage rate multiplied by the quantum of labour to value added. Table 4: Estimated labour income share, Indian organized manufacturing, select years Year Labour income share in gross value added Source: Goldar (2011). Various ways of improving productivity, particularly in the informal sector which is largely characterized by low productivity, includes credit assistance, asset creation, marketing assistance, reduction of the role of intermediaries, infrastructure provision, skill formation and up-gradation, imparting quality education, on the job training, dissemination of information pertaining to the nature of demand for the products and opening up possibilities for product diversification and improvement in the quality of goods and services. 59
64 5. The person day unemployment rate indeed covers those who are purely unemployed and in addition, those who may be working but their employment is characterized by underemployment. Thus, though the person day unemployment rate is likely to capture the working poor it is not entirely exhaustive. There are workers who are not underemployed but engaged in low productivity activities. Thus the remunerations they receive may not be adequate to meet the minimum subsistence level of consumption. In fact, that there are several workers who cannot afford to remain openly unemployed and thus they would fall into the category of working poor. A rough estimate of the working poor in India can be obtained by looking into the relative size of the informal sector which is extremely large even in the non-agricultural sector. However, not all informal sector workers are poor. Nor is it true that all poor are engaged in the informal sector itself. There can be workers in the formal sector engaged informally and lying below the poverty line. A second estimate of the working poor can be obtained by considering the relative size of self-employment and casual employment in the rural and urban areas. Much of the poverty is identified among the self-employed households as they are often grossly under-employed or engaged in low productivity activities. Similarly the casual labour dependent households constitute poverty due to the lack of sustainable employment, poor bargaining power and poor levels of skill. The best way of considering the set of working poor is to analyse the consumer expenditure data collected in the employment-unemployment surveys. This can also throw light on poor engaged across various activities. The 11 th Plan document recorded the incidence of poverty across various employment categories such as regular wage employment, self-employment and casual wage employment for the year and The same estimates we could not however reproduce for the year as the expenditure data from the employment-unemployment survey (66 th round) have not been reported so far. Table 5: Working Poor ( and ) Population Segment Self- Employed Regular Wage Employment Casual Labour Total Self- Employed Regular Wage Employment Casual Labour Procedure for collecting monthly per capita consumer expenditure (MPCE) in the Employment-Unemployment Survey: For collection of data on total expenditure of the household from employment and unemployment schedule (Schedule 10), a worksheet was used in 60 Total Rural Persons Urban Persons All Males All Females All Persons Note: UPSS basis. Source: Eleventh Five Year Plan, Page 85.
65 the Schedule 10 of the 61st round. The approximate value of consumer expenditure obtained through the worksheet has been used for studying employment and unemployment characteristics by different levels of living of the household members. The worksheet contained 36 different components of household consumer expenditure. Depending upon the type of item, either of the two reference periods viz,. 30 days and 365 days, was used to record consumption of different groups of items. The items of consumption were classified into four groups and three different approaches viz (a) consumption approach, (b) expenditure approach and (c) first-use approach, were followed for defining consumption of items. The different groups were (i) food (other than cooked meals ), pan, tobacco & intoxicants and fuel & light, (ii) cooked meals, miscellaneous goods and services including education, medical, rent, taxes and cess, (iii) clothing and footwear and (iv) durable goods. The procedure followed for defining consumption of the four groups were (i) consumption approach, (ii) expenditure approach, (iii) first-use approach and (iv) expenditure approach, respectively. The definition of household consumer expenditure and the procedure for evaluating that was the same for both Schedule 10 and Schedule 1.0. Recommendations In order to ensure inclusive growth employment has to pick up substantially during the 12 th Plan period. As seen from the exercises carried out the projected employment estimates are not invariably spectacular under different scenarios. Hence, various initiatives have to be introduced to generate employment opportunities on a large scale. Besides, as the share of agriculture is expected to decline over time, a great deal of alternate avenues would have to be created in the non-farm sector in the rural and urban areas both. Secondly the manufacturing, construction and transport, storage and communication sectors have to grow significantly since in all the three sets of projections the relative size of these sectors is expected to increase sizably. Such a structural shift in the employment composition can be possible through the following means: Rural industrialization: agro-based industries and other light goods industries have to be created in the rural areas to ensure rural diversification. The overall employment growth in the manufacturing sector has to increase in a significant way which can be achieved through adoption of labour intensive technology and a shift in the industrial production in favour of labour intensive goods. The small and medium sized enterprises have to grow sizably and attempts have to be made to make them economically viable. Both employment and productivity growth in the unregistered manufacturing sector have to be stepped so that employment in these units becomes gainful. Credit assistance, marketing assistance and other support in terms of infrastructural facilities have to be provided to these units. In order to provide a boost to the construction sector rural irrigation programmes and major infrastructure building programmes both in the rural and urban areas have to be initiated in a significant way. The IT sector and IT-related services have to grow so that they provide a major outlet to the skilled manpower of the country. Besides, they are expected to create secondary employment in which the semi-skilled and unskilled work force can be engaged. 61
66 Several support services have to be extended to the informal sector workers in order to enhance their productivity and well-being levels. A vast majority of the working poor are located in the informal sector and many of them are susceptible to vulnerability due to the lack of sustainable livelihood. In this respect the suggestions of the NCEUS offer important directives. Employment guarantee programmes, asset creation programmes, education and health facilities need to be introduced on a large scale. However, it must be realized that the employment guarantee programmes are only a short-run respite, and therefore from the long run point of view the growth in itself has to be made more employment intensive. References EPWRF (2011), A Note on Current Employment Situation and Estimation for the 12 th Five Year Plan. Goldar, Bishwanath (2011) Productivity in Indian Manufacturing in the post-reform period, Institute of Economic Growth, Delhi, March. Goldar, B.N. and A. Mitra (2010), Productivity Increase and Changing Sectoral Composition: Contribution to Economic Growth in India, in P. B. Nayak, B. N. Goldar and P. Agrawal, India s Economy and Growth, Essays in Honour of V.K.R.V.Rao, Sage, New Delhi. Government of India, The Eleventh Five Year Plan, Planning Commission. Mitra, A.(2008), The Indian Labour Market: An Overview, ILO Asia-Pacific Working Paper Series, ILO. Papola, T.S. Employment Trends in India, Institute for Studies in Industrial Development, New Delhi, Sundaram, K. (2007), Employment and Poverty in India, , Economic and Political Weekly, July 28. NSS Rounds, 1983, , and , National Sample Survey Office, Ministry of Statistics & Programme Implementation. Key Indicators of Employment And Unemployment in India , National Sample Survey Office, Ministry of Statistics and Programme Implementation National Accounts Statistics, Central Statistics Office, Ministry of Statistics and Programme Implementation. 62
67 Table of Contents Report of the Sub Group for Creation of Employment Opportunities 1. Introduction - Some conceptual issues 2. Overall Employment Trends - Quantitative Dimensions of Employment Trends - Qualitative Dimensions in Employment Trends Annexure V 3. Non-agricultural employment: A sectoral analysis of the 2000s and the potential for future employment growth - Employment trends in the unorganized and organized segments of industry and services 4 Employment Potential in the States - Employment in Agriculture - Performance of manufacturing employment of the States - Services - Non-Manufacturing employment 5. Employment for marginalized groups - Scheduled Castes, Scheduled Tribes and Muslims - The problem of discrimination : The case for public action - Women s employment - Child labour 6. Preparing for global economic crises employment implications - Increasing Employment in Labour Intensive Manufacturing Exports - Sustaining Domestic Demand to Generate Employment in times of crisis. 7. Summary and conclusions References Appendix Tables 63
68 Working Group on Creating Employment in the 12 th Plan 1. Introduction The most important strategy to achieve inclusive growth in the 11 th Plan has been to generate productive employment, with decent working conditions; on a large enough scale to provide employment to the growing labour force. With economic growth, it is reasonable to assume that employment should be growing. The question is also the sector in which employment should be growing. One of the structural transformations that any developing economy must undergo is that the share of agriculture in output and employment declines over time, and share of industry and services increases correspondingly. In India this structural transformation has been happening, but the movement of labour out of agriculture into industry and services has been relatively slow. The share of industry and services in output has increased sharply within the last 20 years but their share of employment still remains low, at 21.5% and 25.4% respectively in In the same year agriculture s contribution to GDP was 14.6%, of industry was 28.1% (manufacturing 15.9%, non-manufacturing 12.2%), and services accounted for 57.3% of GDP (see Table 1). Table 1 : International comparison of GVA and employment Sectors India GVA (%GDP) Employment (% of total employment) Sectors China GVA (%GDP) Employment (% of total employment) Agri Agri Industry Industry Of which :- Of which : Manuf Manuf Non manu Non manu Services Services Sectors Brazil GVA (%GDP) Employment (% of total employment) Sectors Russia GVA (%GDP) Agri Agri Industry Industry Of which : Of which : Manuf Manuf Non manu Non manu Services Services Employment (% of total employment) Note : Non-manufacturing share has been calculated by substracting manufacturing from Industry share Source : World Bank 64
69 Table 1 compares the sectoral contributions of the primary, secondary and tertiary sectors to GDP and to employment for major emerging market economies. What is clear is that India s industry is not contributing to GDP or to employment in the same way that is the case in other emerging market economy countries. In China and Indonesia, the contribution of industry to GDP was 47 and 49 per cent respectively. The contribution of the secondary sector to employment is also greater for all economies than in India. The other striking feature when we compare India to other countries in Table 1 is the extremely high share of services in GDP in India (also Brazil, Russia) compared to China and Indonesia. The third striking feature about India is the very high share of agriculture in employment, as compared to all the other economies in Table 2. Table 2 : Share in Employment and GVA across sectors Employment(in millions) Percent age GVA (in crore) (current prices) Percent age Organized manufacturing ,09, Unorganized manufacturing , Total ,97, Organized Non manufacturing ,27, Unorganized non manufacturing ,03, Total ,30, Organized services ,34, Unorganized services ,92, Total ,27, ,95,472 Sources: ASI (organized manufacturing), NSS 61 st round (non manufacturing and services), 62 nd round (unorganized manufacturing), CSO Clearly the most important challenge is to create non-agricultural employment as rapidly as possible. That remains the focus of this paper. With this objective in view, we empirically examine what has happened to employment in organized and unorganized manufacturing, organized and unorganized non-manufacturing industry, and in organized and unorganized services. Some conceptual issues One of the objectives in the 12 th Five Year Plan, while creating employment, needs to be that the work created should be (a) decent work and (b) productive employment. To achieve the latter objective transfer of surplus labour out of low productivity agriculture to industry or services would lead to an overall increase in productivity. In order to achieve the first objective two kinds of transitions would be needed: first, movement of unskilled labour 65
70 from agriculture to unorganized industry or unorganized services; second, movement of labour from informal employment in the unorganized sectors to either formal employment in organized sectors (preferably), or at least informal employment in the organized sectors. 1 We will discuss each one of these transitions in this paper. Creating employment during the 12 th Five Year Plan would require enhancement of the rate of migration of labour out of agriculture to industry and services. Till two decades ago the share of agriculture in total employment was nearly 70% in the Indian economy. The most recent NSSO survey suggests that this share has declined over time to 53%. But given the fact that 53% of the Indian workforce is producing barely 15% of GDP (which is the current share of agriculture share to GDP), the decline in the share of agriculture in total employment is nowhere close to fast enough. Therefore, increasing employment outside of agriculture must be a desirable goal in and of itself. That means that, while increasing the share of productive employment in all sectors of the economy is the most desirable goal, one concern is that some of the employment generated in the growth process could well lead to employment growing faster in certain sectors than does Gross Value Added (GVA). In an ideal world this outcome is not the most desirable, since employment increase must only be an increase in productive employment. But the point here is that until EE reaches unity employment is increasing alongside with productivity; it is only when EE exceeds unity in a certain sector that portion of the increase in employment could be termed unproductive employment, for whom EE is greater than one since labour productivity would not increase for that portion of workers. However, in an economy which is suffering from 8% unemployment by the CDS definition, an increase in employment may not always and simultaneously also increase labour productivity. The movement of labour out of agriculture to higher productivity generating industry and services is itself a gain in terms of equity and efficiency in the economy, even though the productivity gain in the case of those workers hired after EE goes over one may not be termed as being employed productively and hence they constitute a loss in potential efficiency. In fact, in the latter half of the 2000s, employment outside of agriculture has hardly grown at all, except to a small in manufacturing and very significantly in construction (i.e. non-manufacturing industry). Therefore, we would argue that although in an ideal world, employment increases where employment elasticity still remains between 0.3 and 0.7 is what is appropriate, the fact that so little increase in non-agricultural employment is occurring during the period of rapid economic growth suggests that in the current phase of development of the Indian economy, when rural distress in increasing, we should be willing to consider an employment elasticity of output in manufacturing and services up to 1 as both efficient & equitable. 1 NCEUS (2008) makes the distinction between formal and informal employment on the one hand and organized/unorganized enterprises on the other. Casual or ad hoc employment in organized enterprises would amount to informal employment in the organized sector. In fact, NCEUS estimates that some 7 to 8% of total employment in organised enterprises in the country is in the form of informal employment. Almost all the employment in unorganized enterprises, however, is likely to be informal. Informal employment in the organized sector is estimated by the NCEUS to amount to 7 of the 93% of total informal employment in the economy. 66
71 There are several dimensions to ensuring more decent work at the current stage of development of the Indian economy. First, when agriculture labour migrates to urban areas in search of work and finds employment, even if it may be casual work in unorganised services or industry, it does so because urban wage rates in even the unorganized sector are better than those prevailing in agriculture (or there may be an absence of work opportunities in agriculture in his district or state). Otherwise labour is unlikely to migrate to uncertain informal employment in urban areas. This is in fact one kind of transition to more decent work than agriculture labour, merely because the wages are likely to be higher. This kind of work is still not such as to provide employment security or income security or social security which is our definition of decent work but it is still better than work in agriculture (which may or may not be available). There is a second transition which is a positive step in the direction of decent work, which involves the transition from informal jobs in the unorganized sector to informal organized sector employment. Some 7% of total organised sector employment in the Indian economy consists of informal employment. Informal employment (e.g. as contract labour) in the organized sector would be superior in terms of security of work because there is likely to be a written contract as opposed to a verbal one in the unorganized sector, some benefits (e.g. assured leave and health benefits) other than salary are likely to be involved, and some degree of security of tenure would be available as opposed to complete uncertainty of tenure of employment that characterizes informal employment in unorganized enterprises. The third, or ideal type of employment creation that policy makers would like to see during the 12 th Plan, is growth in the size and share of formal employment in organized sector enterprises. This is the case because such employment would be characterized by security of tenure and wage rates well above agricultural labour, neither of which prevail in informal work in unorganized enterprises, and informal employment in the organized sector. In addition, it would be characterized by nearly complete social insurance (i.e., death and disability benefits, old age pension, maternity leave and health benefits). None of these three are likely to prevail to the same extent in the remaining three types of employment in the economy, which together account for 93% of the total employment in the country. Our analysis suggests that whether one examines manufacturing, or nonmanufacturing industry, or services, there is a consistent pattern in regard to the organized and unorganized segments of these non-agricultural sectors of the economy in that while in respect of employment the share of unorganized segments predominates, in respect of output (or GVA) it is the organized segment that contributes much more than the unorganized segment. The contrasts are most striking in regard to industry. Thus, Table 4 shows that unorganized manufacturing contributes to 85 per cent of total manufacturing employment in the Indian economy, while organized manufacturing s contribution is only 15 per cent (2004-5). On the other hand, for GVA the contribution of the organized segment is the exact opposite, i.e., 78 per cent, while the share of unorganized segment of manufacturing is 22 per cent to total GVA in manufacturing in the economy. Similarly, in non-manufacturing industry (i.e. gas, electricity, mining and construction), the share of the unorganized segment is 69 per 67
72 cent in employment, but only 32 per cent in GVA. On the contrary, for GVA the contribution of the organized segment is 68 per cent for GVA while the unorganized segment employs 69 per cent of all workers engaged in non-manufacturing industry. For services, the contributions to employment and GVA of the organized and unorganized segments are very different as well. Organized services contribute 27 per cent of all employment in services, but twice as much to total GVA produced by services in the economy. Unorganized services, on the other hand, are very significant in terms of employment generation (73 per cent of all services sector employment), but contribute much less (45 per cent) than organized services (55 per cent) of all service sector GVA (Table 4). Our analysis of the data, as well as that by NCEUS, suggests that the very first type of transition (from agriculture to unorganized sector informal employment) is growing most rapidly in relative terms. In other words, the shift towards of decent work and of productive work does seem to be growing. However, the other two transitions (from informal unorganized sector employment to informal organized enterprises, and from informal organized to formal organized employment) may be growing in absolute terms but in relative terms the change over time is nowhere near rapid enough. Since one of the most important segmentations in the Indian labour market is that between employment in organized and unorganized sectors, we examine both industry as well as service sector employment under the categories of organized and unorganized segments. In Section 2 of this paper we examine overall quantitative and qualitative dimensions of employment during the Section 3 examines the current status in regard to the absolute size of non-agricultural employment at the national level by sectoral 2-digit NIC level. We also disaggregate the sectoral employment and GVA trends by organized and unorganized segments within each sector. We also examine the potential for future employment growth by sector during the 12 th Plan period in each of the 6 sub-sectors (organized and unorganized manufacturing, organized and unorganized non-manufacturing industries, and organized and unorganized services). Section 4 disaggregates the overall sectoral trends in employment by state. Section 5 examines the issues related to employment for marginalized groups: Scheduled Castes (SCs), Scheduled Tribes (STs) and minorities, especially Muslims. This Section also examines the labour force participation rate of women outside of agriculture, particularly that in the organized private and public sectors. Section 6 lays down a framework to place employment generation and production at the heart of a revival stage in case of an economic crisis. The final section summarizes the main findings and policy recommendations. Section 7 summarises the findings and recommendations. 68
73 Section 2 Overall Employment Trends In this Section we will examine labour force and workforce participation rates, over the period 1993 to , the work force estimates over the past decade, the unemployment rate by UPSS, wages and consumption expenditure. In addition to these quantitative dimensions of employment in the Indian economy we will examine certain qualitative dimensions as well (enterprises classified by size class of employment, and employment by casual work/self-employment/regular employment as well as the issue of incidence of unemployment by level of education). Table 3: LFRR and WFPR by Usual Principal and Subsidiary Status, , and (%)- Persons Sector LFPR WFPR Rural Urban Quantitative Dimensions of Employment Trends: Table 3 examines the labour force participation rate (LFPR) between 1993 and as well as the workforce participation rate (WFPR) over the same period, which tend to follow the same trend over this time period. The LFPR is the ratio of the population in the age group 15 and above to the total population of the country. If the growth rate of total population is higher than the growth rate of those joining the labour force (i.e. the 15 to 64 years old) the LFPR shows a declining trend, which is exactly what the total shows. The total population growth rate, despite its constant decline over the past few decades, is still 1.6% per annum ( ), while the growth rate of labour force is lower. There is a constant decline in both rural and urban LFPRs over the period, as well as in the WFPRs. As soon as the population growth rate, which is systematically declining, is exceeded by the growth rate of the labour force the LFPR will start increasing. However, the growth in the labour force will be moderated by rising participation in education. The Right to Education for 6-14 years old will ensure that even those who turn 14 will continue in school especially since there is a high likelihood that the RTE will be extended to age 16 (to cover classes 9-10). Moreover, with the introduction of the NVEQF, and vocational education starting with class 9, there is a probability that drop-out after class 8 (age 14) will decrease, and children will continue in vocational education. For all these reasons, it is difficult to predict when the LFPR will start increasing. The increase in the size of the population in the working age has been relatively moderate so far. However, as the population growth rate slows and the LFPR starts to rise, the absolute number of those entering the labour force is going to rise, and rise at a growing 69
74 pace over the next 2½ decades the period until when this demographic dividend will be available. But this impending increase in the LFPR and the significant rise in the absolute size of the labour force is a phenomenon fraught with very considerable risks. And unless the growing increase in the labour force is productively employed there is a grave risk of rising unemployment and a corresponding increase in social tension, especially among the country s youth. In a country where the current mean age is only 24 and the median age only 29, this impending increase in the size of the labour force should underline the urgent need for increasing productive employment during the 12 th Five Year Plan. What is revealed by the latest 66 th Round estimates for the year (the latest data just released by NSS within the last few weeks) is that there seems to be a variety of good news coming out in the latter half of the decade ( to ). The WPR had increased during to (the two previous NSS rounds on employment) by 60 million, but the corresponding increase in the second half of the decade is only two million. This number could be used to draw the conclusion that employment growth has slowed in the period of faster growth in the latter half of the decade, and therefore casts doubt on the value of economic growth as a goal. However, this is not true, and this is demonstrated by the following inferences that can be made based on Tables 6 below, based on NSS 66 th Round of Table 4 : Workforce Estimates for , and (in millions) Principal status Principal status Subsidiary status Subsidiary status Age Group 0 to to Rural male Rural female Urban male Urban female Rural male Rural female Urban male Urban female Rural male Rural female Urban male Urban female Source: NSS 66 th Round, The first point refers to what has happened to Principal Status employment between the first and second halves of the 2000s. The principal activity status (PS) on which a person spends a relatively longer time (say farming his land) during the 365 days preceding the date of survey is regarded as the usual principal activity status of the person. In addition to her principal status activity, this person could have engaged in some other activity for 30 days or more during this time (called her subsidiary status). The two measures together are used to determine the size of the workforce, and also the number of persons both working as well as available for work (labour force). One expects that an improvement in principal status employment should lead to reduction in subsidiary employment (in other words, the person is 70
75 not having to rely upon at least two different sources of employment to earn a livelihood), which is exactly what is happening in India. This is what the data shows consistently since 1983, and also from Table 1 (see column 2) This positive conclusion is supported by our analysis in the next section, where we find that organized manufacturing employment has increased between and (i.e. a period of five years, as opposed to the between NSS rounds of six years till ) by 2.18 million (from 6.6. million to 8.78 million). Table 6 above shows that for urban males, who are the most likely to be employed in organized manufacturing, the increase in employment has been from 71 million to 83 million. The second important finding that emerges from Table 1 is that there is a growing absence of those under 25 from the workforce, which is another extremely welcome development another fact that emerges from the data. If children under 6 and children over 14 are not in the workforce, it is because they are increasingly in school. In fact, the 0-24 year age group sees a sharp decline in their WPR. This is happening because the incidence of child labour is declining and there is a simultaneous increase in school attendance of over 14-year olds(see IAMR, India Human Development Report 2011, OUP, forthcoming). The third important finding from the latest employment data available is about development in regard to women s employment. Since the 1980s there has been a near consistent decline in WPR for women. In the Indian case, far from being a bad thing, this is entirely a welcome development. Male PS employment in ages 25 or more, there has been a sharp increase in the growth of workers quite the opposite of what might be implied by the mere two million increase in total employment that occurred between 2005 and 2010 (that we mentioned earlier). However, the situation is quite different for women, whose employment has declined (just as there is a decline in employment of the young and in subsidiary status). Their employment fell because young women are attending school, which is where they belong. In fact, comparison over a longer period shows that from the 1980s there has been a sustained decline in women s employment. 2 Table 5: Unemployment Rate by Usual Principal and Subsidiary Status, , and (%) Sector Persons Rural Urban Table 5 shows the unemployment rate by usual principal and subsidiary status in , and , for rural and urban areas separately. The unemployment rate is the difference between the LFPR and WFPR (see table 3). The rural unemployment rate has been consistently lower than the urban one, which is not surprising given the of the rural workforce upon self qualification in agriculture, even though 84% of all farmers till under 2 Anant and Mehta (2011) point out that employment on account of subsidiary status, females and the young in shows an increase from , which marks a break in this long term pattern of decline. If we omit the data for , then the broad pattern of decreasing WPRs in these three categories is maintained. They also note that what confounds the picture is the fact that in we have a much sharper fall in WPR in these categories, leading to a correction, which leads to an apparent rise in WPR Between and They note that this phenomenon has been explained by some as resulting from an employment slowdown in the 1990s, or due to the fact that 1999 was an unusual year on account of a recession. In either case the results from from an illusion created by the survey. 71
76 one hectare of land the small and marginal farmers that eke out an uncertain livelihood. What is worrying is that on account of the slow rate of growth output in agriculture in an otherwise high growth economy, the unemployment rate by UPSS has only shown an increase between and , and has remained at roughly the same level in On the contrary, in urban areas, where a lot of the economic growth has tended to be concentrated, there has been a decline of the employment rate 4.5% in to 3.4% in Table 6 shows some further positive developments in the latter half of the 2000s. Unemployment by the UPSS measure seems have declined, after rising from 6.06 per cent in to 7.31 per cent in and further to 8.2 per cent in But, as we noted above, more men are indeed working in the latter half of the decade compared to the first half, more girls are going to school, both of which suggest that incomes are rising. It appears that this information is consistent with the phenomenon that wages are rising, not just in salaried work, but also in casual work. Table 6 : Unemployment, wages and consumption expenditure, Unemployment rate (%) Salaries & Wages Consumption Regular Casual Rural Urban (Rs. Per day, for male rural workers Monthly per capita (in Rs.) , , Source: NSS various rounds The rise in employment for males and the rise in wages have led to a sharp rise in consumption, which is also shown up in the NSSO data on consumption just released (see Table 7). In real terms, monthly per capita consumption expenditure in rural areas rose by 0.2 per cent per annum between and ; this rose to 0.8 per cent per year in the to period, and then to 1.4 per cent per year in the five years from to For urban areas, real per capita expenditures grew by 0.98 per cent in the to period, by 1.47 per cent between and , and further to 2.67 per cent between and One must remember that NSS data captures less and less consumption in the country, and the consumption estimate one gets from NSS data is about 4- per cent of the consumption estimate from National Accounts. In other words, the actual growth would be much higher than reflected in this data. These are the reasons that poverty is falling. Qualitative Dimensions in Employment Trends: In Table 7, 8, and 9 we examine some qualitative dimensions of the employment in the Indian economy, in turn. 72
77 Number of Workers in Enterprises Table 7: Number of Workers by size of enterprise Number of Number of Workers in Workers in Million Share Million Share Less than & above but less than & above but less than & above Table 8: Number of workers according to usual status (ps+ss) approach by broad employment status (in Million) Self Employed Regular wage/ salaried employee Casual labour Table 9: Incidence of Unemployment for 15 years and above age group, by level of education, and (UPSS) Level of Education Not Literate Literate Without Formal Schooling Below Primary Primary Middle Secondary Higher Secondary Diploma / Certificate Graduate Post Graduate & Above All Level of Education Size of Enterprises by Employment: In Table 7 we examine the number and share of workers in what could be termed as micro, small, medium/large enterprises. There seems to be a remarkable shift occurring in non-agricultural employment in the 2000s if we examine the size class of enterprises by the number of workers that they employed. The workers in the enterprises with less than six employees (i.e. micro enterprises) show a remarkable decline both in absolute as well as in relative terms between and Such micro enterprises accounted for million workers in the middle of the decade, or 75% of all non-agricultural workers. By the end of the decade the number of workers in such enterprises had fallen by nearly 4 million, and the share of such micro enterprises in the total non-agricultural employment was down to 73
78 65.6%. Correspondingly there was an increase in the number of workers employed in enterprises with 6 and above but less than 10 workers, from 15.2 million in the middle of the decade to nearly 24 million at its end, thus raising the share of workers in such enterprises from 7.5% to 10.5% of all non-agricultural employment in the country. This is clearly a positive development since it is easier for slightly bigger enterprises to be reached with services (credit, marketing support, design support). It is also better for workers since it reduces the fragmentation and enables them to organize which is next to impossible to achieve when workers are dispersed into millions of micro-enterprises. What is remarkable about this shift in the size class of enterprises by employment in non-agricultural work is the growing absolute number of employees in enterprises where 20 or more workers were employed. Workers in what could be called these middle and large enterprises, by size class of employment, rose from 24 million in by a remarkable 15 million to nearly 39 million at the end of the decade. At the same time the share of such employment in total non-agricultural employment grew from 11.8% to 17.1%. This is consistent with our argument, based on the analysis of organized manufacturing employment in the latter half of the 2000s, that there has been a rise in organized sector manufacturing. The Self-employed, Regular Wage Employed and Casual Wage Labour Table 8 presents, for three points of time ( , , ) disaggregated data for the workforce distributed by category-wise employment: the self-employed, the regular wage/salary worker and the casual labourer. The self-employed see a remarkable increase in employment in absolute terms until the middle of the decade, and then a decline; a similar trend is noticeable for the share of self-employed in the workforce. The decline is largely explained by withdrawal of women in the workforce of about 23 million women (of which 1.7 million got jobs as casual labour and 0.2 million as self-employed. As much as 21 million of these women were in rural areas who, as we noted earlier, withdrew because they were either now studying or engaged in domestic work. Urban women did the same but on a much smaller scale. The decline in the numbers of self-employed has a corresponding increase in the numbers of those who had casual work in the latter half of the decade. Both types of work are in the unorganized segment, so there is little change in terms of the quality of employment both would involve informal employment. In terms of the quality of employment, the one welcome development has been the consistent rise in both the absolute number as well as the share of workforce of regular workers, throughout the decade. The increase oover the decade was 17 million. Yhis welcome development needs to continue. The only downside about this increase, at least in the latter half of the decade, is that 96% of the jobs were picked up by men. Incidence of Employment by Level of Education It was a remarkable fact about the incidence of employment by level of education in India (by UPSS) that illiterates have the lowest rate of employment, and rate of unemployment tends to rise with every level of education: primary, secondary and higher secondary, with the highest unemployment rate characterizing those with diploma/certificates (or those with one or two years of post higher secondary education). (see Table 9) In fact, the last group had an unemployment rate of 10.4% in and 9.6% at the end of the decade. The unemployment rate does decline for graduates and slightly again for postgraduates and above, but not significantly. In other words, those with relatively higher education are clearly still able to survive, precisely because unemployment over 182 days of the preceding 365 days (before the survey closed) is a situation that can be borne only by the relatively well-off (who are also the relatively better educated). What is interesting is that by this UPSS measure the unemployment rate is very low for the illiterate or neo literate, 74
79 but by the current daily status (CDS) measure the unemployment rate in the country is close to that (by UPSS) of those who have graduate qualification. Section 3 Non-agricultural employment: A sectoral analysis of the 2000s and the potential for future employment growth Employment growth in non-agricultural sectors: The strategy for increasing employment during 12 th Five Year Plan must rely upon an analysis of how employment trends have evolved over the last decade. For this reason most of the analysis in this section will rely upon employment trends for agriculture, manufacturing, non-manufacturing industry and services. Most of this analysis has been conducted at one and two digit NIC code level. All analysis in this section is presented on a national level for sectors within industry and services. In this section we will also address the concern raised at the beginning of this paper regarding distribution of employment, and employment growth, between the organized and unorganized segments of industry and of services. We will close by tentatively suggesting what could be potential sectors that could generate productive employment during 12 th Five Year Plan based on this analysis. However, we would emphasize at the outset that the 23 sectors identified in the 11 th Five Year Plan potential growth sectors for output and employment have had a rather mixed experience over the 11 th Plan period, and we should be quite cautious in recommending with any degree of certainty what could be potential growth sectors in the 12 th Plan period. This cautious approach is necessary because over the course of the 11 th Plan period these sectors have been repeatedly coming up in the policy discourse within government and among the academia. The next section presents disaggregated analysis at one digit level NIC code at state level, in order to give further richness to the national level sectoral analysis in regard to employment and output in the past decade. In appendix table 1 we examine the question as to the degree of structural change that is taking place in respect of employment ( in the sense that labour is shifting from agriculture to industry and services) as shown by NSS data for the decade of the 2000s. For this reason, as often as possible, we examine employment trends for various sectors for 3 points of time: , and We examined in the previous section overall employment trends (overall participation rates, unemployment rates, and several qualitative dimensions in regard to employment over the decade 2000s). We also found that some interesting changes have occurred in regard to the distribution of employment by size class of an enterprises. However, the fundamental issue facing the Indian economy at the commencement of the 12 th Plan period is whether more rapid employment growth can be combined with the on rapid growth of output in industry and in services. One of the main objectives of the growth strategy in the 12 th Plan period must be to ensure that the process of structural change in terms of employment is accelerated. So what is the nature of the structural change that is taking place in employment that we observe from examination of the data for 3 points of time (as shown in Table A-1)? Agriculture saw an absolute increase in employment in the first half of the decade from 238 million in to nearly 259 million in This increase in agriculture, at face value, cannot be seen to be a positive development, if the expected structural transformation with growth is that there would be a shift of labour from agriculture to non-agricultural employment. However, if the increase in employment in agriculture in first half of the decade is accounted for by a diversification into allied economic activities like fishery, dairying, poultry, sericulture, horticulture and floriculture, it is indeed a welcome development. 75
80 However, while in the latter half of the decade there was a decline in absolute numbers employed in agriculture from 259 million to 243 million, the problem remains that total agricultural employment at the end of the decade was still higher than at the beginning of the decade. That means that the process of structural change in employment that one would expect with a period of very rapid, in fact unprecedented, growth rate in output in the economy outside of agriculture, is not occurring. In fact, if anything, that process of structural change is stalled at least as far as the employment structure in the economy is concerned. In manufacturing, there is an absolute increase in employment in the first half of the decade from 44 million to nearly 56 million in This increase by nearly 12 million in manufacturing in the first half of the decade was, however, off-set by a decline by 7 million in the second half of the decade. What is interesting is that the absolute size of employment in (48.54 million) was up by about 10% from total manufacturing employment of 44 million at the beginning of the decade. Non-manufacturing industry has been the star performer in terms of generating employment in the decade. In the first half of the decade non-manufacturing employment increased from 21 million in to 30 million in , or nearly 50% increase on the base of employment in But in the second half of the decade the absolute size of employment in non-manufacturing doubled by the end of the decade compared to , or tripled relative to the level in In fact over the entire decade there was an increase in non-manufacturing employment by a total of 34 million jobs. As table A-1 shows, the most important contribution to the increase in nonmanufacturing employment over the decade came from the construction sector (as much as 90% of the increase in the first half of the decade, and 100% in the second half of the decade. Mining and quarrying has seen a small increase in employment, and electricity, gas and water supply have seen a very marginal increase. The total contribution of services to employment in India is 24.5% (while that of industry is 21.5%, of which 11% is accounted for by manufacturing). The share of services in total GDP is more than double (55% in ) its share of employment. Given the fact that output growth in the Indian economy in the 2000s has been led by both services and industry, we should be particularly interested in the outcomes in services in respect of employment. Table A-1 shows that in the first half of the decade total employment in services increased from 94.2 million to million (an increase of 18.8 million in the first half of the decade). However, in the latter half of the decade there was no increase whatsoever (in fact a marginal decline) in total employment in services. Trade is far away the most important contributor to employment in services of the 10 service activities mentioned in Table A-1. It accounts for a third of total services employment in the economy both at the beginning as well as at the end of the decade. It accounted for around 36% (nearly 7 million) of the increase in employment that occurred in the service sector in India in first half of the decade. However, like so many other sectors in the second half of the decade, trade too saw a decline in employment. The second most important sector within services is transport, storage and communication. It accounted for 15.5% of the total services employment, and on account of the increase in employment that occurred throughout the decade it accounted for 17% of total service sector employment at the end of the decade. The third most important segment in service sector employment is public administration and defence, in which there was a fall of nearly 16% in total employment in the first half of the decade, followed by the slight increase in the latter half. The important point is that compared to the beginning of the decade public administration and defence had seen a fall by 15% of total employment. At first sight this could be interpreted as a positive development, given the fact that the composition of employment within public administration 76
81 in particular is heavily biased in favour of lower level employment, or people with rather low levels of skills. For example, in the central government only 12% of all employees are accounted for by class A and class B group employees, while 88% of total central government employees are accounted for by groups C&D. Given that wages and benefits paid in government for levels C&D are well above those which are available to employees in the private sector at comparable level of employment and skills, this is a situation which remains completely unsustainable. With the increasing diversification and growing sophistication of the Indian economy, the share of public expenditure in GDP must continue to rise, since it is well known that public expenditure to GDP ratio tends to rise systematically with per capita income on an average. For instance, the share of government in GDP in OECD countries is well over 40%, while that in India is still around 30% of GDP. The historical evidence from the nowindustrialised countries is that rise in per capita income will be accompanied by a rise in the size of government, and hence a rise in public sector employment. However, the real issue is whether public employment will increase in the sectors where it is most required, especially for regulatory functions or to improve the quality of policing, filling vacant posts in the judiciary, increasing a number of teachers in schools, and that of doctors and para medical staff in the public health system. These are the areas where public employment will need to expand as the economy becomes more complex and the functions required to be performed by government response to the needs and demands of an emerging market economy. This is a issue that policy makers must confront in the preparation of the 12 th Five Year Plan. Among the economic services it is notable that hotels and restaurants have seen sharp increase in employment of 1.5 million in the first half of the decade starting from a base of 4.6 million at the beginning of the decade. What is surprising is that this growth was not sustained at all in the latter half of this decade and there was, in fact, a slight decline of employment in this sector. The other important economic service which has shown, as expected, an increase in employment is banking and insurance in both the first half as well as the second half of the decade. Employment in banking and insurance, which was 2.25 million in had risen to 2.74 million in The other interesting service sector is real estate in which there was a consistent increase in employment throughout the decade, from 2.7 million in to 4.7 million in the middle of the decade, to 5.7 million at its end. This is hardly surprising given that both housing as well as infrastructure investment in the 11 th Plan period has been growing rapidly. We saw above that construction contributed the largest increase in total employment in the economy in both the first and second halves of the 2000s. The increase in employment in real estate is a mirror image of the increased construction activity. We know that investment in infrastructure at the beginning of the 11 th Five Year Plan ( ) stood at 4.4% of GDP, but it share in GDP rose to 7.5% in the terminal year of the 11 th Five Year Plan. Hence it is not surprising that both construction (within industry) and real estate services have seen a consistent increase in employment. One can foresee that this trend will remain unabated during the 12 th Five Year Plan. This is because investment in infrastructure is expected to grow from $500 billion during the 11 th Five Year Plan to 1 trillion dollars in the 12 th Plan, i.e. to nearly 10% of GDP. Even more importantly the share of private sector in infrastructure investment, which was 30% of all infrastructure investment during the 11 th Five Year Plan is expected to rise to 50% at the end of the 12 th Plan. In other words, the scope for increase in employment in real estate services is going to be significant, just as expansion of employment in the construction sector is going to increase during the 12 th Five Year Plan. The somewhat intriguing results are in regard to employment in health and education services. Due to government investment in school education, especially the Sarva Shiksha Abhiyan, there has been an increase in the number of teachers hired by government schools throughout the country. Private school enrolment and hence teacher hiring have also 77
82 increased. Hence it is not surprising that there was an increase in the number of those employed in education from 8.5 million in of about 3 million in However, there was no increase in employment in education in the latter half of the decade, and in fact, there was a decline by 0.34 million. This seems slightly counter-intuitive, given that the education sector s growth has remained robust. The growth rate of GVA between and in education was 5.9% per annum, and it actually increased to nearly 7% per annum in the latter half of the decade. Similarly, in health which accounts for only a third of the employment generated by the education sector there was a large increase in employment in the first half of the decade from 2.6 million to 3.3 million, but the increase in employment was marginal in the latter half of the decade. It appears that while the growth rate of GVA in health was robust (8.3% per annum) in the first half of the decade the GVA growth in health declined to 3.5% per annum in the second half of the decade, which perhaps explains the rather small increase in employment in the health sector in the latter half of the decade. Nevertheless, in the education sector the decline in employment, even though it is ever so slight, in the latter half of the decade remains intriguing simply because the growth rate of GVA in education was 5.9% per annum in the first half and remained robust in the second half at nearly 7% per annum. The share of manufacturing in GDP is supposed to rise from its current 15% to 25% by the end of the 13 th Five Year Plan However, manufacturing today accounts for 15.3% of GDP, which is not any different from its 15.5% share in GDP in The share of manufacturing in employment actually fell slightly from 11.1% of total employment in to 10.5% in In other words, the challenge before the country s policy makers is to not only increase the contribution of manufacturing to gross value added in the economy, but also its contribution to employment in a context wherein the last decade of rapid economic growth there has been almost no increase in the contribution of manufacturing to either output or employment in relative terms. Therefore, we have to look carefully at the sub-sectors within manufacturing as a whole to discover where the potential for employment increase exists over the next five years, given the experience of the past decade, Table A-4 shows the absolute level of employment (in millions) for 15 sub-sectors within manufacturing for three points of time ( , and ). Total manufacturing employment increased in the first half of the decade by 12.5 million from 43.3 to 55.8 million. This remarkable increase in manufacturing employment in the first half of the decade was off-set by an absolute decline in employment in the latter half of the decade by 7.2 million. In other words, the decade ended with an over 5 million increase in employment in manufacturing as well, despite a decline in the latter half of the decade. It should be instructive to examine which of the 15 sectors experienced an increase in employment in manufacturing over the decade (See Table A-4). Six experienced reasonable increase in total employment: textiles; wearing apparel and leather products; paper and paper products, and publishing and reprinting of recorded media; basic metals; motor vehicles and other transport equipment; furniture; and medical and optical instruments, watches and clocks. Several major sectors which account for about 10% of total employment in manufacturing saw no increase in employment or an actual decline: food products and beverages, tobacco products, non-metalic mineral products and fabricated metal products. 78
83 The six sectors where there was an increase in employment over the decade in manufacturing together account for a little over 50% of total employment in manufacturing in (see Table A-6). It is critical, therefore, that both the central government as well as the state governments where the production of these manufacturers is concentrated, must give due attention to support these sectors. These six sectors also experienced robust growth in GVA in the latter half of the decade. Employment trends in the unorganized and organized segments of industry and services In Table A-7 we provide a detailed analysis, at 2 digit NIC level for three points of time: , and The table shows the total number of workers by sector (NIC 2 digit level). Agriculture: We have already seen earlier that structural change in terms of employment has hardly even begun during the period of rapid economic growth of the 2000s, despite rapid growth in output. The numbers employed in agriculture at the end of the decade are still slightly higher than those at its beginning. The share of the organized segment of agriculture in total agricultural employment (238 million in and 243 million in ) was barely 5.5 million at the beginning and fell further to 3.8 million workers at the end of the decade, while numbers in the unorganized segment slightly increased from 232 to 239 million. Manufacturing: The not so positive development during the 2000s is the fact that the number of those employed in manufacturing increased from 44 million at the beginning of the decade by 11 million to 55.8 million in , but fell back again to 48.5 million at the end of the decade. In first half of the decade there was a very sharp rise of 30% in unorganized employment in manufacturing, but over 6 million workers in unorganized employment in the manufacturing sector in had lost their jobs by the end of the decade; as a result total unorganized manufacturing employment had fallen to 33 million. Organised manufacturing, which accounted for 30% of total manufacturing employment at the beginning of the decade, increased its share to only 32% by the end of the decade. In other words, to the extent that organized employment constitutes an improvement in the scale of decent work over unorganized sector employment (See Section 1), over the decade of rapid economic growth there was not any improvement in this regard either. Let us, however, proceed to examine in more detail some important sectors within manufacturing, focusing mainly on those which employ at least a million workers in manufacturing, taking the organized and unorganized segments together. In a country where agriculture still continues to employ 53% of the total workforce food products and beverages should be a major employer. At the beginning of the decade nearly 6 million workers were engaged in this sector but their numbers fell through out the decade. It is notable that there was no decline in the organized segment of this sector, and in fact a slight increase of 200,000 workers in the latter half of the decade. It was the unorganized segment of food products and beverages where the loss in employment took place. This is particularly 79
84 worrying because, as we saw in table A-5, compound annual growth rate (CAGR) of GVA for food products and beverages was positive in the first half of the decade and increased sharply to 6.6% per annum in the latter half of the decade. The fact that the organized segment employment in this sector was increasing during the decade suggests that, even though technological change might have been taking place in the sector, it did not displace workers; in fact the rise in the CAGR of GVA suggests that employment should have increased. But employment elasticity of output in the first and second halves of the decades were negative. In fact, one wonders about the logic of those drafting the 11 th Five Year Plan (See Chapter 4 on Labour and Employment Volume 1), who included food products as one of the 13 industry groups that were identified in the Plan as high growth sectors for both output and employment. However, as we have just seen, while output of food products did increase sharply during the 2000s, employment actually fell. Tobacco products is nearly as important an employer in manufacturing as food products and beverages. Total employment in tobacco products manufacturing increased slightly from 4.4 to 4.6 million in the first half of the decade; but fell to 4.1 million by the end of the decade. It is interesting that there was a slight increase in employment in the organized segment of tobacco manufacturing, but a much larger decrease in unorganized segment tobacco manufacturing, which essentially means that Bidi making was declining as an employer and generally as an economic activity. Textiles has remained the major source of employment through out the decade, and has experienced an absolute increase in employment as well. Most of the increase in employment in textile manufacture has come from the unorganized segment, in which employment rose from 5.7 to 7.5 million in the first half of the decade. However, there was large scale retrenchment in the unorganized segment of textile manufacture after , which brought total employment down at the end of the decade to a level below that prevailing at its beginning. By contrast, organized employment in textiles remained stable. It is interesting that in the 11 th Plan s identification of growth sectors for the 11 th Plan period textile products was not included (although handlooms was). It appears, therefore, that the large retrenchment that occurs in the latter half of the decade in unorganized textile manufacturing is due to the impact of the collapse of export markets in Europe and North America, especially but not only for handlooms (as we discussed in a later section). The collapse of employment in the textiles sector is worrying because there was no let up in the growth rate of GVA over the entire decade, since growth rate of GVA was 6.1% in the first half and 5.94% in the second half of the decade. In other words, productivity increase was occurring at the cost of employment (employment elasticity of output was 0.71 in the first half of the decade, but became in the second half of the decade). In wearing apparel, as for textiles, there was a sharp increase in total employment in the first half of the decade from 3.7 to 8.9 million, a nearly tripling of total employment in this sector. Most of this increase was naturally accounted for by the sharp increase in the unorganized segment manufacturing of wearing apparel, a significant proportion of which was for export. In fact, there was after 2008 a dramatic collapse in demand from export markets, and a 80
85 smaller decline in unorgnised segment employment from 7.1 to 6.2 million. The organized segment of wearing apparel manufacturing accounts for a fraction of total employment in this sector; while the first half of the decade saw an increase by a million new workers in the organized segment, in the latter half of the decade the organized segment, like the unorganized segment, lost a million workers. Wearing apparel had seen such a sharp increase in the employment in the first half of the decade that employment elasticity had reached an astonishing 18.3, only because the growth rate of GVA was under 1% per annum in the same period. However, when employment in the wearing apparel was collapsing in the second half of the decade GVA was galloping at 7.8% per annum, thus suggesting that the brunt of the adjustment following the collapse in demand was borne by workers, and not by capitalists. Wood and wood products (except furniture) is another major employer in Indian manufacturing. The total employment in these products grew in the first half of the decade from 4.5 to 5.2 million, and then collapsing again to 3.5 million in the latter half of the decade. Most of the change both in first and the second halves of the decade was accounted for by trends in employment in the unorganized segment of this sector, while employment in the organized segment remained quite stable, and rather marginal to total employment in the manufacturing of wood and wood products. It is interesting that wood and bamboo products was one of the 13 industry groups identified by the 11 th Plan as a potential growth sector. This may well have been the case based on the 15% increase in employment that had occurred in the first half of the decade, i.e. before the 11 th Plan was written. Wood and wood products are not a major export item, and hence the demand collapse that explains the decline in employment in this sector is probably the result of collapse in domestic demand. As for wearing apparel, wood and wood products saw a sharp increase in the growth rate of output in the latter half of the decade from -1% per annum to 11% per annum. Here again, the collapse in employment accompanied by a sharp rise in gross value added suggests that the brunt of adjustment to the decline in demand was borne by workers. Non-metallic mineral products had also seen an increase in employment in the first half of the decade from 3.4 to 4.5 million, with both the organized and unorganized segments contributing to this increase. There was a similar collapse in employment in both organized and unorganized segments in the latter half of the decade. Here is another sector that was included among the 13 industry groups that the 11 th Plan identified as potentially providing high growth during the 11 th Plan period, in respect of which the reality in regard to employment proved otherwise. This is particularly remarkable because, as with several other sectors discussed above, the growth rate of GVA actually picked up from 5% in the first half to 11.3% in the second half of the decade. Fabricated metal products (except metal equipments) also saw a sharp increase in employment from 3.7 to 4.2 million in the first half of the decade, with the entire increase in employment accounted for by the unorganized segment. In the second half of the decade, however, employment collapsed in the sector to half the level five years earlier with both the organized and unorganized segments contributing to the decline. Like the other sectors 81
86 discussed above, fabricated metal products also saw a dramatic increase in the growth rate of GVA in the latter half of the decade, from quite 2.3 to 10.7% per annum. Here again, the combination of rapid output growth with sharp employment decline implies that productivity increase was so sharp that the employment elasticity of output went from a respectable 0.85 in the first half to in the second half of the decade; technological change was hurting employment. Manufacturing employment: Informal vs. formal employment in organized manufacturing We have noted about, the basis of an analysis of NSS data for , and , that employment in the organized segment of manufacturing has grown from 13.1 to 16.6 and then fallen to 15.5 million in each of the three years respectively. It is very important to emphasis that even in organized manufacturing employment, as defined by the NSS there are both types of employment: formal and informal. We noted in Section-1 that the most decent form of employment would be formal employment in the organized sector of the economy. In order to assess the size of formal Vs. informal employment in organized manufacturing over the past decade we examine data from the annual survey of India for three points of time , and (the latest year for which ASI data for organized manufacturing is available for ). The contrast between employment in organized manufacturing as defined by the NSS as against the ASI definition is instructive. In NSS reports organized manufacturing to be employing 13.1 million workers, while ASI reports that the size of employment in organized manufacturing is less than half as 6.3 million. The definition that ASI uses for organized manufacturing is that the firms counted are those registered under the factory ACT 1948 employing 10 or more workers; this is the tighter definition than the one used by the NSS to identify firms in organized manufacturing. According to the NSS enterprises run by government (or included in the public section) and cooperatives, trust and other type of enterprises employing 10 or more workers as belonging to organized manufacturing the later definitions includes both formal and informal employment (see Section -1 for the distinction), while the ASI s definition is restricted to formal employment. In other words the difference between the ASI s number for workers employed in organized manufacturing 16.6 million and that of the NSS (13.1 million, is explained by the fact that 5.1 milllion of the 13.1 million in NSS s organized manufacturing segment are workers that would be regarded as contract or ad-hoc labour (i.e. informal formal workers in the organized segment of manufacturing industry). By organised manufacturing by the ASI definition is barely increased from 6.3 to 6.6 million, while NSS reports that it grow by 3 million (13.1 to 16.1 million). NSS is reporting that by the broader definition of oragnised manufacturing, employment fell from 16.1 million in to 15.5 million in However, ASI is reporting that by the tighter definition (which focuses formal employment alone) actually increase from 6.6 to 8.8 million between and The conclusion that emerge is as follows: 82
87 Total employment in manufacturing in India increased from 44 million in to 55 million in , following 248 million by Most of the increase in the first half and decrease in the second half of the decade was accounted for by manufacturing employment in the organized segment of the industry, although there was some increase in the organized segment as well. However, if we are interested in analyzing the implications for the quality of work of these quantitative changes over the decade, we should examine not only the trends for the organized and the unorganized segments separately but also assess whether, within the organized segment formal employment has been growing at the expanse of the informal employment. The conclusion appears to be not only that the organized segments growth in employment has been marginal, despite a growth rate of manufacturing GVA over the decade, the distribution of segment employment between formal and informal suggests that atleast half of employment in organised manufacturing has remain of an informal nature. The reasons for this trend, continuing from an earlier period, cold lie in a number of factors (labour laws, technology upgradation being largely confined to the oragnised segment, tax laws, among other reasons), but that is a subject for further research, which must be undertaken if appropriate policy response by state governments and the central government during the 10 th Five Year Plan. Non-manufacturing industry While employment in manufacturing and in services had increased sharply in the first half of the decade, in the second half employment in these sectors remained either stagnant or fell. By contrast, employment in non-manufacturing industry, and especially construction, provided hope to the millions working in agriculture who wanted to leave agriculture in favour of employment in manufacturing, services, or the three or four economic activities part of non-manufacturing industry (construction, electricity, gas and water supply, and mining). Mining saw an increase in employment from 2.17 million to 2.64 million in the first half of the decade, and a further increase to 2.75 million in the second half. Most of this increase was accounted for by the organized mining segment, while the unorganized segment saw only a very marginal increase in employment over the entire decade. 3 The star performer of all sectors in respect of employment, by far, was construction, which saw an increase in employment from 17.4 million to 26 million in the first half of the decade and a further doubling in the second half to 52 million. Table A-7 shows that there was a very sharp increase in employment in the unorganized segment through out the decade. However, the most surprising phenomenon is that the organized segment of construction also saw very sharp increase in employment, from 4.6 million to 6.35 million in the first half of the decade. But the most stunning increase is the quadrupling of employment that occurs of 3 It is possible that NSS data is not capturing the full extent of employment in mining in its unorganised segment, given large and growing evidence emerging over the decade of large scale illegal mining taking place in many mining states of the country (Chhatisgarh, Jharkhand, Andhra Pradesh, Orissa and Karnataka). It is perfectly possible that these workers in illegal mining were instructed not to report where they were working for fear of being identified as engaged in illegal activity. 83
88 organized construction in the latter half of the decade within a matter of five years from 6.35 to million. This latter increase in organized construction s contribution to employment growth could only be explained by the fact that there was a significant expansion of infrastructure investment during the 11 th Five Year Plan period from 4% of GDP at the beginning of the Plan increasing to 7½% of the GDP in the terminal year of the Plan. While most of the increase in unorganised sector employment in construction would be that coming from private development of housing, it is possible that the large scale projects involving the construction of airports, metros, highways and express ways, urban flyovers, and private ports, are likely to have involved such huge firms as L&T, Gammon India, GMR and so on all of which are likely to have employed workers directly on terms usually applicable in the organized segment, even though their sub-contractors would also generate significant employment in construction in the unorganized segment. Wholesale and retail: Together, these contributed nearly as much employment as did all of manufacturing taken together. In fact there was an increase in total employment in wholesale and retail trade from 36.6 million at the beginning of the decade to 42.1 million at its end. Until the middle of the decade there had been an even sharper increase of 43.4 million, after which it tended to decline slightly. The vast majority of those working in wholesale and retain trade are in the unorganised segment. Wholesale trade contributed under 10% of total employment in wholesale and retail trade at the beginning of the decade, and at the end its share had only increased to 12%. Most of the employment, in other words, in trading is generated by retail. As with services generally, there was a slight increase in employment in wholesale trade until the first half of the decade, which was followed by a slight decline in absolute terms. All the controversy in regard to employment in trade has been centered on retail trade, in particular the possible growth of organized retail. The first half of the decade saw a decline in employment in organized retail trade from 1.69 to 0.95 million. However, in the second half of the decade employment in organized retail rose to the level prevailing at its beginning (1.66 million). Despite the controversy, there was no absolute increase in employment in organized retail over the entire decade; unorganized retail trade, however, did see a rise in employment of nearly 2 million at the end of the decade compared to its beginning. Those who examine the employment in retail trade only in the second half of the decade may well conclude that organized retail employment rose by 7.1 lakh just when employment in the unorganized retail declined by 14.2 lakh. However, an examination of the trend over the entire decade suggests that overall employment in unorganized retail at the end of the decade was higher by at least 10% compared to its beginning, while organized retail employment did not increase at all. Given that the total sales is under 5% of all retail sales the scope for both to grow organized as well as unorganized retail during the 12 th Plan period remains promising. Hotels and restaurants: This sector saw an increase in employment over all, and the contribution of the unorganized segment has remained overwhelming through out the decade. 84
89 In fact the contribution of the organised segment was barely 12% at the beginning of the decade and had merely risen to nearly 15% at its end. As one would expect, the organised segment has risen in absolute and relative terms, but the rise in employment in the unorganized segment was much larger. This would suggest that the 11 th Plan s expectation that tourism (which would consist of both hotels and restaurants, as well as transport services for tourists) would be a growth sector during the 11 th Five Year Plan period did prove to be corrected. One could argue in fact that employment in both organized as well as unorganized segments of hotels and restaurants will continue to rise during the 12 th Five Year Plan period. Transport, storage and communication: This segment saw a steady increase in employment throughout the decade, both in the organized as well as in the unorganized segments. However, the sharpest increase occurred in the first half of the decade, in the unorganized segment. Banking and insurance: This sector also saw a steady increase in employment in both organized and unorganized segments through out the decade. In fact, one can take it for granted that this segment will go on increasing during the 12 th Plan period, given the very low rate of coverage of the population within the banking network. With some 50% of the population which is still unbanked, the growth of the branch network on the one hand and the phenomenon of banking. correspondents on the other should see a steady growth in employment in the banking sector during the 12 th Plan period. At the same time, with growing incomes there is a strong probability that insurance services of all kinds death, disability, health, auto will go on increasing, just as both private and public insurance companies deepen their penetration into smaller towns and the rural areas. Real estate: Like construction, real estate became a boom activity in the first half of the decade, raising employment from 2.67 to 4.65 million in the first half of the decade and yet again to 5.75 million by the end of the decade. While the sharpest increase in real estate services was in the unorganized segment, even organized real estate saw tripling of employment between the beginning and end of the decade. As construction activity expands, with private developers expanding the scope of large cities, and penetrating smaller towns, real estate services will grow hand in hand with the corresponding investment in infrastructure and the growth of the construction industry, enabling the backward and forward linkages between construction and real estate. Education and Health: There was a massive increase in investment, public as well as private in the education sector during the 2000s. Surprisingly, employment in education grew significantly only in the first half of the decade, and in fact declined slightly in the second half. This decline is rather intriguing given that the organized segment of education continued to see an increase in the employment in the second half, but the unorganized segment actually saw a decline. The unorganized segment is probably remaining under the radar, unrecognized, and hence possibly not being captured in the data. We suggest that NSS rounds on education (the last being and ) clearly indicate that there is a large 85
90 growth in private unaided school enrollment in the country as a whole at all levels of education. As one would expect there has been a growth through the decade of employment in the health sector, a significant proportion of which has been contributed by the organized segment. There has been an increase in public sector employment in the health sector, merely accounted for by the Central Government s National Rural Health Mission. Private medical facilities have also grown at a searing pace. The 12 th Plan is expected to see a very sharp increase of public investment in health, from its current level of 1.3% of GDP to over 2% of GDP per annum by the end of the 12 th Plan period. Given the concentration of hospital bed facilities in urban India the scope for expansion of health sector employment in small towns and rural India remains enormous. It is expected, therefore, that the kind of increase in employment that occurred in services in the first half of the decade (from 94.2 to million) is the kind of growth that is likely to be experienced during the 12 th Plan period in service sector employment. The second half of the 2000s, which saw a complete stagnation of employment in the service sector at 112 million, is unlikely to be repeated over the next five years. 86
91 Section 4 Employment Potential in the States Employment in Agriculture The vast majority of the major states of India saw a decline in employment in agriculture between and (See Table 8). Since the total fall in employment in agriculture in the latter half of the decade was only 15.6 million, the distribution of this decline among the states did not lead to a significant shift of workers out of agriculture to industry or services. This is not to say that temporary migration from rural to urban areas was not occurring. In fact for the first time since the Census of 1921 we have seen a phenomenon within the last decade, i.e to 2011 Census, wherein the increase in the urban population (91 million) has been greater than the increase in the rural population over the decade (90 million). This is because workers do migrate from rural to urban but only for temporary periods. In the lean season of the labour market of rural areas they migrate temporarily to urban areas to engage in construction activities or pulling rickshaws, without ever severing their link to the land in the rural home land. This is not the kind of labour force who are likely to be available to work in manufacturing or modern services, mainly on account of their lack of skills, and often even primary education. Their migration is a reflection of rural distress, driven by the fact that 84% of India s farmers are small and marginal farmers, tilling only less than 2.5 acres of land. In this context, it is important to mention (See Table A-8) that just two states alone accounted for nearly half of the decline in agricultural in employment in the latter half of the decade. Thus, in Bihar employment in agriculture fell from 21.2 million in to 17.2 million at the end of the decade. Similarly, in U.P. employment in agriculture fell from 43.3 million in the middle of the decade to nearly 39.7 million at its end. The state that stands out in strong contrast to this fall in employment in agriculture is Maharashtra, which saw an increase in agricultural employment from nearly 2.2 to almost to 2.6 million in the latter half of the decade. Another state which saw an increase in agriculture in the latter half of the decade was Madhya Pradesh, from 18 to million, and also Punjab (from 3.6 to 4.7 mn.). Performance of manufacturing employment of the States As we saw in the previous section, employment in manufacturing in the country as a whole had fallen in the second half of the decade from 55.8 to 48.5 million. Most of this decline in employment was confined to a small number of states: Jharkhand (from 0.93 to 0.68 million), Maharashtra (from 7.1 to 5.3 million), Rajasthan (from 2.2 to 1.6 million), Tamil Nadu (from 6.1 to 5.1 million) and Uttar Pradesh (from 7.21 to 6.4 million). It is remarkable that some of the most industrialized states of the country Maharashtra, Tamil Nadu - were among the states where manufacturing employment fell. In fact, Maharashtra alone accounted for nearly 60% of the total decline in manufacturing employment in the country in the second half of the decade. Clearly, there is a warning signal here for the governments of these states, so that an adequate policy response is put in place as the 12 th Plan begins. India s total decline in employment in manufacturing in the second half of the 2000s is shared uniformly across the states. Only Delhi shown increase in manufacturing employment. In table A-9 we examine the share of employment within each state contributed by agriculture, manufacturing, non-manufacturing industry and services. We wish to focus our attention upon manufacturing and on services, specially on those states where the share of employment in manufacturing services is greater than the national average. The national average for the share of manufacturing employment in total is 10.5%. There are 8 major states where this share is greater than the national average: Andhra 87
92 Pradesh (11.8%) Delhi (27.4%), Gujarat (13), Haryana (15.4%), Kerala (12.4%) Punjab (12.7%) and Tamil Nadu (17.2%) and West Bengal 18.4%. Given the fact that there advantages of agglomeration in the manufacturing sector it is likely that even in the future these states will continue to account for growth in manufacturing of GVA and employment. There are three other states where the share of total employment in manufacturing is almost the same as the national average: Karnataka (9.9%) and Uttar Pradesh (9.6%). These two states could provide further impetus to manufacturing GVA and employment in the 12th Five Year Plan. Services Services contribute 24.4% of total employment in India as whole in There are 11 states where the share of services to total employment is greater than the national average: Delhi (67.9%), Haryana (25.2%), Kerala (39.2%), Maharashtra (29.8%), Punjab (29.1%), Tamil Nadu (27.0%) and West Bengal (30.4%). Non-Manufacturing employment All States, across the board saw a increase in non-manufacturing employment in the second half of the decade, and almost all that increase in employment, as we noted above, was accounted for by construction (Table A8). In fact, most states either experienced a small decline in total employment, and in a few there was an increase, and the states which saw an increase in total employment experienced a very small increase. (See Table A10 and A11) The Growth by Sector in India s States There are seven states where the share of manufacturing in state GVA was higher than the national average of manufacturing share in GDP (15.9%) in : Chhattisgarh, Gujarat, Haryana. Jharkhand, Maharashtra, Tamil Nadu and Uttarakhand. These states could well continue to grow fast during the 12 th Plan period. But the reality is that three (Jharkhand, Maharashtra, Tamil Nadu) of the seven states have a manufacturing employment elasticity of output over the latter half of the decade that is negative (see Table A.15). However, the remaining four states have positive employment elasticity of output, so it could well be that the three with negative employment elasticity produce products that have experienced a lot more automation. In non-manufacturing, three states (Chhattisgarh, Himachal Pradesh and J&K) have a share in State GDP that is greater than the national average of 12.2%. The three states have considerable potential to generate electricity, which is perhaps the reason for the importance of non-manufacturing in their economies. However, neither mining nor power and major employers, though the fact that these states are power-surplus states could well attract industry to them. The states have potential is generating employment in services are several: Bihar, Chhattisgarh, Kerala, Maharashtra, Tamil Nadu and West Bengal. They have a larger than national coverage of state GDP being contributed by services. In terms of size of employment across the country (Table A.14) are significant. In most of them, the employment elasticity of output in services has been positive in the latter half of the decade (see Table A.15). However, state governments should focus their attention on promotion of services if they are to provide employment. 88
93 Section 5 Employment for marginalized groups Scheduled Castes, Scheduled Tribes and Muslims In terms of most social indicators the Scheduled Castes (SCs) and the Scheduled Tribes (STs) among social groups, and Muslims among religious communities, are the most marginalized (see India Human Development Report 2011, OUP, forthcoming). For instance, the work force participation rate (by usual principal and subsidiary status) for SCs in was 71% and for STs it was 81%, which were both much greater than the workforce participation rate (WFPR) for all social groups (68%) in rural areas; similarly, they were higher in Although urban WFPR is consistently lower for all groups, SCs & STs have a much higher WFPR compared to all groups. This higher than average WFPR for SCs and STs is largely explained by the fact that SCs and STs of working age (i.e. 15 and above) have lower enrolment ratio in secondary school than other social groups. The vulnerability of SCs and STs in terms of the labour market is emphasized by the fact that by current daily status SCs and STs have much higher unemployment rates, by and large, at least in urban areas (Table 10). Table 10: Labour Force Participation Rate by Usual Principal and Subsidiary Status, by Social Group, , and (%) Sector SCs STs All Groups Rural Urban Table 11: Workforce Participation Rate by Usual Principal and Subsidiary Status, by Social Group, , and (%) Sector SCs STs All Rural Urban
94 Table 12: Unemployment Rate by Usual Principal and Subsidiary Status, by Social Group, , and (%) Sector SCs STs All Rural Urban The workforce participation rate for the single largest minority groups, Muslims, happens to be much lower than for any other religious community at 55.7% in rural and 49.5% in urban areas. This WFPR for Muslims is much lower than that of SCs & STs, the other two major vulnerable groups in Indian society. This significantly lower WFPR for Muslims appears puzzling at first sight because enrolment rates of Muslims of working age in secondary or higher secondary education is also known to be relatively low, a situation that prevails among SCs & STs as well. But the latter two groups have, as we noted earlier, much higher WFPR than other social groups in the Indian labour market. The probable explanation for the simultaneous existence of low secondary enrolment rates and low WFPR among Muslims lies in the rather low for Muslim women, as compared to any other social group or religious community in Indian society. Table 13: Labour Force Participation Rate by Usual Principal and Subsidiary Status, by Religious Community, , and (%) Sect or Rur al Urb an Hindus Muslims Christians Sikhs
95 Table 14: Workforce Participation Rate by Usual Principal and Subsidiary Status, by Major Religious Community, , and (%) Sector Hindus Muslims Christians Sikhs Rural Urban Table 15: Unemployment Rate by Usual Principal and Subsidiary Status, by Major Religious Community, , and (%) Secto Hindus Muslims Christians Sikhs r Rural Urba n Creating employment during the 12 th Five Year Plan for all these vulnerable groups SCs, STs and Muslims is going to be a challenge. The challenge derives from multiple factors. First, the educational level of all these groups is lower than for the rest of social groups or religious communities in India. This fact is going to remain a constraint upon the ability of these groups to take advantage of opportunities emerging in a market oriented pattern of development to a greater extent than prevailed in the first four decades of development. This is one reason that the pressure is growing for reservation for these social groups even in the private sector which the private sector has resisted. The implication of low levels of education, and the fact that SCs and STs in particular are concentrated in rural areas/agriculture, implies that the way in which they will get absorbed into the non-agricultural sectors is through casual labour in the unorganized segments of industry and services in low productivity, low-wage jobs. As we saw above, the main growth sector for unskilled labour has been construction and that will remain the main escape route route for SC/ST rural labour out of agriculture-based livelihoods. A second constraint arises from the fact that a very significant share of the total population of SCs, STs and Muslims happens to be concentrated in 8 states of India, most of which have experienced GDP growth rates which are lower than the national average. If we examine the distribution of India s SC population among states, we find that 60% of the country s SCs are concentrated in Uttar Pradesh (which accounts for 17% of total SCs in India), Bihar, Andhra Pradesh, West Bengal, Tamil Nadu and Rajasthan. While Bihar, 91
96 Andhra Pradesh and Tamil Nadu have GDP growth rates that are higher than the national average, the remaining states lower than average growth rates. The distribution of ST population in the country shows that a high proportion of ST population resides in the North-eastern states; however these states have small total populations compared to rest of the states of India. In fact, the distribution of STs in the country shows that 76% of STs are concentrated in 8 states: Gujarat, Madhya Pradesh, Chhattisgarh, Orissa, Jharkhand, Rajasthan, Andhra Pradesh and Maharashtra. Of these states, Gujarat, Andhra Pradesh and Maharashtra have experienced relatively rapid economic growth, especially in the non-agricultural sectors. However, in Chhattisgarh, Orissa and Jharkhand, while GDP growth has been fast it is unlikely to have been very employment intensive, primarily because the development in these states has been dependent upon mining, and has been confined to certain enclaves within the territory of the state. In other words, even in these states employment could not have grown very rapidly except in mining. In fact, during and , organized mining showed a significant increase in employment (see Table A10) of nearly half a million workers, taking the total employment in organized mid-decade to 1.7 mn. Unorganised mining employment grow as well, but very slowly in the same period by just under 10,000 workers (Table A.10). In other words, in states with mining activity, where SCs/STs are concentrated, would see SCs/STs being employed as casual labour which becomes, in addition to construction in these states one more escape route for SCs/STs into non-agricultural employment. About 71% of the country s Muslim population is concentrated in Uttar Pradesh (which accounts for 19% of all Muslims in India), West Bengal, Bihar, Maharashtra, Assam, Andhra Pradesh and Kerala. The challenge in regard to Muslims, and especially Muslim women, is very serious on account of their lower educational levels compared to all other religious groups in the country. However, they do tend to live in urban areas, which perhaps make it easier for them to find employment, even though it is likely to be in the unskilled or semi-skilled category. As employees, Muslims generally work as casual labour and they are very poorly represented in regular, salaried employment. In this respect, they are even more disadvantaged than SCs and STs for whom affirmative action may have improved standards. Only about 27 per cent of Muslim workers in urban areas are engaged in regular work, while the share of such workers among SCs and STs, OBCs and Hindu UCs is 40, 36 and 49 per cent respectively(sachar committee report:93) The participation of Muslims in formal sector employment is far less than the national average. Muslim men are over-represented in street vending (more than 12 per cent as opposed to the national average of less than 8 per cent), while women tend to work from home to a much larger degree (70 per cent) than the average (51 per cent). Since large numbers of Muslims are self- employed, developing skills and extending credit should be the focal points of any positive initiatives for the community (Rowena, 2007). It is the STs that are most excluded, since they have the lowest educational indicators of all the three vulnerable groups, and also live mostly in rural areas. The STs concentrated in the eastern and central Indian states of India, who are often forest dwellers, have the fewest 92
97 possibilities of taking advantage of the opportunities created by market-driven growth. It is for this reason that for them the only prospect of diversifying their sources of livelihood away from agriculture and forest products is that the government takes education to the STs. SCs have relatively low of education (though not as low as for STs), and are as likely to be living in rural areas as in urban ones. They mostly attend government schools in rural areas, which means that the most important intervention for them that governments can take is improving the quality of schooling. Equally, for all three vulnerable groups, for that section of the age cohort that completes at least elementary schooling, there is a critical need to expand the possibilities for vocational education and training for which the opportunities have been expanding rapidly, but will expand even more rapidly now that a National Vocational Qualification Framework is in the process of being implemented. Meanwhile, for the STs in the eastern and central belt of the country, government efforts should be continue with ensuring effective power to Gram Sabhas through the implementation of PESA (Provision of Exter. Scheduled Areas the panchayati raj system, over forest resources and their forest land rights. The problem of discrimination: The case for public action Quite apart from the issue of low education levels as the fundamental reason for the low ability of SCs/STs to get decent work, there is the issue of discrimination. SC/ST workers are discriminated against both in the public and private sector, but that the discrimination effect is much smaller in the pubic sector. The public sector seems to have accommodated much more SC/ST that are poorly endowed in human capital (low skilled workers), while the private sector has remained more or less exacting in nature as before. The government policy of protective legislation seems to be partly effective. Claims that discrimination does not occur in the Indian urban private sector are based neither on economic theory of discrimination nor on empirical facts (Attewell, 2007). There is only a 3 per cent chance that an Upper Caste Hindus will work as casual labour which is the worst kind of job on offer in urban India. An OBC is six times as likely as an UCH to work as casual labourer and an SC or an ST, nine times more likely (Mohanty, 2006). Similarly, manual scavenging (one million SC workers) despite the existence of an Act banning it still remain a practice. In rural areas, scavengers should be given reference in NREGA works. In urban areas, they should be given preference for employment by municipal corporations and Urban Local Bodies at least in their sanitation departments. Public action of this kind would send out a clear unambiguous message that their inhuman conditions are found unacceptable by the state. Likewise, discrimination seems to be industry specific also. It is found that there exists some kind of discrimination in employing labour in food processing activities. This discrimination is with regard to employing people from the scheduled castes (SCs). In some of the food processors like sweets making units and pickles making units are not employing people from the SC community to work in their units due to the fear that the products may not be purchased by the public at large (Dasgupta et al, 2009). Reservations alone cannot solve the problem of employment discrimination among SCs and STs. Using data on the IIM -Ahmedabad s 2006 batch of MBA graduates, it was found that graduates belonging to scheduled castes or scheduled tribes get significantly lower wages (19 per cent lower in domestic jobs and 35 percent lower when foreign jobs are 93
98 included) than those in the general category. This difference disappears once their lower Grade Point Averages are taken into account, suggesting that the large wage difference is due to the weaker (on average) academic performance of SC/ST candidates. The study suggests that in the absence of any serious attempt to equalise school-level opportunities, the current policy of reservations at elite educational institutions will be insufficient to equalise career outcomes even for the minority of SC/ST candidates who can benefit from them (Sujoy Chakravarty, E Somanathan, 2008). Women s employment Since the 1980s there has been a near-consistent decline in workforce participation rate (WPR) of women. Even more remarkably, in the latter half of 2000s (i.e. between and ) both the labour force participation rate (LFPR) and workforce participation rate (WPR) of women has declined sharply, as a result of which the total LFPR and WPR of the population has declined. Male LFPR and WPR has pretty much remained constant over the same period (LFPR for males was 55.1% and WPR was 55%). The sharp decline in female labour force participation has happened in both rural and urban areas, though the decline is much sharper in rural compared to urban areas (see Table FROM NSS 66 TH ROUND PRESS NOTE). This suggests strongly that in both urban and rural areas girls over 14 years of age (i.e. of working age) are remaining in school, more than ever before. As a result, the LFPR of women in India, which is already low by Asian standards, has fallen further. Table 16 : LFPR by Usual Principal and Subsidiary Status, , and (%) by gender Males Females Sector Rural Urban Table 17 : WPR by Usual Principal and Subsidiary Status, , and (%) by gender Male Female However, this decline should be seen in a positive light precisely because it suggests that girls, after completing elementary schooling are making the transition to secondary schooling in much larger numbers than ever before. In other words, these girls will be available to enter the workforce at a slightly later age better qualified than an earlier cohort. Since they will be better educated they are likely to be able to make the transition out of agriculture into non-agricultural employment, even though it may be in the unorganized sector. Given the fact that the female employment is even more concentrated in informal 94
99 work than male employment outside of agriculture, their greater participation in schooling indeed is a positive development (Mehrotra and Biggeri, 2007). However, the much higher rate of education participation of girls augurs well for improvement in their labour force participation. There are 40 million widows in India, living in conditions of penury such women will need to be given priority in the National Rural Livelihood Mission (of the Ministry of Rural Development). NRLM (the success or to the Sampoorna Grameen Swarozgar Yojana, SGSY) will take the creation of self-help groups of women to national scale and provide credit self-help to SHGs to enable them to undertake self sustaining economic activity. The Velugu model of Andhra Pradesh and the Kudambashree model of Kerala will serve as a prototype for the National Mission. The most serious problem that women in the work force face is that it is not decent work. For the vast majority of women in non-agricultural employment they tend to work from home in home-based work, usually subcontracted to them by male contractors in a variety of low-productivity work (e.g., bidi-making, zari-making, etc). in the NSS Round had estimated that 29 million in the country were making as home-workers; assuming that such women live in a family of five members, a total of 150 million persons are at least part-dependent upon this kind of work. Table 18: Unemployment Rate by Usual Principal and Subsidiary Status, , and (%) by gender Sector Males Females Rural Urban Table 19: WPR for Home based Workers (%) Rural Urban Total Self-Employed Regular Wage/Salaried Employee Casual Labour
100 Table 20: Number of Home based Workers 4 (Million) Rural Urban Total Self-Employed Regular Wage/Salaried Employee Casual Labour The data suggests that the overall incidence of subcontracting has increased, although marginally, from 31 per cent in to 32 per cent in In addition, the incidence is greater for urban units for all types of unorganized manufacturing enterprises (own-account, establishments with 2-5 workers and those with 6-9 workers). Within sub-contracting enterprises as a whole, those who were working solely for the contractors/master units and did not sell independently on the market consisted of and 26.6 per cent in and respectively (NCEUS, 2009). A number of policy implications emerge from this brief analysis. Micro enterprises are mostly own account enterprises, mostly either self-employed or single-own account enterprises, very often operated by women. Own account workers take refuge in this 4 Home Based Workers is defined according to location of workplace. In rural areas person working at following locations are considered as home based workers. Rural locations are: Own dwelling,, structure attached to own dwelling, open area adjacent to own dwelling, detached structure adjacent to own dwelling, own enterprise/unit/office/shop but away from own dwelling. Similarly, workplace in urban areas considered for home based workers are: own dwelling, structure attached to own dwelling, open area adjacent to own dwelling, detached structure adjacent to own dwelling, own enterprise/unit/office/shop but away from own dwelling. 5 Self-employed: Persons who operated their own farm or non-farm enterprises or were engaged independently in a profession or trade on own-account or with one or a few partners were deemed to be self-employed in household enterprises. The essential feature of the selfemployed is that they have autonomy (decide how, where and when to produce) and economic independence (in respect of choice of market, scale of operation and finance) for carrying out their operation. The remuneration of the self-employed consists of a non-separable combination of two parts: a reward for their labour and profit of their enterprise. The combined remuneration is wholly determined by the revenue from sales after netting out value of purchased inputs used in production. Categories of self-employed persons: Self-employed persons were categorised as follows: (i) own-account workers: those self-employed persons who operated their enterprises on their own account or with one or a few partners and who, during the reference period, by and large, ran their enterprise without hiring any labour. They could, however, have had unpaid helpers to assist them in the activity of the enterprise; (ii) employers: those self-employed persons who worked on their own account or with one or a few partners and, who, by and large, ran their enterprise by hiring labour; and (iii) helpers in household enterprise: those self-employed persons (mostly family members) who were engaged in their household enterprises, working full or part time and did not receive any regular salary or wages in return for the work performed. They did not run the household enterprise on their own but assisted the related person living in the same household in running the household enterprise. 6 Regular wage/salaried employee: These were persons who worked in others farm or nonfarm enterprises (both household and non-household) and, in return, received salary or wages on a regular basis (i.e. not on the basis of daily or periodic renewal of work contract). This category included not only persons getting time wage but also persons receiving piece wage or salary and paid apprentices, both full time and part-time. 7 Casual wage labourer: A person, who was casually engaged in others farm or non-farm enterprises (both household and non-household) and, in return, received wages according to the terms of the daily or periodic work contract, was a casual wage labourer. 96
101 enterprise for lack of alternative remunerative employment. The data suggests that investment in fixed assets is positively related to productivity, but most sub-contractors do not offer any support to own account workers in terms of machinery and equipment. The very low levels of fixed assets in rural areas in backward states and hence low labour productivity needs to be addressed through appropriate policies. Child labour A child is classified as labour if she is in age group 5 to 14 and is economically active. The incidence of child labour had systematically declined in 1990s and 2000s. In % of 6 to 14 years old were working. That share had fallen to 3.3% of all children by to 2.4% in and further to 2% in (Table 12). Table 21: Child Workforce Participation Rate by UPSS (Percentage), , , and Area Boys Girls Children Boys Girls Children Boys Girls Children Rural Urban Combined Source: NSSO , and Table 22: Child Workforce Participation Rate by Social Groups by UPSS (Percentage), , , and ST SC All ST SC All ST SC All Table 23: Percentage of Child Workers and No-Where Children by UPSS ST SC OBC Gen Total Child Workers NWC Child Workers and NWC The share of all girls in the 6-14 years age group who were working which was similar to that of boys working in both and has been falling secularly in the latter half of the 2000s. The incidence of child labour among girls was much lower than for boys, but in the incidence of child labour among girls is higher than for boys, but in the incidence of child labour among girls is higher than for boys. This decline in child labour has gone hand in hand with significant increase in enrolment of both boys and girls. Since the proportion of girls who were out of school was higher than that for boys until the middle of the 2000s, the decrease in the incidence of female child labour is largely on account of their enrolment in schools. 97
102 However, the NSS data for and reveals that girls are still being held back at home (as supposed to be sent to school) in order to perform household chores. We estimated the proportion of children in the age of 5-14 who are categorized neither as child labourers nor as students enrolled in schools. In , 11.4% of girls belong to the category of nowhere girls in the 6-14 year old age group, while only 3.8% of boys in the same age group belong to nowhere children. If we aim to nearly eliminating child labour and the phenomenon of nowhere children during the 12th Five Year Plan it is imperative that the Right to Education Act has to be implemented in letter as well as in spirit. By achieving the norms (list in schedule 1 of the Right to Education Act) of the Act the RTE can be implemented during the 12th Plan period. 98
103 Section 6 Preparing for global economic crises employment implications Integration into the global economy has its benefits as well as disadvantages from the view point of labour. Increasing labour-intensive exports can generate employment. At the same time, excessive dependence on international markets can lead to vulnerability to exogenous shocks, such as global economic rises. The objective of policy during the 12 th Plan has to be maximize the benefits while minimizing the risks of international economic integration for labour. Increasing Employment in Labour Intensive Manufacturing Exports Labour is an abundant factor in the Indian economy, and theoretically it should be possible for India to adopt the path that successful East Asian exporters followed from the early 1970s onwards, i.e. labour intensive manufacturing exports which enabled them to absorb surplus labour from agriculture, raise wages throughout the economy and raise productivity overall. Rapid growth in each East Asian economy since the early seventies resulted in increases in export to GDP ratios very significantly through 1980s, 1990s and the 2000s up to the global financial crisis in Thus Thailand s exports to GDP ratio grew from 34% in 1990 to 74% in 2005; similarly, Indonesia managed to raise exports to GDP ratio from 25% in 1990 to 34% 2005; as did Malaysia from 75% in 1990 to 123% in India has followed to some extent a similar path, in that our export (of goods and services) to GDP ratio increased from around 10% in the early 1990s ( ) to around 16% of GDP in (Ministry of Finance, 2011). It went up further to 22 per cent of GDP in (Planning Commission, 2011). However, this is nowhere close to the remarkable increase in absolute and relative importance of exports in GDP that occurred in China (from 19% in 1990 to 37% in 2005). In fact, the sharp rise in export oriented manufacturing in China seems to be the single most important factor underlying the decline in poverty in that country after the economic reforms begin in While it is true that export to GDP ratio in India has increased, the commodity composition of India s exports has not been such as to absorb labour as much, especially not on the scale required in a labour abundant economy, whose comparative advantage should lie in low wage, labour-absorbing exports of manufacturing and services. Our analysis in section 4 had shown that there are a number of sectors in organized manufacturing that have generated significant productive employment: Office, accounting and computing machinery; basic iron and steel; man-made fibres; tanning and dressing of leather, manufacture of luggage, handbags. There is also sectors that are employment-generating, but have experienced a decline in labour productivity: general purpose machinery. We had also found that unorganized manufacturing has at least one sector (other chemical products) that has generated productive employment. 99
104 Overall, there is no doubt that many items of export are relatively labour intensive: Gems & Jewellery, Leather, Handicraft, Handloom. Yet, the evaluation of the commodity composition of India s export suggests that a significant share in increase in employment is accounted for by Refined Petroleum Products (share % in exports) unprocessed commodities in raw form (for example iron ore from Goa, Andhra Pradesh and Karnataka) (%share in exports). A significant share of total service exports is 51.9% in of IT and ITES, which are also not particularly labour intensive. (numbers needed on persons employed in these sectors, and their growth over the 2000). Labour absorbing exports can grow only if the exportables are competitive. One of the factors that has proven a constraint upon India s export growth is the fact that the other large labour abundant economy, China, has managed to be more competitive. Basic wages have risen fast in India over the last year, but still lag China - India averages USD1.71 per hour, to China's USD1.82. Total labour costs in India's formal manufacturing sector are expected to average USD2.68 per hour in 2010 compared to China's USD2.51. As a result, they have managed to penetrate not only the market of OECD countries but have provided very strong competition to domestic companies in the Indian domestic market. One can wonder why Chinese wage rates are either comparable to, or lower than those prevailing in Indian companies. Prima facie one would expect that Chinese wage rates would be higher than those prevailing in India, because per capita incomes in China are 2½ to 3 times greater than those in India. Therefore, it is critical for Indian policy makers to explore in depth the reasons for the cost advantages the Chinese companies derive in both international markets as well as in the Indian market on account of this wage advantage. China s manufacturers have a scale of production much larger than that in India and hence their enterprises enjoy the cost advantage accruing from economies of scale. Further, the Chinese advantage would also derive from the superior quality of infrastructure available to Chinese companies. Yet another source of Chinese advantage would perhaps derive from the superior management and technology that comes with the much larger role for foreign enterprises in export oriented manufacturing in China than in India. These three advantages are perhaps the factors underlying the cost advantage that Chinese products enjoy in both world markets as well as the Indian market. While the Chinese hourly wage rate is higher, the Chinese worker is also more productive than the Indian worker. The latter is itself the result of the three factors combining to make Chinese firms more productive, especially with labour productivity of the Chinese worker much higher than the Indian worker. Labour-intensive manufacturers in India should not be as adversely affected as they currently seem to be, since Chinese imports of manufactured goods in the Indian market face the disadvantage of transportation costs from China to India, as well as the transportation costs incurred by importers of Chinese goods to the markets of the hinterland in India. But 100
105 clearly Indian companies seem not to be able to compete with Chinese labour-intensive products, even in the Indian domestic market. This lack of competiveness does not bode well for an increase in manufacturing employment in labour-intensive activities for the Indian or the international market during the 12 th Plan period. Clearly, the implication seems to be that the three other advantages noted above that Chinese exporters enjoy superior infrastructure, economies of scale and management need to be addressed if Indian companies are to meet the Chinese challenge in both the domestic and the international markets. Sustaining Domestic Demand to Generate Employment in times of crisis. In late 2008 when the global financial and economic crisis broke India s exports in employment intensive sectors (for example textile and garments, leather and footwear, gems & jewellery, handicrafts) suffered. Surveys conducted by the Labour Bureau (Ministry of Labour) over suggested that employment in these sectors fell by half a million jobs. As the Indian economy gets more globally integrated such external shocks will not remain uncommon. The good news was that employment did not decline in export-oriented sectors in India as much as they did in China; in the latter there was a fall in employment amounting to 20 million jobs lost. The further good news was that in India domestic demand and consumption did substitute for external demand in the same product areas, and units manufacturing these products for exports did not close down on account of sustained demand from the domestic market (Mehrotra, 2010). Domestic demand was sustained in India because of fiscal stimuli between late 2008 and mid 2009 by the Central Government. However, it is the impact of the global economic crisis on employment of declining exports that has been the subject of greatest concern for policymakers since the crisis broke. The Labour Bureau of the Ministry of Labour carried out a survey of key export-oriented sectors between October and December 2008 and again in April to June The sectors examined were mining, textile, metals, gems and jewellery, autos, transport and information technology/business process out-sourcing (IT/BPO). These sectors contributed 60 per cent to GDP in In these sectors, half a million workers lost their jobs during the period October to December The most affected sectors were gems and jewellery, transport and autos. As expected, the major impact in these sectors was felt by export-oriented units but interestingly, in the non-export units, employment actually increased. It was also noticeable that metals and auto sectors were offering more contractual jobs, and fewer longterm positions (Mehrotra, 2010). This is exactly what our analysis in Section-4 above had also shown. The lesson from the global economic crisis and its impact on employment in India during 2008 to 2010 is that domestic consumption needs to be sustained. However, the difficulty at the commencement of the 12 th Five Year Plan is that now the economy faces a combined (centre and states) fiscal deficit of the order of 10% of GDP a situation very different from that prevailing in September 2008 when the last global economic crisis erupted (when it was 6% GDP). Such a large fiscal deficit will need to be contained progressively 101
106 over time, and this time may well extend into at least the middle of the 12 th Five Year Plan period. This macro-economic constraint does not bode well for demand (and employment) sustaining public expenditure. Another macro-economic down side factor that needs to be kept in mind by policy makers during the 12 th Five Year Plan is that while investment had peaked at all time high of 37 per cent of GDP (2007-8) just before the global economic crisis, after the crisis domestic investment has been declining, just as the inflow of Foreign Direct Investment (FDI) has. In fact most recent numbers seems to suggest that FDI flows into India are exceeded by FDI flows by large Indian companies abroad. Growing investments are a pre-requisite for sustaining organised (and unorganized) sector employment outside of agriculture. Clearly, the rising rate of interest is becoming a constraint on investment, while the high interest rate attracts capital inflows, which keeps the rupee stronger than it would otherwise be, thus impacting exports adversely. While containing inflation is the goal, the rising interest rate is clearly coming at the expense of falling domestic investment and rising capital outflows for investment abroad none of which bode well for employment growth during the 12 th Plan. Sustaining domestic demand will be the key to growth of investment output and employment especially since the international environment has worsened again in mid In the wake of the down-grading of US Treasury bonds from AAA rating (by Standard and Poor credit agency) and the brewingcrisis in the Euro-zone countries of the Mediterranean rim (Greece, Portuguese, Spain and Italy), there are growing indications that the international economy may be heading for a double-dip recession. This brewing international crisis creates a new challenge for India s export-oriented industries, and for nonagricultural employment in such industries and services. We should note that on account of rapid growth in exports over the 11th Plan period, the share of exports to GDP has gone up from 14% to 22% in This sharp increase in exports occurred in an international environment which was much more propitious than Indian policy makers face on the eve of the 12th Five Year Plan. The US economy, India s largest export market, is unlikely to grow at more than 1-1.5% per annum over the next few years, much lower than to 2 3% per annum that was achieved in the first half of the decade; the Euro-zone countries are similarly projected to grow at a lower rate than in the past. With international demand for India s export slowing as a result, the prospects for employment growth through the export-led route will be more challenging during the 12th Plan period compared to the previous Plan period. Hence, Indian policy makers will need to respond appropriately to this challenge, lest domestic demand dips further than what is already anticipated. This will require the following policy responses to the developing adverse international environment. First, the Reserve Bank of India has been raising interest rates, which currently stand at an unprecedented high level. Monetary policy works with a lag. The RBI may need to wait and assess how the Indian economy responses to monetary tightening so far. As European and US economies and China slow down commodity prices may ease, which may reduce the pressure on India s inflation rate. Hence, it may be appropriate for the RBI to stop 102
107 raising interest rates. Second, the fiscal deficit to GDP ratio has risen after the global economic crisis of ; hence, the scope for increases in public expenditure is extremely limited. Therefore, it is essential that special effort is made to increase tax revenues to GDP ratio over the 12th Plan period, a hope that was belied in the tax proposals of budget (which left total tax revenues at the same level as the budget of ). An important policy step for India to increase tax revenues is to implement the goods and service tax (GST). A simple GST can strengthen revenues and rationalize certain aspects of doing business, while decreasing the distortions that beset consumption taxes in India. Third, the government should strengthen the investment environment by focusing on the World Bank s Ease of Doing Business Index, which puts India s rank rather low. The investment rate in the Indian economy has never recovered from its peak achieved in (37% of GDP) and Indian business needs to be more confident to invest in India, rather than taking its capital abroad. Fourth, while policy makers have given attention to the stock market (which tends to be used by larger firms to finance their needs) and to micro finance (which can help to meet the financial needs of individual low-income entrepreneurs), finance for more small and medium enterprises, and for micro enterprises, has been neglected by policy makers. Ensuring credit for MSMEs from public sector banks will remain a major priority over the 12th Plan period. The analysis in Section -. of the size class of enterprises (by employment) showed that in most enterprises were still employing less than six workers, i.e. in micro-enterprises. They are the enterprises that must be enabled to grow. Finally, if India is to respond adequately to the next global crisis the wide gap between existing skill sets and what the economy needs have to be filled. This requires reforms to be rapidly implemented to expand the scope and outreach of vocational education in secondary and higher secondary schools, reforming the government Industrial Training Institutes (ITIs) and private ITIs, and improving the quality of both publicly and privately provided higher technical education. A second component of these reforms is to rapidly implement the National Vocational Education Qualification Frameworks (NVEQF). These five reforms together can enable the Indian economy to prepare itself for the next global crisis. 103
108 Section 7 Summary and Policy implications 1. Some improvement in the transition to somewhat decent work We have argued that decent, productive employment calls for three transitions between conceptually four stages of the evolution of employment from agricultural work to nonagricultural employment; from informal employment in unorganized sector to informal employment in the organized sector; and finally from informal employment to formal employment in the organized sector. Our analysis so far suggests that there has been an increase in relatively decent, productive work in at least two senses. First, there has been an increase in the share of industry and services in total employment, with agriculture s share in employment declining from 56% in to 53% in , and a corresponding increase in non-agricultural employment from 44 to 47%. In other words, there is not only an absolute increase in non-agricultural employment, where wages tend to be better than agriculture, but also an increase in the share of non-agricultural employment in the total employment in the country. The second sense in which relatively decent, productive employment has increased in the latter half of the 2000s is that organized manufacturing employment has increased in the latter half of the 2000s, compared to the previous quinquennium. Organised segment employment has grown from a share of 13.6 percent at beginning to 17.4 percent of total employment (at the end of the decade an absolute increase of 16 mn. Workers. Of, nonagricultural employment, the share of organized employment has risen from 31.1% to 35.2%. The growth of this share is a welcome development. But clearly, the shift in a whole decade of rapid growth of out put should be worrying to policy makers who may be concerned about promoting decent employment. 2. Still very little structural change in terms of sectoral distribution of employment We noted that India remains an outlier, compared to other emerging market economies, in terms of agriculture s contribution to employment, and also rather unusual by the high contribution of services to both GDP as well as employment. The implication remains that in the 12th Five Year Plan, as the Approach Paper to the 12th Plan already indicates, there must be an emphasis on increasing the importance of manufacturing in both GDP as well as employment. The National Manufacturing Policy must become an effective instrument for improving the contribution of manufacturing to both GDP as well as employment (on which more later, since in its current version it seems to lack recognition of some aspects of the strategic challenge). 3. Positive dimensions of recent quantitative employment-related trends The data (from NSS 64th Round) reveals several positive dimensions for the latter half of the decade of 2000s, the period categorized by rapid economic growth. First, for both rural and urban males there has been a significant rise in principal status employment since 1983, and this rise (and a decline in subsidiary status employment) has been sustained in the second half of the 2000s. This implies that these workers are relying on one source of employment, rather than more than one. Second, there has been a sharp decline in the number of those under 25 years of age in the workforce. The total number of young working-age (15-24) people who continued in educational institutes after entering working age (of 15) increased from about 30 million in to over 60 million in This denotes a drop in the labour participation rate. 104
109 Also, the children under 6 as well as children over 14 are entering school rather than entering the workforce. Our analysis of data shows that there has been a consistent decline in the incidence of child labour in both rural and urban areas, for both males and females, since 1993 onwards. This decline in child labour is consistent with an increase in school enrolment. Third, the worker- population ratio for women has seen a decline since 1980s. In the period and , both rural and urban female principal status employment for 0-24 year olds has declined. The decline is much greater for rural females than for urban females. It was rural females who have tended to remain outside the school system historically. We know that girls enrolment rate in school and college have been increasing consistently, not just at elementary level but also at secondary level and above. 8 Hence, the decline in the female worker population ratio in the 0-24 year age group for women is a welcome development in the latter half of the 2000s. however, these women (and men) who are withdrawing from the elabour force now will join it better educated or even skilled than before, and hence jobs will have to be found for them. Fourth, unemployment rates between and by current daily status had increased consistently from 6% to 8.2% of the labour force. However, consistent with the increase in the growth rate of economy the unemployment rate by the CDS measure has declined in the latter half of the 2000s to 6.6%. Fifth, the data reveals that there has been a secular rise in the wage rate for both regular and casual workers. This is consistent with the rise in monthly per capita expenditure in both rural and urban areas, which has led to a decline in poverty. 3. Employment Potential in different sectors The period of to was unusual in that there was a lower than expected increase in the labour force participation rate, because of a decline in participation of youth in the labour force, since they preferred to enter education. However, this lower growth in the labour force in the latter half of the decade will not continue and the pace of employment expansion will have to increase outside of agriculture. Between and there was an absolute decline in total employment in agriculture of approximately 15 million. One would have expected that at least in the allied activities in agriculture horticulture, animal husbandry, forestry and fisheries there would be an increase in employment. The latter expectation derives from the high income elasticity of demand for fruits & vegetables, eggs, meat and fish. It is indeed intriguing that employment in these activities declined in absolute terms from 50.8 million to 34.6 million in the latter half of the decade. Clearly these allied economic activities in agriculture are in urgent need of policy support by both state and central government if they are to flourish, and employment in these activities is to be increased. Employment Potential of Non-manufacturing Industry Investment in mining will continue to increase during the 12th Five Year Plan, as it will be in power generation. Although these two industrial activities are relatively small employers, the 8 In the age group of 5-14 years, 89.3 percent of children were in school in , up from 82.4 percent in Further this increase was higher for girls, rising from 79.6 percent in to 87.7 percent in In the years age group, 59.5 percent of young people were in the educational system in as compared to 46.2 percent in Once again, the increase was more for girls, from 40.3 to 54.6 percent. In the next higher age group of years, 22.5 percent of boys and 12.8 percent of girls were still in the educational system in against only 14.9 and 7.6 percent respectively in (Planning Commission, 2011) 105
110 rising investment should generate a modicum of employment in these sectors. But the largest increase in employment throughout the decade of the 2000s has continued to take place in construction. Since infrastructure investment and investment in housing is expected to grow very sharply during the 12th Five Year Plan, construction will continue to provide a source of escape for agriculture labour desirous of moving out of agriculture. Manufacturing The Approach Paper to the 12 th Plan notes that an additional 250 million are expected to join the labour force in the next 15 years. It expects that an additional 100 mn. jobs of these 250 mn. will be in manufacturing. For this reason, the government is putting in place a new National Manufacturing Policy. Between 1999 and manufacturing employment increased sharply in the first half (from 44 million to 55 million) but then declined in the latter half of the decade (to 48 million). The fact that it fell just when there was a sharp increase in manufacturing output should worry policy-makers. Only a limited number of sub-groups within manufacturing showed an absolute increase in employment at the end of the decade ( ) when compared with the situation at the beginning of the decade ( ): textiles; wearing apparel; tanning and dressing of leather; luggage and footwear; paper products; publishing and reproduction of recorded media; basic metals; motor vehicles and other transport equipments; furniture; medical & optical instruments; and watches and clocks. We had noted earlier that many sectors that were identified in the 11 th Plan as high growth did not perform, though other did (see Table 24 which shows howdifferent sectors performed, with the sectors for which arrows point upwards did grow, while for those in which the arrow points downwards did not). Given the rather mixed experience with the sectors which were identified as high growth, in terms of employment and output in the 11 th Five Year Plan, one would argue that it might be preferable to take the path of caution and not specifically identify sub-sectors which might continue to grow during the 12 th Five Year Plan, merely because they have shown growth in GVA and employment during the 2000s. Quite clearly employment had grown fast in the first half of the decade and then tended to decline in the second half of the decade even in these sub-sectors. Clearly technological change is taking places and workers are being laid off even as GVA is growing. In fact, as we noted earlier in the paper, there was a sharp increase in manufacturing GVA in many of these sectors, in the latter half of the decade, and yet employment declined. The fact that GVA was seem to be growing in the latter half of the decade despite an exogenous shock to the Indian economy by one of the global financial and economic crisis which began in 2008 suggests that manufacturers will be cautious in hiring new labour, especially as the global economic environment remains highly volatile and uncertain as India s planners write the 12 th Five Year Plan. We had already noted above that such manufacturing employment growth that did occur in the 2000s was characterized by a growth in informal employment even in the organized segment of manufacturing. It is notable that government is about the launch a new National Manufacturing Policy, with the intention of increasing the share of manufacturers to GDP from 15% in to 25% in The goal of the national manufacturing policy is mainly stated in terms of the contribution to GDP (i.e. in terms of the growth of GVA), but not in terms of growth in employment. Services Services employment had increased between and from 94.2 million to million; however, in the latter half of the decade it remained stagnant at million. Unlike in agriculture (where total employment declined by 15 million in the latter half of the decade) and manufacturing (where total employment declined by 7 million in the same period), services employment did not actually fall in absolute terms in the latter half of the decade. That seems to suggest that alongside construction, which has seen a huge boom 106
111 through out the decade in terms of output and employment, services may continue to be the absorber of workers during the 12 th Five Year Plan. Almost all the services sub-sectors experienced a robust growth of GVA both in the first half as well as the second half of the decade (Table A-2). In other words, the global economic crisis since 2008 has not adversely impacted the service sector, which grew at 8.5% per annum between and compared to 7.05% per annum between and Policy Implications of some Qualitative Dimensions of Employment a) We noted that in the second half of the 2000s there was a shift away from employment in micro enterprises. The share of smallest employers fell from 75% to 65% of total non-agricultural employment. At the same time those enterprises which employed more than 20 workers saw their share of workers rise from 11.8% to 17.1%, or an absolute increase from 24 to 39 million between the middle and the end of the decade. This increase in the middle and larger enterprises, by size class of employment, and the decline in the share of the micro enterprises in total employment, bodes well for the future ability of workers to organised themselves, to demand their rights. The more fragmented workers are into tiny enterprises the more difficult it is for the government also to provide them with services like credit, marketing support or design support. Further, the rise in the share of enterprises employing slightly larger number of workers is awelcome development from the viewpoint that there has historically been a problem in India in respect of size of enterprise, of the missing middle. The recent developments seem to somewhat mitigate that problem. b) We noted that unemployment as estimated by UPSS measure increased with increasing levels of education of workers. Unemployment rate for the graduates stood at 7% and for diploma and certificate holders 9.6% in The problem of unemployment of the educated can only be addressed by improving the match between the skills and competencies imparted in education and the needs of industry. This requires greater industry participation at every level of vocational education and training: at secondary and higher secondary levels in schools; at polytechnic level; and in higher education as well. These tasks will be facilitated with the rapid introduction of a competency-based vocational education and training system, based on a National Vocational Education Qualification Framework, a process that has been set in motion. c) In absolute terms, regular wage employment has grown between and from 70 to 75 mn. (implying a share increase from 14.6 to 16.4 percent) which is clearly a welcome development. This is consistent with the increase in total organized segment employment outside of agriculture (noted in para 1 of this section above). In absolute terms there is a decline in self-employment over the same period. Organized segment employment can be either formal or informal. At the beginning of this paper we had argued that decent employment means formal employment in the organized segment of industry and services. We want to summarise here the trends in regard to organized versus unorganised segments in 107
112 manufacturing, non-manufacturing and services. Within manufacturing we will also briefly recall our earlier analysis of formal versus informal employment in manufacturing (which was revealed by our contrasting analysis for organized manufacturing employment from the Annual Survey of Industries as opposed to the NSSO. On the basis of NSS data, within manufacturing, which saw an increase in total employment in the first half of the decade by 11.7 million, a very sharp increase took place in the unorganised segment, of nearly 9 million new jobs. The increase in organized employment was just under 3 million in the first half of the decade (from 13.1 to 16.1 million). In the latter half of the decade there was a very limited fall in organized manufacturing employment, while the unorganised segment in manufacturing saw a precipitous decline over 6.65 million workers (from 39.7 to 33.1 million). Clearly the decade of the 2000s did not see any major change in the nature of the distribution of workers between the organized and unorganized segments of manufacturing. The global economic crisis of 2008 was presumably the most important factor underlying decline in total employment in manufacturing, and with the global economic environment remaining uncertain as we write the 12 th Five Year Plan it is unlikely that the quality of employment is going to change any time soon. We had also noted earlier that all the increase in manufacturing employment that took place through the decade was confined to informal employment. We came to this conclusion by comparing organized employment based on two different sources of data for organized manufacturing (ASI and NSS). This is the long standing trend where manufacturing industry has tended to avoid taking on workers on the regular payroll, but have hired workers during the period of business upswing on informal contracts (contract workers, ad hoc workers) and then let them go as the business cycle turned downwards. In other words, the structural change in the direction of more decent work that one might expected in a rapidly growing industrial sector is nowhere in evidence. This should remain a serious concern for policy makers in both states and the central government during the 12 th Five Year Plan. In non-manufacturing, it was in the construction sub-sector that we saw a most remarkable phenomenon: not only did employment rise overall in construction at a phenomenal rate throughout the decade, but both the organized as well as the unorganized segments of this industry saw a dramatic increase in employment. The increase in the unorganized segment of construction from 12.9 to 19.7 and then to 27.7 million over the decade was as one might have expected. What was much more unexpected, however, was the dramatic increase in the organized segment of construction from 4.62 million in to 6.4 million in to an astounding jump to 24.4 million in , a near quadrupling of total organized segment employment over the decade. The total employment in organized construction in in fact amounted to 26.3 million, which is nearly 11 million 108
113 more than total organized segment employment in manufacturing in the same year (based on NSS, which uses a broader definition of organized manufacturing than the a ASI). It appears, therefore, that with growing investment in infrastructure organized segment employment in construction is likely to grow at a much faster pace than in agriculture or manufacturing or services. Total employment in services in was million, which is more than double the total employment in the same year in the manufacturing sector. The organized segment contributed 34.5 million jobs in the same year, which was a 10% increase from the level. It is remarkable that in the latter half of the decade when manufacturing employment, both organized as well as unorganized was declining the organized segment of services continue to see a growth in employment. It is equally remarkable that the unorganized segment of services saw a fall in employment from 81.7 million to 77.8 million in the latter half of the decade. More than half of this decline in unorganized segment employment in services was accounted for by the decline in employment in wholesale and retail trade, which is perhaps a reflection of the overall fall in economic activity in the aftermath of the downturn of the Indian economy after the global economic crisis. Nevertheless, the experience of the 2000s suggests that organized segment employment may well continue to grow during the 12 th Five Year Plan not only in the construction subsector, but also in services. Both these sub-sectors seem to have survived the impact of the global economic crisis. 109
114 Table 24: Sectors identified as high growth by 11 th plan reality? Services Other sectors and subsectors Industry group IT-enabled Services Energy-Production, Distribution and Consumption of Horticulture Automotive Telecom Services Floriculture Food Products Tourism Construction of Buildings Chemical Products Transport Services Infrastructure Projects Construction Basic Metals Non-Metallic Mineral Health Care Education and Training Real Estate and Ownership of Dwellings Banking and Financial Services Insurance Retail Services Media and Entertainment Services Products Plastic and Plastic Processing Industry Leather Rubber and Rubber Products Wood and Bamboo Products Gems and Jewellery Handicrafts Handlooms Khadi and Village Industries Potential Growth Sector for Employment: Organised manufacturing (as defined by the ASI, which uses a narrow definition of organized manufacturing than NSS) generated a very small increase in employment between and from a level of 6.28 million at the beginning of the decade to 6.6 million at mid point of the decade, i.e. an increase of nearly 320,000 in the first half of the decade. However, organized manufacturing employment then increased from 6.6 million in 2008 to 8.78 million in , an increased 2.18 million in absolute terms. With a new manufacturing policy in place, India should be able to increase manufacturing output and employment by at least as much in the 12th Five Year Plan period. Between and non-manufacturing industry has been a very significant contributor to employment generation, amounting to an increase in employment by 26 million (raising the absolute level of employment in non-manufacturing industry to 56 million in ). As we noted earlier, what is remarkable is that almost all of this increase in employment in non-manufacturing is contributed by the construction sector. The contribution of construction to the increase in employment in the latter half of decade is 10 times as large as the contribution of organized manufacturing. Remarkably the other sub sectors within the non-manufacturing industry show divergent trends: Electricity, Gas and Water supply experienced an absolute decrease in 110
115 employment in the latter half of the decade by 0.12 million (total employment in was 1.2 million), probably explained by the capital-intensity of new production capacity. On the other hand, Mining & Quarrying had an increase in employment in the latter half of the decade by barely 112,816 (total employment in Mining & Quarrying in India amounted to 2.75 million). Organized mining continued to see slight increases in employment, as did unorganized mining. Thus, all the increase in employment in non-manufacturing industry came from the construction sector. Notably service sector employment overall remained constant between the middle and the end of the decade at the same time that the share of services in GDP increased (from 53 to 57% between the middle and the end of the decade). The absolute decrease in employment in unorganized services was 4 million in the latter half of the decade. This experience over the service sector is instructive because during the period of 11th Five Year Plan (See Planning Commission, 2008 Chapter 4, Vol. 1) it was expected that several sub-sectors within services were not only going to see an increase in output but also employment (see Table 11). The reality, however, is rather different. Among the sectors that were identified in Chapter 4, volume 1, of the 11th Five Year Plan document (see page 77-78), at least 3 major service sectors had seen decrease in employment: education, retail trade and hotels/restaurants (the last of which belong to the category of tourism which was also identified as a growth sector. However, 3 of the 11 service sectors that were identified as high growth sectors in the 11th Plan chapter on labour and employment telecommunication services, transport and real estate have shown an increase in employment. In other words, the picture is extremely mixed in regard to employment even though the share of services in total GDP has grown in the latter half of the 2000s. Equally remarkable is the very mixed experience in respect of employment generation in the industry groups that were identified in the 11th Plan as high growth sectors. Thirteen sub-sectors within manufacturing were identified as high growth sectors for both output and employment. Of them, food products, chemical products, nonmetallic mineral products, plastics, rubber and rubber products have all declined, although gems and jewelry, leather and basic metals showed an increase in employment. Remarkably, in the Approach Paper, Priority Sectors have been identified again this time as part of the National Manufacturing Plan. 9 The sectors that will create large employment are: textiles and garments, leather and footwear; gems and jewellery; food processing industries; and handlooms and handicrafts. Unfortunately, however, total employment in food products and beverages has declined over the to period (see Table A4). Textiles saw an increase in jobs in the first half of the decade, but a sharp fall in the second half, leaving total employment in the sector where it was at its beginning. Wearing approval and leather products did see a sharp increase. Given this extremely mixed picture, it is a bit unlikely that the outcome during the 12 th Plan will be much different than the one we found for the sectors identified for high growth in employment and output at the commencement of the 11 th Plan Sectors that will create large employment Textiles and Garments; Leather and Footwear; Gems and Jewellery; Food Processing Industries; Handlooms & Handicrafts 2. Sectors that will deepen technology capabilities in Manufacturing Machine tools; IT Hardware and Electronims 3. Sectors that will provide Strategic Security Telecommunication equipment; Aerospace; Shipping; Defence Equipment 4. Manufacturing Technology sectors for Energy Security Solar Energy; Clean Coal Technologies; Nuclear power generation 5. Capital equipment for India s Infrastructure Growth Heavy electrical equipment; Heavy transport, earth moving and mining equipment 6. Sectors where India has competitive advantage 111
116 6. Increasing Employment for Marginalized Groups: We examined the employment trends for vulnerable social groups (SCs,STs) and the largest minority among religious communities (Muslims). SCs, STs and Muslims have higher unemployment rates than the national average (by the CDS measure). Creating employment during the 12th Plan for these groups faces a number of challenges. First, the educational level of all these groups is lower. Second, a very significant share of the total population of SCs, STs and Muslims is concentrated in 8 states of India (namely Uttar Pradesh, Bihar, Andhra Pradesh, West Bengal, Tamil Nadu, Rajasthan, Chhatisgarh and Jharkhand), most of them relatively poorer. The strategy implied by these constraints is that government policy during the 12th Plan period must focus on effective implementation of the Right to Education, particularly in states and districts in those states, where SCs/STs and Muslims are concentrated. In other words, it implies a combination of a educational and skilldevelopment oriented strategy with geographic targeting of districts where these marginalized groups are concentrated. In other words affirmative actions for these communities and social groups is most likely to succeed with policy and geographic targeting in areas of high concentration of these groups. The fact that SCs/STs and Muslims are more likely to work as casual labour than any other social group or religious community means that a affirmative action must focus on financial incentives to ensure retention of these groups in schools and colleges as well as in vocational education and training. The targeting should be to improve the effectiveness of the three Central Government Programmes in these districts: Sarve Sikhsa Abhiyan to improve the quality of elementary education; the Rashtriya Madhyamic Shiksha Abhiyan to improve the quality of secondary education, and locating more industrial institutes (ITIs) of the Ministry of Labour to promote skill development appropriate to the needs of those districts or for the labour market in those states. A combination of more effective school education on the one hand, and better vocational education and training on the other would be critical to prepare these marginal groups for the rapid economic growth occurring even in the states they are geographically concentrated in. Child Labour has been declining through the decade of the 2000 s as is the incidence of nowhere children who are neither working nor in school; this suggests that children are entering school in larger numbers rather than the labour force. In fact, the data suggests the most of child labour now is labour undertaken by 6-14 years olds as part of the household enterprise, rather than work outside the home. The proportion of girls among no where children remains high even though their enrolment rates have been improving. It is critical therefore, that the norms in the Eight to Education Act, 2009, are implemented as effectively as possible during the 12 th Five Year Plan if the incidence of girls is no where children is to decline. 112
117 Employment for women (a) We have noted that the labour force participation rate for women fell in the latter half of the decade, especially in rural areas, because women are participating to a greater extent in education. A larger number of these educated girls will enter the labour force during the period of the 12 th Five Year Plan, and it is critical that this cohort of girls is also provided for in the vocational education stream of secondary education, which is to start from class IX onwards with the beginning of 12 th Five Year Plan. In addition, ITIs must provide for more courses which are likely to be found attractive by adolescent girls, for example, computing, beautician, etc. (b) We noted above that the number of women home based workers grew from about 29 million in to 40 million in Many of these workers are employed in economic activities that are being undertaken in the 5500 clusters of traditional artisanal products spread through out the country (Bidi making, zarizardoshi embroidery work, chikan work, bangle making, handloom, textile weaving, handicrafts). These clusters are in urgent need of credit from formal banking sources, support for their marketing efforts, design innovation and technology upgradation. Government policy during the 12 th Plan must focus on these four requirements of the traditional industries, using the cluster approach (as suggested earlier by the National Commission for Enterprises in the Unorganized Sector). (c) The self help group approach of supporting women swork has been extremely successful in two southern states, Andhra Pradesh (the Velugu programme) and in Kerala (the Kudumbashree programme). The approach in these states has been so successful in reinforcing the livelihoods of women, especially in rural areas, that this model is now being taken to scale during the 12 th Five Year Plan in the National Rural Livelihoods Mission, a programme of the Ministry of Rural Development. It will be critical that this programme does not remained funded during the 12 th Five Year Plan, given that it had already been strongly recommended as a replacement for the Sampoorna Grameen Swarozgar Yojana (SGSY) in the 11 th Plan itself. 7. Responding to the next global economic downturn There is a likelihood of another global downturn as the 12 th Plan goes into operation. The fact that employment in manufacturing declined and in services has not grown at all in the latter half of the 2000s suggests that the 2008 global crisis did impact economic activities significantly, even though direct exports-related employment did not fall more than half a million. The most serious challenge in the international environment is the growing threat from Chinese manufacturing, not just in India s export markets but also, and even more so, in our domestic markets. Government policy will need to be cognizant of this growing threat, 113
118 and the National Manufacturing Policy, still under consideration within government, will need to be strengthened accordingly. However, most of the policy responses must be such as to sustain domestic demand. Not only has domestic investment rate not picked up to its pre-2008 crisis levels, but capital is flowing out rather than investing in India. The paper makes a series of recommendations on action needed to sustain domestic investment. First, the interest rate hikes by RBI have made precious little impact on inflation, and no further hikes should occur. Second, there is no fiscal space left to introduce a fiscal stimulus of the kind that followed the 2008 crisis. There is a critical need now to raise the tax to GDP ratio if the fiscal space to intervene to sustain domestic consumption demand is to be created. Third, the governments, both States and the Centre, needs to act to improve the business environment, and the ease of doing business, otherwise investment will continue to flow abroad. Fourth, finance for MSMEs needs to be stepped up. Finally, continued action on improving skills is necessary if productive jobs are to accompany higher earnings. References Anant and Mehta (June ) Has employment fallen in India? livemint.com accessed 1 st July Annual Survey of Industries (2004-5) Biswanath Goldar (2011) Organised Manufacturing Employment: Continuing the Debate Central Statistical Organisation, Government of India Dehejia and Panagariya (2011) Service growth in India, a look inside the black box, paper presented at Columbia NCAER Conference. Dipak Mazumdar and Sandip Sarkar (2004) Reforms and employment elasticity in organized manufacturing, Economic and Political weekly, VOL 39, No. 27, 27 July 3-9, p Economic Survey of India ( ), Institute of Applied Manpower Research (IAMR) (2011), India Human Development Report New Delhi. Institute of Applied Manpower Research (IAMR) Study International Labour Office (ILO) (2006) Implementing the Global Employment Agenda: Job Placements at II M-Ahmedabad, Economic & Political Weekly, 1 Nov Employment strategies in support of decent work, Vision document (Geneva). Also available at: Kannan and Raveendran (2009) Growth sans Employment: A Quarter Century of Jobless Growth in India s Organised Manufacturing Economic and Political weekly, VOL 46, No. 10, March 7-14, p
119 Madheswaran, S and P Attewell (2007): Caste Discrimination in the Indian Urban Labour Market:Evidence from the National Sample Survey,Economic & Political Weekly, 42 (41), October13-19, p Mehrotra and Biggeri, (2007). Asian informal workers: global risks, local protection, Routledge Publication, New Delhi Mehortra Santosh (2010) India and the global economic crises, Journal of Asian Public policy, vol 3, issue 2, pp Ministry of Minority Affairs, Government of India, New Delhi. Ministry of Small Scale Industries Annual report (2010) Ministry of small and medium enterprises - 4th All India Census ( ) Mohanty, (2006): Social inequality, labour market dynamics and reservation, Economic & Political Weekly, 41 (35), September 2-9, p National Commission on Enterprises in Unorganised Sector (NCEUS) report (2008, 2009) National Sample Survey 55 th, 61th, 64th and 66 th Round Prabhat Patnaik (2011) Economic growth and employment, Economic and Political weekly, VOL 46, No. 26, 27 June 25 - July 08. Rangarajan, C. (2006) Employment and Growth, Madras School of Economics, Monograph 2/2006 Rao, N Chandrashekaran, Sukti Dasgupta (2009): Nature of employment in food processing sector, Economic & Political Weekly, 14 (17), April 25-1 April, pp Robinson, Rowena (2007), Indian Muslims: The varied dimensions of marginality, Economic and Political weekly Vol. 42, No.10, pp Sachar committee report (2006) social, Economic And Education Status Of The Muslim Community In India Sujoy Chakravarty, E Somanathan (2008) Discrimination in an Elite Labour Market? Tendulkar (2007) India s growing service sector: Database problems and issues, Economic and Political weekly, VOL 42, No. 37, September 15 - September 21, p Vinish Kathuria, Rajesh Raj SN, Kunal Sen (2010) Organised versus Unorganised Manufacturing Performance in the Post-Reform Period, Economic and Political weekly, VOL 45, No. 24, 27 June
120 Appendix Tables A1: Employment across various sectors (in millions) , , Absolute increase in employment (in Employment across various sectors (in millions) millions) Sectors Agriculture Manufacturing Mining & quarrying Electricity, gas & water supply Construction Non manufacturing Trade Hotels & restaurants Transport, storage & communication Banking (& insurance) Real estate public administration & defence Education Health Other community, social & personal services Other services Services Total
121 A2: Employment elasticity, CAGR of employment and GVA, ,2004-5, and Employment Growth rate of Elasticity CAGR GVA (CAGR) Sector Agriculture Manufacturing Mining & quarrying Electricity, gas & water supply Construction Non manufacturing Trade Hotels & restaurants Transport, storage & communication Banking (& insurance) Real estate public administration & defence Education Health Other community, social & personal services Other services Services Total
122 A3: Share of employment and GVA, , Shares Sectors Employment GVA Employment GVA Agriculture Manufacturing Mining & quarrying Electricity, gas & water supply Construction Non manufacturing Trade Hotels & restaurants Transport, storage & communication Banking (& insurance) Real estate public administration & defence Education Health Other community, social & personal services Other services Services Total
123 A4: Employment across various sectors (in millions) in Manufacturing, ,2004-5, Employment across various sectors (in millions) in Manufacturing Absolute increase in employment Sectors food products and beverages tobacco products Textiles wearing apparel; dressing and dyeing of fur; and Tanning and dressing of leather; luggage, handbags, saddlery harness and footwear wood and of products of wood and cork, except furniture; articles of straw and plaiting materials paper and paper products and Publishing, printing and reproduction of recorded media coke, refined petroleum products and nuclear fuel and rubber and plastics products chemicals and chemical products other non-metallic mineral products basic metals fabricated metal products, except machinery and equipment ; machinery and equipment n.e.c.; Manufacture of office, accounting and computing machinery electrical machinery and apparatus n.e.c.; radio, television and communication equipment and apparatus motor vehicles, trailers and semitrailers; other transport equipment furniture; manufacturing n.e.c.; medical, precision and optical instruments, watches and clocks Recycling Manufacturing
124 A5: Employment elasticity and CAGR of employment and GVA in manufacturing, , 200-5, Sectors Employment Growth Rate of Elasicity CAGR GVA (CAGR) food products and beverages tobacco products textiles wearing apparel; dressing and dyeing of fur; and Tanning and dressing of leather; luggage, handbags, saddlery harness and footwear wood and of products of wood and cork, except furniture;articles of straw and plaiting materials paper and paper products and Publishing, printing and reproduction of recorded media coke, refined petroleum products and nuclear fuel and rubber and plastics products chemicals and chemical products other non-metallic mineral products basic metals fabricated metal products, except machinery and equipment ; machinery and equipment n.e.c.; Manufacture of office, accounting and computing machinery electrical machinery and apparatus n.e.c.; radio, television and communication equipment and apparatus motor vehicles, trailers and semi-trailers; other transport equipment furniture; manufacturing n.e.c.; medical, precision and optical instruments, watches and clocks Recycling
125 A6: Share of employment and GVA within manufacturing, , Shares (within manufacturing) Sectors Employment GVA Employment GVA food products and beverages tobacco products textiles wearing apparel; dressing and dyeing of fur; and Tanning and dressing of leather; luggage, handbags, saddler harness and footwear wood and of products of wood and cork, except furniture; articles of straw and plaiting materials paper and paper products and Publishing, printing and reproduction of recorded media coke, refined petroleum products and nuclear fuel and rubber and plastics products chemicals and chemical products other non-metallic mineral products basic metals fabricated metal products, except machinery and equipment ; machinery and equipment n.e.c.; Manufacture of office, accounting and computing machinery electrical machinery and apparatus n.e.c.; radio, television and communication equipment and apparatus motor vehicles, trailers and semi-trailers; other transport equipment furniture; manufacturing n.e.c.; medical, precision and optical instruments, watches and clocks Recycling Manufacturing
126 A7: Number of workers (in million) by sector, , 200-5, Workers (in millions) Total Unorg anized Orga nized Total Unorg anized Organi zed Total Unorg anized Orga nized Agriculture food products and beverages tobacco products textiles wearing apparel; dressing and dyeing of fur Tanning and dressing of leather; manufacture of luggage, handbags, saddlery, harness and footwear 20 wood and wood products except furniture; 21 paper and paper products Publishing, printing and reproduction of recorded media 23 coke, refined petroleum products and nuclear fuel 24 chemicals and chemical products rubber and plastics products other non-metallic mineral products basic metals fabricated metal products, except machinery and equipment
127 Workers (in millions) Total Unorg anized Orga nized Total Unorg anized Organi zed Total Unorg anized 29 machinery and equipment n.e.c Orga nized 30 office, accounting and computing machinery 31 electrical machinery and apparatus n.e.c. 32 radio, television and communication equipment and apparatus 33 medical, precision and optical instruments, watches and clocks 34 motor vehicles, trailers and semitrailers other transport equipment furniture; manufacturing n.e.c Recycling Manufacturing Mining Electricity Gas & water supply Construction Non Manufacturing Sale, maintenance and repair of motor vehicles and motorcycles; retail sale of automotive fuel 51 Wholesale trade and commission trade, except of motor vehicles and motorcycles
128 Workers (in millions) Total Unorg anized Orga nized Total Unorg anized Organi zed Total Unorg anized Orga nized 52 Retail trade, except of motor vehicles and motorcycles; repair of personal and household goods wholesale & retail trade Hotels & Restaurants Land transport; transport via pipelines 61 Water transport Air transport Supporting and auxiliary transport activities; activities of travel agencies 64 Post and telecommunications Transport, Storage & Communication 65 Financial intermediation, except insurance and pension funding Insurance and pension funding, except compulsory social security 67 Activities auxiliary to financial intermediation Banking & Insurance Real estate activities Renting of machinery and equipment without operator and of personal and household goods
129 Workers (in millions) Total Unorg anized Orga nized Total Unorg anized Organi zed Total Unorg anized 72 Computer and related activities Research and development Other business activities Real Estate, renting Public administration and defence; compulsory social security Education Health Sewage and refuse disposal, sanitation and similar activities 91 Activities of membership organizations n.e.c. 92 Recreational, cultural and sporting activities 93 Other service activities Other community, social & personal services 95 Activities of private households as employers of domestic staff 99 Extraterritorial organizations and bodies Other Services ( ) Orga nized Total Services Total Workforce
130 A 8: State-Wise Absolute Employment (in millions) by major sectors (2004-5, ) non Total of manufacturing Services sectors 2004 Agriculture Manufacturing non manufacturing Total of sectors 2009 States Agriculture Manufacturing Services Andhra Pradesh Assam Bihar Chhattisgarh Delhi Gujarat Haryana Himachal Jammu and Kashmir Jharkhand Karnataka Kerala Madhya Pradesh Maharashtra Orissa Punjab Rajasthan Tamil Nadu Uttar Pradesh Uttarakhand West Bengal Total across states
131 Agri cultu re A9: State-Wise Share of Employment across sectors, (2004-5, ) non manufacturin g non manufacturin g Manufacturin Service Tota Agricultur Manufacturin Service Tota States g s l e g s l Andhra Pradesh Assam Bihar Chhattisgarh Delhi Gujarat Haryana Himachal Jammu and Kashmir Jharkhand Karnataka Kerala Madhya Pradesh Maharashtra Orissa Punjab Rajasthan Tamil Nadu Uttar Pradesh Uttarakhand West Bengal
132 A 10: State-Wise Change in absolute employment (in millions), Total of sectors States Agriculture Manufacturing non manufacturing Services Andhra Pradesh Assam Bihar Chhattisgarh Delhi Gujarat Haryana Himachal Jammu and Kashmir Jharkhand Karnataka Kerala Madhya Pradesh Maharashtra Orissa Punjab Rajasthan Tamil Nadu Uttar Pradesh Uttarakhand West Bengal Total across states
133 A 11: State-wise Change in share of employment (percentage points), non States Agriculture Manufacturing manufacturing Services Andhra Pradesh Assam Bihar Chhattisgarh Delhi Gujarat Haryana Himachal Jammu and Kashmir Jharkhand Karnataka Kerala Madhya Pradesh Maharashtra Orissa Punjab Rajasthan Tamil Nadu Uttar Pradesh Uttarakhand West Bengal
134 A 12: State-Wise Share of GVA across sector, (2004-5, ) Manufac Servi Agricultu Manufactu Agri turing non manu ces Total re ring Non Manu States Services Total Andhra Pradesh Assam Bihar Chhattisgarh Delhi Gujarat Haryana Himachal Jammu and Kashmir Jharkhand Karnataka Kerala MP Maharashtra Orissa Punjab Rajasthan Tamil Nadu Uttar pradesh Uttrakhand West Bengal
135 A13: Share of GVA across States by sector, , States Agri Manf NM Services Agricul ture Manufactur ing Non Manuf Servic es Andhra Pradesh Assam Bihar Chhattisgarh Delhi Gujarat Haryana Himachal Jammu and Kashmir Jharkhand Karnataka Kerala MP Maharashtra Orissa Punjab Rajasthan Tamil Nadu Uttar Pradesh Uttarakhand West Bengal Total
136 A14: Share of Employment across states by sector, , States Agriculture Manufacturing Nonman Services Agriculture Manufacturing Non- Man Services AP Assam Bihar Chhattisgarh Delhi Gujarat Haryana Himachal Jammu and Kashmir Jharkhand Karnataka Kerala MP Maharashtra Orissa Punjab Rajasthan Tamil Nadu Uttar Pradesh Uttarakhand West Bengal State total
137 A.15 Employment Elasticity by States by Sectors States Agriculture Manufacturing non manufacturing Services Total Andhra Pradesh Assam Bihar Chhattisgarh Delhi Gujarat Haryana Himachal Jammu and Kashmir Jharkhand Karnataka Kerala Madhya Pradesh Maharashtra Orissa Punjab Rajasthan Tamil Nadu Uttar Pradesh Uttarakhand West Bengal Total across states
138 Planning Commission (LEM Division) Annexure VI Subject: Summary Record of the First Meeting of Working Group on Employment, Planning & Policy for the Twelfth Five Year Plan ( )-reg. The first Working Group meeting to discuss Employment, Planning & Policy for the Twelfth Five Year Plan ( ) was held under the Chairmanship of Dr. Ashok Sahu, Pr. Adviser (LEM), Planning Commission. The list of participants given at annexure. At the outset Chairman welcome the members of the Working Group. In his introductory remark he refer to the constitution of Steering Committee on Labour, Employment & Skill Development for the 12 th Five Year Plan ( ) and also the six Working Groups constituted for different sub sectors of Labour and Employment under the Steering Committee. To highlight the key issues of the sector Joint Adviser (LEM) was asked to make a brief presentation. The Joint Adviser (LEM) in his presentation highlighted the following: The targeted GDP growth (9%) for the 11 th Plan and likely achievement (8.2%). Productive and gainful employment for inclusive growth. Creation of 58 million work opportunities. Labour scenario as per 64 th round ( ) survey of NSS. Annual average growth rates. Estimates of unemployment rates for rural and urban areas based on different parameters as per 64th round ( ) survey of NSS. Employment growth in organized sector in the period vis-a- vis Physical and financial performance under employment oriented initiatives taken by Government such as MGNAREGA, SGSY, SJSRY. Situation of labour market information system. Objectives of 12 th Plan a) Faster, More Inclusive, and Sustainable Growth b) Faster creation of jobs c) Emphasis on sector having large potential of having employment such as textiles and garments, leather and footwear; gems and jewelry; food processing industries and MSMEs. 134
139 Challenges and Issues for formulation of 12 th Five Year Plan such as Making projection for the 12th Plan on the basis of present employmentunemployment situation Evolving a strategy for generating adequate employment opportunities along with achieving 9 to 9.5% GDP growth rate. Identifying priority sectors for creating better avenues of employment particularly in organized sector Identifying the problems underlying youth, educated persons, women, minorities, SC, ST and backward classes, unorganized sector and laggard regions unemployment/underemployment and remedies thereof Deciding the frequency and the agency for generating data on employmentunemployment. Laying down of a framework to place employment generation/protection at the heart of revival strategy or stimulus packages Deciding the particular parameter (like UPS, US(adj.), CWS and CDS) for making realistic assessment for estimating employment- unemployment. Constitution of two sub-groups : i) Sub-group on employment-unemployment Projections, ii) Sub-group on Creation of Employment opportunities. The Chairman invited the individual suggestion of members of Working Group. Dr. Papola made the following observations: Figures regarding employment-unemployment are emerging from various sources. However, we need to arrive at an appropriate format for estimates and assessment. We have to be careful in projecting targets /potential for employment in future. We should also be cautioned in projecting employment elasticity. In economy like ours we should not insist on raising employment elasticity. Productivity growth rate has to be one of the important strategies for our plan. The are a large number of people severely unemployed/underemployed. Some of them do not have income even half of BPL level. Referring to Dr. Papola observations the Chairman observed that productivity issue as well as the issue of including the poor workers will be taken care off. Dr. Arup Mitra observed the following: It is very important to mention the extent of unemployment. 135
140 Extent of underemployment among the self employed household as casual labour dependent household and their employability should given consideration. We could make many of such labour force employable through skill upgradation and quality education for this technical education infrastructure needs to be created in the concerned areas. Employment has gone up in informal sector due to new changes like regularity and sub-contracting. Innovation is required for increasing the productivity. However, we are importing the technology instead of expanding the labour incentive activities by doing so we can not more employment. Shri Kanagasabapathy observed the following: Change in growth process has been taking place. However, we need to see how it has taken labourforce forward. We should also see how far service sector; export sector is going ahead and what kind of consumption goods are going to be covered. Changes in the consumption pattern are notable. Consumption of cosmetic sector is also expanding in rural areas. Media and entertainment should also be looked at in term of employment opportunities. Quantity of consumption and changing pattern in consumption in term of quantity should also be linked with employment. MGNAREGA should not be viewed as employment generating scheme. It is employment insurance under the act. Dr. Diwakar observed the following: Two basic dimensions namely structural imbalance and regional imbalance should be kept in view while reviewing employment situation. Some of the regions have potential to grow. NSS data reveals that female employment has declined. This is an issue of major concern and need to be addressed to. Backward regions have different kinds of bottlenecks and constrains. They also face floods and other natural calamities. Employability of the people of such areas needs to be looked. We also have some emerging areas with best practices and best results. Changes are to create employment opportunities for agrarian economy and the rural areas. For informal sector CDS approach needs taken up for assessing the situation. However, for organized sector approach needs to be different. Representative of VVGNLI observed the following: 136
141 The Working Group should analyse the data on the basis of different approaches. First Report to People on Employment highlighted the two issues; i) Quality of Employment needing improvement. ii) Backward regions/ backward states are not getting largely benefits of employment schemes. Requirement of trainers for covering the target of 500 million persons to be trained under skill development by 2022 should also be considered by this Working Group. The Chairman suggested to the member of Working Group that this Working Group to keep in view the first report to People on Employment released last year and National Policy on Employment being formulated by M/o Labour and Employment. Dr. Deshpande observed the following: Data on growth of employment needs to be revisited. Referring to the article of B. Goldar he observed that recent years have been high growth years in terms of employment. However, this is related to organized manufacturing employment. Some sectors as generator of future employment need to be looked afresh. Recent report on global trends in employment indicate that employment in service sector has increased. Sectors like insurance, tourism, finance & banking etc. are going to be major generator of employment opportunities. Movements and transformation of employment from informal sector to formal sector needs to be analysed. There is growing evidence of educated people taking recourse to service sector employment. Mr. Ajgaonkar observed the following: Manufacturing sector has limited scope of employment. Machines will limit the scope of employment generation. Hence we need to lay emphasis on service sector for generating more employment. Creation of a portal for employment-unemployment data on national basis may bridge the demand-supply gap. To promote environmental awareness and also for changing the attitude of the people. A person should be deputed to ensure environment protection in each village. As consequence protect the environment as well as provide employment. 137
142 Dr. Faujdar Ram observed the following: We should consider revising the projection of population because the assumptions which were taken at that time are not fulfill even now. Urbanization component should be kept separatly. The states like Tamilnadu and Maharashtra have large urban population vis-à-vis many other states. For other States we need to have different approach for market assessment, training need assessment and creation of employment opportunities. ITIs are proving routine stereotype training. Training needs to be provided according to the need of the people. Number of people availing benefits under MGNAREGA should be expected to go down. Employment opportunities available under MGNAREGA are not for educated and skilled people. Representative of FICCI observed the following: Employment in informal sector is high. However bring improvement in quality of employment should be given due consideration. One of the constrain in increasing employment in organized sector is rigidity in labour laws. The same needs to make flexible. Ms. Kavita Gupta (Pr. Secretary (Labour), Govt. of Maharashtra) observed the following: We need to keep in view the global competitive scenario. India has competitive advantage in global terms. We need to examine as to which sectors are propelling GDP growth and how can we propel employment growth. We should also target global markets. In demand base training there is a need to identified gap. We should provide soft skill and aptitude orientation to youth over a period of time for improving their employability. We should think about creating nucleases of employment generations. Youth with entrepreneurship skill should be identified at class 10 th stage and should be given special motivation to build on. Labour market flexibility requires to be promoted without compromising fairness to labour. Agricultural skill upgradation is an important area to be considered. We also need to consider the creation of labour market cell where we have details of skills and training available in each industry. There is some kind of rigidity in the labour market in one case people are not will to shift to other regions. In the other case those who want to shift 138
143 other regions are not allowed by local people. This issues needs to be given due consideration. DG, NSSO observed the following: We cannot ignore educated unemployed people and supply side available to them. Quality of employment and productivity has also needs to be taken in account. We have to use appropriate data set for taking a decision for labour force projection and estimate the quantum of employment. The data regarding employment unemployment based on 66 th ( ) round of NSS will be available to the Working Group by the end of June. We have to be careful in using labour bureaus data for projecting employment-unemployment. Current employment situation can be analysed on the basis of economic census data. The same can be usefully done by through NSSO data. DG, IAMR observed the following: Faster period of growth has been post The present periodicity of availability of employment-unemployment survey is not. The data to be available through annual survey by labour bureau is going to be is limited nature. Employment in our country is not growing as it should be. Crop production in agricultural is not likely to generate employment. Non- crop agricultural activities such as poultry, dairying, fisheries, horticulture, floriculture, animal husbandry etc. may generate more employment. We are second largest growers of fruits and vegetables in the world. However, about 40% of our produce gets wastes because lack of food processing activities. Non-farm activities have a large potential of employment growth. Service sector is the driving force for economy. However, available data indicates that the quantum of service sector in organized sector is declining. We need to do a detail analysis of employment elasticity with reference to productivity. We also need to study why different sectors are behaving differently in terms of employment. An increasing trend in feminization has been observed, National Rural Livelihood Mission has potential roll in enhancing women in no-farm sector. 139
144 Director, Employment Govt. of Tamilnadu observed the following: A major hurdle is the disconnection between the industries and the manpower. Industries are located in selected parts of specific states. However, manpower is largely available in underdeveloped states like Jharkhand, Bihar, Chhattisgarh etc. Incentives should be given to industries for labour absorption. Opening of sourcing sectors should be considered in the areas where manpower is available. People should be educated about the advantages of joining organized jobs. There is exponential potential growth in organized sector for skilled people. Employment situation can also improve by giving due recognition to honour of work. Dignity of labour should be give due recognition. There is need to rigorously enforce Employment Exchange Compulsory Notification of Vacancy Act, Under which every employer have to submit data about vacancies and employment. Representative of MoLE observed the following: Ministry is making efforts to effectively implement Employment Exchange Compulsory Notification of Vacancy Act, However, Employment Exchanges do not have adequate staff/ infrastructure to overcome this hurdle. Ministry has moved the proposal for Upgradation and Modernization of Employment Exchange in a Mission Mode.. Under the proposed new project emphasis is laid on employment movement information and vocation guidance. Summing of the discussion the chairman assured the members that the minutes of the meeting would reflects view points of all the members present in the today s meeting. Which would facilitated the path of discussion and deliberation of the two sub groups constituted under this Working Groups namely: i) Sub-group on employment/unemployment Projections, ii) Sub-group on Creation of Employment opportunities The composition of the above mentioned two sub-groups finaly agreed in the meeting is as follows: 140
145 Sub-group on employment/unemployment Projections Sr. No. 1 Prof. Arup Mitra Chairman 2 Dr. T. S. Papola Member 3 DG, NSSO Member 4 Dr. Faudar Ram Member 5 Shri K. Kanagasabapathy, Member 6 Ms. Amarjeet Kaur Member 7 Dr. J.S. Tomar Member convener Sub-group on Creation of Employment opportunities Sr. No. 1 DG, IAMR Chairman 2 Ms. Kavita Gupta Member 3 Dr. D.M. Diwakar Member 4 Dr. Chandrahas Deshpande Member 5 Shri R.M. Ajgaonkar 6 Shri A.K. Satpathy Member 7 Shri B.P. Pant Member 8 Shri Santosh Mishra Member 9 Shri K.N.Pathak Member convener 141
146 No. Q-20017/2/2011/LEM/LP Planning Commission (LEM Division) *** Annexure-VII Subject: Summary Record of the Second Meeting of Working Group on Employment, Planning & Policy for the Twelfth Five Year Plan ( )-reg. The second Working Group meeting to discuss Employment, Planning & Policy for the Twelfth Five Year Plan ( ) was held under the Chairmanship of Dr. Ashok Sahu, Pr. Adviser (LEM), Planning Commission on in Yojana Bhawan. The list of participants is given at annexure. At the outset Chairman welcomed the members of the Working Group. In his introductory remark he stated that the meeting of the Steering Committee on Labour, Employment and Skill Development is scheduled to be held on 29 th August, The Steering Committee in its meeting will review the progress in preparation of the reports of all the six Working Groups constituted under Labour and Employment Sector. In the light of the direction received from the Steering Committee one more meeting of this Working Group will be held shortly and the report of the Working Group will be given final shape accordingly. The chairman requested the chairman of the Sub-Group on Employment Projection to make a brief presentation. The key points of the Report of the Sub-Group on Employment Projection was presented by Dr. Arup Mitra, its Chairman. Three sets of projections/estimates were made taking into account (i) long term growth rate, (ii) employment elasticity based on the GDP growth rates and (iii) the employment growth rate and presuming that total factor productivity growth may further increase in the future years, on the basis of three criteria available for measuring employment-unemployment such as Usual Status (US), Current Weekly Status (CWS) and Current Daily Status (CDS). The Sub-Group felt that, while the US method overestimates the employment position, the CDS method underestimates it. Hence, CWS method appears to be more appropriate for being adopted to measure employment/ unemployment. Over time employment elasticity is declining and the employment-unemployment survey needs to be conducted on annual basis. Dr. Papola appreciated the exercise done by the Sub-Group and suggested that the employment challenges should be outlined, labour force projection should be made and the National Employment Policy should be finalized. Except for the trend for labour force participation rate is declining and thus is a outlier. What is likely employment elasticity for a particular sector could be worked out. Therefore, 142
147 modified current weekly status should be followed for assessing employment/unemployment. Dr. A.N. Sharma observed that casual labour migration has increased as corroborated by the study conducted by Institute of Human Development on migration from Bihar. In the assessment of employment/unemployment, unemployment among educated people is going to be a major issue. Employment elasticity of at least two digit level needs to be worked out. We should also identify which are the emerging and productive sectors which can generate more employment. Ms. Amarjeet Kaur indicated that MoLE is a major user of the data. Against the target of 58 million job opportunities set for 11 th Five Year Plan, about 20 million job opportunities have been created as per CDS approach. We need to have introspection into the methodology of estimation. We should see how a projection is made which is closer to the reality. Some attempts should be made to study the quality of employment also. MoLE has decided to get annual survey on employment/unemployment conducted by Labour Bureau. Efforts are being made to fine tune the guidelines by an Expert Group in consultation with NSSO. Shri Ajgoankar stated that in the context of employment/ unemployment quality of employment is very important. Incentives will have to be given for expanding organized sector employment. Similarly, stimulus packages will have to be considered for protecting employment. The problem of educated unemployment is a major issue. Employment needs and education provided need to match. Shri Deshpande pointed out that Indian economy is getting globalised and global economy is facing a lot of fluctuations. Employment is a multidimensional problem. For creating the employment opportunities, skill development programmes should be initiated in PPP mode. A lot of corporate organizations are undertaking a number of training programmes. DG, Labour Bureau observed that while analyzing the assumptions made by this Working Group for the 12 th Five Year Plan, we should also look into the assumptions of the Working Group for 11 th Five Year Plan, so that the former is realistic. A lot of employment opportunity interventions have been made by the Government, which need to be reflected. DG, NSSO stated that for making the projections age specific (upto 25 years, 25+ etc.) sectoral growth will be taken into account. NSSO started on pilot basis periodic labour force survey which will provide information on employment/unemployment on quarterly basis on selected parameters. Shri A.K. Satpathy observed that among the three, we should adopt one of the three approaches explained by the Chairman of the Sub-Group on projection of employment/unemployment. The CDS approach is the most appropriate out of the three 143
148 approaches being discussed. In earlier plans also the CDS approach has been the major focus. Dr. Santosh Mehrotra, Chairman of the second Sub-Group on Creation of Employment Opportunities made a brief presentation. The presentation covered issues like definitions, data sources, relationship between employment and output, providing employment for the marginalized groups and employment implication of economic crises. He pointed out that it may be necessary to shift unskilled labour of agricultural sector to industry and services sector both in informal and formal segments. While this is likely to increase productivity, the progress is slow despite economic growth. However, wages are rising due to various developmental initiatives including MGNREGA. While Gross Value Added (GVA) has increased in certain sectors along with rise in employment, it is not so in case of some other, reflective of jobless growth. In order to tackle the problem of joblessness increasing productive employment in the employmentgenerating services sector like hotels, IT, telecom, transport, financial institutions etc. is equally important. Issues of infrastructure, economics of scale and management are to be addressed for meeting the Chinese challenge. He outlined various macro-economic policy initiatives which need to be taken for having a desirable outcome on employment front. Dr. Papola observed that increasing employment as well as productivity is equally important. The employment elasticity should not be greater than one. One should not be under the illusion of increasing only the export of labour-intensive exports as its share is declining. So production for domestic market as well as expanding employment both in manufacturing and services sector should receive attention. It requires specific sectoral policy intervention. Representative of CII (Ms Neeta Pradhan) stated that the issue of employability is important. Earlier we used to have a lot of data on this but now the same is not forthcoming. Representative of Govt. of Tamil Nadu (Ms Meenakshi) outlined the achievements made by the State Govt. in terms of providing vocational training and guidance which can be replicated in other States. Dr. A.N. Sharma observed that an exercise for occupational groups on job decline and creation is required as there is shortage of manpower in specific occupational groups. It is also necessary to have urban and rural labour market planning for shifting surplus work force from rural areas. However, the option for geographic targeting is limited considering the endowments of different States. Dr. Mitra spoke on the issue of wage productivity linkage. Shri Ajgoankar stated that the problem of jobless growth witnessed during recent times needs to be addressed. Some stimulus needs to be given to private sector for generating employment in specific industries. Labour market information cell need to be established on PPP mode. Labour intensive products may be identified and given priority. 144
149 We have to effectively meet the Chinese challenge as China is trying to get into service sector aggressively. Dr. Deshpande handed over a write-up on the subject. He also mentioned that as youth is getting attracted to services sector, employment intensity of this sector requires necessary attention. The State Governments should be involved in the establishment of Labour Market Information Cell. DG Labour Bureau observed that we may have micro policy interventions. There are a lot of ambiguities at policy level. While amending labour laws the need for enhancing both quality and quantity of employment should be kept in view. There is need for ushering in second generation reforms in the country. The issue of having an exit policy may be looked into. DG, NSSO observed the following: There should be a synergy between the reports of the two Sub-Groups. Certain sectors grow and contribute to GDP and employment. For instance, Tourism sector is making a vital contribution in employment generation. It is driven by market initiatives which should be encouraged. Tourism Ministry has estimated employment generation in their sector. Concluding the discussion on the Report of this Sub-Group the Chairman that observed that we have to consider the ways and means to shift manpower from Agriculture to manufacturing and industrial sector. He requested Dr. Mehrotra to address to this issue in the final report of its Sub-Group. The Chairman of the Working Group requested the Chairmen of both the Sub- Groups to finalize their respective reports in the light of the feed back received. He also observed that the conclusions and recommendations to be given in their reports are very important and they will constitute the basis for finalizing the report of the Working Group. He requested the Chairman of both the Sub-Groups to submit their final report within 8-10 days. The meeting ended with a vote of thanks to the Chair. 145
150 Annexure List of Participants Sl. No Name & Designaton Tele Phone No./ address Office Address Dr. Ashok Sahu, Chairman Planning Commission, New Pr. Adv. (LEM) Delhi-01 Dr. Arup Mitra IEG, Delhi Dr. T.S.Papola ISID New Delhi Shri Alakh N Sharma, IHD, IIPA Building, IP Director (IHD) Estate, New Delhi - 2 Shri J. Dash, jdash@nic.in M/o Statistics & DG,(NSSO) Programme Implementation, Patel Bhawan. New- Delhi-01 Shri B.N. Nanda, DG, Labour Bureau Ms. Amarjeet Kaur, DDG (E) Dr. Santosh Mehrotra, DG, IAMR Dr. C.S.Deshpande, Executive Director, MEDC, Mumbai Shri Anoop K Satpathy Fellow, V.V.GNLI Shri R.M. Ajgaonkar, C.A. Ms. Parisha Singh (for Mr. B.B.Pant) Asstt. Director bnnanda@gmail.com Labour Bureau, M/o Labour & Employment, SCO, 28-31, Sec-17-A, Chandigarh M/o Labour & Employment, Shram Shakti Bhavan santoshmehrotra@nic.in dchandrahas@gmail.com Institutional Area, Sec-A-7, Narela, Delhi-40 MEDC,49 Chavan Centre, Nariman Point, Mumbai Faculty, V.V.GNLI Sector, 24-Noida rajaram@rmjgaonkar.co m aioe@ficci.com parisha@ficci.com mobile of Sh. B.P.Pant, Director FICCI- Mandas, Juhu Road, Juhu, Mumbai-49 FICCI, Fedreation,House, Tansen Mrag, ND Ms. Neeta Pradan CII, 249-F, Udyog Vihar, Sector-18, Phase-4, 146
151 Ms. V. Meenakshi, Jt. Director (Emp.& Trg.), Govt. of Tamil Nadu Shri S.N.Singh, DDG (CPD) NSSO Shri K N Pathak JA (LEM) Shri Kailash Chand, Sr. Research Officer Dr. J S Tomar Sr. Research Officer Dr. Sandeep Misra, Consultant Shri B. Swain, Statistical Officer Gurgaon Office of Directorate of Employment & Training, Guindy, Chennai Govt. of T.N MoSPI, 416,Patel Bhawan, Satyanarain.singh@gmai New-Delhi l.com knpathak@nic.in Planning Commission Planning Commission jeet.iasri@gmail.com Sandeep.misra@nic.in Baidhar.swain@nic.in Planning Commission Planning Commission Planning Commission ********** 147
152 Annexure VIII No. Q-20017/2/2011/LEM/LP Planning Commission (LEM Division) *** Subject: Summary Record of the Third Meeting of Working Group on Employment, Planning & Policy for the Twelfth Five Year Plan ( )-reg. The Third Working Group meeting to discuss Employment, Planning & Policy for the Twelfth Five Year Plan ( ) was held under the Chairmanship of Dr. Ashok Sahu, Pr. Adviser (LEM), Planning Commission on in Yojana Bhawan. The list of participants is given at Annexure-I. Joint Adviser (LEM), Shri K N Pathak welcomed the Chairman and members of the Working Group. He stated that this meeting has been convened after the reports of the two Sub Groups constituted under this Working Group and the salient aspects of the two reports have been synthesized in the draft Working Group Report which has been sent to all members through . To-day s meeting of the Working Group which is the final one will deliberate over the draft report and suggest any additional inputs if required. Before requesting the members to elaborate their views on the Draft report the Joint Adviser requested the Chairman to make his inaugural observations. The Chairman, in his initial remarks acknowledged the contribution made by members of the Working Group; particularly, the Chairmen of the two Sub Groups i.e. Dr. Arup Mitra and Dr. Santosh Mehrotra and in addition, guidance received from Dr.T.S. Papola. He also placed on the record the contribution made by other colleagues including Dr. J S Tomar who has been recently transferred. He also acknowledged the contribution and support of all members of the Working Group and their representative. As some of the members of the Working Group had not received the containing the draft Report which was to be discussed in the meeting for being finalized, the Chairman first indicated the Chapter Scheme and thereafter made a presentation on the Report, copy of which is given at Annexure-II. He also mentioned that in the last meeting of the Steering Committee it was suggested that as the Approach Paper seeks to achieve 9% growth rate which has since been approved by the NDC, our projections should be made on that basis. On our request, Dr. Mitra has made projections accordingly which were circulated as a supplementary note for the Working Group and also incorporated in the Report. 148
153 The Chairman outlined the following chapterization proposed for the Working Group Report: Chapter 1: Introduction Chapter 2: Employment Challenges for the Twelfth Five Year Plan Chapter 3: Major Findings of the Report of Sub-Group on Employment/Unemployment Projections Chapter 4: Major Findings of the Report of Sub-Group for creation of Employment Opportunities Chapter 5: Major Recommendations for the twelfth Five Year Plan DG, NSSO wanted to know the justification for conducting employment/unemployment survey on annual basis. The Chairman observed that conducting employment/unemployment survey at frequent interval is necessary as the Government needs to take mid course remedial measure on the employment front and the time gap between the two quinquinial surveys is too long. The Chairman flagged certain issues for consideration of the Working Group: i) Among different measures available for determining employment/ unemployment such as UPSS, CWS and CDS, whether the Working Group should recommend adoption of any specific measure? ii) Whether employment/ unemployment projections should be made on various alternative scenarios or we should confine to the assumption of only 9% growth rate? iii) Should we also highlight some specific employment related Act/schemes such as MNREGA, and suggest any urban employment generated schemes in the Working Group Report. iv) A lot of professionals are now returning back from abroad which includes skilled, semi-skilled and unskilled persons. Should their interest also be highlighted from employment perspective? v) The results brought by latest NSSO survey about reduced participation of women work force need to be examined meticulously. We need to find out whether our women work force is actually being withdrawn to be put under education or their withdrawal from the work force is not appropriately reflected. Chairman, thereafter, opened the floor for discussion. DG, IAMR observed that there has been an increase in the share of industry and services in total employment, with agriculture s share in employment declining from 56% in to 53% in and the corresponding share of non-agricultural employment increasing from 44% to 47%. While organized manufacturing sector 149
154 employment increased in the first half of 2000 s, it declined in the second half. In the non-agricultural sector, the share of organized employment has increased especially in construction which is a welcome development. Subsequently, he also stated that National Skill Development Corporation has assigned a pilot study to IAMR for survey on manpower skilling in two districts, namely, Singrauli in Madhya Pradesh and Gurdaspur in Punjab. Data reveal that wages are rising as a result of unavailability of workers, especially, unskilled women workers due to MGNREGA. A massive increase has also been observed in participation of women in education. Dr. T.S. Papola stated that employment challenge has to reflect both demand and supply side as well as well as quantitative and qualitative side of the situation. For instance, severely under-employed persons are as good as unemployed. Similarly, working poor looking for alternative job depict a depressing picture. There has been decline in employment in agriculture. Manufacturing sector not generating adequate employment opportunities is another major challenge. As regards approaches such as UPSS, CWS, CDS, etc., it is not a question of giving alternatives for policy makers. While CWS approach has a number of advantages, we have to be clear about which method will serve which purpose. It needs to be indicated. Since Government have decided 9% growth rate for 12 th Plan, the Working Group also has to plan for Labour & Employment Sector accordingly. However, there is no harm in giving other scenarios, but it is important to examine as to what this growth consists of -agriculture, manufacturing, services, etc. We could also have a long term scenario available with us for formulating the perspective plan. Manufacturing sector is important as it helps in increasing employability. Regarding the frequency of employment-unemployment surveys, we need quick survey results for Parliamentarians/ economists, etc. for policy purposes. However, large size NSSO survey is certainly very useful. DG, NSSO observed that in rural area, there are not frequent changes. Hence having employment/ unemployment survey for that sector estimates at frequent intervals may not be necessary. NSSO is planning for a periodic labour force survey in urban areas at quarterly intervals, where the sample size is expected to be substantially higher. He further observed that certain structural changes are being observed; while growth in employment is taking placed on UPS basis, it has declined in Subsidiary Status component. The representative of Government of Madhya Pradesh stated that at the district level the periodicity for data collection can be improved and effort should be made to maintain quality and quantity particularly at lower level. ITIs are by and large lacking quality. To make the skilled work force marketable the certification aspect needs to be given due consideration. 150
155 The representative of Khadi & Village Industries observed that production activity under KVI should also be tied up with MNREGA to ensure continuity of the latter. Under Prime Minister s Employment Guarantee Programme, the workers and entrepreneurs belonging to weaker sections are facing problems, particularly regarding collateral security and they are not getting due encouragement from banks. Hence, budgetary support should be considered in this regard. Workers and entrepreneurs taking up local production under KVI through cluster approach has proved to be very useful. The case of District Hissar in Haryana regarding manufacturing and marketing of wooden beads is an example in this regard. Labour laws have to be made flexible and part time employment should be segregated from full time employment as both have different implications. Dr A. N. Sharma stated that in developed countries, employment-unemployment survey is conducted on quarterly or monthly basis. In India also we need to strengthen our system of such surveys. Employment/unemployment survey can be done on annual but selective basis. While such a survey in urban areas will be very useful, it may not have such relevance in case of rural/ agricultural labourers. He also observed that through the survey the efforts should also be made to collect the data regarding structural shift taking place in favour of agro-based industries, construction sector, etc. Agriculture can hardly improve the employment scenario. Hence shift from agriculture to non-agriculture is necessary. There is shortage of labour even in States like Bihar due to MGNREGA. Workers are looking for alternate avenues of work for obtaining better wages. The Government should therefore, concentrate on funding programmes like BRGF, etc. which can be done on a mission mode. We should have innovative thinking on how to improve organizational capacity. Government employment generation programmes, therefore, should be operated on a mission mode having due linkages with infrastructure. Formalization of the informal sector will help in resolving the problem of educated unemployment. The Working Group should focus on 5 to 6 important recommendations. Shri Kanagasabapathy stated that frequent employment-unemployment surveys are necessary in view of structural changes taking place in respect of both output and employment. Manufacturing, non-farm and micro sectors should be given priority attention. Participation of women workers is also an important issue since as per UNDP report, India is behind many of its South Asian neighbours, like Bangladesh, Pakistan, Srilanka, etc. It is necessary for this Working Group to have some employment target. It would also help in recommending the interventions required for achieving a particular level of employment. There should also be some focus on tourism sector. The representative of CII observed that frequent updation of data on employmentunemployment is necessary for raising the conscience level of global and domestic investors. There is need to make the manufacturing sector more attractive through skill 151
156 development, upgradation of ITIs etc. It is necessary to observe structural change taking place in the economy and prescribe qualification framework. Dr. Deshpande stated that the views of CII need to be supported. We should consider updating employment data as frequently as desirable and feasible and make them internationally comparable. In order to achieve higher growth rate in manufacturing, the National Manufacturing Policy has identified four labour intensive sectors like textiles, food processing, leather and gems & jewellary. There has been considerable expansion in construction sector. Shri Ajgaonkar observed that there should be emphasis on service sector which would constitute about 50% of our GDP. Productivity is important but it may not solve the problem. Government should play the role of a facilitator. The incentives for private sector to increase employment also need to be considered as it is likely to give a big push to employment. Withdrawal of incentives to private sector, therefore, may be detrimental. Spreading awareness about various Governmental schemes and addressing the issue of women s employment are important. The representative of Government of Bihar observed that Bihar constitutes about one-tenth of the total population of the country. However, it does not have any good industry and the State is without adequate mineral resources. The State often faces either flood in some parts or drought in other. Participation of girls in education is rising but employment opportunities for youth in the State has not grown. Agriculture sector is overburdened. Planning Commission is considering 9% growth rate for the 12 th Plan. It can be achieved through balanced regional development. To make Bihar a partner in the process of national development, special assistance to Bihar through a package seems to be necessary. The representative of Government of Tamil Nadu stated that while many people are waiting for jobs in different industries, there is lack of information which is adversely affecting employability. Therefore, the State has converted all employment exchanges into employment facilitation centres. Training is being imparted to needy persons for filling up vacancies in industries with the help of private sector. The State Government is providing financial assistance to the industry for training the candidates. Mobility from vocational education to mainstream education is an important issue to be considered. For all technical education, ITIs should be the entry level. The representative of VVGNLI stated that estimating working poor is a challenging task as poverty line is being redrawn on the basis of latest NSS results. Various studies have pointed out limitations in the implementation of various 152
157 employment-related schemes like MGNREGA. Service sector is an important source of employment. The issue of productivity also requires attention. Shri S.N. Singh, DDG, NSSO observed that the best way of measuring employment should be indicated and the merits and demerits of three approaches should also be outlined. DG, Labour Bureau stated that the divergent views may be put across each other. The three approaches, i.e. UPSS, CWS and CDS are complementary to each other and not contradictory. We should not stick to one approach. It would be a retrograde step not to suggest annual survey of employment and unemployment. The Chief Economic Adviser, in one of his Papers, has also observed that assessing employmentunemployment at an interval of 5 years is a long gap. The active age-group identified for employment should be and not 59. Showing housewives as non-workers is another major mistake. Private sector participation in skill development should substantially increase. There is no substitute to MGNREGA, but it should both generate income and create assets. The issue of both quality and quantity in terms of analysis of employment and unemployment data is very important. Before concluding the meeting, Chairman requested Dr. Papola to give further observations also taking into account the views expressed by the Members. Dr. Papola suggested the following: (i) (ii) (iii) (iv) (v) (vi) (vii) Our recommendations should be sector-specific. In the Report, reference should also be made to National Employment Policy which has indicated sector-wise employment strategy. We may indicate employment targets as about 21 million new employment opportunities every year have to be created. A more important challenge is to increase the levels of both income and productivity. There has been considerable employment generation in construction sector. Growth of output in construction has been on account of 70% increase in employment and 30% increase in productivity. For urban areas, we perhaps do not need MGNREGA type scheme at this stage, as the nature of jobs required for urban areas is very different from those in rural areas. We need to strengthen self employment and entrepreneurship programmes as it will go a long way in resolving educated and youth unemployment problem. The Working Group should give information by following all concepts while stating what use a particular concept will have. 153
158 (viii) Regarding the women workers, efforts should be made to examine agespecific, sex-specific data. Withdrawal of girls in the age group 5-15 from work may be because they have decided to go to school. This could be verified from enrolment data of the school. It is also observed that in recent years, the share of women in organized sector has increased. It may be examined as to which sectors have employed more women in recent years. We have one example with us, namely, KVI has engaged about 95% women workers. In his concluding remarks, the Chairman stated that the draft Report of the Working Group broadly seems to be in order and will be submitted after slightly restructuring it in the light of today s deliberation. He once again thanked the Chairmen of both Sub Groups and Members of the Working Group and Sub Groups and officials of LEM Division for their interest and contribution. The meeting ended with thanks to the Chair. 154
159 Annexure-I List of Participants Sl. No. Name & Designaton Tele Phone No./ address Office Address 1. Dr. Ashok Sahu, Pr. Adv. (LEM) Chairman 2. Dr. T.S.Papola Planning Commission, New Delhi-01 ISID New Delhi 3. Shri Alakh N Sharma, Director (IHD) 4. Shri J. Dash, DG,(NSSO) 5. Shri B.N. Nanda, DG, Labour Bureau 6. Dr. Santosh Mehrotra, DG, IAMR 7. Shri A. S. Bhagat Joint Secretary Deptt. of Labour & Employment Govt. of Gujrat 8. S. A. Pandav Joint Director 9. Dr. C.S.Deshpande, Executive Director, MEDC, Mumbai 10. Shri Anoop K Satpathy Fellow, V.V.GNLI IHD, IIPA Building, IP Estate, New Delhi - 2 jdash@nic.in M/o Statistics & Programme Implementation, Patel Bhawan. New- Delhi bnnanda@gmail.com santosh.mehrotra@nic.in Su_pandav@yahoo.co.in dchandrahas@gmail.com Labour Bureau, M/o Labour & Employment, SCO, 28-31, Sec-17-A, Chandigarh Institutional Area, Sec-A-7, Narela, Delhi-40 Directorate of Employment & Training Govt. of Gujrat MEDC,49 Chavan Centre, Nariman Point, Mumbai Faculty, V.V.GNLI Sector, 24-Noida 155
160 11. Shri R.M. Ajgaonkar, C.A. 12. Shri S.N.Singh, DDG (CPD) NSSO m Mandas, Juhu Road, Juhu, Mumbai-49 MoSPI, 416,Patel Bhawan, New- Delhi 13. ShriNareshPal, Multi Disciplinary Training Centre, Khadi & Village Industry Commission Zonal Office, MDTC, Rajghat New Delhi 14. Neeta Pradhan Das, CII F, Udyog Vihar, Sector18, PhaseIV, Gurgaon. 15. Shri D.M.Jha,Director, Employment & Training, Govt. of Bihar 16. Shri, Sanjay Singh, Principal Secretary, Technical Education & Skill Development Govt. of Madhya Pradesh 17. Shri R.Rajkumar Deptt of Employment & Training, Govt. of Tamil Nadu 18. Shri K N Pathak JA (LEM) 19. Shri Kailash Chand, Sr. Research Officer 20. Dr. J S Tomar Dy DirectorCSO, M/o Statistics &Programme Implementation 21. Dr. Sandeep Misra, Consultant 22. Shri B. Swain, Statistical Officer singh@mp.gov.in Vikash Bhawan, Patna Mantralaya, Ballabh Bhawan Bhopal knpathak@nic.in Planning Commission Planning Commission jeet.iasri@gmail.com 9 th floor, Jeevan Prakash Building, Kasturba Gandhi Marg, New Delhi Sandeep.misra@nic.in Planning Commission Baidhar.swain@nic.in Planning Commission 156

161 Annexure-II 157
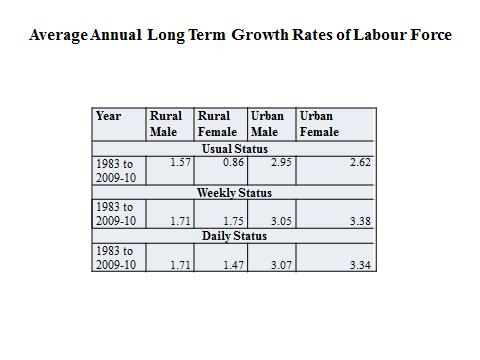
162 158
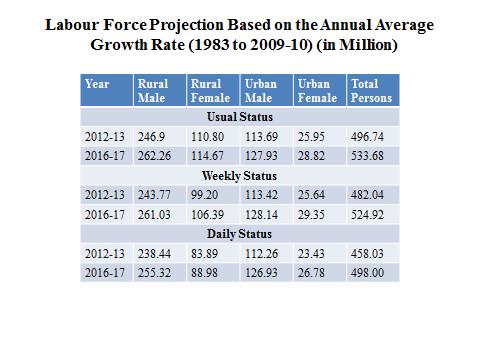

163 159
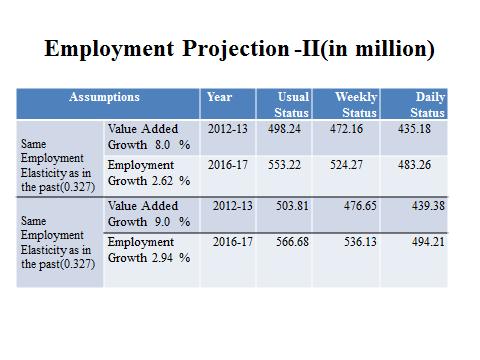

164 160
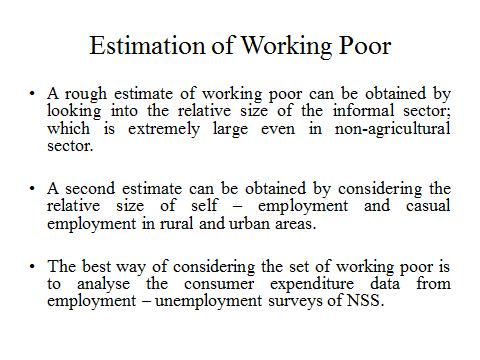

165 161

166 162


167 163
168 164
Employment Growth in India: Some Major Dimensions
 Employment Growth in India: Some Major Dimensions REENA BALIYAN, Ph.D., Department of Economics, C.C.S.University, Meerut Abstract: A sizeable alleviation in poverty in India is possible only if employment
Labour Market Performance and the Challenges of Creating Employment in India
 Labour Market Performance and the Challenges of Creating Employment in India Paper Presented at the Expert Group Meeting on The Challenges of Building Employment for a Sustainable Recovery Organized by
The Indian Labour Market : An Overview
 The Indian Labour Market : An Overview Arup Mitra Institute of Economic Growth Delhi University Enclave Delhi-110007 e-mail:arup@iegindia.org fax:91-11-27667410 1. Introduction The concept of pro-poor
Chapter 12 LABOUR AND EMPLOYMENT
 Chapter 12 LABOUR AND EMPLOYMENT INTRODUCTION No doubt Punjab has made tremendous progress since independence and has been a leading state in per capita income and food production in the country. However,
Creating Jobs in Manufacturing
 Creating Jobs in Bishwanath Goldar Institute of Economic Growth, Delhi For the 70-80 million youth who will enter the labour market in the next ten years, the creation of a large number of industrial jobs
STRUCTURAL CHANGES IN RURAL LABOUR MARKET AND EMPLOYMENT IN POST REFORM INDIA
 Research Paper IC Value 2016 : 61.33 SJIF Impact Factor(2017) : 7.144 ISI Impact Factor (2013): 1.259(Dubai) UGC J No :47335 Volume - 6, Issue- 1,January 2018 e-issn : 2347-9671 p- ISSN : 2349-0187 EPRA
Creating Employment in the Twelfth Five-Year Plan
 Creating Employment in the Twelfth Five-Year Plan Santosh Mehrotra, Ankita Gandhi, Bimal Kishore Sahoo, Partha Saha This paper analyses employment trends and addresses the problem of creating decent and
BEST PRACTICES ON LABOUR MARKET INFORMATION IN INDIA. Debasish Chaudhuri, Deputy Director General, Ministry of Labour and Employment
 BEST PRACTICES ON LABOUR MARKET INFORMATION IN INDIA Debasish Chaudhuri, Deputy Director General, Ministry of Labour and Employment 1 Labour & Employment Statistics as components of Labour Market Information
Employment Perspective and Labour Policy
 Employment Perspective and Labour Policy 63 4 Employment Perspective and Labour Policy 4.1. The generation of productive and gainful employment, with decent working conditions, on a sufficient scale to
Survey on MGNREGA. (July 2009 June 2011) Report 2. (Preliminary Report based on Visits 1, 2 and 3)
 Report 2. (Preliminary Report based on Visits 1, 2 and 3)") Survey on MGNREGA (July 2009 June 2011) Report 2 (Preliminary Report based on Visits 1, 2 and 3) National Sample Survey Office Ministry Statistics & Programme Implementation Government India March 2012
Survey on MGNREGA (July 2009 June 2011) Report 2 (Preliminary Report based on Visits 1, 2 and 3) National Sample Survey Office Ministry Statistics & Programme Implementation Government India March 2012
Employment and Unemployment Scenario of Jammu and Kashmir
 2015 IJSRST Volume 1 Issue 3 Print ISSN: 2395-6011 Online ISSN: 2395-602X Themed Section: Science Employment and Unemployment Scenario of Jammu and Kashmir Aasif Hussain Nengroo Assistant Professor Department
Building knowledge base on Population Ageing in India Working paper: 4
 Building knowledge base on Population Ageing in India Working paper: 4 Elderly Workforce Participation, Wage Differentials and Contribution to Household Income Sakthivel Selvaraj Anup Karan S. Madheswaran
IJPSS Volume 2, Issue 6 ISSN:
 Liberalisation and Job Creation in Unorganised Manufacturing Sector of India Dr. Neeru Garg* _ Abstract: The unorganised manufacturing sector has been a major sector in the Indian economy, which provides
The Indian Labour Market: An Overview
 The Indian Labour Market: An Overview Arup Mitra Arup Mitra (arup@iegindia.org) is a professor at the Institute of Economic Growth, Delhi. He completed his PhD in economics from Delhi School of Economics.
Demographic Dividend in India - An Overview
 Continuous issue-15 September- December 2015 Demographic Dividend in India - An Overview Abstract: This article elucidates full definition of demographic dividend, and how can India get maximum benefit
Monitoring the Performance
 Monitoring the Performance of the South African Labour Market An overview of the Sector from 2014 Quarter 1 to 2017 Quarter 1 Factsheet 19 November 2017 South Africa s Sector Government broadly defined
Kathmandu, Nepal, September 23-26, 2009
 Session Number: Session 8b (Parallel) Time: Friday, September 25, 14:00-15:30 Paper Prepared for the Special IARIW-SAIM Conference on Measuring the Informal Economy in Developing Countries Kathmandu, Nepal,
Employment Trends in India: A Fresh Look at Past Trends and Recent Evidence (Works in Progress, Please Do Not Quote) Himanshu
 Himanshu") Employment Trends in India: A Fresh Look at Past Trends and Recent Evidence (Works in Progress, Please Do Not Quote) Himanshu Fellow, Centre de Sciences Humaines, New Delhi 1 Introduction Results of the
Employment Trends in India: A Fresh Look at Past Trends and Recent Evidence (Works in Progress, Please Do Not Quote) Himanshu Fellow, Centre de Sciences Humaines, New Delhi 1 Introduction Results of the
Growth of Unorganized Manufacturing Sector in India Analysis of National Sample Survey Studies
 IOSR Journal of Business and Management (IOSR-JBM) e-issn: 2278-487X, p-issn: 2319-7668. Volume 18, Issue 11. Ver. II (November. 2016), PP 01-07 www.iosrjournals.org Growth of Unorganized Manufacturing
NSS Employment Surveys; Problems with comparisons over time
 NSS Employment Surveys; Problems with comparisons over time Amit Thorat Right after independence the policy makers of the country felt an urgent need for information on the nation s status with regard
Employment and Inequalities
 Employment and Inequalities Preet Rustagi Professor, IHD, New Delhi. Round Table on Addressing Economic Inequality in India Bengaluru, 8 th January 2015 Introduction the context Impressive GDP growth over
Trends and Structure of Employment and Productivity in Unorganized Manufacturing Sector of India in Post-reform Period
 Trends and Structure of Employment and Productivity in Unorganized Manufacturing Secr of India in Post-reform Period Anupama Uppal (Punjabi University, India) Paper prepared for the 34 th IARIW General
2000 HOUSING AND POPULATION CENSUS
 Ministry of Finance and Economic Development CENTRAL STATISTICS OFFICE 2000 HOUSING AND POPULATION CENSUS REPUBLIC OF MAURITIUS ANALYSIS REPORT VOLUME VIII - ECONOMIC ACTIVITY CHARACTERISTICS June 2005
EMPLOYMENT PLAN 2014 INDIA
 EMPLOYMENT PLAN 2014 INDIA Employment Plan 2014 2 CONTENTS 1. Employment and labour market outlook 2. Employment challenges for 3. Current policy settings and new commitments 4. Monitoring of commitments
UNCTAD S LDCs REPORT 2013 Growth with Employment for Inclusive & Sustainable Development
 UNCTAD S LDCs REPORT 2013 Growth with Employment for Inclusive & Sustainable Development Media briefing on the Occasion of the Global Launch Dhaka: 20 November 2013 Outline q q q q q q q Information on
MAIN FINDINGS OF THE DECENT WORK COUNTRY PROFILE ZAMBIA. 31 January 2013 Launch of the Decent Work Country Profile
 MAIN FINDINGS OF THE DECENT WORK COUNTRY PROFILE ZAMBIA Griffin Nyirongo Griffin Nyirongo 31 January 2013 Launch of the Decent Work Country Profile OUTLINE 1. Introduction What is decent work and DW Profile
Monitoring the Performance of the South African Labour Market
 Monitoring the Performance of the South African Labour Market An overview of the South African labour market for the Year Ending 2016 14 July 2016 Contents Recent labour market trends... 2 A labour market
Surveys on Informal Sector: Objectives, Method of Data Collection, Adequacy of the Procedure and Survey Findings
 Surveys on Informal Sector: Objectives, Method of Data Collection, Adequacy of the Procedure and Survey Findings 1. Introduction 1.1 The term informal sector has been debated much in the recent past at
The Thirteenth International Conference of Labour Statisticians.
 Resolution concerning statistics of the economically active population, employment, unemployment and underemployment, adopted by the Thirteenth International Conference of Labour Statisticians (October
Labour. Overview Latin America and the Caribbean. Executive Summary. ILO Regional Office for Latin America and the Caribbean
 2017 Labour Overview Latin America and the Caribbean Executive Summary ILO Regional Office for Latin America and the Caribbean Executive Summary ILO Regional Office for Latin America and the Caribbean
ESSAYS ON INVESTMENT AND GROWTH IN INFORMAL ECONOMY
 ESSAYS ON INVESTMENT AND GROWTH IN INFORMAL ECONOMY A THESIS SUBMITTED IN PARTIAL FULFILLMENT OF THE REQUIREMENTS FOR THE FELLOW PROGRAMME IN MANAGEMENT INDIAN INSTITUTE OF MANAGEMENT INDORE By Rima Mondal
Progress Evaluation of the Transformation of China's Economic Growth Pattern 1 (Preliminary Draft Please do not quote)
") Progress Evaluation of the Transformation of China's Economic Growth Pattern 1 (Preliminary Draft Please do not quote) Si Joong Kim 2 China has been attempting to transform its strategy of economic
Progress Evaluation of the Transformation of China's Economic Growth Pattern 1 (Preliminary Draft Please do not quote) Si Joong Kim 2 China has been attempting to transform its strategy of economic
Aging in India: Its Socioeconomic. Implications
 Aging in India: Its Socioeconomic and Health Implications By the year 2000, India is likely to rank second to China in the absolute numbers of its elderly population By H.B. Chanana and P.P. Talwar* The
MEASUREMENT OF EMPLOYMENT AND UNEMPLOYMENT IN INDIA: SOME ISSUES
 MEASUREMENT OF EMPLOYMENT AND UNEMPLOYMENT IN INDIA: SOME ISSUES K. SUNDARAM* CENTRE FOR DEVELOPMENT ECONOMICS DELHI SCHOOL OF ECONOMICS UNIVERSITY OF DELHI DELHI 110007 (NOVEMBER 2008) * Retired Professor,
Potential Output in Denmark
 43 Potential Output in Denmark Asger Lau Andersen and Morten Hedegaard Rasmussen, Economics 1 INTRODUCTION AND SUMMARY The concepts of potential output and output gap are among the most widely used concepts
The Changing Nature of the Labour Market in Australia in 2014
 The Changing Nature of the Labour Market in Australia in 2014 Dr Tony Stokes and Dr Sarah Wright Australian Catholic University In the last decade the Australian Labour Market has gone through a period
Labour. Overview Latin America and the Caribbean EXECUT I V E S U M M A R Y
 2016 Labour Overview Latin America and the Caribbean EXECUT I V E S U M M A R Y ILO Regional Office for Latin America and the Caribbean 3 ILO / Latin America and the Caribbean Foreword FOREWORD This 2016
Women and Men in the Informal Economy: A Statistical Brief
 Women and Men in the Informal Economy: A Statistical Brief Florence Bonnet, Joann Vanek and Martha Chen January 2019 Women and Men in the Informal Economy: A Statistical Brief Publication date: January,
The Province of Prince Edward Island Employment Trends and Data Poverty Reduction Action Plan Backgrounder
 The Province of Prince Edward Island Employment Trends and Data Poverty Reduction Action Plan Backgrounder 5/17/2018 www.princeedwardisland.ca/poverty-reduction $000's Poverty Reduction Action Plan Backgrounder:
Monitoring the Performance of the South African Labour Market
 Monitoring the Performance of the South African Labour Market An overview of the South African labour market from 3 of 2010 to of 2011 September 2011 Contents Recent labour market trends... 2 A brief labour
Date: Dear Sir,
 Date: 10-12-2011 To Dr. Manmohan Singh, Hon ble Prime Minister of India, Room No. 152, South Block, New Delhi. THROUGH THE KIND FAVOUR OF HIS EXCELLENCY, GOVERNOR OF KARNATAKA, FORWARDED TO THE HONOURABLE
Monitoring the Performance of the South African Labour Market
 Monitoring the Performance of the South African Labour Market An overview of the South African labour market for the Year ending 2011 5 May 2012 Contents Recent labour market trends... 2 A labour market
Women s economic empowerment in the changing world of work:
 Women s economic empowerment in the changing world of work: Reflections from South Asia Jayati Ghosh For UN-ESCAP Bangkok 23 February 2017 Gender discrimination has been crucial for growth in Asian region,
ECONOMIC GROWTH AND INFORMAL SECTOR
 ECONOMIC GROWTH AND INFORMAL SECTOR DR. NASEEM M. SHAIKH Associate professor AKI s Poona college of Arts Science & Commerce, Pune (MS) INDIA BEAUTY PANKAJ KALITA Research Scholar, AKI s Poona college of
EXTERNAL SECTOR PROJECTIONS FOR TENTH FIVE YEAR PLAN
 Working Paper Series Paper No. /2002-PC EXTERNAL SECTOR PROJECTIONS FOR TENTH FIVE YEAR PLAN ARCHANA S. MATHUR M.R. VERMA PERSPECTIVE PLANNING DIVISION PLANNING COMMISSION GOVERNMENT OF INDIA MARCH 2002
GLOBAL EMPLOYMENT TRENDS 2014
 Executive summary GLOBAL EMPLOYMENT TRENDS 2014 006.65 0.887983 +1.922523006.62-0.657987 +1.987523006.82-006.65 +1.987523006.60 +1.0075230.887984 +1.987523006.64 0.887985 0.327987 +1.987523006.59-0.807987
Executive summary WORLD EMPLOYMENT SOCIAL OUTLOOK
 Executive summary WORLD EMPLOYMENT SOCIAL OUTLOOK TRENDS 2018 Global economic growth has rebounded and is expected to remain stable but low Global economic growth increased to 3.6 per cent in 2017, after
Informal Economy and Social Security Two Major Initiatives in India
 Informal Economy and Social Security Two Major Initiatives in India K.P. Kannan Member National Commission for Enterprises in the Unorganised Sector Government of India, New Delhi While India has embarked
Monitoring the Performance of the South African Labour Market
 Monitoring the Performance of the South African Labour Market An overview of the South African labour market for the Year Ending 2012 6 June 2012 Contents Recent labour market trends... 2 A labour market
Structure and Dynamics of Labour Market in Bangladesh
 A SEMINAR PAPER ON Structure and Dynamics of Labour Market in Bangladesh Course title: Seminar Course code: AEC 598 Summer, 2018 SUBMITTED TO Course Instructors 1.Dr. Mizanur Rahman Professor BSMRAU, Gazipur
Mixed picture for Indonesia s garment sector
 Indonesia Garment and Footwear Sector Bulletin Issue I September 2017 Mixed picture for Indonesia s garment sector By Richard Horne and Marina Cruz de Andrade Regional Office for Asia and the Pacific horne@ilo.org
List of NSSO Data CDs Available in Data Bank
 List of NSSO Data CDs Available in Data Bank Sl. NSSO Round Title Contents Location / CD No. 1 NSS Round 38 th (1.0) Household Consumption Expenditure CD348 2 NSS Round 38 th (10) CD349 3 NSS Round 42nd
The Danish labour market System 1. European Commissions report 2002 on Denmark
 Arbejdsmarkedsudvalget AMU alm. del - Bilag 95 Offentligt 1 The Danish labour market System 1. European Commissions report 2002 on Denmark In 2002 the EU Commission made a joint report on adequate and
LABOUR MARKET SEGMENTATION IN INDIA Role of Regulation and Reforms
 LABOUR MARKET SEGMENTATION IN INDIA Role of Regulation and Reforms T.S. Papola ICSSR National Fellow and Honorary Professor, ISID, New Delhi Presentation at the Research Workshop on Employment Quality
FUNCTIONS AND STRUCTURE OF THE PLANNING COMMISSION ( IN BRIEF )
") FUNCTIONS AND STRUCTURE OF THE PLANNING COMMISSION ( IN BRIEF ) Planning Commission was set up in March, 1950. A copy of the Resolution of Government of India has been given in Unit I of this document.
FUNCTIONS AND STRUCTURE OF THE PLANNING COMMISSION ( IN BRIEF ) Planning Commission was set up in March, 1950. A copy of the Resolution of Government of India has been given in Unit I of this document.
Economic Update 9/2016
 Economic Update 9/ Date of issue: 10 October Central Bank of Malta, Address Pjazza Kastilja Valletta VLT 1060 Malta Telephone (+356) 2550 0000 Fax (+356) 2550 2500 Website https://www.centralbankmalta.org
Labour Market Tendencies in India and Brazil
 Labour Market Tendencies in India and Brazil Maria Cristina Cacciamali. University of São Paulo Understanding Inequality in Brazil and India Workshop supported by IDRC Jawaharlal Nehru University, New
ECONOMIC POLICIES, GROWTH AND STRUCTURAL CHANGE OF INDIA B. A. PRAKASH
 ECONOMIC POLICIES, GROWTH AND STRUCTURAL CHANGE OF INDIA B. A. PRAKASH Chairman, Fifth State Finance Commission December 6, 2017 Objectives Examine the economic policies prior and after liberalisation
Recommendation for a COUNCIL RECOMMENDATION. on the 2017 National Reform Programme of Germany
 EUROPEAN COMMISSION Brussels, 22.5.2017 COM(2017) 505 final Recommendation for a COUNCIL RECOMMENDATION on the 2017 National Reform Programme of Germany and delivering a Council opinion on the 2017 Stability
Trends of Household Income Disparity in Hong Kong. Executive Summary
 Trends of Household Income Disparity in Hong Kong Executive Summary Income disparity is one of the major concerns of the society. A very wide income disparity may lead to social instability. The Bauhinia
World Economic Situation and Prospects asdf
 World Economic Situation and Prospects 2019 asdf United Nations New York, 2019 South Asia GDP Growth 8.0 8.0% 6.1 6.0% 6.6 4.8 4.0% total 5.6 5.4 per capita 4.4 4.1 5.9 4.7 projected 2.0% 2016 2017 2018
Monitoring the Performance of the South African Labour Market
 Monitoring the Performance of the South African Labour Market An overview of the South African labour market from 1 of 2009 to of 2010 August 2010 Contents Recent labour market trends... 2 A brief labour
April 2011 CENTRE FOR LIVING STANDARDS. CSLS Research Report i. Christopher Ross THE STUDY OF
 April 2011 111 Sparks Street, Suite 500 Ottawa, Ontario K1P 5B5 613-233-8891, Fax 613-233-8250 csls@csls.ca CENTRE FOR THE STUDY OF LIVING STANDARDS An Analysis of Alberta s Productivity, 1997-2007: Falling
Maharashtra State Development Report. xviii
 Tables Table 1.1: Growth rates in State Domestic Product in the Eighth and Ninth Plans and those Targeted in the Tenth Plan... 1 Table 1.2: Trends in Rates of Growth in Gross State Domestic Product at
Trade and Development
 Trade and Development Table of Contents 2.2 Growth theory revisited a) Post Keynesian Growth Theory the Harrod Domar Growth Model b) Structural Change Models the Lewis Model c) Neoclassical Growth Theory
Structural Changes in the Maltese Economy
 Structural Changes in the Maltese Economy Dr. Aaron George Grech Modelling and Research Department, Central Bank of Malta, Castille Place, Valletta, Malta Email: grechga@centralbankmalta.org Doi:10.5901/mjss.2015.v6n5p423
Examples of active labour market policies
 Examples of active labour market policies Celine Peyron Bista 20 October 2015 Malacca Unemployment Protection Course, Module 1.2 Content of the presentation The difference between active and passive policies
Working Paper No Accounting for the unemployment decrease in Australia. William Mitchell 1. April 2005
 Working Paper No. 05-04 Accounting for the unemployment decrease in Australia William Mitchell 1 April 2005 Centre of Full Employment and Equity The University of Newcastle, Callaghan NSW 2308, Australia
Introduction. Poverty
 Unit 4 Poverty Introduction In previous chapters, you have studied the economic policies that India has taken in the last five and a half decades and the outcome of these policies with relation to the
Indian Surveys on Organised and Unorganised
 Indian Surveys on Organised and Unorganised Sectors Measuring Entrepreneurship from a Gender Perspective H. Borah Deputy Director General Central Statistics Office Ministry of Statistics and Programme
Tracking Poverty through Panel Data: Rural Poverty in India
 Tracking Poverty through Panel Data: Rural Poverty in India 1970-1998 Shashanka Bhide and Aasha Kapur Mehta 1 1. Introduction The distinction between transitory and chronic poverty has been highlighted
Threats to Inclusive Growth in India: Unemployment and Informal Sector
 MPRA Munich Personal RePEc Archive Threats to Inclusive Growth in India: Unemployment and Informal Sector Avnesh Kumar Gupta World Forum for Economists 15 January 2016 Online at https://mpra.ub.uni-muenchen.de/80040/
Demographic Situation: Jamaica
 Policy Brief: Examining the Lifecycle Deficit in Jamaica and Argentina Maurice Harris, Planning Institute of Jamaica Pablo Comelatto, CENEP-Centro de Estudios de Población, Buenos Aires, Argentina Studying
Economic UpdatE JUnE 2016
 Economic Update June Date of issue: 30 June Central Bank of Malta, Address Pjazza Kastilja Valletta VLT 1060 Malta Telephone (+356) 2550 0000 Fax (+356) 2550 2500 Website https://www.centralbankmalta.org
MAHATMA GANDHI NATIONAL RURAL EMPLOYMENT GUARANTEE ACT (MGNREGA): A TOOL FOR EMPLOYMENT GENERATION
: A TOOL FOR EMPLOYMENT GENERATION") DOI: 10.3126/ijssm.v3i4.15974 Research Article MAHATMA GANDHI NATIONAL RURAL EMPLOYMENT GUARANTEE ACT (MGNREGA): A TOOL FOR EMPLOYMENT GENERATION Lamaan Sami* and Anas Khan Department of Commerce, Aligarh
DOI: 10.3126/ijssm.v3i4.15974 Research Article MAHATMA GANDHI NATIONAL RURAL EMPLOYMENT GUARANTEE ACT (MGNREGA): A TOOL FOR EMPLOYMENT GENERATION Lamaan Sami* and Anas Khan Department of Commerce, Aligarh
ILO World of Work Report 2013: EU Snapshot
 Greece Spain Ireland Poland Belgium Portugal Eurozone France Slovenia EU-27 Cyprus Denmark Netherlands Italy Bulgaria Slovakia Romania Lithuania Latvia Czech Republic Estonia Finland United Kingdom Sweden
Trends and Structure of Employment and Productivity in Unorganized Manufacturing Sector of India in Post-reform Period
 Trends and Structure of Employment and Productivity in Unorganized Manufacturing Sector of India in Post-reform Period Author: Anupama Uppal Discussant: Deb Kusum Das Summary Introduction Data and Method
Retrospect and Prospects. Secretary Ministry of Planning and Development Government of Pakistan
 1 st ADB-Asia Pacific Think Tank Forum Beijing, 30-31 October, 2013 Inclusive Growth in Asia: Pakistan s s Experience Retrospect and Prospects Secretary Ministry of Planning and Development Government
PAPER NO. 3/2005 Recent Trends in Employment Creation
 PAPER NO. 3/2005 Recent Trends in Employment Creation Manpower Research and Statistics Department Singapore October 2005 COPYRIGHT NOTICE Brief extracts from the report may be reproduced for non-commercial
THE GROWTH RATE OF GNP AND ITS IMPLICATIONS FOR MONETARY POLICY. Remarks by. Emmett J. Rice. Member. Board of Governors of the Federal Reserve System
 THE GROWTH RATE OF GNP AND ITS IMPLICATIONS FOR MONETARY POLICY Remarks by Emmett J. Rice Member Board of Governors of the Federal Reserve System before The Financial Executive Institute Chicago, Illinois
Economic Impacts of a Universal Pension in Bangladesh
 Issue No No 1 1 PATHWAYS PERSPECTIVES on social policy in international development Issue No 17 Economic Impacts of a Universal Pension in Bangladesh Bazlul H Khondker Do social protection schemes generate
Economic activity framework
 CHAPTER 7 LABOR MARKET ACTIVITIES Background Economic activity and employment are shaped by many factors, including the size of the ing-age, educational and skill level of the labor force, and availability
Social Security Provisioning in Bihar: A Case for Universal Old Age Pension
 Social Security Provisioning in Bihar: A Case for Universal Old Age Pension First Author: Dr. Manjur Ali (Research Officer) Second Author: Nilachala Acharya Authors Organisation: Centre for Budget and
AGRICULTURAL POLICY DIALOGUE SERIES #10. Unemployment Threatens Democracy in Iraq
 AGRICULTURAL POLICY DIALOGUE SERIES #10 Unemployment Threatens Democracy in Iraq January, 2011 This publication was produced for review by the United States Agency for International Development. It was
THE RESOURCES BOOM AND MACROECONOMIC POLICY IN AUSTRALIA
 THE RESOURCES BOOM AND MACROECONOMIC POLICY IN AUSTRALIA Australian Economic Report: Number 1 Bob Gregory Peter Sheehan Centre for Strategic Economic Studies Victoria University Melbourne November 2011
Structural changes in the Maltese economy
 Structural changes in the Maltese economy Article published in the Annual Report 2014, pp. 72-76 BOX 4: STRUCTURAL CHANGES IN THE MALTESE ECONOMY 1 Since the global recession that took hold around the
2
 1. Foreword Oxfam, as an international poverty alleviation organisation, has been working to realise the United Nations Sustainable Development Goals (SDGs), end extreme poverty, and tackle inequality
2005 National Strategy Report on Adequate and Sustainable Pensions; Estonia
 2005 National Strategy Report on Adequate and Sustainable Pensions; Estonia Tallinn July 2005 CONTENTS 1. PREFACE...2 2. INTRODUCTION...3 2.1. General socio-economic background...3 2.2. Population...3
CHAPTER 03. A Modern and. Pensions System
 CHAPTER 03 A Modern and Sustainable Pensions System 24 Introduction 3.1 A key objective of pension policy design is to ensure the sustainability of the system over the longer term. Financial sustainability
Economic Projections for
 Economic Projections for 2015-2017 Article published in the Quarterly Review 2015:3, pp. 86-91 7. ECONOMIC PROJECTIONS FOR 2015-2017 Outlook for the Maltese economy 1 The Bank s latest macroeconomic projections
April An Analysis of Saskatchewan s Productivity, : Capital Intensity Growth Drives Strong Labour Productivity Performance CENTRE FOR
 April 2011 111 Sparks Street, Suite 500 Ottawa, Ontario K1P 5B5 613-233-8891, Fax 613-233-8250 csls@csls.ca CENTRE FOR THE STUDY OF LIVING STANDARDS An Analysis of Saskatchewan s Productivity, 1997-2007:
SHORT-TERM EMPLOYMENT AND LABOUR MARKET OUTLOOK AND KEY CHALLENGES IN G20 COUNTRIES. A statistical update by ILO and OECD 1
 SHORT-TERM EMPLOYMENT AND LABOUR MARKET OUTLOOK AND KEY CHALLENGES IN G2 COUNTRIES Introduction A statistical update by ILO and OECD 1 The objective of this note is two-fold: i) to review the most recent
CONTENTS. Meaning Estimates of unemployment Classification of unemployment Causes Effects Policies Solutions
 UNEMPLOYMENT CONTENTS Meaning Estimates of unemployment Classification of unemployment Causes Effects Policies Solutions Meaning Full Employment: Full employment refers to a situation in which all the
Monitoring the Performance of the South African Labour Market
 Monitoring the Performance of the South African Labour Market An overview of the South African labour market for the Year Ending 2012 8 October 2012 Contents Recent labour market trends... 2 A labour market
THE CONSTRUCTION SECTOR IN 2015
 THE CONSTRUCTION SECTOR IN 215 Article published in the Quarterly Review 216:2, pp. 25-32 BOX 2: THE CONSTRUCTION SECTOR IN 215 1 This Box reviews developments in the construction and real estate sectors
CHAPTER 4. EXPANDING EMPLOYMENT THE LABOR MARKET REFORM AGENDA
 CHAPTER 4. EXPANDING EMPLOYMENT THE LABOR MARKET REFORM AGENDA 4.1. TURKEY S EMPLOYMENT PERFORMANCE IN A EUROPEAN AND INTERNATIONAL CONTEXT 4.1 Employment generation has been weak. As analyzed in chapter
Ghanaian Labor Market. Key Trends and Major Policy Issues
 Ghanaian Labor Market Key Trends and Major Policy Issues Background Ghana then Gold Coast was under British Colonial domination since second half of C19th. Gained independence in 1957 (1 st in SSA) Was
Development of the Zambia Decent Work Country Profile- Country Experience
 Development of the Zambia Decent Work Country Profile- Country Experience A Presentation made at the ILO/EC Map Project Country Experiences Sharing Workshop held from 27 th to 29 th June 2012, Geneva,
Education and Employment Status of Dalit women
 Volume: ; No: ; November-0. pp -. ISSN: -39 Education and Employment Status of Dalit women S.Thaiyalnayaki PhD Research Scholar, Department of Economics, Annamalai University, Annamalai Nagar, India. Abstract
Quarterly Labour Market Report. December 2016
 Quarterly Labour Market Report December 2016 MB13809 Dec 2016 Ministry of Business, Innovation and Employment (MBIE) Hikina Whakatutuki - Lifting to make successful MBIE develops and delivers policy, services,