contents income 26 HUMAN Development Gini coefficient 30 education 32 DisposaBLE income 34 UnemploYment 40
|
|
|
- Andrea Gordon
- 5 years ago
- Views:
Transcription
1
2
 29 4 5 Gini coefficient")
3 contents 1 2 Geography 2 Introduction 3 Development Goals 4 Economic Growth And Transformation 10 REGional Gross Domestic product (GDP-R) 14 Gross VALUE ADDED (GVA) 15 Gross operating surplus (GOS) 16 total OUTPUT 17 INTERMEDiate consumption EXpenditure 18 TRESS index 19 DEMOGRAPHICS 20 population 23 HOUSEHOLDS 24 3 POVerty and 6 income 26 HUMAN Development INDEX (HDI) Gini coefficient 30 PEOPLE IN POVerty 31 education 32 HOUSEHOLD EXPENDITURE 33 DisposaBLE income 34 LABOUR market 36 LABOUR force 39 UnemploYment 40 EMPLOYment 41 CRIME 42 MURDER AND SEXUAL CRIMES 45 ROBBery 46 DRIVING under THE influence OF alcohol and DRUG-relateD crimes SERVices and infrastructure 48 water 51 sanitation 52 REFUSE 53 LIGHTING 54 HOUSING 55 TELEPHONE 56 HEALTH 58 HIV/AIDS 61 TUBerculosis (TB) 62 development indicators 64
4 socio-economic profile report geography EASTERN CAPE: MAIN places Alfred Nzo District Municipality Joe Gqabi District Municipality OR tambo District Municipality Chris Hani District Municipality Amathole District Municipality Cacadu District Municipality Buffalo City Metro Nelson Mandela Bay Metro cacadu district : MAIN PLACES Camdeboo Local Municipality Ikwezi Local Municipality Blue Crane Route Local Municipality Makana Local Municipality Cacadu Baviaans Local Municipality Kou-Kamma Local Municipality Cacadu Sudays River Valley Local Municipality Kouga Local Municipality Ndlambe Local Municipality
5 2014 socio-economic profile report 3 INTRODUCTION The Cacadu District stretches from the Bloukrans River in the west to the Great Fish River in the east, and from the Sneeuberge Mountains in the north to the Indian Ocean in the south. The Cacadu District Municipality is very sparsely populated (about 7 people per km2). The district forms the surrounding area of the Nelson Mandela Bay Metropole and is known for its large commercial farms, nature reserves and quaint small towns. Although Cacadu has the largest area of the six Eastern Cape districts, it is home to fewer than people. Just three of Cacadu s nine local municipal areas (Kouga, Makana and Ndlambe) account for more than half of its population. Population growth in the area has been low and, between 2009 and 2011, it exhibited a negative growth rate. The population s quality of life is deteriorating as measured by the Human Development Index (HDI). This is largely because life expectancy is lower as a result of the HIV/AIDS pandemic. Nevertheless Cacadu s HDI is higher than the provincial average although still less than South Africa s. Although the district s poverty rate is less than the provincial average, it is still relatively high with an estimated people living in poverty. Using the Gini coefficient, inequality in South Africa marginally improved from in 2007 to in The Eastern Cape, on the other hand, has become more unequal with Gini coefficients of in 2007 and in The Gini coefficient for the district was 0.63 in 2007 and in 2013, indicating a moderate deterioration and that equity remains a problem. The illiteracy rate in the Cacadu district is relatively high with over 18% of the population being functionally illiterate. This has, however, been improving, as the average has dropped by 1.4% pa since In recent years this has improved even more with an average of 5.1% pa since The number of economically active people in Cacadu in 2013 was , representing 46% of the region s population. The corresponding figure for the Eastern Cape and South Africa is 30% and 38% respectively. In 1995, 49% of the population was economically active. The labour force participation rate (LFPR) has been falling in South Africa, the Eastern Cape and Cacadu. However the LFPR for the Cacadu is higher (61%) than that of South Africa (59%), which in turn is higher than the Eastern Cape (49%). However, the unemployment rate has grown from 4.6% in 2000 to 13.4% in 2005 and stood at 21% in The percentage of employed people with formal jobs is declining slowly as more people find informal positions. In South Africa formal employment fell from 80% in 1995 to 70% in The same trend is evident in the Eastern Cape where 78% formal employment was recorded in 1995 and only 65% in Cacadu follows this trend with 80% being formally employed in 1995 and only 66% in Serious crime in Cacadu has generally been on a downward trend since The unweighted decline has been 2.7% pa since Notable exceptions are driving under the influence of alcohol or drugs (up 6.8% pa with 964 incidents reported in 2013), drug related crimes (up 9.6% pa with incidents reported in 2013) and sexual crimes (up 0.01% pa with incidents reported in 2013). In Cacadu service delivery levels have improved and are high when measured against national and provincial standards. The proportion of households without rubbish disposal has decreased from 4% in 1995 to 3% in Local authorities have improved their service and are now servicing over 82 % of households compared to only 60% in Similarly, the proportion of households with access to electricity is higher than in the Eastern Cape as a whole. Accordingly, the proportion has increased from just under two thirds in 1995 to 82% in The number of households that rely on paraffin has halved from 25% to 12%. On average, 80% of housing units are formal houses or brick structures on separate yards or stands. This compares favourably with South Africa at 58% and the Eastern Cape at 46%. The number of brick structures has increased by 0.4% pa since 2005 compared with South Africa and the Eastern Cape with 1.4% and 1.8% respectively.
6
7
8 socio-economic profile report Development priorities This district profile is being developed as the province is completing its Vision 2030 Provincial Development Plan (PDP) and there is an overall adopted National Development Plan (NDP). It is important that the data in this plan is placed within an overall national and provincial context. This section provides brief summaries of the NDP and the PDP. National Development Plan The National Development Plan was launched as an overarching long term plan in 2011 and adopted by government in The National Development Plan aims to eliminate poverty and reduce inequality by The plan states that South Africa can realise these goals by drawing on the energies of its people, growing an inclusive economy, building capabilities, enhancing the capacity of the state, and promoting leadership and partnerships throughout society. To accelerate progress, deepen democracy and build a more inclusive society, South Africa must translate political emancipation into economic wellbeing for all. It is up to all South Africans to fix the future, starting today. This plan envisions a South Africa where everyone feels free yet bounded to others; where everyone embraces their full potential, a country where opportunity is determined not by birth, but by ability, education and hard work. Realising such a society will require transformation of the economy and focused efforts to build the country s capabilities. To eliminate poverty and reduce inequality, the economy must grow faster and in ways that benefit all South Africans. In particular, young people deserve better educational and economic opportunities, and focused efforts are required to eliminate gender inequality. Promoting gender equality and greater opportunities for young people are integrated themes that run throughout this plan. Progress over the next two decades means doing things differently. Given the complexity of national development, the plan sets out six interlinked priorities: 1) Uniting South Africans of all races and classes around a common programme to eliminate poverty and reduce inequality. 2) encourage citizens to be active in their own development, in strengthening democracy and in holding their government accountable. 3) raising economic growth, promoting exports and making the economy more labour absorbing. 4) focusing on key capabilities of both people and the state capabilities include skills, infrastructure, social security, strong institutions and partnerships both within the country and with key international partners. 5) Building a capable and developmental state. 6) strong leadership throughout society that work together to solve our problems.
9 2014 socio-economic profile report 7 The NDP in Brief By 2030 South Africa should: Eliminate income poverty - Reduce the proportion of households with a monthly income below R419 per person (in 2009 prices) from 39% to zero. Reduce inequality - The Gini coefficient should fall from 0.69 to Enabling milestones Increase employment from 13 million in 2010 to 24 million in raise per capita income from R in 2010 to R by increase the share of national income of the bottom 40% from 6% to 10%. establish a competitive base of infrastructure, human resources and regulatory frameworks. ensure that skilled, technical, professional and managerial posts better reflect the country s racial, gender and disability makeup. Broaden ownership of assets to historically disadvantaged groups. increase the quality of education so that all children have at least two years of preschool education and all children in Grade 3 can read and write. Provide affordable access to quality health care while promoting health and wellbeing. establish effective, safe and affordable public transport. produce sufficient energy to support industry at competitive prices, ensuring access for poor households, while reducing carbon emissions per unit of power by about one-third. ensure that all South Africans have access to clean running water in their homes. make high-speed broadband internet universally available at competitive prices. realise a food trade surplus, with one-third produced by small-scale farmers or households. ensure household food and nutrition security. entrench a social security system covering all working people, with social protection for the poor and other groups, such as children and people with disabilities in need. realise a developmental, capable and ethical state that treats citizens with dignity. ensure that all people live safely, with an independent and fair criminal justice system. Broaden social cohesion and unity while redressing the inequities of the past. play a leading role in continental development, economic integration and human rights. Critical actions 1) A social compact to reduce poverty and inequality and raise employment and investment. 2) a strategy to address poverty and its impacts by broadening access to employment, strengthening the social wage, improving public transport and raising rural incomes. 3) steps by the state to professionalise the public service, strengthen accountability, improve coordination and prosecute corruption. 4) Boost private investment in labourintensive areas, competitiveness and exports, with adjustments to lower the risk of hiring younger workers. 5) an education accountability chain, with lines of responsibility from state to classroom. 6) phase in national health insurance, with a focus on upgrading public health facilities, producing more health professionals and reducing the relative cost of private health care. 7) public infrastructure investment at 10% of gross domestic product (GDP), financed through tariffs, public-private partnerships, taxes and loans and focused on transport, energy and water. 8) interventions to ensure environmental sustainability and resilience to future shocks. 9) new spatial norms and standards - densifying cities, improving transport, locating jobs where people live, upgrading informal settlements and fixing housing market gaps. 10) Reduce crime by strengthening criminal justice and improving community environments.
10 socio-economic profile report Provincial Development Plan The provincial vision and long term plan is intended to mobilise all citizens and sectors of the Eastern Cape around a common vision. The aim is to provide an opportunity for revisiting social partnerships and develop common goals among citizens, civil society, the state and the private sector. The plan also seeks to promote mutual accountability between stakeholders and to enable coherence of the three spheres of the state. Based on the National Development Plan, the Provincial Development Plan seeks to outline a development path for the province. It sets the development agenda and priorities for the next 15 years ( ), building on the Provincial Growth and Development Plan of It proposes key programmes and projects for implementation up to 2030 and suggests institutional arrangements for implementation, monitoring and reporting. This draft plan is the outcome of a two year long process of engagement with people and stakeholders of the province and beyond. Departing from a premise that the province must confront the structural features hobbling the provincial economy; privilege social and economic justice; be culturally sensitive; encourage citizen participation and co-responsibility for development; promote ethical, integrated multi-agent action; respect evidence and critical deliberation; and take accountability seriously, the following goals are core to the Eastern Cape Provincial Development Plan: 1) redistributive, inclusive and spatially equitable economic development and growth - prioritising investments in, and the development of, rural regions to address need and structural deficiencies, as well as tap potential. 2) quality Health - fundamental to human functionality and progress. 3) education, Training & Innovation - pivotal to human development, societal well-being and a regenerative, self-sustaining civilisation. 4) vibrant, cohesive communities - with access to decent housing, amenities and services. 5) institutional Capabilities - important to underpinning the developmental agency of both state and nonstate institutions. The goals are shown graphically in the figure below GOAL 1 An inclusive, equitable and growing economy GOAL 2 A healthy population GOAL 3 an educated, innovative citizenry GOAL 4 Vibrant, cohesive communities GOAL 5 capable, conscientious and accountable institutions rural development bias until spatial equity is established
11 2014 socio-economic profile report 9 Goals unpacked Goal 1: AN inclusive, equitable and GrowinG economy This goal emphasises a larger and more efficient provincial economy, increased employment, and reduced inequalities. This goal deals with: rural development; economic infrastructure; land reform; industry and enterprise support; and economic sector development. Proposals for priority interventions are district-specific. Goal 2: A healthy population This goal targets a healthy population through an improved healthcare system. The system should move from being hospitalcentric to focusing on a primary care system that is integrated across primary, secondary, and tertiary levels. The proposals include: primary health care and strengthening of district health systems; improvement of leadership across the sector; infrastructure and facility improvement; health workforce planning and the social determinants of health. Goal 3: An educated, innovative citizenry This goal seeks to ensure that people are empowered to define their identity, are capable of sustaining their livelihoods, living healthy lives and raising healthy families, developing a just society and economy, and playing an effective role in the politics and governance of their communities. The proposals deal with: access to and quality of early childhood development; basic education and training, including foundation phase literacy and numeracy, mother-tongue education, teacher development, improved leadership, management and governance and infrastructure. For the post school education and training sector, it addresses adult education and training, community colleges, technical and vocational education training, universities and research and innovation. Goal 4: VIBrant, COHesive communities This goal seeks to generate a shift from a focus on state-driven housing delivery to one that that enables people to make their own decisions, build their own liveable places and transform spatial patterns. The proposals deal with transformed human settlements, spatial planning and land use management, regional development, social infrastructure and community safety. Goal 5: Capable, conscientious and accountable institutions This goal seeks to build capable, resilient and accountable institutions to champion rapid inclusive development. The proposals deal with the creation of capable provincial and local government; leadership renewal across society; citizen-centred development and multi-agency partnerships. Achievement of the vision is impossible without concurrent, systemic and continuous interaction between an inclusive and equitable economy, a healthy population, an educated, innovative citizenry, vibrant communities and capable, conscientious and accountable institutions. There are complex interrelations between the goals, as well as the objectives and strategic actions proposed in this plan. Rural Development Bias Given that over 70% of the population is rural, the fortunes of the province are inherently bound up with the future of its rural areas. While urbanisation is an undeniable trend, we estimate that the majority of the population will still be outside of the metropolitan areas in The Eastern Cape is set to remain a rural province for the foreseeable future and therefore rural development is a key priority and has been integrated into all of the goal areas.
12
13
14 socio-economic profile report ECONOMIC GrowtH AND transformation The goal of a growing and inclusive economy includes a larger and more efficient provincial economy, more employment, and reduced inequalities of income and wealth. Economic priorities in the PDP are: agriculture mining and Energy construction manufacturing tourism social economy knowledge-based services The economic potential of a region will depend on a number of things, such as: natural resources (such as minerals, arable land and water). Distance from major markets. existing economic infrastructure and how it will be developed in future. existing competitive advantages, as revealed by existing enterprise activity in the region. How well we are able to build on existing competitive advantages and create new competitive advantages. This last point is crucial: competitive advantages are created and dynamic, not God-given. They require, for example, careful planning, resource mobilisation, effective state support and conducive macroeconomic (and other enabling) conditions. These are impossible to predict with any degree of certainty. For example, ten years ago the game-changing impact of shale-gas on this province was not on anyone s radar and remains uncertain as to its spatial footprint (because we are still at early stage exploration). This section outlines key indicators for economic growth and transformation in the district.
15 2014 socio-economic profile report 13 economic opportunities Agriculture: Cacadu has a relatively strong agricultural sector with good expansion possibilities: citrus (Sunday s River, Gamtoos) ha of new citrus has already been identified (with water rights) Deciduous fruit (Langkloof) pineapples and chicory Dairy and beef Game-farming wool and mohair Use of recycled water from fracking for irrigation Mining and minerals: This sector has very high potential based around shale-gas, a multi-trillion industry for the region. In addition, Grahamstown has the largest deposit of good quality kaolin in South Africa, and Jansenville has gypsum (used by PPC in nmb to make cement). Construction: The construction industry has very high potential in the region based on: the new shale-gas industry (pipe-lines, etc) nuclear plant near Cape St Francis wind farm construction small towns development coastal property developments Manufacturing industry: The region has some potential around, for example: new-generation products wool and mohair products fruit packing and juice Tourism: This region is well-endowed with tourism attractions and facilities and has good potential: Beaches and surfing valley of Desolation tsitsikamma Grahamstown Arts Festival addo, Baviaanskloof, Camdeboo, etc Hunting Knowledge-based services: The region has good potential in this area, particularly around Rhodes University.
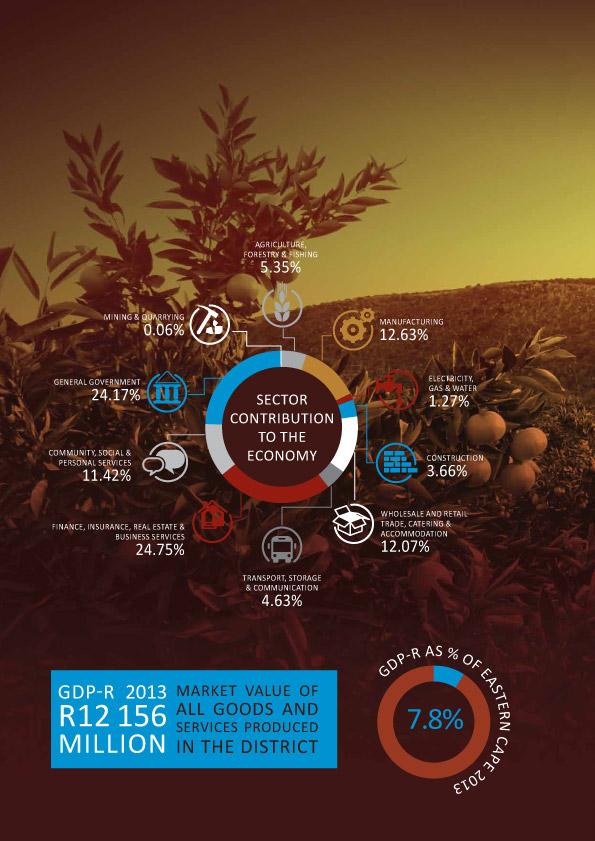
16 socio-economic profile report REGIONAL Gross Domestic PRODUct (GDp -r) The economy of the Cacadu district is relatively small and contributes only 0.6% of the South African economy and 7.8% to the Eastern Cape economy. The performance of the Cacadu district has been satisfactory over the past decade or so, with an average annual growth rate from 2000 to 2010 of 3.7%. The recession had a marginal effect on the overall performance and growth rates dropped by 0.07%, as opposed to a national average of 1.5% and a provincial average of 1%. The recovery has also been faster. In 2013, the growth rate was 2.1% compared with a South African and Eastern Cape growth rate of 1.9% and 1.6% respectively. The tertiary sector is the district s largest contributor to its economy at 77.0%. This is followed by the secondary sector (17.6%) and the primary sector (5.4%). Manufacturing also plays an important role in the district economy. In 2013 it contributed 12.6% to the region s gross value added (GVA) and the contribution of its subsectors was as follows: petroleum products, chemicals, rubber and plastics (1.8%), transport equipment (1.32%), metals, metal products and equipment (1.31%), transport and equipment (1.28%) and furniture and other manufacturing (1.28%). Non metallic mineral products have exhibited a negative performance, as the sector lost 34% during the recession. However, it did recover during 2010 with a growth rate of 5.2%. Nevertheless, it has shrunk by an annual average of 1.70% since GDp -r (Rm, 2005 prices) GDP-Rr per Capita (R, 2005 prices) REGIONAL Gross Domestic product (GDP-R) GDP-R % CHANGE IN GDP-R (Y/Y) REGIONAL Gross Domestic product (GDP-R) GDP-R PER capita DISTRIBUTION OF GDP-R % Change (y/y) GDP-Rr as percentage of ec (%) Definition: Market value of all final goods and services produced within a region in a given period of time. Real GDP-R is the nominal GDP adjusted for inflation. Data source: Quantec*; Statssa Data note: GDP-R is calculated using the national ratio of gross value added to GDP at market prices and gross value added (GVA) for each location. Distribution variable is calculated using variable as a percentage of the provincial total for the variable in question. GDP-R (Rm, 2005 prices) % Change (y/y) GDP-R per Capita (R, 2005 prices) GDP-R as % of Eastern Cape (%)
17 2014 socio-economic profile report 15 GROSS VALUE ADDED (GVA) GVA (Rm, 2005) prices) REGIONAL Gross Domestic product (GDP-R) GVA % CHANGE IN GVA (Y/Y) DISTRIBUTION OF GVA % Change (y/y) GVA as percentage of ec (%) GVA measures the contribution to the economy of each individual producer, industry or sector in a region and is used in the estimation of gross domestic product (GDP). GVA = GDP taxes on products + subsidies on products. The tertiary sector is dominated by finance, insurance, real estate and business services (32.1%) followed by general government (31.4%). The general government sector has grown an average of 4.2% since Government services contribute to 27.5% to the sector in the Eastern Cape and almost 1% to sector in South Africa. Community services have exhibited strong growth since 1995 at 4.5% average annual growth. Business services contribute 15.7% to the Cacadu district s economy. GROSS VALUE ADDED (GVA) PER sector (2013) General government Community, social and personal services Finance, insurance, real estate and business services Transport, storage and communication Wholesale and retail trade, catering and accommodation Construction Rm, 2005 prices Electricity, gas and water Manufacturing Mining and quarrying Agriculture, forestry and fishing GVA (Rm, 2005 prices) % Change (y/y) GVA as % of Eastern Cape (%) Definition: Gross value added (GVA) for a region includes the compensation of employees, the net operating surplus, the consumption of fixed capital (gross value added at fixed costs), other taxes on production less other subsidies on production (gross value added at basic prices) in that region. SIC refers to the Standard Industrial Classification of all Economic Activities, is based upon the latest (third revision which appeared in 1990) International Standard Industrial Classification of all Economic Activities (ISIC) with suitable adaptations for local conditions and is published by Statssa. Data source: Quantec*; Statssa Data note: Distribution variable is calculated using variable as a percentage of the provincial total for the variable in question.
18 socio-economic profile report GROSS OPERATING SURPLUS (GOS) Profits are an important economic measure in that they reflect the extent to which firms are sustainable in the long term. If firms are relatively more profitable in one country or region than in others in the long run, new firms will tend to relocate or establish themselves in that area. GROSS OPERATING SURPLUS (GOS) GOS % CHANGE IN GOS (Y/Y) Gross operating surplus (GOS) is the surplus generated by an enterprise s operating activities after the labour factor input has been recompensed. Although GOS is not exactly the same as profits, it is used as a proxy and is useful in trend and cross sectional analysis. It does not, however, take factors such as depreciation or tax into account. GOS (Rm, 2005 prices) % Change (y/y) Cacadu district s GOS was R4.9 billion in 2013, contributing just over 0.6% of South Africa s GOS and 7.7% of the Eastern Cape s Finance, insurance, real estate and business services [SIC: 8] (35%); Wholesale and retail trade, catering and accommodation [SIC: 6] (15%); and Manufacturing [SIC: 3] (14%) are the three sectors that contribute the most to the Cacadu district s GOS. Agriculture is also important and contributes 19.8% to the agriculture sector of the Eastern Cape as a whole. The finance and insurance sector was the faster growing sub sector, exhibiting an average growth of 4.3% p.a between 2005 and GOS (Rm, 2005 prices) GROSS OPERATING SURPLUS (GOS) GOS DISTRIBUTION OF GOS (-1.00) (-2.00) - GOS as percentage of EC (%) Definition: Gross operating surplus (GOS) is the income received by factors of production in the economy, i.e. rent, interest and profit by those who own the production factors, taking into account the value of the consumption of fixed capital. SIC refers to the Standard Industrial Classification of all Economic Activities, is based upon the latest (third revision which appeared in 1990) International Standard Industrial Classification of all Economic Activities (ISIC) with suitable adaptations for local conditions and is published by Statssa. GOS (Rm, 2005 prices) % Change (y/y) GOS as % of Eastern Cape (%) Data source: Quantec* Data note: Distribution variable is calculated using variable as a percentage of the provincial total for the variable in question.
19 2014 socio-economic profile report 17 TOTAL OUTPUT Output (Rm, 2005 prices) Output (Rm, 2005 prices) TOTAL OUTPUT OUTPUT % CHANGE IN OUTPUT (Y/Y) TOTAL OUTPUT OUTPUT DISTRIBUTION OF OUTPUT % Change (y/y) % Change (y/y) Output consists of goods and services that are produced within the economy. It involves food and services produced for own final use. Output has been increasing steadily since 2000, even during 2009 when the global recession had an impact on the South African economy. Cacadu district s share of the Eastern Cape total output has remained at just 7.5%. The sectors with the largest output are: manufacturing [SIC: 3] (22%); General Government [SIC: 99] (20%); finance, insurance, real estate and business services [SIC: 8] (20%); wholesale and retail trade, catering and accommodation [SIC: 6] (10%); and community, social and personal services [SIC 93 96, 98] (10%). In the Eastern Cape the sectors with the largest output are: Manufacturing [SIC: 3] (29%); Finance, insurance, real estate and business services [SIC: 8] (18%); General government [SIC: 99] (17%); Wholesale and retail trade, catering and accommodation [SIC: 6] (11%); and Community, social and personal services [SIC: 93 96, 98] (9%). The sectors with the largest share of South Africa s output are: Manufacturing [SIC: 3] (24.7%); General government [SIC: 99] (16%); Wholesale and retail trade, catering and accommodation [SIC: 6] (12%) Transport, storage and communication [SIC: 7] (8%); Mining and quarrying [SIC: 2] (7%). Output (Rm, 2005 prices) % Change (y/y) Output as % of Eastern Cape (%) Definition: Total output of goods and services produced by a region, at basic prices. SIC refers to the Standard Industrial Classification of all Economic Activities, is based upon the latest (third revision which appeared in 1990) International Standard Industrial Classification of all Economic Activities (ISIC) with suitable adaptations for local conditions and is published by Statssa. Data source: Quantec*; Statssa Data note: Distribution variable is calculated using variable as a percentage of the provincial total for the variable in question.
20 socio-economic profile report INTERMEDIATE consumption EXPENDITURE Intermediate consumption expenditure includes the inputs used to produce final goods and services. The sectors with the largest intermediate consumption expenditure include: General government [SIC: 91, 94] (17.2%) Business services [SIC: 83] (13.8%) food, beverages and tobacco [SIC: ] (11.1%) construction [SIC: 51 53] (8.7%) community, social and personal services [SIC: 92, 95 6] (8.7%) In the Eastern Cape the sectors with the largest intermediate consumption expenditure are: Manufacturing [SIC: 3] (38%); Finance, insurance, real estate and business services [SIC: 8] (15%); General Government [SIC: 99] (14%); Wholesale and retail trade, catering and accommodation [SIC: 6] (9%); Community, social and personal services [SIC: 93 96, 98] (8%); Transport, storage and communication [SIC: 7] (7%); and Construction [SIC: 5] (6%). The sectors with the largest share of South Africa s intermediate consumption expenditure (per sector) include: Manufacturing [SIC: 3] (34.4%); General government [SIC: 99] (14%); Wholesale and retail trade, catering and accommodation [SIC: 6] (9%); Transport, storage and communication [SIC: 7] (7%); and Construction [SIC: 5] (7%). intermediate consumption (Rm, 2005 prices) intermediate consumption (Rm, 2005 prices) INTERMEDIATE CONSUMPTION EXPENDITURE INT. consumption % CHANGE IN INT. consumption (Y/Y INTERMEDIATE CONSUMPTION EXPENDITURE INT. consumption DistriBUTION OF INT. consumption % Change (y/y) Intermediate consumption as a percentage of EC (%) Definition: Intermediate consumption expenditure represents the value of goods and services that the producer purchases in order to produce other goods and services. SIC refers to the Standard Industrial Classification of all Economic Activities, is based upon the latest (third revision which appeared in 1990) International Standard Industrial Classification of all Economic Activities (ISIC) with suitable adaptations for local conditions and is published by Statssa. Data source: Quantec*; Statssa Data note: Distribution variable is calculated using variable as a percentage of the provincial total for the variable in question. Int. consumption expenditure (Rm, 2005 prices) % Change (y/y) Int. consumption expenditure as % of the Eastern Cape (%)
21 2014 socio-economic profile report 19 TRESS INDEX Tress Index for 23 industries TRESS INDEX TRESS % CHANGE IN tress (Y/Y) % Change (y/y) The sectoral composition of economic activity in a region is a good indication of the level of diversification or concentration of a region s economy and can be measured by the so called tress index. A tress index of zero represents a totally diversified economy. On the other hand, the higher the index (closer to 100), the more concentrated or vulnerable the region s economy to exogenous variables, such as adverse climatic conditions, commodity price fluctuations, and so forth. In 2013 the tress index for the Cacadu district was 76.2 compared to 73.0 for the Eastern Cape and 66.9 for South Africa. Given that the structure of the economy changes very slowly, the tress index is fairly stable over time. However, the economy has marginally diversified since 1995 when the tress index was INDUSTRY composition BY sector (2013) General government Community, social and personal services Finance, insurance, real estate and business services Transport, storage and communication Wholesale and retail trade, catering and accommodation Construction Electricity, gas and water Manufacturing Mining and quarrying Agriculture, forestry and fishing Rm, 2005 prices Tress Index for 23 industries % Change (y/y) Tress Index for 10 industries % Change (y/y) Definition: The level of diversification or tress concentration of a region s economy is measured by a Tress index. A Tress index of zero represents a totally diversified economy. On the other hand, the higher the index (closer to 100), the more concentrated or vulnerable the region s economy to exogenous variables, such as adverse climatic conditions, commodity price fluctuations, etc. Data source: Quantec* Data note: Distribution variable is calculated using variable as a percentage of the provincial total for the variable in question.
22
23
24 socio-economic profile report DEMOGRAPHICS Demographics are about the population of a region and the culture of the people there. Demographic shifts tell us about the shifting composition of a region s population. Demographic information allows us to plan for the future, allocate scarce resources and monitor the impact of policy, political and economic changes in society. In 2014, three core demographic trends should inform planning in the Eastern Cape. Population size has been nearly stagnant and the province has the largest outmigration of any province in the country. The Census 2011 results indicate that the Eastern Cape had a population of in 2011, an increase of 6.7% on the 1996 population and 4.5% on the 2001 population. However, in relation to other provinces, the provincial share of the national population declined from 15.1% in 1996 to 12.7% in The declining proportion of the Eastern Cape population in the national total can be contrasted with increasing proportions in Gauteng and the Western Cape. These increased by 60.9% and 47.2% respectively from 1996 census figures. The declining proportion of the Eastern Cape population has already begun to impact negatively on the provincial fiscal allocation. The Eastern Cape experiences large outmigration as evidenced by 2 million people born in the Eastern Cape now living in other provinces. Between 2001 and 2011 there was net out-migration of The majority of those that leave the province move to Western Cape, Gauteng and KwaZulu-Natal. Many rural municipalities in Chris Hani, Amathole and O R Tambo districts experienced population decline in the past ten years. There has been a change in household structure in the past 15 years, towards smaller households, particularly in urban areas. Comparing census data from 1996, 2001 and 2011, household numbers have grown at a faster rate than the population growth rate, implying an accelerated rate of demand for household services. The Eastern Cape population grew by 5% compared to a 14% growth rate for households and the average household size has decreased from 4.7 to 3.7 persons per household.
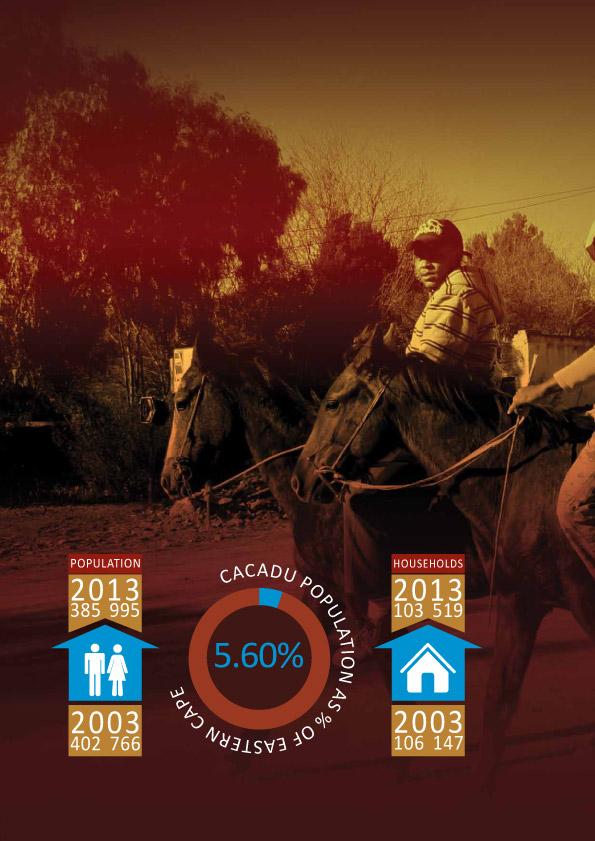
25 2014 socio-economic profile report 23 POPULATION Number of people Age group (years) POPULATION POPULATION % CHANGE IN POPUlation (Y/Y) POPULATION BY AGE AND GENDER FEMALE 2000 male 2000 FEMALE 2010 male % Change (y/y) Just under 5.6% of the population of the Eastern Cape lives in the Cacadu district, representing 0.7% of South Africa s population. The district s population was in decline between 2004 and The annual rate of population growth since 2005 has been about 0.5%, which is far below the national and provincial averages. All population groups have experienced a negative population growth except for blacks (2.0%), which mirrors the national average. Since 2005 the white population has experienced a 1.1% average annual decline, coloureds 0.7% and Asians 1.1%. Black Africans are in the majority in Cacadu (54.9%), followed by coloureds (34.3%), whites (10.6%) and Asians (0.2%). The Cacadu district is very sparsely populated with only 7 people per km2 compared to South Africa (41 people per km2) and the Eastern Cape (40 people per km2). Population % Change (y/y) Population as % of Eastern Cape (%) Population density Definition: The population includes all inhabitants (both South African citizens and foreigners) of all races, gender and ages. Data source: Quantec*; Statssa Data note: Distribution variable is calculated using variable as a percentage of the provincial total for the variable in question.
26 socio-economic profile report HOUSEHOLDS In 2013 there were households in Cacadu. This represents 0.8% of the South African households and 5.9% of those in the Eastern Cape. Since 2005, the number of households in the Cacadu district has declined marginally ( 0.4%), while the number of households in South Africa has increased by an annual average rate of 1.1% per annum and 1.0% in the Eastern Cape. Although black households are in the majority, 27.5% of the households are coloured and 14.8% are white. Since 2005, coloured households have declined by an annual average rate of 0.8% while the number of white households has grown by an annual average rate of 0.8%. Number of households NUMBER OF HOUseHOLDS distribution HOUSEHOLDS % CHANGE IN HOUSEHOLDS (Y/Y) HOUSEHOLDS distribution % Change (y/y) DISTRIBUTION OF HOUSEHOLDS (2013) Number of households White households Asian households Coloured households Black households Definition: A person, or group of persons, who occupy a common dwelling unit (or part of it) at least four days a week on average. They live together and share resources as a unit. Data source: Quantec*; Statssa Data note: Distribution variable is calculated using variable as a percentage of the provincial total for the variable in question. Households % Change (y/y) Households as % of Eastern Cape (%)
27
28
29
30 socio-economic profile report POVERTY AND income Poverty in South Africa and the Eastern Cape is widespread and deep, and is hence the chief target of government policy. Several studies have been conducted on the characteristics and spread of poverty in the Eastern Cape to improve planning, programming and targeting of anti-poverty interventions. The overwhelming finding is that more than a decade into democracy, the Eastern Cape Province remains trapped in structural poverty. This shows in all aspects of its demographic, health and socioeconomic profiles. However there are wide intra-provincial spatial differences. In the Eastern Cape, poverty eradication was a central part of the Provincial Growth and Development Plan. The Department of Social Development was charged with coordinating the provincial war on poverty campaign from 2006 onwards. From 2007 a two-pronged approach was implemented, where focus in the short term was on integrating and coordinating existing poverty eradication initiatives in the 11 least developed local municipalities in the Eastern Cape. The medium to long term goals were to work towards a family-based social service model. In 2012 the province adopted an Anti-Poverty Strategy, championed by the DoSD. The Anti-Poverty Strategy builds on the experience of government and civil society in the past 20 years and aims to change how interventions are implemented. This will be done through joined-up implementation and better targeting of interventions. Integration is important to avoid waste of scarce resources and ensure sustainability of interventions. The goals of the strategy are; i) Eradicate extreme poverty and hunger; ii) Promote sustainable community livelihoods and self-reliant households; and iii) ensure well targeted, joined-up implementation and service delivery by government and its social partners. Importantly, the strategy, and its implementation programme to date, emphasise that without the joint efforts of all spheres of government, NGOs, community and civil society organisations, trade unions, faith based organisations, traditional authorities, institutions of higher learning and the private sector, poverty eradication cannot be achieved.
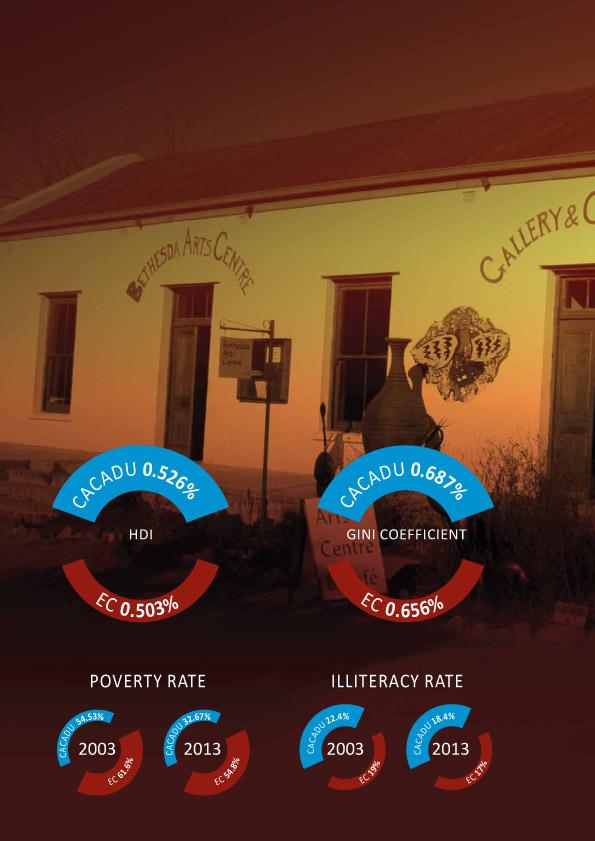
31 2014 socio-economic profile report 29 HUMAN Development INDEX (HDI) HDI HUMAN DEVELOPMENT INDEX (HDI) HDI The Human Development Index (HDI) is a comparative measure of health, education and income, measured in terms of life expectancy, literacy and level of education, and GDP per capita, respectively. It is a standard means of measuring living standards. Although the index has also been criticised as redundant and a reinvention of the wheel, measuring aspects of development that have already been exhaustively studied, it is useful for measuring progress over time and the impact of economic policies on quality of life. In South Africa the HDI dropped from in 1995 to in The index has, however, been fairly constant for the past few years. The HDI in the Eastern Cape has been lower than South Africa s HDI since 1995 and dropped from (1995) to (2013). The trend for the past five years has been downward, largely because of the lower life expectancy resulting from the HIV/AIDS pandemic. In 2013 Cacadu s HDI was which was higher than the provincial average but less than South Africa s. The trend in recent years however has been positive. HDI Definition: The Human Development Index (HDI) is a comparative measure of health, education and income, measured in terms of life expectancy, literacy and level of education, and GDP per capita, respectively. It is a standard means of measuring living standards. Data source: Quantec*; Statssa Data note: It is important to note that the UNDP publishes an annual development report with its own HDI figures. Unfortunately the methodology changes making comparisons difficult. The latest UNDP report (2011) lists South Africa with an HDI of and ranks it 123 in the world. The HDI presented above should therefore not be compared to the UNDP s HDI.
32 socio-economic profile report GINI coefficient Poverty and inequality remain major challenges for the Cacadu district, the Eastern Cape and South Africa as a whole. The Gini coefficient is an indicator of how equally the income (or poverty) is distributed, however countries that have identical Gini coefficients can differ greatly in terms of income and quality of life. The Gini coefficient measures the extent to which incomes among individuals or households in an economy deviate from a perfectly equal distribution. It is important to bear in mind that the Gini coefficient is neither a necessary nor a sufficient indicator or condition for improving the lives of the poor in South Africa. Gini coefficient GINI COEFFICIENT GINI COEFFICIENT Methodological differences in the available underlying data and differences in the methodology by which the Gini coefficient is calculated, complicate comparisons The Gini coefficient measures inequality using a ratio analysis that makes it easy to interpret. A Gini coefficient of 0 represents perfect equality and 1 means perfect inequality. Using the Gini coefficient, inequality in South Africa improved from in 2007 to in By contrast, the Eastern Cape has become marginally more unequal with Gini coefficients of in 2007 and in The Gini coefficients for the district were in 2007 and in 2013, indicating a moderate deterioration and equity remains a problem. In the past, inequality in South Africa was largely defined along racial lines. Today, it has become increasingly defined as the gap between rich and poor. Definition: The Gini coefficient measures the inequality as a proportion of its theoretical maximum. The Gini coefficient ranges from 0 (no inequality) to 1 (complete inequality). Data source: Quantec*; Presidency Gini coefficient
33 2014 socio-economic profile report 31 PEOPLE IN POVerty Number of people living in poverty PEOPLE IN POVerty people in POVerty % CHANGE IN poverty (Y/Y) % Change (y/y) Poverty is notoriously difficult to define but typically researchers take one of two approaches; the first is the poverty line approach and the second is the access toservices approach. Following the poverty line approach, the number of households that fall below a chosen minimum income threshold are said to be living in poverty (the minimum income threshold is the minimum level of income that is required to meet basic needs). The number of people living in poverty in both South Africa and the Eastern Cape is declining. Of the 21 million people living in poverty in South Africa, nearly 3.8 million live in the Eastern Cape. This means that 40.5% of South Africa s population and 54.9% of the province s population are living in poverty. Population POVerty rate POVerty rate percentage POVerty Poverty rate (%) In 2013 there were an estimated people living in poverty in the district, representing 32.7% of the district s local population. The number of people living in poverty is declining, however, and since 2005 it has declined by an annual average of 5.5%. Number of people living in poverty % Change (y/y) Poverty rate (%) Population Definition: Number of people living below the poverty line. There is no official poverty line defined in South Africa, therefore Unisa s BMR poverty line has been used. The poverty line for Port Elizabeth is R1 892 per month at 2005 prices and has been used as a benchmark for all the districts in the Eastern Cape. Data source: Statssa; Quantec; BMR Data note: The Minimum Living Levels were projected from calculations of previously disadvantaged households living in former segregated urban areas in Port Elizabeth in 2003/2004. The poverty rate is taken as the percentage of people in poverty relative to the population of that area.
34 socio-economic profile report EDUCATION The effects of education (or non education) are extensive throughout society. Education links directly to povertyreduction efforts, with poverty levels tending to be lower among families in which the head of the household has had some education than in those where the head of the household has no education. Education is also directly related to improved health and impacts especially on premature death rates among children. Even with improved education levels, jobs may still be hard to find, although education considerably enhances the chances of finding employment. The illiteracy rate in the Cacadu district is relatively high with 18.4% of the population being functionally illiterate. This has, however, been improving, as the literacy rate has been dropping by an average of 1.4% per annum since This has improved even further in recent years to an average of 2.5% per annum since The number of people aged 15 years or older without any schooling is a matter of concern. Fortunately, this figure has been coming down. In 1995 more than people had not received any schooling, but in 2013 this figure had dropped to just under This represents 5.0% of the population as opposed to 10.0% in This is lower than the Eastern Cape which stands at 6.1% and South Africa at 5.5%. Number of people aged 15+ years with no schooling Number of illiterate people age 20+ years NO SCHOOLING: PERSONS AGED 15+ SCHOOL % CHANGE IN SCHOOL (Y/Y) ILLITERACY: PERSONS AGED 20+ ILLITERACY % CHANGE IN illiteracy (Y/Y) % Change (y/y) % Change (y/y) Definition: A literate adult is defined as a person 20 years and older who has achieved at least seven years of education (i.e. passed grade 7). Data source: Quantec* Data note: Distribution variable is calculated using variable as a percentage of the provincial total for the variable in question. Number of people with no schooling % Change (y/y) Number of illiterate people % Change (y/y)
35 2014 socio-economic profile report 33 HOUSEHOLD EXpenditure Annual total HH expenditure (Rm, 2005 prices) HOUSEHOLD EXPENDITURE HOUSEHOLD EXPENDITURE % CHANGE IN HOUSEHOLD EXPENDITURE (Y/Y) % Change (y/y) Household expenditure in this district is estimated to be just over R7.1 billion. In contrast, household income is R6.8 billion - indicating no household savings. Households tend to spend less on durable goods (just under 13%), with a greater percentage (just over 35%) being spent on non durable goods and services. Consequently, there is very little wealth accumulation. The household expenditure pattern in the district is as follows: final consumption expenditure by households: R7.1 billion; Durable goods: 12%; semi durable goods: 10%; non durable goods: 34%; and services: 44%. DISTRIBUTION OF HOUSEHOLD EXPENDITURE (2013) Services Non-durable goods Semi-durable goods Durable goods R, 2005 prices Household expenditure % Change (y/y) (Rm, 2005 prices) Definition: Final consumption expenditure by households. Data source: Quantec*
36 socio-economic profile report DISPOSABLE INCOME Total disposable household income for 2013 in the Cacadu district was estimated at R6 814 million, while household expenditure stood at R7 149 million. This indicates high levels of debt. Of total disposable income, remuneration (salaries, wages, business proceeds, etc.) accounted for 77.2% and unearned income accounted for 22.8% of total income, which suggests that amost a quarter of households in the district is surviving on pensions, government grants and remittances. The percentage of total disposable income that is derived from remuneration is declining: in 1995 remuneration represented 77% of total disposable income. The average household income in the Cacadu district in 2013 was just less than R (2005), making it the district with the second highest household disposable income in the Eastern Cape. Annual total disposable income (Rm, 2005) DISPOSABLE HOUSEHOLD INCOME HOUSEHOLD INCOME % CHANGE IN HOUSEHOLD income (Y/Y) DISTRIBUTION OF DISPOSABLE INCOME (2013) Number of households % Change (y/y) Income category (R, 2005 prices) R or more R R R R R R R R R R R R R R R R R R R 1- R No income Definition: Disposable household income looks at the total household income for the region less the tax commitments by all the members of that household. Data source: Quantec* Data note: Distribution variable is calculated using variable as a percentage of the provincial total for the variable in question. Disposable income % Change (y/y) (R, 2005 prices)
37
38
39
40 socio-economic profile report LABOUR FORCE It is well known that South Africa and the Eastern Cape is facing a jobs crisis. There are large numbers of unemployed people, large and increasing numbers of discouraged workers and a growing non-economically active population. Official unemployment has remained around the 30% mark for more than 15 years. The Eastern Cape has the highest net out-migration of any province in SA. In the absence of high net out-migration the Eastern Cape s unemployment rates would be much higher than they currently are. Further there is a large and steady inflow of new entrants into the labour market from our schools. The jobs crisis is compounded by a skills crisis. The Eastern Cape government has developed a Jobs Strategy. The purpose of the Jobs Strategy is to present the provincial government s understanding of the present provincial jobs and skills crises and explain and justify government s comprehensive approach to tackling these crises. The strategy shows how government s activities are being ramped up to align with the New Growth Path (NGP) jobs targets. Sectors and projects with job-creation potential are identified. Quantified and disaggregated job creation targets for have been developed. The strategy also identifies and defines the priority interventions necessary to achieve these targets and identifies key issues, challenges and constraints that must be addressed to optimise job creation outcomes. The strategy has five pillars: 1) retain existing jobs. 2) stimulate new jobs in priority sectors. 3) Build the social economy. 4) increase the pace of provincial economic infrastructure investments in critical areas. 5) radically improve skills development processes. This section outlines key indicators for the labour market in the region.
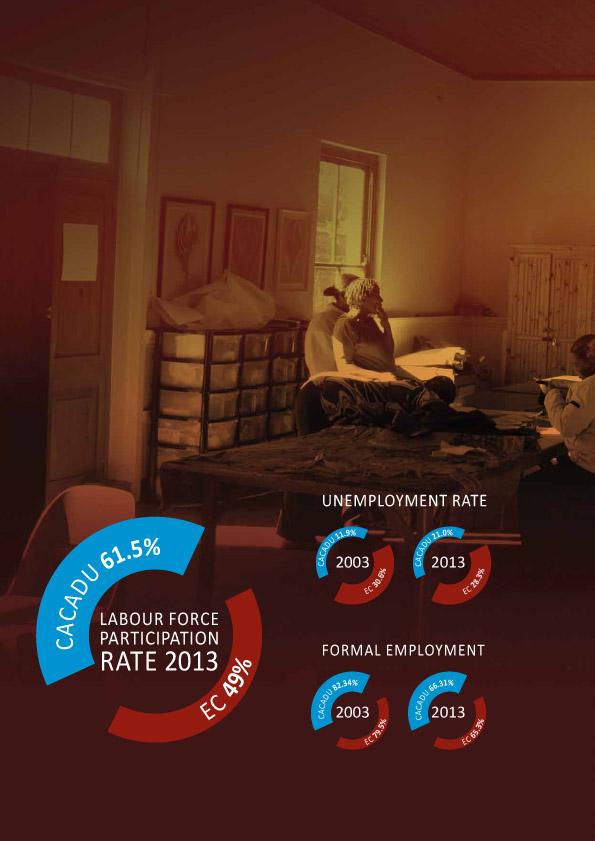
41 2014 socio-economic profile report 39 LABOUR force Number of economically active persons (eap) Number of economically active persons (eap) ECONOMICALLY active POPUlation (eap) ECONOMICALLY active POPUlation % CHANGE IN economically active POPUlation (Y/Y) LABOUR FORCE PARTICIPATION RATE ECONOMICALLY active POPUlation LABOUR force participation rate % Change (y/y) LFPR (%) The economically active population (EAP) includes all persons of either sex, and above a certain age, who supply labour for productive activities during a specified timereference period. Productive activities are either market production activities (work done for others and usually associated with pay or profit) or non market production activities (work done for the benefit of the household, e.g. subsistence farming). The EAP therefore includes the proportion of the population aged 15 to 64 years that is employed, self employed or seeking employment. In essence, it is the number of people that are willing and able to work that can generally be viewed as the labour force. The number of economically active people in Cacadu in 2013 was This represents 46% of the region s population. The corresponding figure for the Eastern Cape and South Africa are 30.1% and 38.1% respectively. In 1995, 49.8% of the population was economically active. The labour force participation rate (LFPR) has been falling in South Africa, the Eastern Cape and the Cacadu district. However, the LFPR for the Cacadu is higher (61.5%) than that of South Africa (59.3%), which in turn is higher than that of the Eastern Cape (49.0%). The International Labour Organization keeps statistics on the LFPRs and the South African one has been falling for many years. When South Africa s LFPR is compared with that of 189 other countries, South Africa has one of the LFPRs in the world, along with such countries as Iraq, the occupied Palestinian territories, Iran, Egypt and Tunisia. Although the population has been growing, the labour force has been falling by an average 0.6% pa since Nationally, this figure is 1.43% pa. This can be attributed to the growing number of the population that can be described as not economically active. Since 2006 this has grown at almost 5% pa. EAP % Change (y/y) EAP as % of Eastern Cape (%) LFPR (%) Definition: Economically active population (or labour force) consists of employed and unemployed people. The not economically active population are people out of the labour market who are not available for work and includes students, fulltime scholars, fulltime homemakers, retired and those unable or unwilling to work. The labour force participation rate (LFPR) is the labour force divided by the population of working age (15 to 64 years). Data source: Quantec* Data note: Distribution variable is calculated using variable as a percentage of the provincial total for the variable in question.
42 socio-economic profile report UNEMPLOYment The number of people gainfully employed as percentage of the total population of South Africa is low. This implies that unemployment is high. However, care must be taken to determine who is unemployed, as the number of unemployed does not include discouraged workers or those who are not economically active. In the Eastern Cape the number of unemployed has decreased by approximately 5.4% pa since In the Cacadu district people were unemployed in This dropped to in Although the recession caused unemployment to rise, indications are that this has since started to decline. Although the rate of unemployment is high, it has been declining as it is now in the order of 28.2% the Eastern Cape as a whole and 21.0% for the Cacadu district in particular. The unemployment rate has grown from 4.6% in 2000 to 13.4% in 2005 and stood at 21.0% in Number of unemployed persons NUMBER OF UNEMPLOYED UNEMPLOYED % CHANGE IN UnemploYED (Y/Y) UNEMPLOYMENT rate POPULATION UnemploYMENT rate % Change (y/y) Population Unemployment rate (%) Definition: The unemployed are those people within the economically active population who: 1) did not work during the seven days prior to the interview 2) want to work and are available to start work within two weeks of the interview 3) have taken steps to look for work or to start some form of self-employment in the four weeks prior to the interview. The expanded definition of unemployment excludes criterion (3). The unemployment rate is the total number of unemployed persons as a percentage of the economically active population (or labour force). Unemployment % Change (y/y) Unemployment rate (%) Data source: Quantec* Data note: Distribution variable is calculated using variable as a percentage of the provincial total for the variable in question.
43 2014 socio-economic profile report 41 EMPLOYment Total number of persons employed in the formal and informal sector FORMAL AND INFORMAL EMPLOYMENT FORMAL EMPLOYED UNEMPLOYMENT rate INFORMAL employed Employment is a function of economic activity. As the economy grows so does the number of people employed. In recent times, employment growth has not been commensurate with economic growth rates. This is because some sectors are able to create more employment opportunities with a given economic growth rate. Creating jobs for unskilled labour is especially difficult, hindering efforts to disperse the benefits of economic growth more evenly. The total number of employed people decreased from in 2001 to in The decline in the total number of jobs is partly a result of the global economic crisis but also structural economic problems in the region. The percentage of employed people with formal jobs is declining slowly as more people find informal positions. In South Africa formal employment fell from 79.6% in 1995 to 70.3% in The same trend is evident in the Eastern Cape where 78.3% formal employment was recorded in 1995 and only 65.3% in The Cacadu district follows this trend with 80.5% formally employed in 1995 as opposed to only 66.3% in Of the formal workforce in the district, 16.0% are highly skilled; 48.2% are semi skilled. Population POPULATION UnemploYMENT rate Employment rate (%) In addition, 33.7% of employed people have found work in the informal sector compared to 34.7% in the Eastern Cape and 29.7% in South Africa. Formal employment as % of total employment (%) Informal employment as % of total employment (%) Total employment Employment rate (%) Definition: The employed include all people that are employed either by the formal or the informal sector or those that are self employed. The informal economy has no formal definition and is sometimes called the unrecorded economy, shadow economy or hidden economy. Businesses in this sector are generally so small that they cannot or do not want to pay taxes or are engaged in illegal activities. Employers in the formal sector are businesses that generally comply with all tax and other regulations and are typically larger than those in the informal sector. Data source: Quantec* Data note: Distribution variable is calculated using variable as a percentage of the provincialtotal for the variable in question.
44
45
46 socio-economic profile report CRIME High levels of crime is a concern to all South Africans. South Africa has extraordinarily high rate of murders, assault, rape and other crimes compared to many other countries. The most commonly reported crimes in the Eastern Cape are robbery, theft and property related crimes, followed by assault and sexual crimes. Commercial crimes are also of concern and drug related crimes are on the increase. Crime statistics indicate high levels of violent crime in the province which are often illustrated through harrowing stories of gang rape, brutal attacks on children or elderly women. These attacks are not isolated events of individual victimisation but are rather a socio-structural problem embedded in social relations. The Centre for Study of Violence and Reconciliation (csvr) in its reports on a project to study the violent nature of crime in South Africa, sets out factors that drive the high rates of violence. These include historical brutalisation and a culture of violence during the colonial and apartheid period, particularly extraordinary levels of urban violence. Further, humiliating police harassment, a violent prison system and state sponsorship of township violence undermined the rule of law. These conditions, unique to South Africa, nurtured a culture of violence that has reproduced itself in the post-apartheid period (csvr, 2010). The psychological legacy of colonial racial oppression and institutionalised racial domination in the form of internalised feelings of low self-worth, is also likely to be a contributing factor to the problem of violent crime in South Africa. Other structural economic factors closely linked to violence are high levels of poverty, structural unemployment, and social and political exclusion and marginalisation as set out in the foregoing sections. These factors are shaped by the legacy of apartheid as well as by the global economic context and domestic economic policies in the post-apartheid period. This is further entrenched by easy availability of firearms and a culture of impunity in some townships (csvr, 2020). The crime prevention strategy for the Eastern Cape focuses on strengthening communities against crime, preventing violence, preventing corruption and strengthening the criminal justice system. The Eastern Cape Department of Safety and Liaison reports that crimes of particular concern for the Eastern Cape are: crimes involving fire-arms which have significantly increased the level of violence associated with crime; organised crime, including the organised smuggling of narcotics and human trafficking; Gender Based Violence and crimes against women and children; violence associated with inter-group conflict, such as political conflicts, taxi violence and land disputes; vehicle theft and hijacking; and corruption within the criminal justice system.
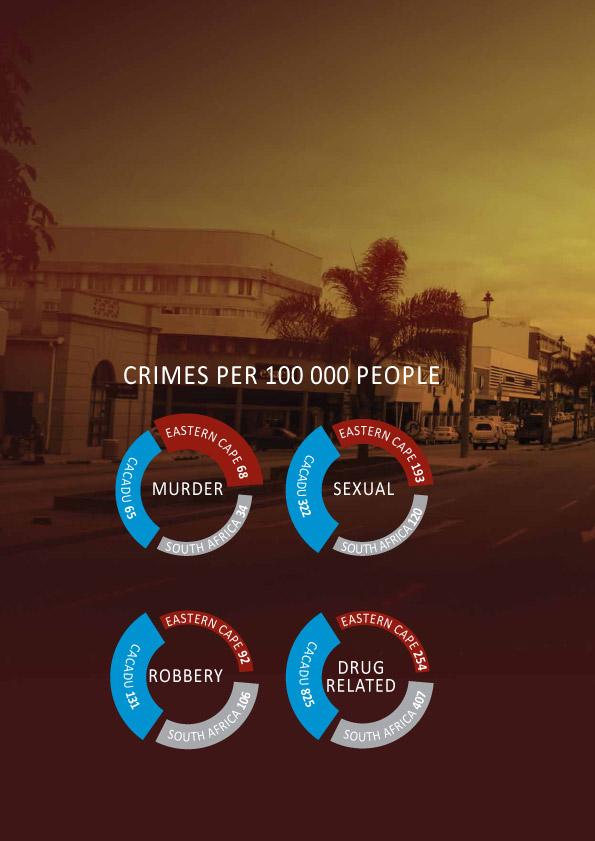
47 2014 socio-economic profile report 45 MURDER AND SEXUAL CRIMES Number of cases of murder Number of cases of sexual crimes MURDER MURDER SEXUAL crimes SEX % Change (y/y) % Change (y/y) MURDER There were 249 murders in 2013 in the Cacadu district compared with 255 the year before. Accordingly, there has been a downward trend with murders decreasing by an annual average rate of 3.0% annually since This decrease is better than the national average which has declined by 2.1% pa since Attempted murder declined by an annual average rate of 4.6%. This is below the national average (which declined by 7%) and the provincial average (which declined by 7.2%). Nevertheless, the murder rate in the Cacadu district remains high at 65 murders per people - the rate for South Africa and the Eastern Cape is 34 and 68 murders per respectively. SEXUAL crimes Sexual crimes have been increasing moderately at an average of 0.2% pa since In 2013, sexual crimes were reported. The district has 322 sexual crimes per people. This is higher than the rate for South Africa (120 sexual crimes per people) and the Eastern Cape (193 sexual crimes per people). Number of cases of murder % Change (y/y) Number of cases of sexual crime % Change (y/y) Definition: Murder is a social contact crime resulting in the loss of life of the victim, but excludes cases where the loss of life occurred as a result of a response to a crime, i.e. self defence. The concept of sexual crimes includes rape (updated to the new definition of rape to provide for the inclusion of male rape), sex work, pornography, public indecency and human trafficking. Data source: Quantec, saps Data note: The police station areas have been generalised around point objects.
48 socio-economic profile report ROBBERY COMMON robbery Although 507 common robberies were reported in 2013, there has been a substantial reduction since 2008 when 690 common robberies were reported. The average rate of decline is 2.1% pa since 2004 compared with a decline of 6.4 % for South Africa and 8.4% for the Eastern Cape. The common robbery rate in Cacadu (131 common robberies per ) is higher than both South Africa (106 common robberies per ) and the Eastern Cape (92 common robberies per ). Number of cases of common robbery COMMON ROBBERY COMMON ROBBERY % CHANGE IN common robbery (Y/Y) % Change (y/y) AGGRAVATED robbery AGGRAVATED robbery % CHANGE IN AGGravateD robbery (Y/Y) Number of cases of aggravated robbery % Change (y/y) Definition: In a common robbery incident, offenders usually do not have a firearm. In order to execute the robbery, they use swift action and the element of surprise to ensure that they manage to take the victim s possessions. Data source: Quantec, saps Data note: The police station areas have been generalised around point objects. Number of cases common robbery % Change (y/y) Number of cases of aggravated robbery % Change (y/y)
49 2014 socio-economic profile report 47 DRIVING UNDER THE influence OF alcohol AND DRUG-RELATED CRIME Number of cases of driving under the influence of alcohol Number of cases of drug- related crimes DRIVING UNDER THE INFLUENCE OF ALCOHOL ALCOHOL % CHANGE IN alcohol (Y/Y) DRUG-RELATED CRIME DRUGS % CHANGE IN DRUGS (Y/Y) % Change (y/y) % Change (y/y) DRIVING under THE influence OF alcohol The number of cases of driving under the influence of alcohol or drugs has increased substantially over the past few years in South Africa, the Eastern Cape and Cacadu. In Cacadu, only 524 incidents were dealt with in 2004 compared with 946 in This represents an increase of 8.5% pa since However, this is lower than the national growth rate (12.5% pa), but only just lower than the provincial growth rate (10.4% pa). DRUG-relateD CRIME Drug related crimes have increased in both the Eastern Cape and South Africa. A similar trend is exhibited in the Cacadu area and drug related crimes have increased by an average of 10.5% pa since This is compared to an increase of 14.2% pa since 2005 for the whole of South Africa and 6.3% for the Eastern Cape. The rate of offences per people for drug related crime is relatively low in the Eastern Cape (254 per people) compared to the Cacadu district area (825 per people). The national rate stands at 407 per people. Number of cases of drunk driving % Change (y/y) Number of cases of drug-related crime % Change (y/y) Definition: Driving under the influence of alcohol refers to the situation where the driver of a vehicle is found to be over the legal bloodalcohol limit. This is a crime detected through police activity rather than reports by members of the public. Drug-related crime refers to the situation where the perpetrator is found to be in possession of, under the influence of, or selling illegal drugs. This is a crime detected through police activity rather than reports by members of the public. An increase in crimes of this nature may therefore reflect an increase in police activity and visibility. Data source: Quantec, saps Data note: The police station areas have been generalised around point objects.
50
51
52 socio-economic profile report SERVices and infrastructure Ensuring availability of clean water, adequate sanitation, light and heat and decent housing, are critical in overcoming poverty. In the context of persistent inequalities and social divisions, delays in obtaining services, lower levels of service and relatively high levels of disconnection in poor communities perpetuate undignified living conditions. Basic services form an important part of a constitutionally guaranteed social safety net in South Africa. And while there has been significant progress in providing access to electricity since 2000, there are still other significant backlogs, particularly in the areas of sanitation, refuse removal and piped water. There are also great variations across the province. Large numbers of people have no (or intermittent) access and current funding formulas are inadequate to address the historical backlog. The poor quality of low cost housing is often exacerbated by municipal failure in delivery of electricity, water and sanitation. Spatial patterns still manifest themselves in the inherited structure of the colonial, apartheid and Bantustan economies. The greatest spatial contrasts are between the former homeland areas and those of the former South Africa; between rural and urban areas; and between townships and suburbs. These have largely been exacerbated by spatial and human settlement policy since Factors that undercut the impact on poverty of basic-service programmes include: service delivery is driven by agencies organised on sectoral lines and co-ordination is difficult. Moreover, municipalities with a particularly large number of poor households typically have lower incomes, making it more difficult to manage assets, operations and maintenance. rural-urban migration and the rapid growth in the number of households continues to increase the demand for services, particularly around the urban areas. the failure to overcome apartheid settlement patterns, with townships largely distant from economic centres and spread out, raises the cost of infrastructure and transport and generally adds to residents cost of living and the difficulty of finding employment.
53 2014 socio-economic profile report 51 WATER Proportion of households with piped water inside the dwelling (%) ACCESS TO WATER WATER RATIO ACCESS TO WATER BY category (2013) Percentage of total (%) The Constitution of South Africa states that everyone should have access to water and specifies that the state must take reasonable measures to achieve this right. Piped water is accessed by 38.6% of South Africa s households with a further 25.7% having piped water inside their yard. A further 24.9% has piped water on community stands % of these are more than 200m from their dwellings. Almost a tenth relies on a natural water supply (boreholes, rainwater tanks, dams, rivers, streams, or springs). The Eastern Cape lags behind the South African average with 23.7% enjoying piped water and 16.6% having piped water inside their yard. More than a quarter relies on dams, rivers, streams, or springs. Only rely on a water carrier, tanker or water vendor for their water requirements. Since 1995, when South African households had water piped into their yards, there has been a further annual growth rate of 2.5%, which has added additional households. By 2010 just over half a million households had piped water. Other/nnspecified/dummy Water-carrier/tanker/water vendor Dam/river/stream/spring Borehole/rain-water tank/well Piped water on community stand: distance greater than 200m from dwelling Piped water on community stand: distance less than 200m from dwelling Piped water inside yard Piped water inside dwelling Number of households Proportion of houses with piped water inside dwelling (%) % Change (y/y) Definition: The relevant basic service levels (RDP service levels) are defined as a minimum quantity of 25 litres of potable water per person per day within 200 meters of a household not interrupted for more than seven days in any year and a minimum flow of 10 litres per year for communal water points. This is a substantially higher standard than the basic services defined by MDGs as 20 litres of potable water per person per day within metres of a household. Data source: Quantec*
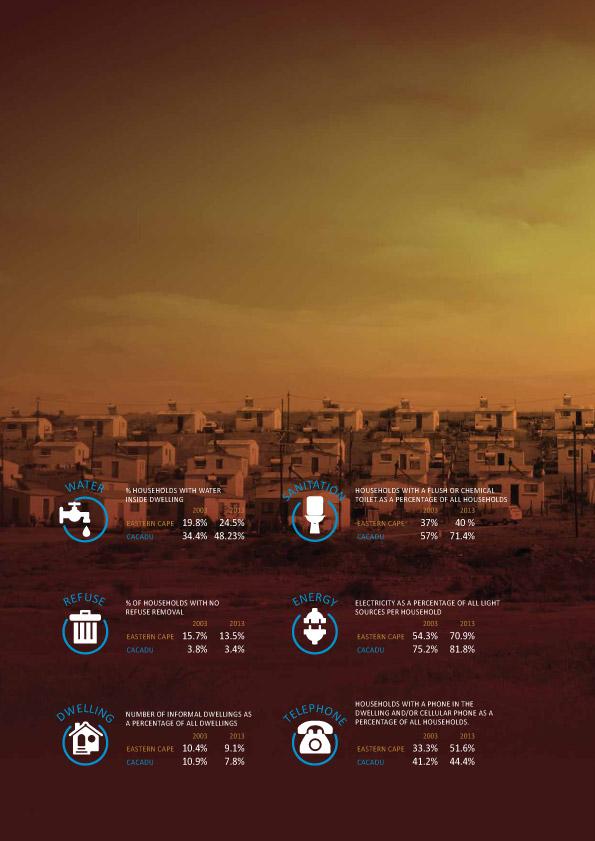
54 socio-economic profile report SANITATION Sanitation service levels reflect those of water, as flush toilets tend to be more closely aligned to the establishment of formal houses. Therefore buckets are usually provided to informal settlements as an interim measure until the establishment of a formal human settlement. In 2013 South Africa had 57.7% flush or chemical toilets, 25.8% pit latrines and 2.7% buckets. The Eastern Cape, by contrast, had only 38.7% flush or chemical toilets, 27.2% pit latrines and 3.6% buckets. Cacadu had 71.4% flush or chemical toilets, 13.1% pit latrines and 8.0% bucket latrines. Proportion of households with a flush or chemical toilet (%) ACCESS TO SANITATION SANITATION RATIO ACCESS TO SANITATION BY category (2013) Percentage of total (%) Unspecified/Dummy None of the above Bucket latrine Pit latrine Flush or chemical toilet Definition: A basic acceptable sanitation facility is defined as a ventilated improved pit latrine. Millennium Development Goal (Target 10): Halve by 2015 the proportion of people without sustainable access to improved sanitation. Data source: Quantec* Number of households Proportion of households with a flush or chemical toilet (%) % Change (y/y)
55 2014 socio-economic profile report 53 REFUSE Proportion of households with no form of removal (%) ACCESS TO REFUSE REMOVAL REFUSE RATIO Refuse removal is essential for safe and healthy living conditions. This is especially true in urban areas. There are many households that provide for their own refuse removal or use a communal refuse dump. In the Cacadu district service delivery levels for refuse removal have improved and are high measured against national and provincial standards. The proportion of households without rubbish disposal has decreased from 3.66% in 1995 to 3.42% in Local authorities have improved their service and are now servicing 82.2% of households compared to only 61.1% in ACCESS TO REFUSE REMOVAL BY CATEGORY (2013) Percentage of total (%) No rubbish disposal Own refuse dump Communal refuse dump Removed by local authority less often Removed by local authority at least once a week Unspecified/other Number of households Proportion of houses with no form of refuse removal (%) % Change (y/y) Definition: The availability of refuse removal services to the household, categorised according the nature and timing of the refuse removal service. Data source: Quantec* Data note: *Please consult the attached metadata documents
56 socio-economic profile report LIGHTING Everyone needs energy for cooking and for warmth during cold spells. Electricity is an important source of energy in that it is safe and the easiest source to use. Although there are efforts to provide electricity universally, there are still shortfalls. Nevertheless it is encouraging to see the proportion of households that use electricity. In the Cacadu district the proportion of households with access to electricity is higher than in the Eastern Cape. The proportion has increased from just under two thirds in 1995 to 82.4% in The number of households that rely on paraffin has halved from 25.3% to 11.6% over the same period. Proportion of households not using electricity as a source of lighting (%) ENERGY for LIGHTING LIGHTING RATIO ENERGY for LIGHTING BY category (2013) Percentage of total (%) Candles Paraffin Gas Electricity Solar/other/unspecified Definition: The source of lighting in a household, categorised by type. The lighting ratio refers to the number of households which derive lighting from electricity. Data source: Quantec* Number of households Proportion of electrified households (%) % Change (y/y)
57 2014 socio-economic profile report 55 HOUSING Proportion of informal dwellings (%) ACCESS TO HOUSING DWELLING RATIO Despite the delivery of 2.5 million houses in South Africa since 1994, higher rates of housing delivery are still needed. In the Cacadu district, informal structures (either a house/ flat/room in a backyard or informal dwelling/shacks) comprised 7.9% of total dwellings in In 1995 informal structures made up 13.0% of housing units. On average 79.0% of housing units are formal houses or brick structures on separate yards or stands. This compares very favourably with South Africa at 58.2% and the Eastern Cape at 46.0%. The number of brick structures has increased by 0.4% pa since 2005 compared to South Africa s 1.4% and the Eastern Cape s 1.8%. ACCESS TO HOUSING BY category (2013) Other/unspecified/NA Room/flatlet not in backyard but on a shared property Informal dwelling/shack, NOT in backyard, e.g. in an informal settlement Informal dwelling/shack, in backyard Percentage of total (%) Traditional dwellings make up 4.5% of total housing units in Cacadu. The number of traditional units has been decreasing by 3.6% pa since On average, 2% of Cacadu s housing units are flats in blocks of flats. This is in contrast to 5% of the province s housing units and 5% of South Africa s housing units. There has been a steady relative decline in the number of flats in blocks of flats. House/flat/room, in backyard Town/cluster/semi-detached house (simplex, duplex or triplex) Flat in a block of flats Traditional dwelling/hut/ structure made of traditional materials House or brick structure on a separate stand or yard Number of households Proportion of dwelling which are classified as informal (%) % Change (y/y) Definition: The total number of dwellings of any kind, categorised by type of dwelling. The population to dwelling ratio gives an indication of the number of people per dwelling, which represents a measure of the burden on housing services. The dwelling ratio gives an indication of the households that live in informal dwellings or shacks in an informal settlement or backyard. Data source: Quantec*
58 socio-economic profile report TELEPHONE Modern communication technology plays a critical role in both the economic and the social lives of a region s citizens. A well established telecommunications network can improve both the competiveness and efficiency of local business while also encouraging the development of new business ventures. Telecommunications also improves the ability of people to find employment. In 2013 there was one phone (either a private telephone or one nearby) per 3.73 persons in the Cacadu district. The number of telephones in the area has increased from in 1995 to in However, mobile phones are more common as many people do not have access to fixed landlines. Proportion of households with a phone in the dwelling and/or cellular phone (%) access to telephone PHONE RATIO ACCESS TO TELEPHONE BY category (2013) Percentage of total (%) NA (institution)/ unspecified/none At another location nearby At another location, not nearby At a neighbour nearby At a public telephone nearby In this dwelling and/ or cellular phone Definition: The number of households with access to a telephone, categorised by the relative location of the telephone. The population to telephone ratio gives an indication of the number of people per telephone, which represents a measure of the burden on telephone services. The phone ratio refers to the proportion of households with a phone inside the dwelling and/or cellular phone. Data source: Quantec* Number of households Proportion of households with a phone in the dwelling and/or cellular phone % Change (y/y)
59
60
61
62 socio-economic profile report HEALTH The South African Constitution and the Bill of Rights uphold the right to health as a fundamental human right. One of the fundamental principles informing the new system of healthcare for the province is the aim of providing universal healthcare services. For 88 percent of people in the province, their source of health services is almost exclusively the public health system. Access to good quality healthcare services, equity in health services, and affordability of healthcare services are the goals of the PDP. The province suffers from a quadruple burden of disease: HIV and AIDS and Tuberculosis; maternal and child mortality; non-communicable diseases; and injury and violence. Health system challenges pertain to leadership, poor financial resourcing and management and dilapidated infrastructure and loss of a caring ethos. The provincial development plan suggests a shift from curative to a preventative primary healthcare focus with a well-developed district health system. The central challenges of the provincial health system are the poorly functioning primary healthcare system and the district health system within a generally hospi-centric health system. To achieve this, the health system requires increased resources, infrastructure upgrades, a greater fiscal allocation, workforce skills, and investment in technology, health facilities, and equipment.
63 2014 socio-economic profile report 61 HIV/AIDS Number of people with HIV Number of AIDS related deaths HIV INFECTIONS HIV % CHANGE IN HIV (Y/Y) AIDS-related deaths AIDS RELATED DEATHS % CHANGE IN AIDs-relateD DeatHS (Y/Y) AIDS/death ratio % Change (y/y) % Change (y/y) AIDS to total deaths ratio (%) South Africa has one of the highest Hiv-prevalence rates in the world and is home to the world s largest population of people living with HIV. In 2013 there were an estimated 5.9 million people infected with AIDS, representing 11.5% of the population. The infection rate is lower in the Eastern Cape (10.3% of the population) and Cacadu (11.4% of the population). The Eastern Cape accounts for 11.9% of South Africa s Hiv-positive people while the district accounted for 0.74%. The vulnerability of people to HIV infection is exacerbated by poverty, which apart from being associated with poor nutrition and a breakdown of immune systems, also translates into unsafe sexual practices because of lack of knowledge and access to means of protection. Labour migration, induced by rural poverty, has also contributed to the spread of the disease. The HIV/AIDS pandemic has a negative economic impact on society but especially on patients and their families through spending on diagnosis and treatment, transport to get to healthcare facilities, and the time lost from work. Households tend to incur much higher direct costs for treatment than for any other disease. The pervasiveness of this disease has resulted in lower life expectancy and a generally lower standard of living (see section on the HDI). At the beginning of 2011 it was estimated that 1.2 million South Africans were receiving antiretroviral treatment through the public sector treatment programme. However, while South Africa now has the largest HIV treatment programme in the world, less that 60% of South Africans requiring treatment is covered mostly because of major capacity and infrastructure constraints in the public health service. Number of new cases of HIV/AIDS % Change (y/y) Number of AIDS-related deaths Ratio of AIDS-related deaths to total deaths Definition: The estimated number of people who have been infected with the Human Immunodeficiency Virus (HIV) that causes Acquired Immunodeficiency Syndrome (AIDS) or the number of people who have died from AIDS-related deaths. Data source: Quantec*
64 socio-economic profile report TUBERCULOSIS (TB) The country is also struggling with tuberculosis (TB), maternal and child mortality, non communicable diseases, and violence, injuries and trauma. South Africa is ranked fifth by the WHO on the list of 22 countries in the world with a high burden of TB, with the prevalence of TB now being closely associated with HIV. The TB situation has been aggravated by the emergence of new drugresistant strains. In 2012 there were just over people suffering with TB in South Africa. 15.6% or just over lived in the Eastern Cape and (1.4%) lived in the Cacadu district. The infection rate is growing by 4.6% pa in South Africa, although it is higher in the Eastern Cape (4.9% pa) but lower in Cacadu (1.4% pa). Number of people with TB TUBERCULOSIS (TB) TUBERCULOSIS (TB) Definition: The estimated number of people who have been infected with tuberculosis bacterium. Data source: hst Number of new cases of % Change (y/y) tuberculosis (all TB)

65
66
67
68 socio-economic profile report SOUTH AFRICA Ave. Growth Rate (5-Year) Ave. Growth Rate (10-Year) economic GrowtH AND transformation Regional Gross Domestic Product (GDP-R) Rm, p 3.40 p Regional Gross Domestic Product (GDP-R) per Capita R, p 3.40 p Gross Value Added (GVA) Rm, p 3.40 p Gross Operating Surplus (GOS) Rm, p 3.92 p Total Output Rm, p 3.51 p Intermediate Consumption Rm, p 3.60 p Tress Index for 10 Industries Index p 0.77 p Tress Index for 23 Industries Index p 0.18 p DEMOGRAPHICS Population Number p 1.20 p Number of Households Number p 1.16 p poverty AND INCOME Human Development Index (HDI) Index q q Gini Coefficient Coefficient q q Number of People in Poverty Number q q Poverty rate % q q No Schooling: Persons Aged 15+ Years Number q q Illiteracy: Persons Aged 20+ Years Number q q Population Density Persons per km² p 1.16 p Total Household Disposable Income Rm, p 4.13 p Total Household Expenditure Rm, p 4.19 p LABOUR MARKET Economically Active Population (eap) Number p 1.31 p Labour Force Participation Rate Rate (%) q q Number of Unemployed Number p q Rate of Unemployment Rate (%) p q Number of Formally Employed Number q 0.39 p Number of Informally Employed Number p 7.38 p Total Number of Employed Number p 1.98 p Employment Rate Rate (%) q 0.66 p CRIME * Number of Cases of Murder Number q - Number of Cases of Sexual Crimes Number q - Number of Cases of Common Robbery Number q - Number of Cases of Drug-related Crimes Number p - Number of Cases of Driving Under the Influence of Alcohol Number p - infrastructure and SERVices Proportion of Houses With Piped Water Ratio (%) p 1.23 p Inside Dwelling Proportion of Households With a Flush or Ratio (%) p 0.37 p Chemical Toilet Proportion of Houses With No Form of Ratio (%) q q Refuse Removal Proportion of Electrified Households Ratio (%) p 1.01 p Proportion of Dwellings Which are Ratio (%) q q Classified as Informal Proportion of Households With a Phone in the Dwelling and/or Cellular Phone Ratio (%) p 2.35 p health Number of New Cases of HIV Number p 2.91 p Number of AIDS Related Deaths Number p 3.28 p AIDS Related Deaths as a Proportion of All Rate (%) p 4.37 p Deaths Number of New Cases of Tuberculosis (All TB) * Number q - Trend* * Notes: 1. Crime data only available from 2004 onwards. Crime trend graphs from 2004 onwards. 2. Trend graphs show trend for the last 10 years. 3. TB data only available from 2007 onwards. Trend graph from TB from 2007 onwards.
69 2014 socio-economic profile report 67 EASTERN CAPE Ave. Growth Rate (5-Year) Ave. Growth Rate (10-Year) economic GrowtH AND transformation Regional Gross Domestic Product (GDP-R) Rm, p 3.22 p Regional Gross Domestic Product (GDP-R) R, p 3.22 p per Capita Gross Value Added (GVA) Rm, p 3.22 p Gross Operating Surplus (GOS) Rm, p 4.00 p Total Output Rm, p 3.17 p Intermediate Consumption Rm, p 3.13 p Tress Index for 10 Industries Index p 0.34 p Tress Index for 23 Industries Index p 0.22 p DEMOGRAPHICS Population Number p 0.50 p Number of Households Number p 1.03 p poverty AND INCOME Human Development Index (HDI) Index q q Gini Coefficient Coefficient p 0.51 p Number of People in Poverty Number q q Poverty rate % q q No Schooling: Persons Aged 15+ Years Number q q Illiteracy: Persons Aged 20+ Years Number q q Population Density Persons per p 0.57 p km² Total Household Disposable Income Rm p 5.44 p Total Household Expenditure Rm p 5.29 p LABOUR MARKET Economically Active Population (eap) Number p 0.81 p Labour Force Participation Rate Rate (%) q q Number of Unemployed Number p q Rate of Unemployment Rate (%) p q Number of Formally Employed Number q q Number of Informally Employed Number p 6.61 p Total Number of Employed Number q 1.16 p Employment Rate Rate (%) q 0.35 p CRIME * Number of Cases of Murder Number q - Number of Cases of Sexual Crimes Number q - Number of Cases of Common Robbery Number q - Number of Cases of Drug-related Crimes Number p - Number of Cases of Driving Under the Influence of Alcohol Number p - infrastructure and SERVices Proportion of Houses With Piped Water Ratio (%) p 1.82 p Inside Dwelling Proportion of Households With a Flush or Ratio (%) p 0.55 p Chemical Toilet Proportion of Houses With No Form of Ratio (%) q q Refuse Removal Proportion of Electrified Households Ratio (%) p 2.37 p Proportion of Dwellings Which are Ratio (%) q q Classified as Informal Proportion of Households With a Phone in the Dwelling and/or Cellular Phone Ratio (%) p 4.14 p health Number of New Cases of HIV Number p 3.69 p Number of AIDS Related Deaths Number p 4.73 p AIDS Related Deaths as a Proportion of All Rate (%) p 5.61 p Deaths Number of New Cases of Tuberculosis (All TB) * Number q - Trend* * Notes: 1. Crime data only available from 2004 onwards. Crime trend graphs from 2004 onwards. 2. Trend graphs show trend for the last 10 years. 3. TB data only available from 2007 onwards. Trend graph from TB from 2007 onwards.
70 socio-economic profile report CACADU Ave. Growth Rate (5-Year) Ave. Growth Rate (10-Year) economic GrowtH AND transformation Regional Gross Domestic Product (GDP-R) Rm, p 3.66 p Regional Gross Domestic Product (GDP-R) R, p 3.66 p per Capita Gross Value Added (GVA) Rm, p 3.66 p Gross Operating Surplus (GOS) Rm, p 4.19 p Total Output Rm, p 4.09 p Intermediate Consumption Rm, p 4.44 p Tress Index for 10 Industries Index p 1.68 p Tress Index for 23 Industries Index p 0.28 p DEMOGRAPHICS Population Number q q Number of Households Number q q poverty AND INCOME Human Development Index (HDI) Index p 0.14 p Gini Coefficient Coefficient p 1.33 p Number of People in Poverty Number q q Poverty rate % q q No Schooling: Persons Aged 15+ Years Number q q Illiteracy: Persons Aged 20+ Years Number q q Population Density Persons per p q km² Total Household Disposable Income Rm, p 1.93 p Total Household Expenditure Rm, p 2.37 p LABOUR MARKET Economically Active Population (eap) Number p q Labour Force Participation Rate Rate (%) q q Number of Unemployed Number p 4.43 p Rate of Unemployment Rate (%) p 5.87 p Number of Formally Employed Number q q Number of Informally Employed Number p 4.08 p Total Number of Employed Number q q Employment Rate Rate (%) q q CRIME * Number of Cases of Murder Number q - Number of Cases of Sexual Crimes Number q - Number of Cases of Common Robbery Number q - Number of Cases of Drug-related Crimes Number p - Number of Cases of Driving Under the Influence of Alcohol Number p - infrastructure and SERVices Proportion of Houses With Piped Water Ratio (%) p 3.52 p Inside Dwelling Proportion of Households With a Flush or Ratio (%) p 2.31 p Chemical Toilet Proportion of Houses With No Form of Ratio (%) p q Refuse Removal Proportion of Electrified Households Ratio (%) p 0.92 p Proportion of Dwellings Which are Ratio (%) q q Classified as Informal Proportion of Households With a Phone in the Dwelling and/or Cellular Phone Ratio (%) p 0.84 p health Number of New Cases of HIV Number p 4.74 p Number of AIDS Related Deaths Number p 3.97 p AIDS Related Deaths as a Proportion of All Rate (%) p 4.38 p Deaths Number of New Cases of Tuberculosis (All TB) * Number q - Trend* * Notes: 1. Crime data only available from 2004 onwards. Crime trend graphs from 2004 onwards. 2. Trend graphs show trend for the last 10 years. 3. TB data only available from 2007 onwards. Trend graph from TB from 2007 onwards.
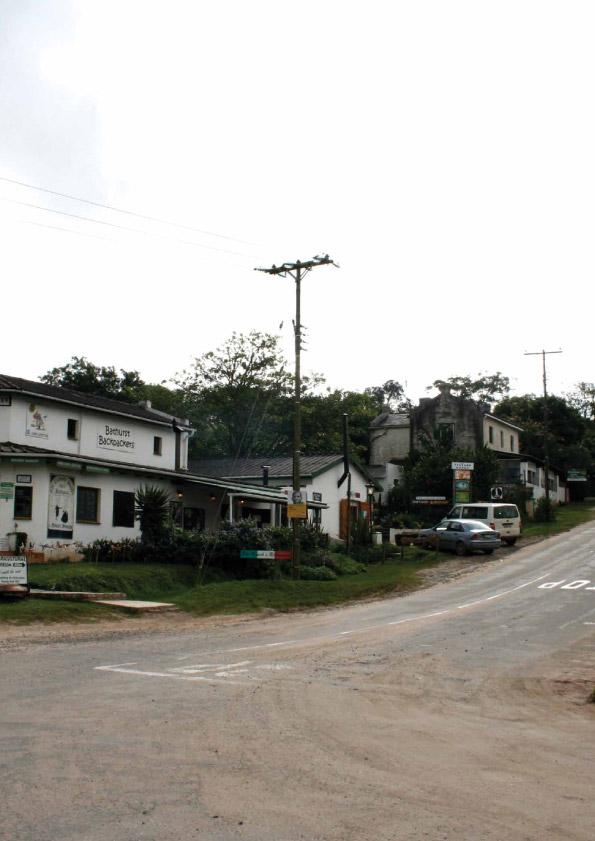
71
72 socio-economic profile report BAVIAANS LOCAL MUnicipalitY Ave. Growth Rate (5-Year) Ave. Growth Rate (10-Year) Trend* economic GrowtH AND transformation Regional Gross Domestic Product (GDP-R) Rm, p 3.29 p Regional Gross Domestic Product (GDP-R) R, p 3.29 p per Capita Gross Value Added (GVA) Rm, p 3.29 p Gross Operating Surplus (GOS) Rm, p 2.78 p Total Output Rm, p 3.41 p Intermediate Consumption Rm, p 3.52 p Tress Index for 10 Industries Index p 0.60 p Tress Index for 23 Industries Index p 0.16 p DEMOGRAPHICS Population Number q q Number of Households Number q q poverty AND INCOME Gini Coefficient Coefficient p 1.24 p Number of People in Poverty Number q q Poverty rate % q q No Schooling: Persons Aged 15+ Years Number q q Illiteracy: Persons Aged 20+ Years Number q q Population Density Persons per q q km² Total Household Disposable Income Rm, p q Total Household Expenditure Rm, p 0.71 p LABOUR MARKET Economically Active Population (eap) Number q q Labour Force Participation Rate Rate (%) q q Number of Unemployed Number p 9.13 p Rate of Unemployment Rate (%) p p Number of Formally Employed Number q q Number of Informally Employed Number q 4.17 p Total Number of Employed Number q q Employment Rate Rate (%) q q CRIME * Number of Cases of Murder Number q - Number of Cases of Sexual Crimes Number q - Number of Cases of Common Robbery Number q - Number of Cases of Drug-related Crimes Number p - Number of Cases of Driving Under the Influence of Alcohol Number p - infrastructure and SERVices Proportion of Houses With Piped Water Ratio (%) p 3.26 p Inside Dwelling Proportion of Households With a Flush or Ratio (%) p 2.67 p Chemical Toilet Proportion of Houses With No Form of Ratio (%) p p Refuse Removal Proportion of Electrified Households Ratio (%) p 1.43 p Proportion of Dwellings Which are Ratio (%) p 4.07 p Classified as Informal Proportion of Households With a Phone in the Dwelling and/or Cellular Phone Ratio (%) p 0.62 p * Notes: 1. Crime data only available from 2004 onwards. Crime trend graphs from 2004 onwards. 2. Trend graphs show trend for the last 10 years.
73 2014 socio-economic profile report 71 BLUE crane route local MUnicipalitY Ave. Growth Rate (5-Year) Ave. Growth Rate (10-Year) Trend* economic GrowtH AND transformation Regional Gross Domestic Product (GDP-R) Rm, p 1.71 p Regional Gross Domestic Product (GDP-R) R, p 1.71 p per Capita Gross Value Added (GVA) Rm, p 1.71 p Gross Operating Surplus (GOS) Rm, p 1.55 p Total Output Rm, p 2.18 p Intermediate Consumption Rm, p 2.54 p Tress Index for 10 Industries Index p 1.72 p Tress Index for 23 Industries Index p 0.07 p DEMOGRAPHICS Population Number q q Number of Households Number q q poverty AND INCOME Gini Coefficient Coefficient p 0.71 p Number of People in Poverty Number q q Poverty rate % q q No Schooling: Persons Aged 15+ Years Number q q Illiteracy: Persons Aged 20+ Years Number q q Population Density Persons per q q km² Total Household Disposable Income Rm, p 0.38 p Total Household Expenditure Rm, p 0.46 p LABOUR MARKET Economically Active Population (eap) Number q q Labour Force Participation Rate Rate (%) q q Number of Unemployed Number p 0.92 p Rate of Unemployment Rate (%) p 6.75 p Number of Formally Employed Number q q Number of Informally Employed Number q 0.63 p Total Number of Employed Number q q Employment Rate Rate (%) q q CRIME * Number of Cases of Murder Number q - Number of Cases of Sexual Crimes Number q - Number of Cases of Common Robbery Number q - Number of Cases of Drug-related Crimes Number p - Number of Cases of Driving Under the Influence of Alcohol Number q - infrastructure and SERVices Proportion of Houses With Piped Water Ratio (%) p 2.87 p Inside Dwelling Proportion of Households With a Flush or Ratio (%) p 2.45 p Chemical Toilet Proportion of Houses With No Form of Ratio (%) p q Refuse Removal Proportion of Electrified Households Ratio (%) p 1.52 p Proportion of Dwellings Which are Ratio (%) p 0.21 p Classified as Informal Proportion of Households With a Phone in the Dwelling and/or Cellular Phone Ratio (%) p 2.39 p * Notes: 1. Crime data only available from 2004 onwards. Crime trend graphs from 2004 onwards. 2. Trend graphs show trend for the last 10 years.
74
75 2014 socio-economic profile report 73 CAMDEBOO LOCAL MUnicipalitY Ave. Growth Rate (5-Year) Ave. Growth Rate (10-Year) Trend* economic GrowtH AND transformation Regional Gross Domestic Product (GDP-R) Rm, q 0.29 p Regional Gross Domestic Product (GDP-R) R, q 0.29 p per Capita Gross Value Added (GVA) Rm, q 0.29 p Gross Operating Surplus (GOS) Rm, q 0.64 p Total Output Rm, p 0.83 p Intermediate Consumption Rm, p 1.31 p Tress Index for 10 Industries Index p 0.89 p Tress Index for 23 Industries Index p 0.18 p DEMOGRAPHICS Population Number q q Number of Households Number q q poverty AND INCOME Gini Coefficient Coefficient q q Number of People in Poverty Number q q Poverty rate % q q No Schooling: Persons Aged 15+ Years Number q q Illiteracy: Persons Aged 20+ Years Number q q Population Density Persons per q q km² Total Household Disposable Income Rm, p q Total Household Expenditure Rm, p 0.00 q LABOUR MARKET Economically Active Population (eap) Number q q Labour Force Participation Rate Rate (%) q q Number of Unemployed Number p 4.37 p Rate of Unemployment Rate (%) p 6.85 p Number of Formally Employed Number q q Number of Informally Employed Number q 2.95 p Total Number of Employed Number q q Employment Rate Rate (%) q q CRIME * Number of Cases of Murder Number q - Number of Cases of Sexual Crimes Number q - Number of Cases of Common Robbery Number q - Number of Cases of Drug-related Crimes Number p - Number of Cases of Driving Under the Influence of Alcohol Number q - infrastructure and SERVices Proportion of Houses With Piped Water Ratio (%) p 1.32 p Inside Dwelling Proportion of Households With a Flush or Ratio (%) p 1.07 p Chemical Toilet Proportion of Houses With No Form of Ratio (%) p 3.46 p Refuse Removal Proportion of Electrified Households Ratio (%) p 0.68 p Proportion of Dwellings Which are Ratio (%) q q Classified as Informal Proportion of Households With a Phone in the Dwelling and/or Cellular Phone Ratio (%) p 0.40 p * Notes: 1. Crime data only available from 2004 onwards. Crime trend graphs from 2004 onwards. 2. Trend graphs show trend for the last 10 years.
76 socio-economic profile report IKWEZI LOCAL MUnicipalitY Ave. Growth Rate (5-Year) Ave. Growth Rate (10-Year) Trend* economic GrowtH AND transformation Regional Gross Domestic Product (GDP-R) Rm, p 6.59 p Regional Gross Domestic Product (GDP-R) R, p 6.59 p per Capita Gross Value Added (GVA) Rm, p 6.59 p Gross Operating Surplus (GOS) Rm, p 4.85 p Total Output Rm, p 7.19 p Intermediate Consumption Rm, p 7.75 p Tress Index for 10 Industries Index p 1.66 p Tress Index for 23 Industries Index p 0.39 p DEMOGRAPHICS Population Number p 0.91 p Number of Households Number q q poverty AND INCOME Gini Coefficient Coefficient p 0.50 p Number of People in Poverty Number q q Poverty rate % q q No Schooling: Persons Aged 15+ Years Number q q Illiteracy: Persons Aged 20+ Years Number q q Population Density Persons per p 1.06 p km² Total Household Disposable Income Rm, p 4.87 p Total Household Expenditure Rm, p 5.66 p LABOUR MARKET Economically Active Population (eap) Number p 0.35 p Labour Force Participation Rate Rate (%) q q Number of Unemployed Number p p Rate of Unemployment Rate (%) p p Number of Formally Employed Number p q Number of Informally Employed Number p 5.01 p Total Number of Employed Number p q Employment Rate Rate (%) q q CRIME * Number of Cases of Murder Number p - Number of Cases of Sexual Crimes Number q - Number of Cases of Common Robbery Number p - Number of Cases of Drug-related Crimes Number p - Number of Cases of Driving Under the Influence of Alcohol Number q - infrastructure and SERVices Proportion of Houses With Piped Water Ratio (%) p 0.73 p Inside Dwelling Proportion of Households With a Flush or Ratio (%) p 4.28 p Chemical Toilet Proportion of Houses With No Form of Ratio (%) q q Refuse Removal Proportion of Electrified Households Ratio (%) p 0.80 p Proportion of Dwellings Which are Ratio (%) p 2.02 p Classified as Informal Proportion of Households With a Phone in the Dwelling and/or Cellular Phone Ratio (%) p 0.96 p * Notes: 1. Crime data only available from 2004 onwards. Crime trend graphs from 2004 onwards. 2. Trend graphs show trend for the last 10 years.
77 2014 socio-economic profile report 75 KOU-KAMMA LOCAL MUnicipalitY Ave. Growth Rate (5-Year) Ave. Growth Rate (10-Year) Trend* economic GrowtH AND transformation Regional Gross Domestic Product (GDP-R) Rm, p 5.77 p Regional Gross Domestic Product (GDP-R) R, p 5.77 p per Capita Gross Value Added (GVA) Rm, p 5.77 p Gross Operating Surplus (GOS) Rm, p 6.34 p Total Output Rm, p 6.64 p Intermediate Consumption Rm, p 7.25 p Tress Index for 10 Industries Index p 0.45 p Tress Index for 23 Industries Index p q DEMOGRAPHICS Population Number p 1.64 p Number of Households Number p 1.57 p poverty AND INCOME Gini Coefficient Coefficient p 0.10 p Number of People in Poverty Number q q Poverty rate % q q No Schooling: Persons Aged 15+ Years Number q 0.00 q Illiteracy: Persons Aged 20+ Years Number p 0.97 p Population Density Persons per p 1.78 p km² Total Household Disposable Income Rm, p 4.32 p Total Household Expenditure Rm, p 4.93 p LABOUR MARKET Economically Active Population (eap) Number p q Labour Force Participation Rate Rate (%) p q Number of Unemployed Number p 4.36 p Rate of Unemployment Rate (%) p 4.57 p Number of Formally Employed Number p q Number of Informally Employed Number p 4.95 p Total Number of Employed Number p q Employment Rate Rate (%) q q CRIME * Number of Cases of Murder Number q - Number of Cases of Sexual Crimes Number q - Number of Cases of Common Robbery Number p - Number of Cases of Drug-related Crimes Number p - Number of Cases of Driving Under the Influence of Alcohol Number p - infrastructure and SERVices Proportion of Houses With Piped Water Ratio (%) p 1.50 p Inside Dwelling Proportion of Households With a Flush or Ratio (%) p 1.60 p Chemical Toilet Proportion of Houses With No Form of Ratio (%) p 5.09 p Refuse Removal Proportion of Electrified Households Ratio (%) p 0.14 p Proportion of Dwellings Which are Ratio (%) q q Classified as Informal Proportion of Households With a Phone in the Dwelling and/or Cellular Phone Ratio (%) p 0.58 p * Notes: 1. Crime data only available from 2004 onwards. Crime trend graphs from 2004 onwards. 2. Trend graphs show trend for the last 10 years.
78 socio-economic profile report KOUGA LOCAL MUnicipalitY Ave. Growth Rate (5-Year) Ave. Growth Rate (10-Year) Trend* economic GrowtH AND transformation Regional Gross Domestic Product (GDP-R) Rm, p 6.80 p Regional Gross Domestic Product (GDP-R) R, p 6.80 p per Capita Gross Value Added (GVA) Rm, p 6.80 p Gross Operating Surplus (GOS) Rm, p 7.59 p Total Output Rm, p 6.94 p Intermediate Consumption Rm, p 7.04 p Tress Index for 10 Industries Index p 2.72 p Tress Index for 23 Industries Index p 0.56 p DEMOGRAPHICS Population Number q 0.16 p Number of Households Number q q poverty AND INCOME Gini Coefficient Coefficient p 1.34 p Number of People in Poverty Number q q Poverty rate % q q No Schooling: Persons Aged 15+ Years Number q q Illiteracy: Persons Aged 20+ Years Number q q Population Density Persons per p 0.32 p km² Total Household Disposable Income Rm, p 3.84 p Total Household Expenditure Rm, p 4.10 p LABOUR MARKET Economically Active Population (eap) Number p q Labour Force Participation Rate Rate (%) q q Number of Unemployed Number p 5.58 p Rate of Unemployment Rate (%) p 5.91 p Number of Formally Employed Number q q Number of Informally Employed Number p 5.03 p Total Number of Employed Number q q Employment Rate Rate (%) q q CRIME * Number of Cases of Murder Number q - Number of Cases of Sexual Crimes Number q - Number of Cases of Common Robbery Number q - Number of Cases of Drug-related Crimes Number p - Number of Cases of Driving Under the Influence of Alcohol Number p - infrastructure and SERVices Proportion of Houses With Piped Water Ratio (%) p 2.87 p Inside Dwelling Proportion of Households With a Flush or Ratio (%) p 1.38 p Chemical Toilet Proportion of Houses With No Form of Ratio (%) q q Refuse Removal Proportion of Electrified Households Ratio (%) p 0.39 p Proportion of Dwellings Which are Ratio (%) q q Classified as Informal Proportion of Households With a Phone in the Dwelling and/or Cellular Phone Ratio (%) p 1.15 p * Notes: 1. Crime data only available from 2004 onwards. Crime trend graphs from 2004 onwards. 2. Trend graphs show trend for the last 10 years.
79 2014 socio-economic profile report 77 MAKANA LOCAL MUnicipalitY Ave. Growth Rate (5-Year) Ave. Growth Rate (10-Year) Trend* economic GrowtH AND transformation Regional Gross Domestic Product (GDP-R) Rm, p 2.23 p Regional Gross Domestic Product (GDP-R) R, p 2.23 p per Capita Gross Value Added (GVA) Rm, p 2.23 p Gross Operating Surplus (GOS) Rm, p 2.27 p Total Output Rm, p 2.82 p Intermediate Consumption Rm, p 3.42 p Tress Index for 10 Industries Index p 1.32 p Tress Index for 23 Industries Index p 0.45 p DEMOGRAPHICS Population Number q q Number of Households Number p 0.71 p poverty AND INCOME Gini Coefficient Coefficient q q Number of People in Poverty Number q q Poverty rate % q q No Schooling: Persons Aged 15+ Years Number q q Illiteracy: Persons Aged 20+ Years Number q q Population Density Persons per p q km² Total Household Disposable Income Rm, p 1.43 p Total Household Expenditure Rm, p 1.91 p LABOUR MARKET Economically Active Population (eap) Number p 0.52 p Labour Force Participation Rate Rate (%) q q Number of Unemployed Number p 4.61 p Rate of Unemployment Rate (%) p 4.07 p Number of Formally Employed Number q q Number of Informally Employed Number q 4.46 p Total Number of Employed Number q q Employment Rate Rate (%) q q CRIME * Number of Cases of Murder Number p - Number of Cases of Sexual Crimes Number q - Number of Cases of Common Robbery Number q - Number of Cases of Drug-related Crimes Number q - Number of Cases of Driving Under the Influence of Alcohol Number q - infrastructure and SERVices Proportion of Houses With Piped Water Ratio (%) p 5.72 p Inside Dwelling Proportion of Households With a Flush or Ratio (%) p 5.08 p Chemical Toilet Proportion of Houses With No Form of Ratio (%) q q Refuse Removal Proportion of Electrified Households Ratio (%) p 1.07 p Proportion of Dwellings Which are Ratio (%) q q Classified as Informal Proportion of Households With a Phone in the Dwelling and/or Cellular Phone Ratio (%) q q * Notes: 1. Crime data only available from 2004 onwards. Crime trend graphs from 2004 onwards. 2. Trend graphs show trend for the last 10 years.
80
81 2014 socio-economic profile report 79 NDLAMBE LOCAL MUnicipalitY Ave. Growth Rate (5-Year) Ave. Growth Rate (10-Year) Trend* economic GrowtH AND transformation Regional Gross Domestic Product (GDP-R) Rm, p 0.50 p Regional Gross Domestic Product (GDP-R) R, p 0.50 p per Capita Gross Value Added (GVA) Rm, p 0.50 p Gross Operating Surplus (GOS) Rm, p 0.77 p Total Output Rm, p 0.66 p Intermediate Consumption Rm, p 0.77 p Tress Index for 10 Industries Index p 1.01 p Tress Index for 23 Industries Index p 0.40 p DEMOGRAPHICS Population Number q q Number of Households Number q q poverty AND INCOME Gini Coefficient Coefficient q q Number of People in Poverty Number q q Poverty rate % q q No Schooling: Persons Aged 15+ Years Number q q Illiteracy: Persons Aged 20+ Years Number q q Population Density Persons per q q km² Total Household Disposable Income Rm, p q Total Household Expenditure Rm, p 0.44 p LABOUR MARKET Economically Active Population (eap) Number p q Labour Force Participation Rate Rate (%) q q Number of Unemployed Number p 4.37 p Rate of Unemployment Rate (%) p 5.96 p Number of Formally Employed Number q q Number of Informally Employed Number p 3.32 p Total Number of Employed Number q q Employment Rate Rate (%) q q CRIME * Number of Cases of Murder Number q - Number of Cases of Sexual Crimes Number q - Number of Cases of Common Robbery Number q - Number of Cases of Drug-related Crimes Number p - Number of Cases of Driving Under the Influence of Alcohol Number q - infrastructure and SERVices Proportion of Houses With Piped Water Ratio (%) p 3.49 p Inside Dwelling Proportion of Households With a Flush or Ratio (%) p 1.07 p Chemical Toilet Proportion of Houses With No Form of Ratio (%) q q Refuse Removal Proportion of Electrified Households Ratio (%) p 1.33 p Proportion of Dwellings Which are Ratio (%) q q Classified as Informal Proportion of Households With a Phone in the Dwelling and/or Cellular Phone Ratio (%) q 0.36 p * Notes: 1. Crime data only available from 2004 onwards. Crime trend graphs from 2004 onwards. 2. Trend graphs show trend for the last 10 years.
82 socio-economic profile report SUNDAY S RIVER VALLEY LOCAL MUnicipalitY Ave. Growth Rate (5-Year) Ave. Growth Rate (10-Year) Trend* economic GrowtH AND transformation Regional Gross Domestic Product (GDP-R) Rm, p 6.76 p Regional Gross Domestic Product (GDP-R) R, p 6.76 p per Capita Gross Value Added (GVA) Rm, p 6.76 p Gross Operating Surplus (GOS) Rm, p 7.68 p Total Output Rm, p 6.79 p Intermediate Consumption Rm, p 6.81 p Tress Index for 10 Industries Index p 1.36 p Tress Index for 23 Industries Index p q DEMOGRAPHICS Population Number q q Number of Households Number p 0.36 p poverty AND INCOME Gini Coefficient Coefficient q q Number of People in Poverty Number q q Poverty rate % q q No Schooling: Persons Aged 15+ Years Number q q Illiteracy: Persons Aged 20+ Years Number q q Population Density Persons per q q km² Total Household Disposable Income Rm, p 2.09 p Total Household Expenditure Rm, p 1.91 p LABOUR MARKET Economically Active Population (eap) Number q q Labour Force Participation Rate Rate (%) q q Number of Unemployed Number p q Rate of Unemployment Rate (%) p q Number of Formally Employed Number q q Number of Informally Employed Number p 5.24 p Total Number of Employed Number q q Employment Rate Rate (%) q 0.14 p CRIME * Number of Cases of Murder Number p - Number of Cases of Sexual Crimes Number q - Number of Cases of Common Robbery Number q - Number of Cases of Drug-related Crimes Number p - Number of Cases of Driving Under the Influence of Alcohol Number p - infrastructure and SERVices Proportion of Houses With Piped Water Ratio (%) p p Inside Dwelling Proportion of Households With a Flush or Ratio (%) p 4.51 p Chemical Toilet Proportion of Houses With No Form of Ratio (%) q q Refuse Removal Proportion of Electrified Households Ratio (%) p 1.50 p Proportion of Dwellings Which are Ratio (%) q q Classified as Informal Proportion of Households With a Phone in the Dwelling and/or Cellular Phone Ratio (%) p 2.39 p * Notes: 1. Crime data only available from 2004 onwards. Crime trend graphs from 2004 onwards. 2. Trend graphs show trend for the last 10 years.
83 2014 socio-economic profile report 81 Acknowledgements This socio-economic profile was compiled by ecsecc s Information and Knowledge Management Unit, supported by a team of student volunteer researchers from the Department of Economics, University of Fort Hare. ecsecc would like to thank Tinashe Mugumo Zimucha, Mpumelelo Booi, Nozuko Lawana, Phillip Ngonisa and Nyasha Mpofu for their hard work and dedication in the compilation of this district profile. Andrew Murray, ceo ecsecc DISCLAIMER: While every care is taken to ensure the accuracy of the data in this publication data or calculation errors may have occurred. ECSECC is not liable or responsible for any damages which may result from the use of this data. ISBN:
84
THE SUSTAINABLE DEVELOPMENT GOALS AND SOCIAL PROTECTION
 THE SUSTAINABLE DEVELOPMENT GOALS AND SOCIAL PROTECTION Ms Nelisiwe Vilakazi Acting Director General- Ministry of Social Development REPUBLIC OF SOUTH AFRICA Global Practitioners Learning Event Oaxaca,
ISBN JOE GQABI DISTRICT MUNICIPALITY DEVELOPMENT INDICATORS
 ISBN 9781920493585 JOE GQABI DISTRICT MUNICIPALITY DEVELOPMENT INDICATORS JUNE 2012 FOREWORD This report contains development indicators for Joe Gqabi District for the period 2000 to 2010. Indicators are
Monitoring the Performance of the South African Labour Market
 Monitoring the Performance of the South African Labour Market An overview of the South African labour market from 3 of 2010 to of 2011 September 2011 Contents Recent labour market trends... 2 A brief labour
Provincial Review 2016: KwaZulu-Natal
 Provincial Review 2016: KwaZulu-Natal KwaZulu-Natal has a strong role in South Africa s manufacturing and agriculture, and has its largest port and main North-South freight corridor. Its manufacturing
Published by ECSECC. Postnet Vincent, P/Bag X9063, Suite No 302, Vincent 5247
 ALFRED NZO DISTRICT MUNICIPALITY SOCIO ECONOMIC REVIEW AND OUTLOOK, 2017 Published by ECSECC Postnet Vincent, P/Bag X9063, Suite No 302, Vincent 5247 www.ecsecc.org 2017 Eastern Cape Socio Economic Consultative
Downloads from this web forum are for private, non commercial use only. Consult the copyright and media usage guidelines on
 Econ 3x3 www.econ3x3.org A web forum for accessible policy relevant research and expert commentaries on unemployment and employment, income distribution and inclusive growth in South Africa Downloads from
SWARTLAND SPATIAL DEVELOPMENT FRAMEWORK ADDENDUM F
 SWARTLAND SPATIAL DEVELOPMENT FRAMEWORK ADDENDUM F DEMOGRAPHIC PROFILE 2011 Census APRIL 2014 By CK Rumboll and Partners 1 1. Introduction Swartland Municipality is located on the north western boundary
Scenic Rim Regional Council Community Sustainability Indicators 2009
 Scenic Rim Regional Council Community Sustainability Indicators 2009 Draft July 2009 This report was commissioned by Scenic Rim Regional Council and the Queensland Government through the Boonah Rural Futures
SAKHISIZWE LOCAL MUNICIPALITY SOCIO ECONOMIC REVIEW AND OUTLOOK, 2017
 SAKHISIZWE LOCAL MUNICIPALITY SOCIO ECONOMIC REVIEW AND OUTLOOK, 2017 Published by ECSECC Postnet Vincent, P/Bag X9063, Suite No 302, Vincent 5247 www.ecsecc.org 2017 Eastern Cape Socio Economic Consultative
KING SABATA DALINDYEBO LOCAL MUNICIPAILTY SOCIO ECONOMIC REVIEW AND OUTLOOK, 2017
 KING SABATA DALINDYEBO LOCAL MUNICIPAILTY SOCIO ECONOMIC REVIEW AND OUTLOOK, 2017 0 P a g e Published by ECSECC Postnet Vincent, P/Bag X9063, Suite No 302, Vincent 5247 www.ecsecc.org 2017 Eastern Cape
Monitoring the Performance of the South African Labour Market
 Monitoring the Performance of the South African Labour Market An overview of the South African labour market for the Year ending 2011 5 May 2012 Contents Recent labour market trends... 2 A labour market
BUFFALO CITY METRO MUNICIPALITY SOCIO ECONOMIC REVIEW AND OUTLOOK, 2017
 BUFFALO CITY METRO MUNICIPALITY SOCIO ECONOMIC REVIEW AND OUTLOOK, 2017 Published by ECSECC Postnet Vincent, P/Bag X9063, Suite No 302, Vincent 5247 www.ecsecc.org 2017 Eastern Cape Socio Economic Consultative
MBHASHE LOCAL MUNICIPALITY SOCIO ECONOMIC REVIEW AND OUTLOOK, 2017
 MBHASHE LOCAL MUNICIPALITY SOCIO ECONOMIC REVIEW AND OUTLOOK, 2017 0 P a g e Published by ECSECC Postnet Vincent, P/Bag X9063, Suite No 302, Vincent 5247 www.ecsecc.org 2017 Eastern Cape Socio Economic
Monitoring the Performance of the South African Labour Market
 Monitoring the Performance of the South African Labour Market An overview of the South African labour market from 1 of 2009 to of 2010 August 2010 Contents Recent labour market trends... 2 A brief labour
WALTER SISULU LOCAL MUNICIPALITY SOCIO ECONOMIC REVIEW AND OUTLOOK, 2017
 WALTER SISULU LOCAL MUNICIPALITY SOCIO ECONOMIC REVIEW AND OUTLOOK, 2017 0 P a g e Published by ECSECC Postnet Vincent, P/Bag X9063, Suite No 302, Vincent 5247 www.ecsecc.org 2017 Eastern Cape Socio Economic
REPORT OF THE SELECT COMMITTEE ON FINANCE ON THE PROVINCIAL TREASURIES EXPENDITURE REVIEW FOR THE 2014/15 FINANCIAL YEAR, DATED 14 OCTOBER 2015
 REPORT OF THE SELECT COMMITTEE ON FINANCE ON THE PROVINCIAL TREASURIES EXPENDITURE REVIEW FOR THE 2014/15 FINANCIAL YEAR, DATED 14 OCTOBER 2015 1. Introduction and Background The Select Committee on Finance
A new national consensus and a new commitment to deliver were necessary to address the triple challenges of poverty, unemployment and inequality.
 Budget 2017 Introduction In delivering Budget 2017 in parliament, the finance minister, Pravin Gordhan, emphasised that South Africa was at a conjuncture which requires the wisdom of our elders to help
RAYMOND MHLABA LOCAL MUNICIPALITY SOCIO ECONOMIC REVIEW AND OUTLOOK, 2017
 RAYMOND MHLABA LOCAL MUNICIPALITY SOCIO ECONOMIC REVIEW AND OUTLOOK, 2017 0 P a g e Published by ECSECC Postnet Vincent, P/Bag X9063, Suite No 302, Vincent 5247 www.ecsecc.org 2017 Eastern Cape Socio Economic
SECTION SIX: Labour Demand Forecasting Model
 PAGE 115 SECTION SIX: Labour Demand Forecasting Model 6.1. INTRODUCTION The demand for labour up to 2010 according to the SIC sectors have been estimated through the development of a labour demand model.
MATRIX OF STRATEGIC VISION AND ACTIONS TO SUPPORT SUSTAINABLE CITIES
 Urban mission and overall strategy objectives: To promote sustainable cities and towns that fulfill the promise of development for their inhabitants in particular, by improving the lives of the poor and
Prepared by cde Khwezi Mabasa ( FES Socio-economic Transformation Programme Manager) JANUARY 2016
 JANUARY 2016") Prepared by cde Khwezi Mabasa ( FES Socio-economic Transformation Programme Manager) JANUARY 2016 Political Context: Social Democratic Values Social policy and the access to basic public goods are the
Prepared by cde Khwezi Mabasa ( FES Socio-economic Transformation Programme Manager) JANUARY 2016 Political Context: Social Democratic Values Social policy and the access to basic public goods are the
UNCTAD S LDCs REPORT 2013 Growth with Employment for Inclusive & Sustainable Development
 UNCTAD S LDCs REPORT 2013 Growth with Employment for Inclusive & Sustainable Development Media briefing on the Occasion of the Global Launch Dhaka: 20 November 2013 Outline q q q q q q q Information on
ADDRESSING PUBLIC PRIVATE SECTOR INEQUALITIES PROFESSOR EMERITUS YOSUF VERIAVA
 ADDRESSING PUBLIC PRIVATE SECTOR INEQUALITIES PROFESSOR EMERITUS YOSUF VERIAVA HEALTH INEQUALITY AND INEQUITY Disparity: Is there a difference in the health status rates between population groups? Inequality:
Rwanda. UNICEF/Gonzalo Bell. Education Budget Brief
 Rwanda Education Budget Brief Investing in child education in Rwanda 217/218 Education Budget Brief: Investing in child education in Rwanda 217/218 United Nations Children s Fund (UNICEF) Rwanda November
THE CONSTRUCTION SECTOR IN 2015
 THE CONSTRUCTION SECTOR IN 215 Article published in the Quarterly Review 216:2, pp. 25-32 BOX 2: THE CONSTRUCTION SECTOR IN 215 1 This Box reviews developments in the construction and real estate sectors
BUDGET SOUTH AFRICAN BUDGET: THE MACRO PICTURE. Key messages
 BUDGET CHILDREN AND THE SOUTH AFRICAN BUDGET: THE MACRO PICTURE UNICEF/Pirozzi Key messages The nearly 2 million children in South Africa account for more than a third of the country s population. South
Department of Policy and Strategic Planning
 SUMMARY OF MAIN FINDINGS EMERGING FROM NATIONAL MIDTERM REVIEW PROCESS By Motulu Molapo Department of Policy and Strategic Planning Ministry of Development Planning 1. INTRODUCTION: Lesotho is a small
TRADE, FINANCE AND DEVELOPMENT DID YOU KNOW THAT...?
 TRADE, FINANCE AND DEVELOPMENT DID YOU KNOW THAT...? The volume of the world trade is increasing, but the world's poorest countries (least developed countries - LDCs) continue to account for a small share
Monitoring the Performance of the South African Labour Market
 Monitoring the Performance of the South African Labour Market An overview of the South African labour market for the Year Ending 2012 8 October 2012 Contents Recent labour market trends... 2 A labour market
What has happened to inequality and poverty in post-apartheid South Africa. Dr Max Price Vice Chancellor University of Cape Town
 What has happened to inequality and poverty in post-apartheid South Africa Dr Max Price Vice Chancellor University of Cape Town OUTLINE Examine trends post-apartheid (since 1994) Income inequality Overall,
ECONOMIC GROWTH PROVINCIAL INTRODUCTION QUARTERLY DATA SERIES
 ISSUE 7 OCTOBER 2016 PROVINCIAL QUARTERLY DATA SERIES ECONOMIC GROWTH INTRODUCTION The Quarterly Economic Review is a statistical release compiled by the Eastern Cape Socio Economic Consultative Council
Monitoring the Performance of the South African Labour Market
 Monitoring the Performance of the South African Labour Market An overview of the South African labour market for the Year Ending 2012 6 June 2012 Contents Recent labour market trends... 2 A labour market
Monitoring the Performance
 Monitoring the Performance of the South African Labour Market An overview of the Sector from 2014 Quarter 1 to 2017 Quarter 1 Factsheet 19 November 2017 South Africa s Sector Government broadly defined
National Minimum Wage in South Africa: Quantification of Impact
 National Minimum Wage in South Africa: Quantification of Impact Asghar Adelzadeh, Ph.D. Director and Chief Economic Modeller Applied Development Research Solutions (ADRS) (asghar@adrs-global.com) Cynthia
Current ratio Liquidity ratio
 2.3.7.8 Current ratio The current ratio compares the value of a municipality's short-term assets (cash, bank deposits, etc.) with its short-term liabilities (creditors, loans due and so on). A higher current
Business Partners Limited SME Confidence Index
 Business Partners Limited SME Confidence Index Fourth Quarter of 2017: October December Issued February 2018 1 RATIONALE FOR THE BUSINESS PARTNERS LIMITED SME CONFIDENCE INDEX SMEs are often punted as
Housing backlog: Protests and the demand for Housing in South Africa BY ESTERI MSINDO PSAM
 Housing backlog: Protests and the demand for Housing in South Africa BY ESTERI MSINDO PSAM Housing delivery law and regulation Section 26 of the constitution stipulates that everyone has the right to adequate
BBB3633 Malaysian Economics
 BBB3633 Malaysian Economics Prepared by Dr Khairul Anuar L1: Economic Growth and Economic Policies www.lecturenotes638.wordpress.com Content 1. Introduction 2. Malaysian Business Cycles: 1972-2012 3. Structural
BROAD DEMOGRAPHIC TRENDS IN LDCs
 BROAD DEMOGRAPHIC TRENDS IN LDCs DEMOGRAPHIC CHANGES are CHALLENGES and OPPORTUNITIES for DEVELOPMENT. DEMOGRAPHIC CHALLENGES are DEVELOPMENT CHALLENGES. This year, world population will reach 7 BILLION,
Public Employment Programmes: Are They Working? Rudi Dicks 5 December 2016
 Public Employment Programmes: Are They Working? Rudi Dicks 5 December 2016 What did we inherit in 1994 SA economy had been shaped by apartheid policies and by a dependence on mining exports The apartheid
An overview of the South African macroeconomic. environment
 An overview of the South African macroeconomic environment 1 Study instruction Study Study guide: study unit 1 Study unit outcomes Once you have worked through this study unit, you should be able to give
Labour. Labour market dynamics in South Africa, statistics STATS SA STATISTICS SOUTH AFRICA
 Labour statistics Labour market dynamics in South Africa, 2017 STATS SA STATISTICS SOUTH AFRICA Labour Market Dynamics in South Africa 2017 Report No. 02-11-02 (2017) Risenga Maluleke Statistician-General
AMATHOLE DISTRICT MUNICIPALITY SOCIO ECONOMIC REVIEW AND OUTLOOK, 2017
 AMATHOLE DISTRICT MUNICIPALITY SOCIO ECONOMIC REVIEW AND OUTLOOK, 2017 Published by ECSECC Postnet Vincent, P/Bag X9063, Suite No 302, Vincent 5247 www.ecsecc.org 2017 Eastern Cape Socio Economic Consultative
Further ambitious social reforms are being proposed to tackle poverty, growth and inequality problems. The National Health Insurance
 Chapter 2 Inclusive Growth, Development and Fiscal Policy 2.1 Introduction South Africa experienced a long period of economic decline in the last decades of apartheid (1985 1994). In the immediate postapartheid
A Low Growth Trap Amidst the Skills Challenge in South Africa. Professor Haroon Bhorat DPRU, UCT 29 September 2016
 A Low Growth Trap Amidst the Skills Challenge in South Africa Professor Haroon Bhorat DPRU, UCT 29 September 2016 Outline The South African Economy: The Genesis of An Emerging Market Growth Trap Economic
Terms of Reference Development of the City of Tshwane Sustainability Financing Mechanism Strategy
 Terms of Reference Development of the City of Tshwane Sustainability Financing Mechanism Strategy 1. ABOUT THE SACN The South African Cities Network (SACN) as established in 2002, is a network of the nine
Human Development Indices and Indicators: 2018 Statistical Update. Nigeria
 Human Development Indices and Indicators: 2018 Statistical Update Briefing note for countries on the 2018 Statistical Update Introduction Nigeria This briefing note is organized into ten sections. The
BBB3633 Malaysian Economics
 BBB3633 Malaysian Economics Prepared by Dr Khairul Anuar L1: Economic Growth and Economic Policies www.notes638.wordpress.com Assessment Two assignments Assignment 1 -individual 30% Assignment 2 group
Tax Statistics Highlights A joint publication between National Treasury and the South African Revenue Service
 2345678901234567890123456789012345678901234567890123456789012345678901234567890123456789012345678901234567890123456789012345678901234567890123 123456789012345678901234567890123456789012345678901234567890123456789012345678901234567890123456789012345678901234567890123456789012345678901
Serbia. Country coverage and the methodology of the Statistical Annex of the 2015 HDR
 Human Development Report 2015 Work for human development Briefing note for countries on the 2015 Human Development Report Serbia Introduction The 2015 Human Development Report (HDR) Work for Human Development
New York, 9-13 December 2013
 SIXTH SESSION OF THE OPEN WORKING GROUP OF THE GENERAL ASSEMBLY ON SUSTAINABLE DEVELOPMENT GOALS New York, 9-13 December 2013 Statement of Mr. Paolo Soprano Director for Sustainable Development and NGOs
Country Presentation of Nepal
 Country Presentation of Nepal on Inclusion Presentation By: Ram Chandra Dhakal, Ph.D. Executive Director Centre for Economic Development and Administration(CEDA),Tribhuvan University, Nepal 1 ST ADB-Asia
Human Development Indices and Indicators: 2018 Statistical Update. Congo
 Human Development Indices and Indicators: 2018 Statistical Update Briefing note for countries on the 2018 Statistical Update Introduction Congo This briefing note is organized into ten sections. The first
Briefing note for countries on the 2015 Human Development Report. Lesotho
 Human Development Report 2015 Work for human development Briefing note for countries on the 2015 Human Development Report Lesotho Introduction The 2015 Human Development Report (HDR) Work for Human Development
Rwanda. Till Muellenmeister. National Budget Brief
 Rwanda Till Muellenmeister National Budget Brief Investing in children in Rwanda 217/218 National Budget Brief: Investing in children in Rwanda 217/218 United Nations Children s Fund (UNICEF) Rwanda November
The Presidency Department of Performance Monitoring and Evaluation
 The Presidency Department of Performance Monitoring and Evaluation Briefing to the Standing Committee on Appropriations on the Strategic Plan and Annual Performance Plan for the 2012/13 financial year
Meeting on the Post-2015 Development Agenda for LDCs, LLDCs and SIDS in Asia and the Pacific: Nepal s Perspective
 Meeting on the Post-2015 Development Agenda for LDCs, LLDCs and SIDS in Asia and the Pacific: Nepal s Perspective Yuba Raj Bhusal, Member Secretary National Planning Commission, Nepal Contents 1. Nepal:
Economic Standard of Living
 DESIRED OUTCOMES New Zealand is a prosperous society, reflecting the value of both paid and unpaid work. All people have access to adequate incomes and decent, affordable housing that meets their needs.
TURNING UNPAID DOMESTIC AND CARE WORK INTO DEVELOPMENT DIVIDENDS
 TURNING UNPAID DOMESTIC AND CARE WORK INTO DEVELOPMENT DIVIDENDS ISSUES AFFECTING ASIA-PACIFIC Asia Pacific is seeing high economic growth and a lowering of poverty rates. For example, from 2002 to 2012,
City of Utica Central Industrial Corridor ReVITALization Plan Appendix A. Socio-Economic Profile
 City of Utica Central Industrial Corridor ReVITALization Plan Appendix A. Socio-Economic Profile Population Graphic 1 City of Utica Population Change: 1960-2010 Since the 1960s, the population of Utica
1 statistics: and Protocols. List of Tier 1 statistics Published 282. aspx. Page 1 of 9. Notes for the list: the 2005 Tier 1 list.
 Tier 1 statisticss 2012 The following list of Tier1 statistics was approved by Cabinet in August 2012. Tier 1 statistics are the most important statistics, essential to understand how well New Zealand
RANDFONTEIN LOCAL MUNICIPALITY Municipal Profile
 introduction The Housing Development Agency ("HDA") is a national public development agency that promotes sustainable communities by making well located and appropriately planned land and buildings available
Oman. Country coverage and the methodology of the Statistical Annex of the 2015 HDR
 Human Development Report 2015 Work for human development Briefing note for countries on the 2015 Human Development Report Oman Introduction The 2015 Human Development Report (HDR) Work for Human Development
National Report for Ireland on Strategies for Social Protection And Social Inclusion
 National Report for Ireland on Strategies for Social Protection And Social Inclusion 2008-2010 Table of Contents Page 1. Common Overview...3 1.1 Assessment of Social Situation 3 1.2 Overall strategic approach...6
China s 12 th Five Year Plan
 China s 12 th Five Year Plan Hongbin Cai Guanghua School of Management Peking Unviersity 2011/12/21 1 Background of the Plan Theme and objectives of the Plan Specific Initiatives of the Plan Implications
Eswatini (Kingdom of)
") Human Development Indices and Indicators: 2018 Statistical Update Briefing note for countries on the 2018 Statistical Update Introduction (Kingdom This briefing note is organized into ten sections. The
Human Development Indices and Indicators: 2018 Statistical Update Briefing note for countries on the 2018 Statistical Update Introduction (Kingdom This briefing note is organized into ten sections. The
Eastern Cape General report
 Eastern Cape General report on the audit outcomes of local government MFMA 2012-13 Eastern Cape MFMA 2012-13 Our reputation promise/mission The Auditor-General of South Africa has a constitutional mandate
Montenegro. Country coverage and the methodology of the Statistical Annex of the 2015 HDR
 Human Development Report 2015 Work for human development Briefing note for countries on the 2015 Human Development Report Montenegro Introduction The 2015 Human Development Report (HDR) Work for Human
Human Development Indices and Indicators: 2018 Statistical Update. Russian Federation
 Human Development Indices and Indicators: 2018 Statistical Update Briefing note for countries on the 2018 Statistical Update Introduction This briefing note is organized into ten sections. The first section
Planning & Budgeting in South Africa: Some Reflections on Practices & Prejudices
 Planning & Budgeting in South Africa: Some Reflections on Practices & Prejudices Rasigan Maharajh World Economy Research Centre 9 th March 2012, Havana, Cuba Outline of Presentation 1. Introduction 2.
Simón Gaviria Muñoz Minister of Planning
 HLPF - ECOSOC High Level Inter-institutional 2030 Agenda & SDG Commission Simón Gaviria Muñoz Minister of Planning @simongaviria SimonGaviriaM New York, July 20, 2016 AGENDA 1. THE 2030 AGENDA AND THE
Universal Social Protection
 Universal Social Protection Universal old-age pensions in Botswana BOTSWANA UNIVERSAL OLD AGE PENSION Botswana s social protection (SP) programmes, including its universal, noncontributory old age pension,
Human Development Indices and Indicators: 2018 Statistical Update. Brazil
 Human Development Indices and Indicators: 2018 Statistical Update Briefing note for countries on the 2018 Statistical Update Introduction Brazil This briefing note is organized into ten sections. The first
Income and Non-Income Inequality in Post- Apartheid South Africa: What are the Drivers and Possible Policy Interventions?
 Income and Non-Income Inequality in Post- Apartheid South Africa: What are the Drivers and Possible Policy Interventions? Haroon Bhorat Carlene van der Westhuizen Toughedah Jacobs Haroon.Bhorat@uct.ac.za
Human Development Indices and Indicators: 2018 Statistical Update. Costa Rica
 Human Development Indices and Indicators: 2018 Statistical Update Briefing note for countries on the 2018 Statistical Update Introduction This briefing note is organized into ten sections. The first section
Human Development Indices and Indicators: 2018 Statistical Update. Switzerland
 Human Development Indices and Indicators: 2018 Statistical Update Briefing note for countries on the 2018 Statistical Update Introduction Switzerland This briefing note is organized into ten sections.
Human Development Indices and Indicators: 2018 Statistical Update. Argentina
 Human Development Indices and Indicators: 2018 Statistical Update Briefing note for countries on the 2018 Statistical Update Introduction Argentina This briefing note is organized into ten sections. The
ANNEX ANNEX. to the. Proposal for a COUNCIL DECISION. on guidelines for the employment policies of the Member States
 EUROPEAN COMMISSION Brussels, 22.11.2017 COM(2017) 677 final to the Proposal for a COUNCIL DECISION on guidelines for the employment policies of the Member States EN EN Guideline 5: Boosting the demand
Challenges in implementing SDGs, Paris Climate Agreement. Ms. Tuhina Sinha, Asst. Professor, SPA, JNAFAU, Hyderabad
 Challenges in implementing SDGs, Paris Climate Agreement Ms. Tuhina Sinha, Asst. Professor, SPA, JNAFAU, Hyderabad Paris Agreement Background The adoption of a new climate change agreement at the 21st
Human Development Indices and Indicators: 2018 Statistical Update. Turkey
 Human Development Indices and Indicators: 2018 Statistical Update Briefing note for countries on the 2018 Statistical Update Introduction Turkey This briefing note is organized into ten sections. The first
Human Development Indices and Indicators: 2018 Statistical Update. Belgium
 Human Development Indices and Indicators: 2018 Statistical Update Briefing note for countries on the 2018 Statistical Update Introduction Belgium This briefing note is organized into ten sections. The
Human Development Indices and Indicators: 2018 Statistical Update. Dominica
 Human Development Indices and Indicators: 2018 Statistical Update Briefing note for countries on the 2018 Statistical Update Introduction Dominica This briefing note is organized into ten sections. The
Executive summary WORLD EMPLOYMENT SOCIAL OUTLOOK
 Executive summary WORLD EMPLOYMENT SOCIAL OUTLOOK TRENDS 2018 Global economic growth has rebounded and is expected to remain stable but low Global economic growth increased to 3.6 per cent in 2017, after
Human Development Indices and Indicators: 2018 Statistical Update. Peru
 Human Development Indices and Indicators: 2018 Statistical Update Briefing note for countries on the 2018 Statistical Update Introduction Peru This briefing note is organized into ten sections. The first
Rifle city Demographic and Economic Profile
 Rifle city Demographic and Economic Profile Community Quick Facts Population (2014) 9,289 Population Change 2010 to 2014 156 Place Median HH Income (ACS 10-14) $52,539 State Median HH Income (ACS 10-14)
Economic standard of living
 Home Previous Reports Links Downloads Contacts The Social Report 2002 te purongo oranga tangata 2002 Introduction Health Knowledge and Skills Safety and Security Paid Work Human Rights Culture and Identity
Inequality in China: Recent Trends. Terry Sicular (University of Western Ontario)
") Inequality in China: Recent Trends Terry Sicular (University of Western Ontario) In the past decade Policy goal: harmonious, sustainable development, with benefits of growth shared widely Reflected in
Inequality in China: Recent Trends Terry Sicular (University of Western Ontario) In the past decade Policy goal: harmonious, sustainable development, with benefits of growth shared widely Reflected in
Human Development Indices and Indicators: 2018 Statistical Update. Uzbekistan
 Human Development Indices and Indicators: 2018 Statistical Update Briefing note for countries on the 2018 Statistical Update Introduction Uzbekistan This briefing note is organized into ten sections. The
Integrating climate risk assessment/management/drr into national policies, programmes and sectoral planning. G Midgley, South Africa
 Integrating climate risk assessment/management/drr into national policies, programmes and sectoral planning G Midgley, South Africa The national policy framework South Africa s Disaster Management Act,
LABOUR MARKET PROVINCIAL 54.3 % 45.7 % Unemployed Discouraged work-seekers % 71.4 % QUARTERLY DATA SERIES
 QUARTERLY DATA SERIES ISSUE 6 October 2016 PROVINCIAL LABOUR MARKET introduction introduction The Eastern Cape Quarterly Review of Labour Markets is a statistical release compiled by the Eastern Cape Socio
Policy Brief on Population Projections
 The Republic of the Union of Myanmar 2014 Myanmar Population and Housing Census Policy Brief on Population Projections Department of Population Ministry of Labour, Immigration and Population With technical
Synopsis. Challenge. More Results. Turkey-Sustained and Equitable Growth for Continued Economic Success
 Turkey-Sustained and Equitable Growth for Continued Economic Success Turkey Sustained and Equitable Growth for Continued Economic Success Synopsis Turkey is one of the greatest success stories of the global
DRAFT INTGETAED DEVELOPMENT PLAN 2018/2019
 DRAFT INTGETAED DEVELOPMENT PLAN 2018/2019 Department of the Office of the Municipal Manager IDP and PMS Division 27 Voortrekker Street Ficksburg 9730 Tel: 051 933 9368 Fax: 051 933 9363 Email: strategy@setsoto.co.za
Solidar EU Training Academy. Valentina Caimi Policy and Advocacy Adviser. European Semester Social Investment Social innovation
 Solidar EU Training Academy Valentina Caimi Policy and Advocacy Adviser European Semester Social Investment Social innovation Who we are The largest platform of European rights and value-based NGOs working
IMPACT OF GOVERNMENT PROGRAMMES USING ADMINISTRATIVE DATA SETS SOCIAL ASSISTANCE GRANTS
 IMPACT OF GOVERNMENT PROGRAMMES USING ADMINISTRATIVE DATA SETS SOCIAL ASSISTANCE GRANTS Project 6.2 of the Ten Year Review Research Programme Second draft, 19 June 2003 Dr Ingrid Woolard 1 Introduction
KENYA'S VISION 2030: AN AUDIT FROM AN INCOME AND GENDER INEQUALITIES PERSPECTIVE. SID Society for International Development
 KENYA'S VISION 2030: AN AUDIT FROM AN INCOME AND GENDER INEQUALITIES PERSPECTIVE SID Society for International Development I Contents Section 1 List of Abbreviations and Acronyms x Executive Summary xiv
Uzbekistan Towards 2030:
 Uzbekistan Towards 23: A New Social Protection Model for a Changing Economy and Society Uzbekistan Towards 23: A New Social Protection Model for a Changing Economy and Society The study is financed by
Appendix 2 Basic Check List
 Below is a basic checklist of most of the representative indicators used for understanding the conditions and degree of poverty in a country. The concept of poverty and the approaches towards poverty vary
Updates on Development Planning and Outcomes. Presentation by. Dr Julius Muia, EBS PS, Planning, The National Treasury and Planning
 Updates on Development Planning and Outcomes Presentation by Dr Julius Muia, EBS PS, Planning, The National Treasury and Planning 4th CEOs Forum, Whitesands, Mombasa;30 th May 2018 Outline of the Presentation
WJEC (Eduqas) Economics A-level Trade Development
 Economics A-level Trade Development") WJEC (Eduqas) Economics A-level Trade Development Topic 1: Global Economics 1.3 Non-UK economies Notes Characteristics of developed, developing and emerging (BRICS) economies LEDCs Less economically developed
WJEC (Eduqas) Economics A-level Trade Development Topic 1: Global Economics 1.3 Non-UK economies Notes Characteristics of developed, developing and emerging (BRICS) economies LEDCs Less economically developed