VIRGINIA RAILWAY EXPRESS
|
|
|
- Frederick Allison
- 5 years ago
- Views:
Transcription


1
2
3 Comprehensive Annual Financial Report YEARS ENDED JUNE 30, 2017 AND 2016
4 Prepared by: Department of Finance
5 TABLE OF CONTENTS Page Introductory Section Letter of Transmittal 1 4 Directory of Principal Officials and Key Personnel 5 Organizational Chart 6 Financial Section Independent Auditor s Report 7 and 8 Management s Discussion and Analysis 9 17 Basic Financial Statements Statements of Net Position 18 and 19 Statements of Revenues, Expenses and Changes in Net Position 20 Statements of Cash Flows 21 Notes to Financial Statements Required Supplementary Information Schedule of Contributions Virginia Retirement System 50 Schedule of Changes in Net Pension (Asset) Liability Virginia Retirement System 51 Notes to Required Supplementary Information 52 Statistical Section Introduction to Statistical Section 53 Schedule of Change in Net Position 54 Schedule of Components of Net Position 55 Schedule of Outstanding Debt 56 Schedule of Jurisdictional Contributions 57 Schedule of Miscellaneous Statistics 58 VRE System Map 59 Principal Employers of Participating Jurisdictions 60 Demographics and Economic Statistics of Participating Jurisdictions 61 and 62
6 Page Compliance Section Independent Auditor s Report on Internal Control Over Financial Reporting and on Compliance and Other Matters Based on an Audit of Financial Statements Performed in Accordance With Government Auditing Standards and 64
7 Introductory Section
8
9 October 30, 2017 To the Honorable Operations Board Members and Commissioners The Virginia Railway Express The Northern Virginia Transportation Commission The Potomac and Rappahannock Transportation Commission We are pleased to present the comprehensive annual financial report for the fiscal year ended June 30, 2017 for the Virginia Railway Express (VRE), a commuter rail service jointly owned and operated by the Northern Virginia Transportation Commission (NVTC) and the Potomac and Rappahannock Transportation Commission (PRTC), collectively referred to as the Commissions. NVTC and PRTC are political subdivisions of the Commonwealth of Virginia. VRE is not a legal entity and is considered a joint venture of the two Commissions for accounting purposes. As used in this report, VRE refers to those activities that are carried out jointly or individually by NVTC and PRTC to operate the commuter rail services described below. The report consists of management s representations concerning the finances of VRE. Consequently, management assumes responsibility for the completeness and reliability of all the information presented in this report. To provide a reasonable basis for making these representations, VRE s management has established a comprehensive internal control framework that is designed to protect VRE s assets from loss, theft, or misuse and to gather sufficient reliable information for the preparation of VRE s financial statements in conformity with accounting principles generally accepted in the United States of America. The internal control structure is designed to provide reasonable, but not absolute, assurance that these objectives are met. The concept of reasonable assurance recognizes the cost of a control should not exceed the benefits likely to be derived. The evaluation of costs and benefits requires estimates and judgments by management. VRE s financial statements have been audited by PBMares, LLP, a firm of licensed certified public accountants, and have earned an unmodified opinion. The independent auditor s report is located at the front of the financial section of this report. Management s Discussion and Analysis (MD&A) is found immediately following the independent auditor s report. This letter of transmittal is designed to complement the MD&A and should be read in conjunction with it. Profile of Virginia Railway Express VRE provides commuter rail service on two railroad lines originating near Fredericksburg and Manassas, Virginia, and terminating at Union Station in Washington, DC. VRE began operations in 1992 with 16 trains and 1,800 average daily riders. During fiscal year 2017, VRE operated 34 trains and served an average daily ridership of 18,968, based on 251 service days. VRE is owned by the Commissions. Certain functions have been delegated to the VRE Operations Board, consisting of representatives of the Commissions who are also representatives of all contributing and participating jurisdictions and one representative of the Commonwealth of Virginia s Department of Rail and Public Transportation. VRE is managed by the Chief Executive Officer, who is a contract employee of both Commissions. PRTC is the recipient of federal grants for the rail service, and NVTC is the recipient of state grants for the rail service, with certain minor exceptions. All non-contract staff are employees of PRTC. 1
10 In accordance with the Master Agreement that created VRE, the Operations Board must prepare and submit a preliminary annual budget to the Commissions and the contributing and participating jurisdictions by September 30 of the preceding fiscal year for review and comment. A final recommended budget is prepared by December 1 for consideration by the Operations Board and the Commissions by February 1, followed by transmittal to the jurisdictions for appropriation. In addition, the Operations Board is required to have an annual audit performed of the financial activities related to the commuter rail service. Major Initiatives Economic Conditions During fiscal year 2017, VRE focused on improving its rolling stock, facilities, and systems in order to ensure the financial health and operational safety of the current rail service and to allow for system expansion as opportunities and funding become available. Rolling Stock: Five new Gallery railcars were delivered and placed into service in fiscal year These cars are part of a larger set of expansion railcars intended to grow the VRE fleet and service. VRE placed the initial order for the construction of the five Gallery railcars in fiscal year 2015 and ordered an additional nine railcars in fiscal year Together, these fourteen railcars will allow expansion of the VRE service, primarily through the lengthening of existing trains. Facilities: Work continued in fiscal year 2017 on the L Enfant Storage tracks (North and South) that will allow VRE to store trains outside of Washington Union Terminal during the mid-day period. These storage tracks are anticipated to enter service in fiscal year Preliminary work began on the Midday Storage Facility, a vital multi-year project to construct a replacement storage facility for VRE trains in Washington D.C. Design work continued for the construction of the Lifecycle Overhaul and Upgrade Facility at the Crossroads maintenance and storage yard, as well as the Alexandria King Street pedestrian tunnel. Systems: Substantial work continued in fiscal year 2017 on the installation of Positive Train Control (PTC) devices on VRE s locomotives and cab cars, as VRE works toward full compliance with the mandates created by the Rail Safety Improvement Act of VRE launched its mobile ticketing system in fiscal year 2015, and by the end of fiscal year 2017, the mobile ticketing system is accounting for 22 percent of monthly revenue and 26 percent of monthly ticket sales. VRE is also moving forward on implementation of both an Automated Passenger Counter system and an Automated Parking Counter system. These systems will provide real-time information to customers and staff and allow for more efficient utilization of VRE s capacity. VRE successfully competed for significant state and regional discretionary funding in fiscal year 2017 to expand capacity. In June 2017, VRE was approved for $92 million of Smart Scale funding for the Fredericksburg Line Capacity Expansion project, and in July, the Northern Virginia Transportation Authority recommended approval of $118 million from the I-66 Outside the Beltway Concessionaire Payment for the Manassas Line Capacity Expansion and Real-Time Traveler Information project. These funds will support additional railcars, expansion of stations and parking facilities, storage and maintenance facility expansions, and real-time information along the I-66 corridor. The Smart Scale and I-66 funding awards have filled crucial gaps for these projects and will allow them to move forward into construction. These projects are part of VRE s Natural Growth scenario, and they increase capacity to carry additional riders while requiring only modest additional operating expense. Long-Term Financial Planning To help prioritize investment needs and address potential future growth, the VRE System Plan 2040 was prepared and adopted by the VRE Operations Board in January The plan assesses the future long-term ridership demand for VRE service and identifies the service expansions and capital investments necessary to accommodate that demand. The plan provides a framework for VRE system investments and actions VRE should pursue through 2040 to best meet regional travel needs. 2
11 The investments recommended in the System Plan are grouped into three phases between now and Phase 1 includes near-term investments that will maximize the capacity of the existing VRE system (e.g., by lengthening existing trains and platforms), while Phases 2 and 3 focus on investments to significantly expand system capacity to support long-term service and ridership growth. VRE is committed to major joint investments in the CSX corridor in Phases 2 and 3 that will relieve key capacity bottlenecks, including the Long Bridge crossing of the Potomac River. During fiscal year 2016, a companion Financial Plan was completed that identified the costs and revenues associated with System Plan 2040 and several alternate service and capital investment profiles during the same timeframe. This Financial Plan serves as the basis for the ongoing annual development of the VRE capital program. VRE s annual budget includes both a multi-year capital program and a six-year forecast of revenue, expenses, and funding sources. The System Plan and accompanying Financial Plan are currently being reviewed to determine if updates to service plans or capital requirements are warranted. In December 2011, a Transit Development Plan (TDP) for VRE was prepared that complies with Virginia Department of Rail and Public Transportation (DRPT) requirements for recipients of state transit operating and capital assistance. The TDP assists the agency in preparing inputs to the state Six-Year Improvement Program (SYIP) for transportation. The TDP is updated annually to reflect current agency priorities and costs and to extend the TDP financial plan an additional year to maintain a six-year planning horizon. VRE will initiate a major update of the TDP in fiscal year Financial Environment As the regional road network has become more crowded over the last 25 years particularly in the critical Interstate 95/395 and Interstate 66 Corridors of Statewide Significance the VRE commuter rail system has provided a competitive alternative for Virginia commuters. VRE ridership has grown consistently over time and remains strong due to investments in new equipment, consistent on-time performance, and a focus on customer service, as well as growth in the overall economy of the Washington region. Although subsidy funding from the local jurisdictions is constrained, VRE continues to work with regional, state, and federal partners to identify additional revenue sources. As a result, future VRE budgets will reflect a balance between meeting service needs, maintaining the system in a state of good repair, setting fares at a reasonable level, and incorporating new funding sources into the strategic direction set by the Operations Board and the Commissions. The focus of the VRE Operations Board and VRE management continues to be the provision of safe and reliable commuter rail service. Public transit plays a vital role in addressing the regions need to reduce congestion and improve air quality. VRE enhances regional mobility by removing the estimated equivalent of one full lane of traffic on both Interstate 95 and Interstate 66 during peak periods and improves air quality by reducing an estimated 50,000 metric tons of carbon dioxide and other emissions each year. As noted by the Commonwealth Transportation Board (CTB) in its recent review of VRE s Financial Plan, VRE is an asset to the Commonwealth that by its own analysis is currently valued at over $5.4 billion, and with additional investment could be worth up to $14 billion. Awards and Acknowledgement The Government Finance Officers Association of the United States and Canada (GFOA) awarded a Certificate of Achievement for Excellence in Financial Reporting to the Virginia Railway Express for its comprehensive annual financial report for the fiscal year ended June 30, In order to be awarded a Certificate of Achievement, a government must publish an easily readable and efficiently organized comprehensive annual financial report. This report must satisfy both accounting principles generally accepted in the United States of America and applicable legal requirements. A Certificate of Achievement is valid for a period of one year only. We believe that our current comprehensive annual financial report continues to meet the Certificate of Achievement Program s requirements, and we are submitting it to the GFOA to determine its eligibility for another certificate. 3
12
13 DIRECTORY OF PRINCIPAL OFFICIALS AND KEY PERSONNEL Operations Board Officers Chairman Vice-Chairman Secretary Treasurer Hon. Paul Smedberg, City of Alexandria Hon. Maureen Caddigan, Prince William County Hon. Katie Cristol, Arlington County Hon. Paul Milde, Stafford County Members Hon. Sharon Bulova, Fairfax County Hon. John Cook, Fairfax County Hon. John Jenkins, Prince William County Hon. Matt Kelly, City of Fredericksburg Jennifer Mitchell, VDRPT Hon. Suhas Naddoni, City of Manassas Park Hon. Marty Nohe, Prince William County Pamela Sebesky, City of Manassas Hon. Gary Skinner, Spotsylvania County Hon. Bob Thomas, Stafford County Alternates Hon. Ruth Anderson, Prince William County Hon. Pete Candland, Prince William Count Hon. Hector Cendejas, City of Manassas Park Hon. Libby Garvey, Arlington County Todd Horsley, VDRPT Hon. Jeanine Lawson, Prince William County Hon. Tim Lovain, City of Alexandria Hon. Wendy Maurer, Stafford County Hon. Jeff McKay, Fairfax County Hon. Paul Trampe, Spotsylvania County Hon. William Withers, City of Fredericksburg Hon. Mark Wolfe, City of Manassas Chief Executive Officer Deputy CEO & Chief Operating Officer Chief of Staff Chief Financial Officer Comptroller Chief Development Officer Director, Rail Operations Management Doug Allen Richard Dalton Joe Swartz Mark Schofield Alexander E. Buchanan Tom Hickey Chris Henry 5
14 Virginia Railway Express Organizational Chart October 1, 2017 NVTC PRTC VRE Operations Board Chief Executive Officer Executive Administrative Assistant Chief of Staff EEO Officer* Deputy CEO Chief Operating Officer Chief Financial Officer Director of Public Affairs & Govt Relations Director of Rail Operations Manager of Facilities Maintenance Manager of System Safety and Security* Director of Information Technology Marketing & Strategic Communications Admin. Chief Development Officer Comptroller Manager of Purchasing and Contract Administration Human Resources Administrator 6 Operations & Communications Administrator Senior Communications Specialist Senior Communications Specialist Senior Communications Specialist Communications Specialist Communications Specialist Communications Specialist Facilities Maintenance Administrator System Safety & Security Administrator Senior Sytemtems Engineer Network & Telecommunications Specialist Mechanical Operations Manager Mechanical Operations Manager Manager of Operations Administration Mechanical Operations Specialist Manager of Warehouse and Inventory Control Manager of Project Development Planning Program Administrator Manager of Project Implementation Project Manager Project Manager Project Manager Project Manager Accounting Supervisor Senior Accountant Sr. Associate Accountant & HR Specialist Associate Accountant Revenue Accountant Contract Administrator Senior Contract Specialist* Contract Specialist Senior Financial Analyst Warehouse Specialist Warehouse Specialist * Note: Manager of Safety and Security reports to the CEO in matters related to safety and security Senior Contract Specialist reports to the CEO in matters related to their duties as DBE liason Chief of Staff reports to the CEO in matters related to EEO
15 Financial Section
16
17 INDEPENDENT AUDITOR S REPORT To the Honorable Operations Board Members and Commissioners The Northern Virginia Transportation Commission The Potomac and Rappahannock Transportation Commission Report on the Financial Statements We have audited the accompanying financial statements of the Virginia Railway Express (VRE), a joint venture of the Northern Virginia Transportation Commission and the Potomac and Rappahannock Transportation Commission, as of and for the years ended June 30, 2017 and 2016, and the related notes to the financial statements, which collectively comprise the VRE s basic financial statements as listed in the table of contents. Management s Responsibility for the Financial Statements Management is responsible for the preparation and fair presentation of these financial statements in accordance with accounting principles generally accepted in the United States of America; this includes the design, implementation, and maintenance of internal control relevant to the preparation and fair presentation of financial statements that are free from material misstatement, whether due to fraud or error. Auditor s Responsibility Our responsibility is to express an opinion on these financial statements based on our audits. We conducted our audits in accordance with auditing standards generally accepted in the United States of America; the standards applicable to financial audits contained in Government Auditing Standards, issued by the Comptroller General of the United States; and the Specifications for Audits of Authorities, Boards, and Commissions issued by the Auditor of Public Accounts of the Commonwealth of Virginia. Those standards and specifications require we plan and perform the audits to obtain reasonable assurance about whether the financial statements are free from material misstatement. An audit involves performing procedures to obtain audit evidence about the amounts and disclosures in the financial statements. The procedures selected depend on the auditor s judgment, including the assessment of the risks of material misstatement of the financial statements, whether due to fraud or error. In making those risk assessments, the auditor considers internal control relevant to the VRE s preparation and fair presentation of the financial statements in order to design audit procedures that are appropriate in the circumstances, but not for the purpose of expressing an opinion on the effectiveness of the VRE s internal control. Accordingly, we express no such opinion. An audit also includes evaluating the appropriateness of accounting policies used and the reasonableness of significant accounting estimates made by management, as well as evaluating the overall presentation of the financial statements. We believe the audit evidence we have obtained is sufficient and appropriate to provide a basis for our audit opinion. 7
18 Opinion In our opinion, the financial statements referred to above present fairly, in all material respects, the respective financial position of VRE, as of June 30, 2017 and 2016, and the respective changes in financial position and cash flows thereof for the years then ended in accordance with accounting principles generally accepted in the United States of America. Other Matters Required Supplementary Information Accounting principles generally accepted in the United States of America require the Management's Discussion and Analysis and the required supplementary information on pages 9-17 and 50-51, respectively, be presented to supplement the basic financial statements. Such information, although not a part of the basic financial statements, is required by the Governmental Accounting Standards Board who considers it to be an essential part of financial reporting for placing the basic financial statements in an appropriate operational, economic, or historical context. We have applied certain limited procedures to the required supplementary information in accordance with auditing standards generally accepted in the United States of America, which consisted of inquiries of management about the methods of preparing the information and comparing the information for consistency with management s responses to our inquiries, the basic financial statements, and other knowledge we obtained during our audits of the basic financial statements. We do not express an opinion or provide any assurance on the information because the limited procedures do not provide us with sufficient evidence to express an opinion or provide any assurance on them. Other Information Our audits were conducted for the purpose of forming an opinion on the financial statements that collectively comprise VRE s basic financial statements. The introductory section and statistical section listed in the table of contents are presented for purposes of additional analysis and are not a required part of the basic financial statements. These sections have not been subjected to the auditing procedures applied in the audits of the basic financial statements and, accordingly, we do not express an opinion or provide any assurance on them. Other Reporting Required by Government Auditing Standards In accordance with Government Auditing Standards, we have also issued our report dated October 30, 2017 on our consideration of the VRE s internal control over financial reporting and on our tests of its compliance with certain provisions of laws, regulations, contracts, and grant agreements and other matters. The purpose of that report is to describe the scope of our testing of internal control over financial reporting and compliance and the results of that testing, and not to provide an opinion on internal control over financial reporting or on compliance. That report is an integral part of an audit performed in accordance with Government Auditing Standards in considering the VRE s internal control over financial reporting and compliance. Harrisonburg, Virginia October 30,
 for the fiscal year ended June 30, 2017.")
19 MANAGEMENT S DISCUSSION AND ANALYSIS The following Management s Discussion and Analysis (MD&A) provides the reader with an overview of the activities and performance of the Virginia Railway Express (VRE) for the fiscal year ended June 30, Readers are encouraged to consider the information presented here in conjunction with additional information furnished in the letter of transmittal on pages 1-4 of this report and the financial statements, which begin on page 18. Financial Operations and Highlights Operating revenues increased by 12.2 percent compared to the prior year, from $37,936,965 to $42,582,290. Ridership increased 7.2 percent from 4,441,858 to 4,761,035, reflecting a full year of increased federal transit benefits beginning in January 2016; a full year of operation of the new Fredericksburg Line train begun mid-year in fiscal year 2016; and the effects of WMATA s SafeTrack program on VRE ridership. Operating expenses increased by 5.9 percent from $69,874,826 to $73,979,660, as the result of regular contractual increases; the first full year of service for the new Fredericksburg Line train added mid-year in fiscal year 2016; grant funded expenses for asset management and the addition of four new positions. Non-operating revenue increased by 9.8 percent from $47,624,400 to $52,302,892 primarily as the result of an increase to the state operating assistance grant, the addition of regional grant funding sources, grant funding for asset management (as noted above), and a 5 percent jurisdictional subsidy increase. Capital grants and assistance decreased by 41.9 percent from $32,803,548 to $19,052,133 as a result of the delivery of five grant funded railcars, compared to seven in the prior year, with no other completed capital projects and with many current projects in early stages of development and not yet having initiated major construction. The operating loss before depreciation and amortization was $31,397,370, a decrease from the previous year of 1.7 percent. Local, federal, and state support is accounted for as non-operating income and is used to offset these losses. VRE s total net position increased by $19,002,729 from $341,053,259 to $360,055,988, primarily as the result of grants and contributions for capital improvements. At the end of the fiscal year, unrestricted net position was $68,885,778, an increase of $13,188,385. During the fiscal year, capital assets, net of accumulated depreciation and amortization, increased by 0.7 percent, as the combined result of the delivery of five new railcars, the reduction of capital asset value related to over-accrual, new project construction and the recognition of annual depreciation and amortization. Overview of the Basic Financial Statements This discussion and analysis is intended to serve as an introduction to the basic financial statements of the Virginia Railway Express. VRE s basic financial statements also include notes that provide more detail for some of the information contained in the basic statements. Basic Financial Statements. VRE s statements are prepared in conformity with accounting principles generally accepted in the United States of America (GAAP) as applied to an enterprise using the accrual basis of accounting. Under this basis, revenues are recognized in the period in which they are earned, and expenses are recognized in the period in which they are incurred. 9
20 VRE s basic financial statements are the Statements of Net Position; the Statements of Revenues, Expenses and Changes in Net Position; and the Statements of Cash Flows. Comparative data for the prior fiscal year is provided for all three statements. The Statements of Net Position reports VRE s net position, the difference between assets and deferred outflows of resources, and liabilities and deferred inflows of resources. Net position is one way to measure financial position, but the reader should also consider other indicators, such as the rate of growth of operating subsidies, passenger fare levels, ridership, general economic conditions, and the age and condition of capital assets. The Statements of Revenues, Expenses and Changes in Net Position report all of the revenues earned and expenses incurred during the reporting periods. The Statements of Cash Flows provide information on cash receipts and cash payments during the reporting periods. The basic financial statements can be found on pages of this report. Notes to the Basic Financial Statements. The notes provide additional information that is essential to a full understanding of the data provided in the basic financial statements. The notes to the basic financial statements can be found on pages of this report. Financial Analysis Statements of Net Position As noted earlier, net position may serve over time as an indicator of financial strength, although other indicators should be considered as well. A condensed summary of VRE s Statements of Net Position at June 30, 2017, 2016, and 2015 is shown below. Condensed Statements of Net Position ASSETS AND DEFERRED OUTFLOWS OF RESOURCES: Current and other assets $ 91,338,135 $ 81,123,071 $ 74,796,036 Capital assets, net 346,205, ,924, ,209,068 Deferred outflows of resources 646, , ,793 Total assets and deferred outflows of resources 438,189, ,366, ,249,897 LIABILITIES AND DEFERRED INFLOWS OF RESOURCES: Current portion of long-term debt 3,666,190 3,503,033 3,336,076 Other current liabilities 11,011,792 13,847,188 13,583,499 Noncurrent liabilities 63,455,771 66,780,894 70,144,263 Deferred inflows of resources - 182, ,615 Total liabilities and deferred inflows resources 78,133,753 84,313,371 87,465,453 NET POSITION: Net investment in capital assets 279,920, ,136, ,085,092 Restricted 11,249,729 11,219,213 10,487,532 Unrestricted 68,885,778 55,697,393 50,211,820 Total net position $ 360,055,988 $ 341,053,259 $ 314,784,444 10
21 Current Year Net position increased by approximately $19.0 million, or 5.6 percent during the current fiscal year, due mainly to capital contributions used to fund system improvements. The largest portion of VRE s net position, $279.9 million or 77.7 percent, represents its investment in capital assets (e.g., land, buildings, improvements, rolling stock, equipment, software, and accumulated depreciation and amortization), less the related indebtedness outstanding used to acquire those capital assets. VRE uses these assets to provide services to its riders; consequently, these assets are not available for future spending. The resources required to repay this debt must be provided annually from operations and federal (with PRTC as grantee), state and local support since it is unlikely the capital assets themselves will be liquidated to pay liabilities. Restricted net position increased approximately $0.03 million or 0.3 percent. A portion of VRE s restricted net position, $10.5 million, represents resources that are restricted for the liability insurance plan. Capital assets, net of accumulated depreciation and amortization, increased approximately $2.3 million or 0.7 percent as the result of the delivery of five additional railcars, and reduction in value of the Hamilton to Crossroads third main track project due to over-accrual of costs prior to capitalization in fiscal year Current liabilities decreased approximately $2.7 million or 15.4 percent as the result of minor changes in various line items. Noncurrent liabilities and deferred inflows of resources decreased approximately $3.5 million or 5.3 percent because of scheduled note and capital lease repayments during the year. Prior Year Net position increased by approximately $26.3 million, or 8.3 percent during the prior fiscal year, due mainly to capital contributions used to fund system improvements. The largest portion of VRE s net position, $274.1 million or 80.4 percent, represents its investment in capital assets (e.g., land, buildings, improvements, rolling stock, equipment, software, and accumulated depreciation and amortization), less the related indebtedness outstanding used to acquire those capital assets. VRE uses these assets to provide services to its riders; consequently, these assets are not available for future spending. The resources required to repay this debt must be provided annually from operations and federal (with PRTC as grantee), state and local support since it is unlikely the capital assets themselves will be liquidated to pay liabilities. Restricted net position increased approximately $0.7 million or 7.0 percent because of restricted funds related to the transfer of land and improvements at the Woodbridge VRE station to the Virginia Department of Transportation (VDOT). A portion of VRE s restricted net position, $11.2 million, represents resources that are restricted for the liability insurance plan. Capital assets, net of accumulated depreciation and amortization, increased approximately $16.7 million or 5.1 percent as the result of the delivery of seven railcars, the installation of PTC equipment on VRE locomotives and cab cars, and the construction of the Hamilton to Crossroads third main track project. Current liabilities increased approximately $0.4 million or 2.5 percent as the result of minor changes in various line items. Noncurrent liabilities decreased approximately $3.6 million or 5.1 percent because of scheduled note and capital lease repayments during the year. 11
22 Statements of Revenues, Expenses and Changes in Net Position The following financial information was derived from the Statements of Revenues, Expenses and Changes in Net Position and reflects how VRE s net position changed during the current and two prior fiscal years Operating revenues: Passenger revenue $ 42,280,669 $ 37,696,913 $ 36,700,191 Equipment rentals and other 301, , ,569 Total operating revenues 42,582,290 37,936,965 37,118,760 Nonoperating revenues: Subsidies: Commonwealth of Virginia 18,265,581 16,572,077 14,401,957 Federal with PRTC as grantee 15,937,225 13,917,534 13,688,723 Jurisdictional contributions 17,250,240 16,428,800 16,456,986 Regional transportation funding (NVTA) 461, ,671 - Interest income 384, ,318 34,396 Gain (loss) on disposal of assets 3,500 - (60,293) Total nonoperating revenues, net 52,302,892 47,624,400 44,521,769 Total revenues 94,885,182 85,561,365 81,640,529 Operating expenses: Contract operations and maintenance 25,873,933 24,082,615 22,782,752 Other operations and maintenance 14,461,209 13,662,606 14,334,954 Property leases and access fees 16,236,606 15,175,732 14,318,788 Insurance 3,970,753 4,046,198 3,964,673 Marketing and sales 2,532,214 2,393,332 2,267,729 General and administrative 10,904,945 10,514,343 7,968,298 Total operating expenses 73,979,660 69,874,826 65,637,194 Other expenses: Depreciation and amortization 17,737,170 16,953,565 15,391,195 Interest, financing costs and other 3,217,756 3,384,762 3,534,644 Total other expenses 20,954,926 20,338,327 18,925,839 Total expenses 94,934,586 90,213,153 84,563,033 Excess (deficit) before capital contributions and extraordinary item (49,404) (4,651,788) (2,922,504) Capital grants and assistance: Commonwealth of Virginia grants 3,033,657 9,826,429 14,694,277 Federal grants with PRTC as grantee 15,204,474 22,125,460 17,764,759 Regional transportation funding (NVTA) 651, In-kind and other local contributions 162, ,659 1,079,885 Total capital grants and assistance 19,052,133 32,803,548 33,538,921 Extraordinary item - (1,882,945) - Change in net position 19,002,729 26,268,815 30,616,417 Net position beginning of year 341,053, ,784, ,168,027 Net position end of year $ 360,055,988 $ 341,053,259 $ 314,784,444 12

23 Revenues Current Year Total revenues for the current fiscal year increased approximately $9.3 million or 10.9 percent. Operating revenues totaled approximately $42.6 million, an increase of 12.2 percent from the prior year. Jurisdictional subsidies and contributions to project operating costs increased by approximately $821,000. State, federal and regional subsidies increased by $3.6 million, primarily as the result of an increase to the state operating assistance grant and grant funding for asset management. Passenger revenue increased approximately $4.6 million or 12.2 percent, reflecting a full year of increased federal transit benefits started in January 2016, a full year of operation of the new Fredericksburg Line train begun mid-year in fiscal year 2016, as well as the effects of WMATA s SafeTrack program on VRE ridership. Ridership increased by 7.2 percent as the result of the same factors. June 30, Ridership 4,761,035 4,441,858 4,618,169 % Increase (Decrease) 7.2% (3.8%) 1.5% Capital grants and assistance decreased approximately $13.8 million or 41.9 percent; this decrease is attributed to the delivery of five grant funded railcars, compared to seven in the prior year, with no other completed capital projects and with many current projects in early stages of development and not yet having initiated major construction. The following chart shows the major sources of revenues for the year ended June 30, 2017: Major Sources of Revenues for Year Ended June 30, % 37.1% 35% 30% 25% 27.3% 18.7% Passenger Revenue Federal Commonwealth of Virginia 20% 15.1% Jurisdictions 15% 10% In kind, Regional and Local Match Rentals, Interest and Other 5% 1.1% 0.7% 0% 13

24 Prior Year Total revenues for the prior fiscal year increased approximately $3.9 million or 4.8 percent. Operating revenues totaled approximately $37.9 million, an increase of 2.2 percent from the prior year. Jurisdictional subsidies and contributions to project operating costs decreased by approximately $28,000. State, federal and regional subsidies increased by $2.9 million, primarily as the result of an increase to the state operating assistance grant and grant funding for asset management and the Gainesville-Haymarket study. Passenger revenue increased approximately $1.0 million or 2.7 percent, reflecting a 4.0 percent fare increase implemented at the beginning of the fiscal year. Ridership decreased by 3.8% as the result of a variety of factors, including historically low gas prices, the completion of several major highway projects, fluctuating monthly transit benefits and the increase in telework. The decrease in ridership was offset by the increase in fares. Capital grants and assistance decreased approximately $0.7 million or 2.2 percent; this decrease is attributed primarily to capital grant reimbursement activity related to the delivery of seven railcars, compared to eight delivered the prior year, and the completion of work on the Hamilton to Crossroads third main track project. Expenses Current Year Total operating and other expenses, including depreciation and amortization, increased by approximately $4.7 million or 5.2 percent. Operating expenses increased by approximately $4.1 million or 5.9 percent. Total operating expenses were approximately $74.0 million compared to $69.9 million for the prior fiscal year. Contract operations and maintenance increased by approximately $1.8 million or 7.4 percent, reflecting the first full fiscal year of a new Fredericksburg Line train, regular contractual increases and enhancements to train operations and maintenance services. Property lease and access fee costs increased by approximately $1.1 million or 7.0 percent as the result of regular contractual increases and the first full year addition of a new train. Other operations and maintenance costs increased by $0.8 million or 5.8 percent due primarily to an increase in asset management maintenance expenses. General and administrative costs increased by $0.4 million or 3.7 percent due to the addition of four staff positions. Depreciation and amortization increased by approximately $0.8 million or 4.6 percent and net interest and financing costs decreased by approximately $0.2 million or 4.9 percent. The following chart shows the major expense categories for the year ended June 30, 2017: 30% 25% 20% 15% 10% 5% 0% 27.2% 18.7% Major Expense Categories for Year Ended June 30, % 15.2% 11.5% 4.2% 3.4% 2.7% 14 Contract Operations & Maint. Depreciation and Amortization Leases & Access Fees Other Operations & Maint. General and Admin. Insurance Financing & Other Non Operating Marketing & Commissions
25 Prior Year Total operating and other expenses, including depreciation and amortization, increased by approximately $5.7 million or 6.7 percent. Operating expenses increased by approximately $4.2 million or 6.5 percent. Total operating expenses were approximately $69.9 million compared to $65.6 million for the previous fiscal year. Contract operations and maintenance increased by approximately $1.3 million or 5.7 percent, reflecting the addition of a new train, regular contractual increases and enhancements to train operations and maintenance services. Property lease and access fee costs increased by approximately $0.9 million or 6.0 percent as the result of regular contractual increases and the addition of a new train mid-year. Other operations and maintenance costs decreased by $0.7 million or 4.7 percent due primarily to a decrease in fuel costs. General and administrative costs increased by $2.5 million or 32.0 percent due to the addition of six staff positions, three of which were formerly part of contract operations, and an increase in professional services including a management audit and grant funded expenses related to the Gainesville- Haymarket study. Depreciation and amortization increased by approximately $1.6 million or 10.2 percent and net interest and financing costs decreased by approximately $0.2 million or 4.2 percent. Capital Assets Capital Assets and Debt Administration VRE s investment in capital assets as of June 30, 2017 amounts to approximately $346 million (net of accumulated depreciation and amortization). Investment in capital assets includes the items identified in the table below. Acquisitions are funded using a variety of financing techniques, including loans and grants from various government agencies and other local sources Rolling stock $ 270,949,091 $ 264,755,076 $ 249,295,961 Vehicles 167, , ,199 Facilities 103,480, ,494, ,449,961 Track and signal improvements 83,485,350 84,700,564 52,684,367 Equipment and software 12,126,666 12,126,666 11,996,876 Construction in progress 23,904,164 13,896,672 29,040,586 Equity in property of others 5,787,287 5,787,287 5,787,287 Furniture, equipment and software 5,550,152 5,489,336 5,443, ,451, ,388, ,805,627 Less accumulated depreciation and amortization (159,245,676) (146,463,913) (129,596,559) Total capital assets, net $ 346,205,344 $ 343,924,549 $ 327,209,068 15
26 Current Year During fiscal year 2017, capital assets increased approximately $2.3 million or 0.7 percent, as the combined result of new project construction and the recognition of annual depreciation and amortization. Completed projects totaling approximately $11.1 million were transferred from construction in progress to their respective capital accounts and an additional $0.1 million was charged directly to the capital accounts. Seven fully depreciated Gallery-style railcars were sold to Metra in Chicago in fiscal year The major completed project during the fiscal year was the completion of five Gallery railcars ($11.1 million) that were placed into service. The major additions to construction in progress during the fiscal year were costs related to acquisition of five new Gallery railcars ($10.5 million), ongoing work toward implementation of Positive Train Control (PTC) ($2.9 million); work toward both the L Enfant Storage Track North ($1.5 million) and L Enfant Storage Track South ($1.4 million) and development work for the Mid-Day Storage Yard project ($1.0 million). In addition, capital asset valuation adjustments were made to two projects capitalized in fiscal year 2016; Hamilton to Crossroads (Spotsylvania) Third Main Track project (a reduction of $1.2 million) related to lower than expected actual costs compared to accrued costs; and the Spotsylvania Station project (a reduction of $13,663) related to a refund of project related costs. Additional information on VRE s capital assets and contractual commitments can be found in Notes 3 and 9 to the financial statements. Prior Year During fiscal year 2016, capital assets increased approximately $16.7 million or 5.1 percent, as the combined result of new project construction and the recognition of annual depreciation and amortization. Completed projects totaling approximately $51.5 million were transferred from construction in progress to their respective capital accounts and an additional $0.3 million was charged directly to the capital accounts. Land and improvements associated with the Kiss and Ride facility at the Woodbridge station with a net book value of $2.9 million were transferred to the Virginia Department of Transportation (VDOT). The major completed projects were the purchase of seven Gallery railcars ($15.5 million), the construction of the Spotsylvania VRE station ($4.1 million), and the construction of a third track between Hamilton and Crossroads in Spotsylvania County ($32.0 million). The major additions to construction in progress during the fiscal year were the installation of Positive Train Control equipment in VRE s locomotives and cab cars ($6.3 million), the design of a life-cycle maintenance facility at the VRE Crossroad Yard ($1.9 million), the design of a pedestrian tunnel at the Alexandria VRE station ($0.9 million), and the construction of a storage track north of the L Enfant VRE station ($0.7 million). 16
27 Debt Administration At June 30, 2017, VRE had total debt outstanding of $66,284,863. The Northern Virginia Transportation Commission (NVTC) and the Potomac and Rappahannock Transportation Commission (PRTC) are co-lessees of the capital lease for rolling stock, which is secured by the related equipment. The promissory note for the purchase of 60 Gallery railcars was issued by NVTC, but both NVTC and PRTC are signatories. This note was previously designated to the Federal Railroad Administration as lender, but was delegated to the Build America Bureau of the United States Department of Transportation in fiscal year This delegation had no effect on the terms of the note. The note is secured by the revenues of VRE and the rolling stock. The capital leases for three multifunction copiers are secured by the related equipment Capital leases $ 12,844,704 $ 14,158,954 $ 15,414,117 Note payable 53,440,159 55,628,942 57,709,856 Total $ 66,284,863 $ 69,787,896 $ 73,123,973 Economic Factors and Next Year s Budget Population growth in Northern Virginia, especially in the outer suburbs, continues to remain robust. In combination with the congestion on major highways and on-going highway construction projects, this growth will continue to increase demand for VRE s service. The constraining factors to VRE growth are station parking, availability of seats, storage capacity, and the availability of subsidy funds. The local subsidy for fiscal year 2018 remained constant at $17,250,240. Fares were increased by 3.0 percent for fiscal year 2018; the last previous fare increase was 4.0 percent in fiscal year Additional sources of funding will be available in fiscal year 2018 from federal, state and regional sources, although the amounts received will continue to vary from year to year. Requests for Information This financial report is designed to provide a general overview of VRE s finances for all those interested. Questions concerning any of the information provided in this report or requests for additional information should be addressed to the Chief Financial Officer, Virginia Railway Express, 1500 King Street, Suite 202, Alexandria, Virginia or by to mschofield@vre.org. 17
28
29 Basic Financial Statements
30
31 STATEMENTS OF NET POSITION June 30, 2017 and 2016 ASSETS AND DEFERRED OUTFLOWS OF RESOURCES Current Assets: Cash and cash equivalents $ 49,101,840 $ 28,026,242 Accounts receivable: Due from PRTC FTA and other 16,143,311 28,642,153 Commonwealth of Virginia grants 7,409,568 5,262,372 Trade receivables, net of allowance for doubtful accounts 2,017,394 2,180,277 Other receivables 1,342,975 1,448,130 Inventory 3,928,722 3,992,249 Prepaid expenses and other 144, ,636 Restricted cash, cash equivalents and investments 11,249,729 11,219,213 Total current assets 91,338,135 80,909,272 Noncurrent Assets: Pension asset - 213,799 Capital assets: Rolling stock 270,949, ,755,076 Vehicles 167, ,310 Facilities 103,480, ,494,551 Track and signal improvements 83,485,350 84,700,564 Equipment and software 12,126,666 12,126,666 Construction in progress 23,904,164 13,896,672 Equity in property of others 5,787,287 5,787,287 Furniture, equipment and software 5,550,152 5,489, ,451, ,388,462 Less accumulated depreciation and amortization (159,245,676) (146,463,913) Total capital assets, net 346,205, ,924,549 Total noncurrent assets 346,205, ,138,348 Total assets 437,543, ,047,620 Deferred Outflows of Resources: Pension plan 646, ,010 Total deferred outflows of resources 646, ,010 Total assets and deferred outflows of resources $ 438,189,741 $ 425,366,630 See Notes to Financial Statements. 18
32 LIABILITIES, DEFERRED INFLOWS OF RESOURCES AND NET POSITION Current Liabilities: Accounts payable $ 1,795,940 $ 3,467,440 Payable to Commissions 2,706,596 1,892,459 Compensated absences 31,152 24,616 Accrued expenses 3,854,455 5,155,909 Accrued interest 204, ,401 Unearned revenue 1,836,781 1,687,689 Contract retainage 582,456 1,400,674 Current portion of capital lease obligations 1,375,502 1,314,250 Current portion of note payable 2,290,688 2,188,783 Total current liabilities 14,677,982 17,350,221 Noncurrent Liabilities: Pension Liability 311,424 - Capital lease obligations 11,469,202 12,844,704 Note payable 51,149,471 53,440,159 Compensated absences 525, ,031 Total noncurrent liabilities 63,455,771 66,780,894 Total liabilities 78,133,753 84,131,115 Deferred Inflows of Resources: Pension plan - 182,256 Total deferred inflows of resources - 182,256 Net Position: Net investment in capital assets 279,920, ,136,653 Restricted for liability insurance plan 10,470,506 10,439,990 Restricted grants or contributions 779, ,223 Unrestricted assets 68,885,778 55,697,393 Total net position 360,055, ,053,259 Total liabilities, deferred inflows of resources and net position $ 438,189,741 $ 425,366,630 19
33 STATEMENTS OF REVENUES, EXPENSES AND CHANGES IN NET POSITION Years Ended June 30, 2017 and Operating Revenues: Passenger revenue $ 42,280,669 $ 37,696,913 Equipment rentals and other 301, ,052 Total operating revenues 42,582,290 37,936,965 Operating Expenses: Contract operations and maintenance 25,873,933 24,082,615 Other operations and maintenance 14,461,209 13,662,606 Property leases and access fees 16,236,606 15,175,732 Insurance 3,970,753 4,046,198 Marketing and sales 2,532,214 2,393,332 General and administrative 10,904,945 10,514,343 Total operating expenses 73,979,660 69,874,826 Operating loss before depreciation and amortization (31,397,370) (31,937,861) Depreciation and amortization (17,737,170) (16,953,565) Operating loss (49,134,540) (48,891,426) Nonoperating Revenues (Expenses): Subsidies: Commonwealth of Virginia grants 18,265,581 16,572,077 Federal grants with PRTC as grantee 15,937,225 13,917,534 Jurisdictional contributions 17,250,240 16,428,800 Regional transportation funding (NVTA) 461, ,671 Interest income: Operating funds 285,495 93,677 Insurance trust 98,560 69,444 Other restricted funds Gain on disposal of assets 3,500 - Interest, amortization and other nonoperating expenses, net (3,217,756) (3,384,762) Total nonoperating revenues, net 49,085,136 44,239,638 Capital Grants and Assistance: Commonwealth of Virginia grants 3,033,657 9,826,429 Federal grants with PRTC as grantee 15,204,474 22,125,460 Regional transportation funding (NVTA) 651,163 - Local contributions 162, ,659 Total capital grants and assistance 19,052,133 32,803,548 Extraordinary Item (Note 3) - (1,882,945) Change in net position 19,002,729 26,268,815 Net Position, beginning of year 341,053, ,784,444 Net Position, ending $ 360,055,988 $ 341,053,259 See Notes to Financial Statements. 20
34 STATEMENTS OF CASH FLOWS Years Ended June 30, 2017 and Cash Flows from Operating Activities: Receipts from customers $ 42,925,300 $ 37,541,707 Payments to suppliers (69,103,202) (63,273,673) Payments to employees (6,125,806) (5,901,952) Net cash used in operating activities (32,303,708) (31,633,918) Cash Flows From Noncapital Financing Activities: Governmental subsidies 57,169,240 47,042,685 Cash Flows From Capital and Related Financing Activities: Acquisition and construction of capital assets (21,636,193) (37,385,091) Capital grants and assistance 24,223,596 23,947,985 Proceeds from sale of capital assets 3,500 1,066,280 Principal paid on capital lease obligations (1,314,250) (1,255,163) Principal paid on notes (2,188,783) (2,080,914) Interest paid on capital lease obligation (632,868) (690,478) Interest paid on bonds and notes (2,598,877) (2,708,223) Net cash used in capital and related financing activities (4,143,875) (19,105,604) Cash Flows From Investing Activities: Interest received on investments 384, ,318 Increase (decrease) in cash and cash equivalents 21,106,114 (3,533,519) Cash and Cash Equivalents, beginning 39,245,455 42,778,974 Cash and Cash Equivalents, ending $ 60,351,569 $ 39,245,455 Reconciliation of Operating Loss to Net Cash Used In Operating Activities: Operating loss $ (49,134,540) $ (48,891,426) Adjustments to reconcile operating loss to net cash used in operating activities: Depreciation and amortization 17,737,170 16,953,565 Pension (benefit) expense 15,715 (239,496) (Increase) decrease in: Accounts receivable 162,883 (475,228) Other receivables 31,035 (57,175) Inventory 63,527 (92,569) Prepaid expenses and other (5,960) (15,702) Increase (decrease) in: Accounts payable and accrued expenses (1,322,630) 1,046,967 Unearned revenue 149, ,146 Net cash used in operating activities $ (32,303,708) $ (31,633,918) Schedule of Noncash Capital Activities: Capital assets acquired through accounts payable $ 627,048 $ 1,535,746 Capital assets acquired through accrued liabilities 2,563,245 2,454,557 See Notes to Financial Statements. 21
35 NOTES TO FINANCIAL STATEMENTS Note 1. Summary of Significant Accounting Policies Reporting Entity The Virginia Railway Express (VRE) is accounted for as a joint venture of the Northern Virginia Transportation Commission (NVTC) and the Potomac and Rappahannock Transportation Commission (PRTC). Pursuant to a Master Agreement signed in 1989, NVTC and PRTC (the Commissions) jointly own and operate VRE. VRE provides commuter rail service on two railroad lines, one originating in Fredericksburg and one originating in Manassas, Virginia, and both terminating at Union Station, Washington, D.C. The service uses existing tracks of the CSX Transportation Corporation (CSX), and the Norfolk Southern Railway Company, under respective operating access agreements. Trains are operated and maintained pursuant to an agreement between the Commissions and Keolis Rail Services Virginia, LLC, and Amtrak provides the Commissions with access to storage at Union Station and other services. Assets for VRE operations have been purchased in the name of the Commissions and funded primarily by grants, loans or other financing arrangements for which one or both Commissions have served as grantee, issuer, borrower, or in other related capacities. In order to present a full and accurate picture of VRE operations and in accordance with the Master Agreement and related Appendices that established VRE, all financial transactions related to the commuter rail program are combined in this report. In addition, an allocation of the VRE assets, liabilities and operations are reflected in the financial reports of the Commissions based on asset ownership, named entity on debt instruments, and sources of funding. VRE is managed by the Commissions. Certain functions have been delegated to the VRE Operations Board, which consists of representatives of all contributing and participating jurisdictions and one representative of the Commonwealth of Virginia s Department of Rail and Public Transportation. The system is not currently configured for fare revenue alone to produce positive operating income. In addition to fares, the project is financed with proceeds from the Commuter Rail Revenue Bonds, a federal loan, lease financing, Federal (with PRTC as grantee) and Commonwealth of Virginia (with NVTC as grantee) grants, NVTA regional grants, and jurisdictional contributions apportioned through a formula based on ridership, supplemented by voluntary donations from contributing jurisdictions. Grants and contributions fund both operations and capital projects. Participating jurisdictions include the counties of Fairfax, Prince William, Spotsylvania and Stafford; and the cities of Manassas, Manassas Park and Fredericksburg, Virginia. Contributing jurisdictions include Arlington County and the City of Alexandria, Virginia. In July 2007, the Commissions adopted amendments to the VRE Master Agreement that expanded the Operations Board to include all member jurisdictions and provided for board representation proportionate to system ridership, and weighted voting proportionate to jurisdictional subsidy. In addition, the amendments apportioned jurisdictional subsidies on system ridership only, rather than the former 90 percent system ridership and 10 percent population formula. The amendment to the subsidy formula was phased in over four years, beginning in fiscal year The amendments also allowed for greater autonomy for the Operations Board, with progressively more decisions made by the Board without referral to PRTC and NVTC. 22
36 NOTES TO FINANCIAL STATEMENTS Note 1. Summary of Significant Accounting Policies (Continued) Measurement Focus, Basis of Accounting VRE prepares its financial statements using the accrual basis of accounting. The activities of VRE are similar to those of proprietary funds of local jurisdictions. The Governmental Accounting Standards Board ( GASB ) is the accepted standard-setting body for establishing governmental accounting and financial reporting principles. Revenues and expenses: VRE distinguishes operating revenues and expenses from nonoperating items. Operating revenues and expenses are those that result from providing services in connection with VRE s principal ongoing operation. The principal operating revenues of VRE are fares paid by customers which result in passenger revenues. Passenger revenues are recorded as revenue at the time services are performed. Cash received for services in advance is deferred until earned. Operating revenues and expenses also include all revenues and expenses not associated with capital and related financing, noncapital financing, subsidies, or investing activities. Revenue recognition: Intergovernmental revenues, consisting primarily of Federal (with PRTC as grantee) and Commonwealth of Virginia (with NVTC as grantee) grants, designated for payment of specific expenses, are recognized at the time the expenses are incurred. Capital grants and assistance are recognized as additions are made to capital assets and other contributions are included in the Statements of Revenues, Expenses and Changes in Net Position when expended. Any excess of grant revenues or expenses at year end are recorded as unearned revenue or accounts receivable, respectively. Cash and investments: VRE considers all highly liquid investments with maturities of three months or less to be cash equivalents. Investments in U.S. government securities and commercial paper are carried at fair value based on quoted market prices. The investment in the Local Government Investment Pool (LGIP or Pool), is reported at amortized cost. Restricted cash and cash equivalents: Restricted cash, cash equivalents and investments of $11,249,729 and $11,219,213 at June 30, 2017 and 2016, respectively, are comprised of funds related to the balance in the Liability Insurance Plan, a small liability claims account, and undisbursed funds related to a property transfer. Allowance for uncollectible accounts: VRE calculates its allowance for uncollectible accounts using historical collection data and specific account analysis. The allowance was $212,000 and $189,000 at June 30, 2017 and 2016, respectively. Inventory: VRE has purchased an inventory of spare parts for rolling stock that is maintained and managed at the Commission s warehouse located at the Crossroads yard. Inventory is stated at cost, which approximates market, and is valued using the first-in-first-out method. Prepaid expenses: Certain payments to vendors reflect costs applicable to future accounting periods and are recorded as prepaid expenses in the financial statements using the consumption method. 23
37 NOTES TO FINANCIAL STATEMENTS Note 1. Summary of Significant Accounting Policies (Continued) Measurement Focus, Basis of Accounting (Continued) Capital assets: For constructed assets, all costs necessary to bring assets to the condition and location necessary for the intended use are capitalized. Asset costs include allocation of certain common construction costs based on the relationship of associated direct costs. Assets constructed directly by jurisdictions in satisfaction of system financial responsibilities have been capitalized at the acquisition value as of the date of donation. When assets are substantially complete and ready for use, these costs are transferred from construction in progress to property and equipment and depreciated or amortized. Major improvements and replacements of property are capitalized. Maintenance, repairs and minor improvements and replacements are expensed. Costs of improvements to track, stations and signal facilities owned by the railroads have been capitalized in recognition of the increased efficiency afforded VRE operations over their useful lives. The Commissions retain a residual interest in these assets such that net salvage value will be reimbursed by the railroads upon cessation of commuter rail service. Similarly, shared investment in jurisdictional facilities ( equity in property of others ) recognizes the right of access for commuter rail patrons granted to the Commissions. This category also represents investment in Amtrak infrastructure and facilities that provides primary benefit to the commuter rail service and for which VRE has an expectation of continued use. VRE capitalizes assets that have an initial cost of $5,000 or more per unit and a useable life of two or more years, with the exception of software purchases, which are only capitalized if the initial cost is $15,000 or more. Interest is capitalized on qualifying construction in progress projects until the projects have reached the point of substantial completion. For those projects financed with tax-exempt debt, the amount of capitalized interest equals the difference between the interest cost associated with the borrowing to finance the project and the interest earned from temporary investment of the debt proceeds. Capitalized interest is amortized using the straight-line method over the useful life of the asset. Depreciation and amortization of all exhaustible equipment, buildings and intangibles is charged as an expense against operations using the straight-line method over the following estimated useful lives: Rolling stock Vehicles Facilities Track and signal improvements Equipment and software Equity in property of others Furniture, equipment and software 8-25 years 5 years years 30 years 3-5 years 3-35 years 3-10 years When, in the opinion of management, certain assets are impaired, any estimated decline in value is accounted for as a non-operating expense. There were no impaired assets as of June 30, 2017 and
38 NOTES TO FINANCIAL STATEMENTS Note 1. Summary of Significant Accounting Policies (Continued) Measurement Focus, Basis of Accounting (Continued) Compensated absences: VRE employees are granted vacation leave based on length of employment. Employees with less than ten years of service may carry over a total of 225 hours of leave from year to year, while those with more than ten years may carry over 300 hours. Excess leave may convert to sick leave or may be paid out with the approval of the Chief Executive Officer. Employees may accumulate sick leave without limitation. Employees who separate in good standing after five or more years of service will be paid for 25 percent of their sick leave credit in excess of 450 hours. Certain employees may accumulate compensatory leave for overtime worked. Compensated absences are accrued when incurred. Deferred outflows/inflows of resources: In addition to assets, the Statements of Net Position will sometimes report a separate section for deferred outflows of resources. This separate financial statement element, deferred outflows of resources, represents a consumption of net position that applies to a future period and so will not be recognized as an outflow of resources (expenditure) until then. VRE currently has three items that qualify for reporting in this category. Accordingly, pension contributions subsequent to the measurement date, net difference between projected and actual earnings on pension plan investments, and net differences between expected and actual experience are reported as a deferred outflow of resources. In addition to liabilities, the Statements of Net Position will sometimes report a separate section for deferred inflows of resources. This separate financial statement element, deferred inflows of resources, represents an acquisition of net position that applies to a future period and so will not be recognized as an inflow of resources (revenue) until that time. VRE has no items that qualify for reporting in this category for fiscal year Pensions: For purposes of measuring the net pension asset or liability, deferred outflows of resources and deferred inflows of resources related to pensions, and pension expense, information about the fiduciary net position of the Virginia Retirement System (VRS) VRE s Retirement Plan and the additions to/deductions from the VRS VRE s Retirement Plan net fiduciary position have been determined on the same basis as they were reported by VRS. For this purpose, benefit payments (including refunds of employee contributions) are recognized when due and payable in accordance with the benefit terms. Investments are reported at fair value. Since VRE is combined with PRTC for reporting purposes to VRS, amounts and disclosures included in this report are for PRTC as a whole unless otherwise indicated. Estimates and assumptions: The preparation of financial statements in conformity with accounting principles generally accepted in the United States of America requires management to make estimates and assumptions that affect the reported amounts of assets and liabilities and disclosure of contingent assets and liabilities at the date of the financial statements and the reported amounts of revenues and expenses during the reporting period. Actual results could differ from those estimates. Subsequent events: VRE has evaluated subsequent events through October 30, 2017, which was the date the financial statements were available to be issued. 25
39 NOTES TO FINANCIAL STATEMENTS Note 2. Cash, Cash Equivalents and Investments Deposits. Deposits with banks are covered by the Federal Deposit Insurance Corporation (FDIC) and collateralized in accordance with the Virginia Security for Public Deposits Act (the Act ), Section et., seq. of the Code of Virginia. Under the Act, banks and savings institutions holding public deposits in excess of the amount insured by the FDIC must pledge collateral to the Commonwealth of Virginia Treasury Board. Financial institutions may choose between two collateralization methodologies and depending upon that choice, will pledge collateral that ranges in the amounts from 50 percent to 130 percent of excess deposits. Accordingly, all deposits are considered fully collateralized. Investments. Statutes authorize local governments and other public bodies to invest in obligations of the United States or agencies thereof, obligations of the Commonwealth of Virginia or political subdivisions thereof, obligations of the International Bank for Reconstruction and Development (World Bank), the Asian Development Bank, the African Development Bank, prime quality commercial paper and certain corporate notes, bankers acceptances, repurchase agreements, and the State Treasurer s Local Government Investment Pool (LGIP). The VRE Operations Board has adopted a formal investment policy. The goal of the policy is to minimize risk and to ensure the availability of cash to meet VRE s expenditures, while generating revenue from the use of funds which might otherwise remain idle. The primary objectives of VRE s investment activities, in priority order, are: safety, liquidity and yield. The policy specifies eligible and ineligible investments; diversification requirements; maximum length of time for various types of investments; and the process for purchasing securities. Credit risk: The investment policy specifies credit quality for certain types of investments, as described below, in accordance with the Code of Virginia, and the policy specifies the qualifications for institutions providing depository and investment services. In addition, the Chief Financial Officer must conduct a quarterly review of the condition of each authorized financial institution and broker/dealer. Investment Savings account or CD s of any bank or savings and loan association within the Commonwealth of Virginia Bankers acceptances Commercial paper Corporate notes Negotiable certificates of deposit and negotiable bank deposit notes Credit Quality Bank or savings and loan association must be a qualified public depository Institution must be prime quality as determined by one or more recognized rating services Must be prime quality as rated by two of the following: Moody s (prime 1): S&P (A-1); Fitch (F-1); Duff and Phelps (D-1) Must be high quality as defined by ratings of at least AA by S&P and Aa by Moody s Must have ratings of at least A-1 by S&P and P-1 by Moody s for short term instruments and AA by S&P and Aa by Moody s for long term instruments 26
40 NOTES TO FINANCIAL STATEMENTS Note 2. Cash, Cash Equivalents and Investments (Continued) Custodial credit risk: For deposits, custodial credit risk is the risk that in the event of a failure of a depository financial institution, VRE may not recover its deposits. All cash of VRE is maintained in accounts collateralized in accordance with the Virginia Security for Public Deposits Act, Section et. seq. of the Code of Virginia or covered by federal depository insurance. Under the Act, banks holding public deposits in excess of the amounts insured by FDIC must pledge collateral in the amount of 50 percent of excess deposits to a collateral pool in the name of the State Treasury Board. If any member bank fails, the entire collateral pool becomes available to satisfy the claims of governmental entities. With the ability to make additional assessments, the multiple bank collateral pool functions similarly to depository insurance. The Commonwealth of Virginia Treasury Board is responsible for monitoring compliance with the collateralization and reporting requirements of the Act. At June 30, 2017 and 2016, the book balance of VRE s deposits with banks was $9,977,646 and $8,558,996, respectively. Interest rate risk: In accordance with its investment policy, VRE manages its exposure to declines in fair values by limiting the maturity of various investment vehicles, as indicated in the chart below. Interest rate risk does not apply to LGIP since it is an external investment pool classified in accordance with GASB Statement No. 79. Concentration of credit risk: VRE s investment policy provides limitations on the percentage of the portfolio that can be invested in each type of security, as indicated in the following chart. The limitations provided in the investment policy for maximum maturity and percentage of the portfolio for each category of investment, are as follows: Investment Length of Maturity Percent Allowed Bonds, notes, and other evidence of indebtedness of the United States 60 months or less 100% Bonds, notes, and other evidence of indebtedness of the Commonwealth of Virginia 60 months or less 100% Bonds, notes, and other evidence of indebtedness of any county, city, town, district, authority or other public body of the Commonwealth of Virginia 36 months or less 100% Bonds and notes of FNMA and FHLB 36 months or less 75% Savings accounts or CD s of any bank or savings and loan association within the Commonwealth of Virginia 12 months or less 20% Money market mutual funds 13 months or less 60% Repurchase agreements 24 months or less 20% Bankers acceptances 24 months or less 10% Prime Quality Commercial Paper (no more than 5% from one issuer) 270 days or less 35% High Quality Corporate Notes 24 months or less 50% Certificates representing ownership in treasury bond principal 24 months or less 50% LGIP N/A 100% Negotiable CD s and negotiable bank deposit notes 24 months or less 25% 27
41 NOTES TO FINANCIAL STATEMENTS Note 2. Cash, Cash Equivalents and Investments (Continued) At June 30, 2017 and 2016, VRE had investments of $39,177,828 and $19,520,329, respectively, in the LGIP. The LGIP is a professionally managed money market fund that invests in qualifying obligations and securities as permitted by Virginia statutes. Pursuant to Section of the Code of Virginia, the Treasury Board of the Commonwealth sponsors the LGIP and has delegated certain functions to the State Treasurer. The LGIP reports to the Treasury Board at the Treasury Board s regularly scheduled monthly meetings. VRE s investments in the LGIP are stated at amortized cost and classified as cash and cash equivalents. The LGIP has been assigned an AAAm rating by Standard & Poor s. The maturity of the LGIP is less than one year. The Commonwealth of Virginia Department of Treasury manages the VRE Insurance Trust. State statutes govern the portion of assets invested in the Commonwealth s pooled accounts, while the remainder is invested by an external portfolio manager. At June 30, 2017 and 2016, VRE had $10,416,871 and $10,386,757, respectively, invested in the Insurance Trust. From fiscal year 2011 through fiscal year 2015, any earnings on these investments were retained by the Commonwealth of Virginia. In fiscal years 2017 and 2016, earnings on the Insurance Trust in the amount of $98,560 and $69,444, respectively, were credited to VRE. The Insurance Trust Fund has not been assigned a rating. As of June 30, 2017 and 2016, the carrying values and maturity of VRE s investments were as follows: Investment Type Fair Value 2017 Maturities Less than 1 Year LGIP $ 39,177,828 $ 39,177,828 Insurance trust fund pooled funds 10,416,871 10,416,871 Total investments $ 49,594,699 $ 49,594,699 Investment Type Fair Value 2016 Maturities Less than 1 Year LGIP $ 19,520,329 $ 19,520,329 Insurance trust fund pooled funds 10,386,757 10,386,757 Total investments $ 29,907,086 $ 29,907,086 When applicable, VRE categorizes its fair value measurements within the fair value hierarchy established by GAAP. The hierarchy is based on the valuation inputs used to measure the fair value of the asset. Level 1 inputs are quoted prices in active markets for identical assets; Level 2 inputs are significant other observable inputs; and Level 3 inputs are significant unobservable inputs. VRE has no investments subject to fair value measurements as of June 30, 2017 and
42 NOTES TO FINANCIAL STATEMENTS Note 3. Capital Assets Capital asset activity for the year ended June 30, 2017 was as follows: Beginning Ending Balance Increases Deletions Transfers Balance Capital assets not being depreciated or amortized: Construction in progress $ 13,896,672 $ 21,156,914 $ - $ (11,149,422) $ 23,904,164 Capital assets being depreciated or amortized: Rolling stock 264,755,076 - (4,955,407) 11,149, ,949,091 Vehicles 138,310 29, ,422 Facilities 103,494,551 - (13,663) - 103,480,888 Track and signal improvements 84,700,564 - (1,215,214) - 83,485,350 Equipment and software 12,126, ,126,666 Equity in property of others 5,787, ,787,287 Furniture, equipment and software 5,489,336 60, ,550,152 Total capital assets being depreciated or amortized 476,491,790 89,928 (6,184,284) 11,149, ,546,856 Less accumulated depreciation or amortization for: Rolling stock 69,517,009 10,625,597 (4,955,407) - 75,187,199 Vehicles 90,335 14, ,175 Facilities 35,298,586 3,091, ,389,881 Track and signal improvements 23,765,242 2,798, ,563,391 Equipment and software 9,917, , ,672,766 Equity in property of others 3,466, , ,636,668 Furniture, equipment and software 4,408, , ,690,596 Total accumulated depreciation or amortization 146,463,913 17,737,170 (4,955,407) - 159,245,676 Total capital assets being depreciated or amortized, net 330,027,877 (17,647,242) (1,228,877) 11,149, ,301,180 Totals $ 343,924,549 $ 3,509,672 $ (1,228,877) $ - $ 346,205,344 Note: The chart above reflects the completion of the five new railcars project at a value of $11.1 million. VRE sold seven fully depreciated Gallery-style railcars to Metra in Chicago in fiscal year 2017, with a value of $4.9 million. The chart also reflects the reduction of $1.2 million in track and signal asset value. This reduction is due to an over estimation and accrual of expected remaining project costs at the time the asset went into service and was capitalized in fiscal year Subsequent payment activity identified this over-accrual, leading to the reduction of the final asset cost. Similarly, a reduction of $13,663 to facilities assets was related to a small refund of project costs after the project was capitalized in fiscal year
43 NOTES TO FINANCIAL STATEMENTS Note 3. Capital Assets (Continued) Capital asset activity for the year ended June 30, 2016 was as follows: Beginning Ending Balance Increases Deletions Transfers Balance Capital assets not being depreciated or amortized: Construction in progress $ 29,040,586 $ 36,332,568 $ - $ (51,476,482) $ 13,896,672 Capital assets being depreciated or amortized: Rolling stock 249,295, ,459, ,755,076 Vehicles 107,199 31, ,310 Facilities 102,449,961 26,808 (3,035,437) 4,053, ,494,551 Track and signal improvements 52,684,367 52,049-31,964,148 84,700,564 Equipment and software 11,996, , ,126,666 Equity in property of others 5,787, ,787,287 Furniture, equipment and software 5,443,390 45, ,489,336 Total capital assets being depreciated or amortized 427,765, ,704 (3,035,437) 51,476, ,491,790 Less accumulated depreciation or amortization for: Rolling stock 59,423,583 10,093, ,517,009 Vehicles 78,801 11, ,335 Facilities 32,341,597 3,043,200 (86,211) - 35,298,586 Track and signal improvements 21,439,935 2,325, ,765,242 Equipment and software 9,065, , ,917,802 Equity in property of others 3,296, , ,466,770 Furniture, equipment and software 3,950, , ,408,169 Total accumulated depreciation or amortization 129,596,559 16,953,565 (86,211) - 146,463,913 Total capital assets being depreciated or amortized, net 298,168,482 (16,667,861) (2,949,226) 51,476, ,027,877 Totals $ 327,209,068 $ 19,664,707 $ (2,949,226) $ - $ 343,924,549 Note 4. Long-Term Debt Obligations The following is a summary of long-term liability activity for the year ended June 30, 2017: Beginning Balance Increases Decreases Ending Balance Due Within One Year Capital leases $ 14,158,954 $ - $ (1,314,250) $ 12,844,704 $ 1,375,502 Note payable 55,628,942 - (2,188,783) 53,440,159 2,290,688 69,787,896 - (3,503,033) 66,284,863 3,666,190 Compensated absences 520, ,121 (334,941) 556,826 31,152 $ 70,308,543 $ 371,121 $ (3,837,974) $ 66,841,689 $ 3,697,342 30
44 NOTES TO FINANCIAL STATEMENTS Note 4. Long-Term Debt Obligations (Continued) Federal arbitrage regulations apply to the Gallery IV capitalized lease. Capitalized Lease Gallery IV (11 cars) $25,100,000 capitalized lease obligation; $965,679 due semi-annually, including interest at 4.59%, maturing in 2025, collateralized with Gallery IV railcars with a carrying value of $16,323,930. $ 12,810,417 Future minimum lease payments as of June 30, 2017 are as follows: Years Ending June 30, Amount 2018 $ 1,931, ,931, ,931, ,931, ,931, ,794,072 Total minimum lease payments 15,450,857 Less amount representing interest 2,640,440 Present value of lease payments $ 12,810,417 Capitalized Lease copiers $73,425 capitalized lease obligations; $1,329 due monthly, interest at 9.39%, maturing in 2020; $330 due monthly, interest at 11.73%, maturing in 2018, collateralized with three multifunction copiers with a carrying value of $25,380. $ 34,287 Future minimum lease payments as of June 30, 2017 are as follows: Years Ending June 30, Amount 2018 $ 19, , ,658 Total minimum lease payments 37,854 Less amount representing interest 3,567 Present value of lease payments $ 34,287 31
45 NOTES TO FINANCIAL STATEMENTS Note 4. Long-Term Debt Obligations (Continued) Note Payable Gallery IV (60 cars) In fiscal year 2008, VRE entered into an agreement with the Federal Railroad Administration for a loan of up to $72.5 million to purchase 50 Gallery railcars; in fiscal year 2009 the terms were amended to include ten additional Gallery railcars. A series of sixteen promissory notes were originally authorized and during fiscal year 2012 the balances on the individual notes were combined into a consolidated note. The note is secured by the revenues of VRE and the railcars. The carrying value of the railcars was $74,655,342 at June 30, $63,844,842 Promissory Note; due in quarterly amounts of $1,195,258 through March 2033, plus quarterly interest at 4.74% $ 53,440,159 Mandatory debt service requirements are as follows: Years Ending June 30, Principal Interest Total Required 2018 $ 2,290,688 $ 2,492,825 $ 4,783, ,401,211 2,382,302 4,783, ,513,907 2,269,606 4,783, ,641,432 2,142,081 4,783, ,765,809 2,017,704 4,783, ,964,023 7,953,540 23,917, ,204,782 3,712,781 23,917, ,658, ,206 4,783,513 $ 53,440,159 $ 23,096,045 $ 76,536,204 Note 5. Pension Plan Name of Plan: Identification of Plan: Administering Entity: Virginia Retirement System (VRS) Agent Multiple-Employer Pension Plan Virginia Retirement System (System) A. Plan Description All full-time, salaried permanent employees of VRE are automatically covered by VRS Retirement Plan upon employment. This plan is administered by the Virginia Retirement System (the System) along with plans for other employer groups in the Commonwealth of Virginia. Members earn one month of service credit for each month they are employed and for which they and their employer pay contributions to VRS. Members are eligible to purchase prior service, based on specific criteria as defined in the Code of Virginia, as amended. Eligible prior service that may be purchased includes prior public service, active military service, certain periods of leave, and previously refunded service. 32
46 NOTES TO FINANCIAL STATEMENTS Note 5. Pension Plan (Continued) A. Plan Description (Continued) The System administers three different benefit structures for covered employees Plan 1, Plan 2, and, Hybrid. Each of these benefit structures has a different eligibility criteria. The specific information for each plan and the eligibility for covered groups within each plan are set out in the table below: PLAN 1 PLAN 2 HYBRID RETIREMENT PLAN About Plan 1 About Plan 2 About the Hybrid Retirement Plan Plan 1 is a defined benefit plan. Plan 2 is a defined benefit plan. The Hybrid Retirement Plan The retirement benefit is based on The retirement benefit is based on combines the features of a defined a member s age, creditable service a member s age, creditable service benefit plan and a defined and average final compensation at and average final compensation at contribution plan. Most members retirement using a formula. retirement using a formula. hired on or after January 1, 2014 are Employees are eligible for Plan 1 if their membership date is before July 1, 2010, and they were vested Employees are eligible for Plan 2 if their membership date is on or after July 1, 2010, or their in this plan, as well as Plan 1 and Plan 2 members who were eligible and opted into the plan during a as of January 1, membership date is before July 1, special election window. (See 2010, and they were not vested as of January 1, Eligible Members ) The defined benefit is based on a member s age, creditable service and average final compensation at retirement using a formula. The benefit from the defined contribution component of the plan depends on the member and employer contributions made to the plan and the investment performance of those contributions. In addition to the monthly benefit payment payable from the defined benefit plan at retirement, a member may start receiving distributions from the balance in the defined contribution account, reflecting the contributions, investment gains or losses, and any required fees. 33
47 NOTES TO FINANCIAL STATEMENTS Note 5. Pension Plan (Continued) A. Plan Description (Continued) PLAN 1 PLAN 2 HYBRID RETIREMENT PLAN Eligible Members Employees are in Plan 1 if their membership date is before July 1, 2010, and they were vested as of January 1, Hybrid Opt-In Election Non-hazardous duty covered Plan 1 members were allowed to make an irrevocable decision to opt into the Hybrid Retirement Plan during a special election window held January 1 through April 30, The Hybrid Retirement Plan s effective date for eligible Plan 1 members who opted in was July 1, If eligible deferred members returned to work during the election window, they were also eligible to opt into the Hybrid Retirement Plan. Members who were eligible for an optional retirement plan (ORP) and had prior service under Plan 1 were not eligible to elect the Hybrid Retirement Plan and remain as Plan 1 or ORP. Eligible Members Employees are in Plan 2 if their membership date is on or after July 1, 2010, or their membership date is before July 1, 2010, and they were not vested as of January 1, Hybrid Opt-In Election Eligible Plan 2 members were allowed to make an irrevocable decision to opt into the Hybrid Retirement Plan during a special election window held January 1 through April 30, The Hybrid Retirement Plan s effective date for eligible Plan 2 members who opted in was July 1, If eligible deferred members returned to work during the election window, they were also eligible to opt into the Hybrid Retirement Plan. Members who were eligible for an optional retirement plan (ORP) and have prior service under Plan 2 were not eligible to elect the Hybrid Retirement Plan and remain as Plan 2 or ORP. Eligible Members Employees are in the Hybrid Retirement Plan if their membership date is on or after January 1, This includes: Political subdivision employees.* Members in Plan 1 or Plan 2 who elected to opt into the plan during the election window held January 1 through April 30, 2014; the plan s effective date for opt-in members was July 1, *Non-Eligible Members Some employees are not eligible to participate in the Hybrid Retirement Plan. They include: Political subdivision employees who are covered by enhanced benefits for hazardous duty employees Those employees eligible for an optional retirement plan (ORP) must elect the ORP plan or the Hybrid Retirement Plan. If these members have prior service under Plan 1 or Plan 2, they are not eligible to elect the Hybrid Retirement Plan and must select Plan 1 or Plan 2 (as applicable) or ORP. 34
48 NOTES TO FINANCIAL STATEMENTS Note 5. Pension Plan (Continued) A. Plan Description (Continued) PLAN 1 PLAN 2 HYBRID RETIREMENT PLAN Retirement Contributions Employees contribute 5% of their compensation each month to their member contribution account through a pre-tax salary reduction. Some political subdivisions elected to phase in the required 5% member contribution; all employees will be paying the full 5% by July 1, Member contributions are tax-deferred until they are withdrawn as part of a retirement benefit or as a refund. The employer makes a separate actuarially determined contribution to VRS for all covered employees. VRS invests both member and employer contributions to provide funding for the future benefit payment. Creditable Service Creditable service includes active service. Members earn creditable service for each month they are employed in a covered position. It also may include credit for prior service the member has purchased or additional creditable service the member was granted. A member s total creditable service is one of the factors used to determine their eligibility for retirement and to calculate their retirement benefit. It also may count toward eligibility for the health insurance credit in retirement, if the employer offers the health insurance credit. Retirement Contributions Employees contribute 5% of their compensation each month to their member contribution account through a pre-tax salary reduction. Some political subdivisions elected to phase in the required 5% member contribution; all employees will be paying the full 5% by July 1, Creditable Service Same as Plan 1. Retirement Contributions A member s retirement benefit is funded through mandatory and voluntary contributions made by the member and the employer to both the defined benefit and the defined contribution components of the plan. Mandatory contributions are based on a percentage of the employee s creditable compensation and are required from both the member and the employer. Additionally, members may choose to make voluntary contributions to the defined contribution component of the plan, and the employer is required to match those voluntary contributions according to specified percentages. Creditable Service Defined Benefit Component Under the defined benefit component of the plan, creditable service includes active service. Members earn creditable service for each month they are employed in a covered position. It also may include credit for prior service the member has purchased or additional creditable service the member was granted. A member s total creditable service is one of the factors used to determine their eligibility for retirement and to calculate their retirement benefit. It also may count toward eligibility for the health insurance credit in retirement, if the employer offers the health insurance credit. Defined Contribution Component Under the defined contribution component, creditable service is used to determine vesting for the employer contribution portion of the plan. 35
49 NOTES TO FINANCIAL STATEMENTS Note 5. Pension Plan (Continued) A. Plan Description (Continued) PLAN 1 PLAN 2 HYBRID RETIREMENT PLAN Vesting Vesting is the minimum length of service a member needs to qualify for a future retirement benefit. Members become vested when they have at least five years (60 months) of creditable service. Vesting means members are eligible to qualify for retirement if they meet the age and service requirements for their plan. Members also must be vested to receive a full refund of their member contribution account balance if they leave employment and request a refund. Members are always 100% vested in the contributions they make. Vesting Same as Plan 1. Vesting Defined Benefit Component Defined benefit vesting is the minimum length of service a member needs to qualify for a future retirement benefit. Members are vested under the defined benefit component of the Hybrid Retirement Plan when they reach five years (60 months) of creditable service. Plan 1 or Plan 2 members with at least five years (60 months) of creditable service who opted into the Hybrid Retirement Plan remain vested in the defined benefit component. Defined Contribution Component Defined contribution vesting refers to the minimum length of service a member needs to be eligible to withdraw the employer contributions from the defined contribution component of the plan. Members are always 100% vested in the contributions they make. Upon retirement or leaving covered employment, a member is eligible to withdraw a percentage of employer contributions to the defined contribution component of the plan, based on service. After two years, a member is 50% vested and may withdraw 50% of employer contributions. After three years, a member is 75% vested and may withdraw 75% of employer contributions. After four or more years, a member is 100% vested and may withdraw 100% of employer contributions. Distribution is not required by law until age 70½. 36
50 NOTES TO FINANCIAL STATEMENTS Note 5. Pension Plan (Continued) A. Plan Description (Continued) PLAN 1 PLAN 2 HYBRID RETIREMENT PLAN Calculating the Benefit The Basic Benefit is calculated based on a formula using the member s average final compensation, a retirement multiplier and total service credit at retirement. It is one of the benefit payout options available to a member at retirement. An early retirement reduction factor is applied to the Basic Benefit if the member retires with a reduced retirement benefit or selects a benefit payout option other than the Basic Benefit. Average Final Compensation A member s average final compensation is the average of the 36 consecutive months of highest compensation as a covered employee. Service Retirement Multiplier The retirement multiplier is a factor used in the formula to determine a final retirement benefit. The retirement multiplier for nonhazardous duty members is 1.70%. Normal Retirement Age Age 65. Calculating the Benefit See definition under Plan 1. Average Final Compensation A member s average final compensation is the average of their 60 consecutive months of highest compensation as a covered employee. Service Retirement Multiplier Same as Plan 1 for service earned, purchased or granted prior to January 1, For nonhazardous duty members the retirement multiplier is 1.65% for creditable service earned, purchased or granted on or after January 1, Normal Retirement Age Normal Social Security retirement age. Calculating the Benefit Defined Benefit Component See definition under Plan 1 Defined Contribution Component The benefit is based on contributions made by the member and any matching contributions made by the employer, plus net investment earnings on those contributions. Average Final Compensation Same as Plan 2. It is used in the retirement formula for the defined benefit component of the plan. Service Retirement Multiplier Defined Benefit Component The retirement multiplier for the defined benefit component is 1.0%. For members who opted into the Hybrid Retirement Plan from Plan 1 or Plan 2, the applicable multipliers for those plans will be used to calculate the retirement benefit for service credited in those plans. Normal Retirement Age Defined Benefit Component Same as Plan 2. Defined Contribution Component Members are eligible to receive distributions upon leaving employment, subject to restrictions. 37
51 NOTES TO FINANCIAL STATEMENTS Note 5. Pension Plan (Continued) A. Plan Description (Continued) PLAN 1 PLAN 2 HYBRID RETIREMENT PLAN Earliest Unreduced Retirement Eligibility Age 65 with at least five years (60 months) of creditable service or at age 50 with at least 30 years of creditable service. Earliest Reduced Retirement Eligibility Age 55 with at least five years (60 months) of creditable service or age 50 with at least 10 years of creditable service. Cost-of-Living Adjustment (COLA) in Retirement The COLA matches the first 3% increase in the Consumer Price Index for all Urban Consumers (CPI-U) and half of any additional increase (up to 4%) up to a maximum COLA of 5%. Eligibility: For members who retire with an unreduced benefit or with a reduced benefit with at least 20 years of creditable service, the COLA will go into effect on July 1 after one full calendar year from the retirement date. For members who retire with a reduced benefit and who have less than 20 years of creditable service, the COLA will go into effect on July 1 after one calendar year following the unreduced retirement eligibility date. Earliest Unreduced Retirement Eligibility Normal Social Security retirement age and have at least five years (60 months) of creditable service or when their age and service equal 90. Earliest Reduced Retirement Eligibility Age 60 with at least five years (60 months) of creditable service. Cost-of-Living Adjustment (COLA) in Retirement The COLA matches the first 2% increase in the Consumer Price Index for all Urban Consumers (CPI-U) and half of any additional increase (up to 2%), for a maximum COLA of 3%. Eligibility: Same as Plan 1 38 Earliest Unreduced Retirement Eligibility Defined Benefit Component Normal Social Security retirement age and have at least five years (60 months) of creditable service or when their age and service equal 90. Defined Contribution Component Members are eligible to receive distributions upon leaving employment, subject to restrictions. Earliest Reduced Retirement Eligibility Defined Benefit Component Members may retire with a reduced benefit as early as age 60 with at least five years (60 months) of creditable service. Defined Contribution Component Members are eligible to receive distributions upon leaving employment, subject to restrictions. Cost-of-Living Adjustment (COLA) in Retirement Defined Benefit Component Same as Plan 2. Defined Contribution Component Not applicable. Eligibility: Same as Plan 1 and Plan 2.
52 NOTES TO FINANCIAL STATEMENTS Note 5. Pension Plan (Continued) A. Plan Description (Continued) PLAN 1 PLAN 2 HYBRID RETIREMENT PLAN Cost-of-Living Adjustment (COLA) in Retirement (Continued) Cost-of-Living Adjustment (COLA) in Retirement (Continued) Cost-of-Living Adjustment (COLA) in Retirement (Continued) Exceptions to COLA Effective Dates: The COLA is effective July 1 following one full calendar year (January 1 to December 31) under any of the following circumstances: The member is within five years of qualifying for an unreduced retirement benefit as of January 1, The member retires on disability. The member retires directly from short-term or long-term disability under the Virginia Sickness and Disability Program (VSDP). The member is involuntarily separated from employment for causes other than job performance or misconduct and is eligible to retire under the Workforce Transition Act or the Transitional Benefits Program. The member dies in service and the member s survivor or beneficiary is eligible for a monthly death-inservice benefit. The COLA will go into effect on July 1 following one full calendar year (January 1 to December 31) from the date the monthly benefit begins. Exceptions to COLA Effective Dates: Same as Plan 1. Exceptions to COLA Effective Dates: Same as Plan 1 and Plan 2. Disability Coverage Members who are eligible to be considered for disability retirement and retire on disability, the retirement multiplier is 1.7% on all service, regardless of when it was earned, purchased or granted. VSDP members are subject to a oneyear waiting period before becoming eligible for non-work related disability benefits. Disability Coverage Members who are eligible to be considered for disability retirement and retire on disability, the retirement multiplier is 1.65% on all service, regardless of when it was earned, purchased or granted. Virginia Sickness and Disability Program (VSDP) members are subject to a one-year waiting period before becoming eligible for non-work related disability benefits. 39 Disability Coverage Eligible political subdivision (including Plan 1 and Plan 2 opt-ins) participate in the Virginia Local Disability Program (VLDP) unless their local governing body provides an employer-paid comparable program for its members. Hybrid members (including Plan 1 and Plan 2 opt-ins) covered under VLDP are subject to a one-year waiting period before becoming eligible for non-work related disability benefits.
53 NOTES TO FINANCIAL STATEMENTS Note 5. Pension Plan (Continued) A. Plan Description (Continued) PLAN 1 PLAN 2 HYBRID RETIREMENT PLAN Purchase of Prior Service Members may be eligible to purchase service from previous public employment, active duty military service, an eligible period of leave or VRS refunded service as creditable service in their plan. Prior creditable service counts toward vesting, eligibility for retirement and the health insurance credit. Only active members are eligible to purchase prior service. When buying service, members must purchase their most recent period of service first. Members also may be eligible to purchase periods of leave without pay. Purchase of Prior Service Same as Plan 1. Purchase of Prior Service Defined Benefit Component Same as Plan 1, with the following exceptions: Hybrid Retirement Plan members are ineligible for ported service. The cost for purchasing refunded service is the highest of 4% of creditable compensation or average final compensation. Plan members have one year from their date of hire or return from leave to purchase all but refunded prior service at approximate normal cost. After that one year period, the rate for most categories of service will change to actuarial cost. Defined Contribution Component Not applicable. Employees Covered by Benefit Terms As of the June 30, 2015 actuarial valuation, the following employees were covered by the benefit terms of the pension plan: Number Inactive Members or Their Beneficiaries Currently Receiving Benefits 19 Inactive Members: Vested 18 Non-vested 25 Active elsewhere in VRS 7 Total inactive members 50 Active Members 91 Total covered employees
54 NOTES TO FINANCIAL STATEMENTS Note 5. Pension Plan (Continued) A. Plan Description (Continued) Contributions The contribution requirement for active employees is governed by Section of the Code of Virginia, as amended, but may be impacted as a result of funding options provided to political subdivisions by the Virginia General Assembly. Employees are required to contribute 5.00% of their compensation toward their retirement. Prior to July 1, 2012, all or part of the 5.00% member contribution may have been assumed by the employer. Beginning July 1, 2012, new employees were required to pay the 5.00% member contribution. In addition, for existing employees, employers were required to begin making the employee pay the 5.00% member contribution. This could be phased in over a period of up to 5 years and the employer is required to provide a salary increase equal to the amount of the increase in the employee-paid member contribution. VRE elected to not phase in the increase, but rather provided a 5.00% salary increase to all employees on July 1, VRE s contractually required contribution rate for the year ended June 30, 2017 was 5.37% for Plan 1 and Plan 2 and 4.37% for the Hybrid Plan of covered employee compensation. This rate was based on an actuarially determined rate from an actuarial valuation as of June 30, This rate, when combined with employee contributions, was expected to finance the costs of benefits earned by an employee during the year, with an additional amount to finance any unfunded accrued liability. Contributions to the pension plan from VRE were $245,847 and $276,597 for the years ended June 30, 2017 and 2016, respectively. B. Net Pension Asset/Liability VRE s net pension asset/liability was measured as of June 30, The total pension liability used to calculate the net pension asset/liability was determined by an actuarial valuation performed as of June 30, 2015, using updated actuarial assumptions, applied to all periods included in the measurement and rolled forward to the measurement date of June 30, Actuarial Assumptions The total pension liability for VRE s retirement plan was based on an actuarial valuation as of June 30, 2015, using the Entry Age Normal Actuarial cost method and the following assumptions, applied to all periods included in the measurement and rolled forward to the measurement date of June 30, Inflation 2.5% Salary increases, including inflation 3.5% % Investment rate of return 7.0%, net of pension plan investment expense, including inflation* * Administrative expenses as a percent of the market value of assets for the last experience study were found to be approximately 0.06% of the market assets for all of the VRS plans. This would provide an assumed investment return rate for GASB purposes of slightly more than the assumed 7.0%. However, since the difference was minimal, and a more conservative 7.0% investment return assumption provided a projected plan net position that exceeded the projected benefit payments, the long-term expected rate of return on investments was assumed to be 7.0% to simplify preparation of pension liabilities. 41
55 NOTES TO FINANCIAL STATEMENTS Note 5. Pension Plan (Continued) B. Net Pension Asset/Liability (Continued) Actuarial Assumptions (Continued) Mortality rates were based on the following: Mortality Rates: 14% of pre-retirement deaths are assumed to be service related. - Pre-retirement: RP-2000 Employee Mortality Table Projected with Scale AA to 2020 with males set forward 2 years and females set back 3 years. - Post-retirement: RP-2000 Combined Mortality Table Projected with Scale AA to 2020 with females set back 1 year. - Post-disablement: RP-2000 Disabled Life Mortality Table Projected to 2020 with males set back 3 years and no provision for future mortality improvement. The actuarial assumptions used in the June 30, 2015 valuation were based on the results of an actuarial experience study for the period from July 1, 2008 through June 30, Changes to the actuarial assumptions as a result of the experience study are as follows: Update mortality table Decrease in rates of service retirement Decrease in rates of disability retirement Reduce rates of salary increase by 0.25% per year Long-Term Expected Rate of Return The long-term expected rate of return on pension System investments was determined using lognormal distribution analysis in which best-estimate ranges of expected future real rates of return (expected returns, net of pension System investment expense and inflation) are developed for each major asset class. These ranges are combined to produce the long-term expected rate of return by weighting the expected future real rates of return by the target asset allocation percentage and by adding expected inflation. The target asset allocation and best estimates of arithmetic real rates of return for each major asset class are summarized in the following table: 42
56 NOTES TO FINANCIAL STATEMENTS Note 5. Pension Plan (Continued) B. Net Pension Asset/Liability (Continued) Long-Term Expected Rate of Return (Continued) Weighted Arithmetic Average Long-Term Long-Term Target Expected Expected Asset Class (Strategy) Allocation Rate of Return Rate of Return U.S. Equity 19.50% 6.46% 1.26% Developed Non-U.S. Equity 16.50% 6.28% 1.04% Emerging Market Equity 6.00% 10.00% 0.60% Fixed Income 15.00% 0.09% 0.01% Emerging Debt 3.00% 3.51% 0.11% Rate Sensitive Credit 4.50% 3.51% 0.16% Non-Rate Sensitive Credit 4.50% 5.00% 0.23% Convertibles 3.00% 4.81% 0.14% Public Real Estate 2.25% 6.12% 0.14% Private Real Estate 12.75% 7.10% 0.91% Private Equity 12.00% 10.41% 1.25% Cash 1.00% -1.50% -0.02% Total % 5.83% Inflation 2.50% * Expected arithmetic nominal return 8.33% * Using stochastic projection results provides an expected range of real rates of return over various time horizons. Looking at one year results produces an expected real return of 8.33% but also has a high standard deviation, which means there is high volatility. Over larger time horizons, the volatility declines significantly and provides a median return of 7.44%, including expected inflation of 2.50%. 43
57 NOTES TO FINANCIAL STATEMENTS Note 5. Pension Plan (Continued) B. Net Pension Asset/Liability (Continued) Discount Rate The discount rate used to measure the total pension liability was 7.00%. The projection of cash flows used to determine the discount rate assumed that System member contributions will be made per the VRS Statutes and the employer contributions will be made in accordance with the VRS funding policy at rates equal to the difference between actuarially determined contribution rates adopted by the VRS Board of Trustees and the member rate. Through the fiscal year ending June 30, 2018, the rate contributed by the employer for VRE s retirement plan will be subject to the portion of the VRS Board-certified rates that are funded by the Virginia General Assembly. From July 1, 2018 on, participating employers are assumed to contribute 100% of the actuarially determined contribution rates. Based on those assumptions, the pension plan s fiduciary net position was projected to be available to make all projected future benefit payments of current active and inactive employees. Therefore, the long-term expected rate of return was applied to all periods of projected benefit payments to determine the total pension liability. C. Changes in the Net Pension Asset/Liability Total Pension Plan Fiduciary Net Pension Liability Net Position Liability (Asset) Balance at June 30, 2015 $ 13,694,496 $ 14,064,326 $ (369,830) Changes for the year: Service cost 778, ,686 Interest 942, ,652 Difference between expected and expected and actual experience 284, ,843 Contributions employer - 478,465 (478,465) Contributions employee - 375,574 (375,574) Net investment income - 259,738 (259,738) Benefit payments, including refunds of employee contributions (456,078) (456,078) - Administrative expense - (8,396) 8,396 Other changes - (107) 107 Net changes 1,550, , ,907 Balance at June 30, 2016 $ 15,244,599 $ 14,713,522 $ 531,077 Note: The information above is derived from the actuarial valuation report for the Potomac and Rappahannock Transportation Commission, which consolidates information for both PRTC and VRE employees. No separate data on funding progress is available solely for VRE. VRE has recorded a net pension liability of $311,424 on its Statements of Net Position based on a percentage of contributions to the plan for fiscal year VRE s percentage of total contributions to the plan was percent. This percentage was used to allocate a portion of the net pension liability to VRE. 44
58 NOTES TO FINANCIAL STATEMENTS Note 5. Pension Plan (Continued) C. Changes in the Net Pension Asset/Liability (Continued) Sensitivity of the Net Pension Asset/Liability to Changes in the Discount Rate The following presents the net pension asset/liability of VRE, using the discount rate of 7.00%, as well as what VRE s net pension (asset) liability would be if it were calculated using a discount rate that is 1-percentage-point lower (6.00%) or 1-percentage-point higher (8.00%) than the current rate: Current 1% Decrease Discount Rate 1% Increase (6.00%) (7.00%) (8.00%) Plan s net pension (asset) liability $ 2,744,539 $ 531,077 $ (1,291,234) Pension Plan Fiduciary Net Position Detailed information about the pension plan s fiduciary net position is available in the separately issued VRS financial report. Additional financial information supporting the preparation of the VRS Political Subdivision Plan Schedules (including the unmodified audit opinion on the financial statements and required supplementary information) is presented in the separately issued VRS 2016 Comprehensive Annual Financial Report (CAFR). A copy of the 2016 VRS CAFR is publicly available through the About VRS link on the VRS website at or a copy may be obtained by submitting a request to the VRS Chief Financial Officer at P.O. Box 2500, Richmond, Virginia D. Pension Expense and Deferred Outflows of Resources Related to Pensions For the year ended June 30, 2017, VRE recognized pension expense of $15,715. VRE also reported deferred outflows of resources from the following sources: Deferred Outflows of Resources Differences between expected and actual experience $ 164,947 Net difference between projected and actual earnings on pension plan investments 235,468 Employer contributions subsequent to the measurement date 245,847 Total $ 646,262 The $245,847 reported as deferred outflows of resources related to pensions resulting from VRE s contributions subsequent to the measurement date will be recognized as a decrease of the net pension liability in the year ending June 30,
59 NOTES TO FINANCIAL STATEMENTS Note 5. Pension Plan (Continued) D. Pension Expense and Deferred Outflows of Resources Related to Pensions (Continued) Amounts reported as deferred outflows of resources related to pensions will be recognized in pension expense as follows: Year Ending June 30, Amount 2018 $ 57, , , ,557 $ 400,415 Note 6. Operating Leases and Agreements Operating Access Agreements with the CSX and Norfolk Southern railroads provide the Commissions the right to use tracks owned by the railroads in the provision of commuter rail passenger service. These agreements require the Commissions to pay the railroads a monthly base fee and to reimburse the railroads for any incremental cost incurred by the railroads as a result of providing track access for commuter rail service. For the years ended June 30, 2017 and 2016, annual track usage fees totaled approximately $9,545,000 and $9,224,100, respectively, and facility and other identified costs totaled approximately $531,000 and $521,000, respectively. The increase in track usage fees reflects both an annual increase to the base fee and the addition of a full year of service of the new Fredericksburg Line train introduced during fiscal year The agreement between Amtrak and the Commissions for access to and storage of equipment at Union Station and mid-day maintenance, electrical power and other services became effective on July 1, For the years ended June 30, 2017 and 2016, costs for track access and equipment storage totaled approximately $6,502,000 and $5,831,000, respectively, and mid-day maintenance, utility and other services totaled approximately $4,636,000 and $4,332,000, respectively. Cost adjustments will be made in fiscal year 2018 to reflect changes to various published cost indices and the number of trains that have access to and are stored and serviced at the terminal. After October 1, 2015, charges for terminal access are determined in accordance with the cost-sharing arrangement for the Northeast Corridor passenger rail infrastructure mandated by the Passenger Rail Investment and Improvement Act of 2008 (PRIIA). The Commissions signed a contract with Keolis Rail Services Virginia, LLC, for train operations and maintenance for a five-year period beginning July 1, Separate contracts for maintenance of equipment and facilities became effective for the period beginning July 1, The cost of train operations and maintenance for the years ended June 30, 2017 and 2016 totaled approximately $21,331,000 and $19,828,000, respectively. Costs are based on an annual budget prepared in advance. Costs in fiscal year 2017 reflect contractual increases, added services and the first full year of service of the additional train added during fiscal year Costs for fiscal year 2018 will be adjusted for service additions or deletions and annual changes to the Consumer Price Index. 46
60 NOTES TO FINANCIAL STATEMENTS Note 7. Related Party Transactions VRE reimburses the Commissions for expenditures made on behalf of VRE. During 2017 and 2016, these payments included $7,011,684 and $6,342,095 of salary-related costs and $8,086 and $19,191 of administrative costs, respectively, which are functionally classified with similar payments made directly to vendors and contractors. In addition, VRE pays the Commissions for direct labor and associated indirect costs incurred for services rendered under budgeted activities for VRE. These staff support payments totaled $80,000 to NVTC for both periods, and $87,131 and $85,788 to PRTC during 2017 and 2016, respectively. VRE also contracts with PRTC for connecting bus service to selected stations on an as needed basis. PRTC bus service costs amounted to approximately $8,481 and $1,079 in 2017 and 2016, respectively. Amounts payable to NVTC and PRTC were $9,072 and $2,697,523, respectively, at June 30, 2017 and $28,919 and $1,863,540, respectively, at June 30, Note 8. Liability Insurance Plan VRE is exposed to various risks of loss related to torts; theft of, damage to and destruction of assets; and natural disasters. The Virginia Department of Treasury, Division of Risk Management has established the terms of VRE s Commuter Rail Operations Liability Plan (the Insurance Plan). The Insurance Plan consists of a combination of self-insurance reserves and purchased insurance in amounts actuarially determined to meet the indemnification requirements of the Operating Access Agreements and the Purchase of Services Agreement and VRE s own need for liability and property coverage. The Commissions indemnify each of the railroads in an amount up to the passenger rail liability cap (currently at $295,000,000) for any claims against persons or property associated with commuter rail operations. Settled claims have not exceeded commercial coverage during any of the past three fiscal years. The liability for incurred but not reported claims was approximately $149,000 at June 30, 2017 and $163,000 at June 30, The Division of Risk Management manages the Insurance Trust Fund pursuant to provisions of the Insurance Plan. Since November 2006, all plan assets have been invested in the Department of Treasury common pool. Activity in the Insurance Trust Fund for the years ended June 30, 2017 and 2016 was as follows: Beginning balance, July 1 $ 10,386,757 $ 10,434,495 Contribution to reserves 3,900,000 3,950,000 Insurance premiums paid (3,909,349) (3,966,626) Investment income 98,560 69,444 Actuarial and administrative charges (59,097) (81,707) Transfer to VRE for small liability claims - (18,849) Ending balance, June 30 $ 10,416,871 $ 10,386,757 An actuarial study is performed annually to determine the adequacy of the Insurance Trust Fund for the risk retained and to determine the required contribution to reserves. 47
61 NOTES TO FINANCIAL STATEMENTS Note 9. Contingencies and Contractual Commitments At June 30, 2017, there were disputes between VRE and certain vendors. The amounts of any settlements, should they occur, are not determinable at this time. However, such amounts are not expected to be material in relation to the recorded amounts. The Commissions have outstanding commitments for construction of facilities and equipment. A combination of Federal and Commonwealth of Virginia grants and local funds will be used to finance these capital projects. The following is a summary of the more significant contractual commitments, net of expenses incurred as of June 30, 2017: Stations and Parking Lots $ 3,723,340 Rolling Stock 19,400,653 Maintenance and Layover Yards 1,956,777 Track and Signal Improvements 169,411 Other Administrative 1,282,759 Total $ 26,532,940 The Commissions have received proceeds from several federal and state grant programs. In the event of an audit of these grants, certain costs may be questioned as not being appropriate expenses under the grant agreements. Such findings may result in the refund of grant monies to the grantor agencies. Based on VRE s policies and past experience, management believes that no refunds would be due in the case of an audit and, accordingly, no provision has been made in the accompanying financial statements for the refund of grant monies. The federal grant agreements control the use and disposal of property acquired with federal grant funds. If property is removed from service prior to the end of its useful life, the grant recipient may be required to return to the grantor agency the federal assistance expended on that property. In addition, permission of the grantor agency is required if property is disposed of prior to the end of its useful life or at any time for an amount in excess of $5,000. The Master Agreement for the use of Commonwealth of Virginia Transportation Funds controls the use and disposal of property acquired with state grant funds. If any project equipment are not used for the purpose for which they were purchased for the duration of their useful lives, the Commonwealth has the option of requiring the grantee to relinquish title to the project equipment or remit an amount equal to the proportional share of the fair market value based upon the ratio of participation by the state. For facilities, the Commonwealth requires an amount equal to the proportional share of fair market value based upon the ratio of participation by the state to be remitted. Note 10. Pending GASB Statements At June 30, 2017, the Governmental Accounting Standards Board (GASB) had issued statements not yet implemented by the VRE reporting entity. The statements which might impact VRE are as follows: GASB Statement No. 75, Accounting and Financial Reporting for Postemployment Benefits Other Than Pensions, will improve accounting and financial reporting by state and local governments for OPEB. It will also require the recognition of the entire OPEB liability and a comprehensive measure of OPEB expense. Statement No. 75 will be effective for fiscal years beginning after June 15,
62 NOTES TO FINANCIAL STATEMENTS Note 10. Pending GASB Statements (Continued) GASB Statement No. 83, Certain Asset Retirement Obligations, addresses accounting and financial reporting for certain asset retirement obligations (ARO s). This Statement establishes criteria for determining the timing and pattern of recognition of a liability and a corresponding deferred outflow of resources for ARO s. Statement No. 83 will be effective for fiscal years beginning after June 15, GASB Statement No. 85, Omnibus 2017, will enhance consistency in the application of accounting and financial reporting requirements. Consistent reporting will improve the usefulness of information for users of state and local government financial statements. Statement No. 85 will be effective for fiscal years beginning after June 15, GASB Statement No. 86, Certain Debt Extinguishment Issues, will improve accounting and financial reporting for debt extinguishments by establishing uniform guidance for derecognizing debt that is defeased in substance. Statement No. 86 will be effective for fiscal years beginning after June 15, GASB Statement No. 87, Leases, will increase the usefulness of VRE s financial statements by requiring reporting of certain lease assets and liabilities and deferred inflows of resources for leases that previously were classified as operating leases. Statement No. 87 will be effective for fiscal years beginning after December 15, VRE has not yet determined the effect of these statements on its financial statements. Note 11. Subsequent Events VRE sold seven fully depreciated Pullman-Standard Gallery-style railcars to Foxville & Northern Railroad Co., LLC in July The cars were sold for $500 per unit, and there was no remaining Federal interest at the time the sale was completed. In July 2017, the VRE Operations Board approved the execution of a 15-year lease with one 5-year option for additional office space in an amount not to exceed $3,902,008. The office space is owned by the International Association of Refrigerated Warehouses and is located at 1500 King Street in Alexandria, adjacent to the current VRE offices. The agreement was executed in September In August 2017, VRE entered into contracts to purchase fuel at set prices for delivery in August 2017 through October The fuel will be used in the normal course of operations and is not being purchased for resale. The total commitment is for 126,000 gallons of fuel at a cost of approximately $220,
63 Required Supplementary Information
64
65 SCHEDULE OF CONTRIBUTIONS - VIRGINIA RETIREMENT SYSTEM Fiscal Year June 30, Contractually required contribution (CRC) $ 528,296 $ 460,763 $ 478,465 $ 419,283 Contributions in relation to the CRC 528, , , ,283 Contribution deficiency (excess) $ - $ - $ - $ - Covered-employee payroll $ 6,856,560 $ 7,617,414 $ 7,711,934 $ 8,619,597 Contributions as a percentage of covered-employee payroll 7.70% 6.05% 6.20% 4.86% Notes to Schedule: (1) (2) This schedule is presented to illustrate the requirement to show information for 10 years. However, until a full 10-year trend is compiled, the Commission will present information for those years for which information is available. The information on this schedule is derived from the actuarial valuation report for the Potomac & Rappahannock Transportation Commission, which consolidates information for both PRTC and VRE employees. No separate data on funding progress is available solely for VRE. See Notes to Required Supplementary Information. 50
66 SCHEDULE OF CHANGES IN NET PENSION (ASSET) LIABILITY - VIRGINIA RETIREMENT SYSTEM Fiscal Year June 30, Total Pension Liability Service cost $ 722,134 $ 743,258 $ 778,686 Interest 763, , ,652 Differences between expected and actual experience - 92, ,843 Benefit payments, including refunds of employee contributions (222,525) (275,932) (456,078) Net change in total pension liability 1,263,313 1,409,867 1,550,103 Total pension liability - beginning 11,021,316 12,284,629 13,694,496 Total pension liability - ending (a) $ 12,284,629 $ 13,694,496 $ 15,244,599 Plan Fiduciary Net Position Contributions - employer $ 528,296 $ 460,763 $ 478,465 Contributions - employee 414, , ,574 Net investment income 1,697, , ,738 Benefit payments, including refunds of employee contributions (222,525) (275,932) (456,078) Administrative expense (8,482) (7,442) (8,396) Other 89 (131) (107) Net change in plan fiduciary net position 2,409,395 1,275, ,196 Plan fiduciary net position - beginning 10,379,843 12,789,238 14,064,326 Plan fiduciary net position - ending (b) $ 12,789,238 $ 14,064,326 $ 14,713,522 PRTC's net pension (asset) liability - ending (a) - (b) $ (504,609) $ (369,830) $ 531,077 Plan fiduciary net position as a percentage of the total pension liability % % 96.52% Covered-employee payroll $ 6,856,560 $ 7,617,414 $ 7,711,934 PRTC's net pension (asset) liability as a percentage of covered-employee payroll 7.36% 4.86% -6.89% Notes to Schedule: (1) (2) This schedule is presented to illustrate the requirement to show information for 10 years. However, until a full 10-year trend is compiled, PRTC will present information for those years for which information is available. The information on this schedule is derived from the actuarial valuation report for the Potomac & Rappahannock Transportation Commission, which consolidates information for both PRTC and VRE employees. No separate data on funding progress is available solely for VRE. See Notes to Required Supplementary Information. 51
67 NOTES TO REQUIRED SUPPLEMENTARY INFORMATION Year Ended June 30, 2017 Note 1. Changes of Benefit Terms There have been no actuarially material changes to the System benefit provisions since the prior actuarial valuation. The 2014 valuation includes Hybrid Retirement Plan members for the first time. The hybrid plan applies to most new employees hired on or after January 1, 2014 and not covered by enhanced hazardous duty benefits. Because this is a fairly new benefit and the number of participants was relatively small, the impact on the liabilities as of the measurement date of June 30, 2016 are not material. Note 2. Changes of Assumptions The following changes in actuarial assumptions were made effective June 30, 2013 based on the most recent experience study of the System for the four-year period ended June 30, 2012: Update mortality table Decrease in rates of service retirement Decrease in rates of disability retirement Reduce rates of salary increase by 0.25% per year Note 3. Contractually Required Contributions The actuarially determined contribution rates are calculated as of June 30, one year prior to the beginning of the fiscal year in which contributions are reported. Methods and assumptions used to determine contribution rates: Actuarial cost method Entry age Amortization method Level percentage of payroll, closed Remaining amortization period years Asset valuation method 5-year smoothed marked Cost-of-living adjustments 2.25%-2.50% Projected salary increases 3.50%-5.35%, including inflation at 2.50% Investment rate of return 7.0%, including inflation at 2.50% 52
68 THIS PAGE NOT USED
69 Statistical Section
70
71 STATISTICAL SECTION This portion of Virginia Railway Express Comprehensive Annual Financial Report presents detailed information as a context for understanding what the information in the financial statements, note disclosures, and required supplemental information says about VRE s overall financial health. Unless otherwise noted, the information in these schedules is derived from the Comprehensive Annual Financial Reports for the relevant year. Contents Page Financial Trends These schedules contain trend information to help the reader understand how VRE s financial performance has changed over time Other Statistical Information These schedules and service area map provide other information useful to certain readers of VRE s financial statements Demographic and Economic Information These schedules offer demographic and economic indicators to assist the reader understand the environment within which VRE s financial activities take place
72 SCHEDULE OF CHANGE IN NET POSITION Last Ten Fiscal Years (Unaudited) 54 June 30, Operating Revenues: Passenger revenue $ 42,280,669 $ 37,696,913 $ 36,700,191 $ 37,093,476 $ 34,733,106 $ 34,721,591 $ 32,368,123 $ 30,019,730 $ 25,909,794 $ 21,688,092 Equipment rentals and other 301, , , , , , , , , ,242 Total operating revenues 42,582,290 37,936,965 37,118,760 37,291,391 34,972,487 35,025,775 32,568,192 30,267,105 26,034,720 21,821,334 Nonoperating Revenues: Subsidies: Commonwealth of Virginia grants 18,265,581 16,572,077 14,401,957 19,330,105 14,967,197 12,711,602 12,806,509 13,153,781 13,482,816 10,795,443 Federal grants - with PRTC as grantee 15,937,225 13,917,534 13,688,723 15,931,876 18,559,490 17,181,121 16,157,284 14,525,795 12,784,123 12,522,868 Jurisdictional contributions 17,250,240 16,428,800 16,456,986 16,428,800 16,428,800 15,943,917 16,070,307 16,376,968 17,275,500 13,379,155 Regional transportation funding (NVTA) 461, , Capital Grants and Assistance: Commonwealth of Virginia grants 3,033,657 9,826,429 14,694, Federal grants - with PRTC as grantee 15,204,474 22,125,460 17,764,759 5,420,552 1,269,732 9,997,070 40,136,130 15,437,312 14,648,460 18,259,459 Regional transportation funding (NVTA) 651, Federal grants - NVTC and other ,308, ,355 53, ,088 Pass-through to Fairfax County (4,456,818) - In-kind and other local contributions 162, ,659 1,079,885 2,637, ,031 46, , ,631 1,903, ,338 Interest income: Operating funds 285,495 93,677 34,337 27,860 18,573 16,813 14,675 23, , ,553 Insurance trust 98,560 69, , , ,204 Other restricted funds , , ,093 Insurance proceeds ,676 Gain (loss) on sale of assets 3,500 - (60,293) 1,500 (769,042) (358,382) (271,606) (393,419) - - Total nonoperating revenues 71,355,025 80,427,948 78,060,690 59,778,698 50,803,553 55,540,226 88,628,527 60,273,066 56,097,958 58,418,877 Total revenues 113,937, ,364, ,179,450 97,070,089 85,776,040 90,566, ,196,719 90,540,171 82,132,678 80,240,211 Operating Expenses: Contract operations and maintenance 25,873,933 24,082,615 22,782,752 23,151,332 21,751,488 21,093,606 21,405,930 20,291,361 18,694,757 17,433,267 Other operations and maintenance 14,461,209 13,662,606 14,334,954 14,891,502 12,785,223 14,594,826 12,949,155 12,055,009 12,575,004 11,562,892 Property leases and access fees 16,236,606 15,175,732 14,318,788 13,924,017 13,504,023 13,123,367 11,756,531 9,482,367 8,686,385 8,279,505 Insurance 3,970,753 4,046,198 3,964,673 3,991,969 4,022,072 3,491,620 4,049,906 3,864,366 3,866,438 4,099,475 Marketing and sales 2,532,214 2,393,332 2,267,729 2,012,321 1,872,343 2,211,354 1,502,434 1,259,048 1,477,554 1,537,243 General and administrative 10,904,945 10,514,343 7,968,298 7,793,040 6,784,379 7,111,871 5,964,956 5,642,360 5,492,566 5,151,117 Depreciation and amortization 17,737,170 16,953,565 15,391,195 14,706,458 14,465,445 13,373,129 12,218,203 11,337,406 10,445,041 10,640,098 Total operating expenses 91,716,830 86,828,391 81,028,389 80,470,639 75,184,973 74,999,773 69,847,115 63,931,917 61,237,745 58,703,597 Nonoperating (Revenues) Expenses: Interest and amortization 3,217,756 3,384,762 3,534,644 4,026,724 4,683,094 6,524,348 5,566,829 5,682,935 6,014,243 4,525,279 (Gain) loss on sale of assets (4,218,641) 3,176,932 Total nonoperating expenses, net 3,217,756 3,384,762 3,534,644 4,026,724 4,683,094 6,524,348 5,566,829 5,682,935 1,795,602 7,702,211 Special Items - 1,882,945-3,660, Total expenses 94,934,586 92,096,098 84,563,033 88,158,149 79,868,067 81,524,121 75,413,944 69,614,852 63,033,347 66,405,808 Change in net assets $ 5,907,973 $ 9,041,880 $ 45,782,775 $ 20,925,319 $ 19,099,331 $ 13,834,403 Change in net position $ 19,002,729 $ 26,268,815 $ 30,616,417 $ 8,911,940 Note: Years after fiscal year 2010 reflect change in classification of Gain (loss) on sale of assets. Interest costs in fiscal year 2012 restated to comply with GASB 65. Source: VRE's Audited Financial Statements.
73 SCHEDULE OF COMPONENTS OF NET POSITION Last Ten Fiscal Years (Unaudited) June 30, Net investment in capital assets $ 279,920,481 $ 274,136,653 $ 254,085,092 $ 220,069,396 $ 220,007,440 $ 220,396,390 $ 213,710,235 $ 165,407,433 $ 144,566,529 $ 114,677,949 Restricted for liability insurance plan 10,470,506 10,439,990 10,487,532 10,454,171 10,294,874 10,156,492 10,052,968 9,511,797 8,229,082 7,470,123 Restricted for debt service and capital lease ,731,166 6,563,328 6,408,466 6,259,239 5,980,313 5,850,112 7,287,789 Restricted grants or contributions 779, , , , ,250 34, ,193 1,269,313 Unrestricted assets 68,885,778 55,697,393 50,211,820 46,973,386 35,845,639 28,056,773 24,277,019 20,676,168 10,905,605 7,712,570 Total net assets $ 265,969,463 $ 254,899,711 $ 201,610,330 $ 169,745,521 $ 138,417,744 Total net position $ 360,055,988 $ 341,053,259 $ 314,784,444 $ 284,228,119 $ 272,851,551 Note: Method of reporting was revised for fiscal year Fiscal year 2012 balance restated to comply with GASB 65. Source: VRE's Audited Financial Statements. 55
74 SCHEDULE OF OUTSTANDING DEBT Last Ten Fiscal Years (Unaudited) June 30, Revenue Bonds: $37,625,000 Commuter Rail Revenue Bond, Series 1993 $ - $ - $ - $ - $ - $ - $ - $ 5,065,000 $ 9,875,000 $ 14,450,000 $23,000,000 Commuter Rail Revenue Bond, Series ,635,000 $31,700,000 Commuter Rail Revenue Bond, Series ,555,000 12,775,000 18,685,000 24,295,000 24,425,000 24,550,000 24,670,000 Capital Leases: $271,804 Capitalized Lease Obligation $2,717,409 Capitalized Lease Obligation ,665 $25,100,000 Capitalized Lease Obligation 12,810,417 14,108,906 15,349,786 16,535,611 17,668,825 18,751,762 19,786,652 20,775,627 21,720,726 22,623,892 $74,425 Capitalized Lease Obligation 34,287 50,048 64,331 Notes Payable: $900,000 SunTrust Bank , , , , ,000 $63,844,842 FRA Notes 53,440,159 55,628,942 57,709,856 59,698,580 61,595,765 63,409,659 63,305,611 63,749,851 56,122,937 26,970,555 Outstanding as of June 30 $ 66,284,863 $ 69,787,896 $ 73,123,973 $ 82,789,191 $ 92,039,590 $ 101,166,421 $ 107,767,263 $ 114,455,478 $ 112,768,663 $ 104,330, Debt per Capita: Outstanding as of June 30 $ 66,284,863 $ 69,787,896 $ 73,123,973 $ 82,789,191 $ 92,039,590 $ 101,166,421 $ 107,767,263 $ 114,455,478 $ 112,768,663 $ 104,330,112 Total Participating Jurisdictional Population N/A N/A 2,314,253 2,291,535 2,272,215 2,238,627 2,189,988 2,159,228 2,116,826 2,079,204 Debt per Capita N/A N/A $ $ $ $ $ $ $ $ Outstanding Debt as a Percentage of Personal Income: Outstanding as of June 30 $ 66,284,863 $ 69,787,896 $ 73,123,973 $ 82,789,191 $ 92,039,590 $ 101,166,421 $ 107,767,263 $ 114,455,478 $ 112,768,663 $ 104,330,112 Total Personal Income N/A N/A 155,187,512, ,195,320, ,972,030, ,296,802, ,548,575, ,509,757, ,018,523, ,410,734,000 Total Outstanding Debt as a Percentage of Personal Income N/A N/A 0.05% 0.06% 0.06% 0.07% 0.09% 0.09% 0.09% 0.08% The population data for each participating jurisdiction can be found in the following reports. (1) Fairfax County fiscal year 2016 Comprehensive Annual Financial Report, Statistical Section, Table 4.1, page 277 (2) Prince William County fiscal year 2016 Comprehensive Annual Financial Report, Statistical Section, Table 16, page 213. (3) City of Manassas fiscal year 2016 Comprehensive Annual Financial Report, Statistical Section, Table 14, page 133 (4) City of Manassas Park fiscal year 2015 Comprehensive Annual Financial Report, Statistical Section, Table 14, page 130 (5) Stafford County fiscal year 2016 Comprehensive Annual Financial Report, Statistical Section, Table S-15; page 144 (6) City of Fredericksburg fiscal year 2016 Comprehensive Annual Financial Report, Statistical Section, Table 14, page 166 (7) Spotsylvania County fiscal year 2016 Comprehensive Annual Financial Report, Statistical Section, Table S-13, page 145 (8) City of Alexandria fiscal year 2016 Comprehensive Annual Financial Report, Statistical Section, Table XIV, page 186, Table XI, Page 184 (9) Arlington County fiscal year 2016 Comprehensive Annual Financial Report, Statistical Section, Table K, page 200
75 SCHEDULE OF JURISDICTIONAL CONTRIBUTIONS Last Ten Fiscal Years (Unaudited) June 30, Fairfax County $ 5,160,910 $ 4,847,284 $ 4,852,953 $ 4,747,684 $ 4,511,265 $ 4,876,961 $ 4,906,693 $ 4,995,535 $ 5,507,805 $ 4,700,508 City of Fredericksburg 483, , , , , , , , , ,713 City of Manassas 749, , , , , , , , , ,077 City of Manassas Park 511, , , , , , , , , ,574 Prince William County 5,968,406 5,309,674 5,485,333 5,748,203 4,761,324 5,859,007 6,384,660 6,173,028 6,511,839 4,624,876 Stafford County 2,647,222 2,855,607 1,401,382 2,529,281 1,892,640 2,505,805 2,634,002 2,971,727 2,974,507 2,429,735 Spotsylvania County 1,382,750 1,303,888 2,689,391 1,313,600 3,510, , City of Alexandria 140, , , , , , , , , ,140 Arlington County 205, , , , , , , , , ,532 Total contributions $ 17,250,240 $ 16,428,800 $ 16,428,800 $ 16,428,800 $ 16,428,800 $ 15,943,917 $ 16,070,307 $ 16,376,968 $ 17,275,500 $ 13,379, Source: VRE's Department of Finance
76 SCHEDULE OF MISCELLANEOUS STATISTICS Last Ten Fiscal Years (Unaudited) June 30, Rolling Stock (Owned or Leased) Locomotives Railcars Total rolling stock Stations Parking Spaces 10,796 10,743 9,243 9,030 9,030 8,824 8,824 8,691 8,505 7,227 Employees Ridership and Fare Revenue Data (1): Total Ridership 4,761,035 4,441,858 4,618,169 4,547,911 4,643,898 4,771,987 4,517,366 4,033,230 3,857,646 3,628,563 Average Daily Ridership 18,968 17,767 18,547 18,119 18,878 19,088 18,377 16,673 15,754 14,662 Average Fare Per Trip $ 8.88 $ 8.49 $ 7.95 $ 8.16 $ 7.48 $ 7.28 $ 7.17 $ 7.44 $ 6.66 $ 5.98 (1) The methodology for calculating passenger trips was changed during fiscal year 2011 and fiscal year 2012 to more accurately reflect boardings and detrainings prior to the inner city stations. This increased total ridership and decreased average fare per trip. The methodology for calculating Average Daily Ridership (ADR) was changed in fiscal year 2012 to count days with limited train service ("S" schedule). This resulted in a lower ADR than would have been calculated under the prior method. Source: VRE staff
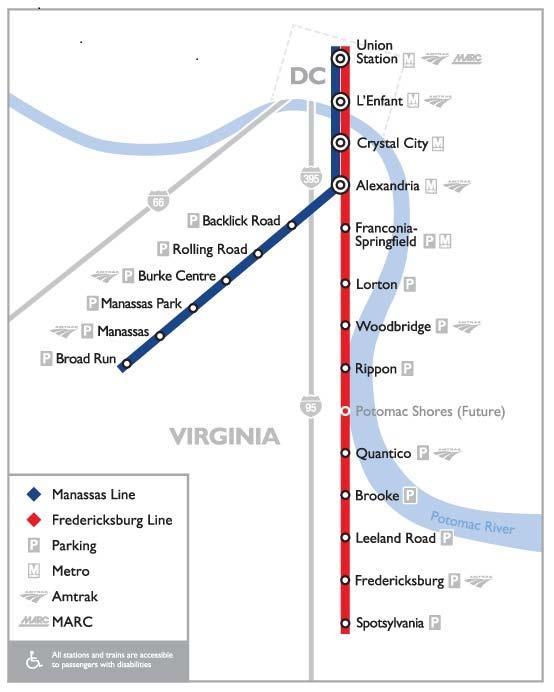
77 59
78 PRINCIPAL EMPLOYERS OF PARTICIPATING JURISDICTIONS Current Year and Nine Years Ago (Unaudited) Percentage of Percentage of Total Jurisdictional Total Jurisdictional Employers Rank Employees Employment Rank Employees Employment Federal Government (1)(2)(3)(4)(5) 1 72,014-72,762 N/A 1 12,070-23,068 N/A Fairfax County Public Schools (1) 2 24,581 N/A 2 22,707 N/A Fairfax County Government (1) 3 12,335 N/A 3 11,324 N/A Arlington County Government & Schools (2) 4 10,100 N/A 8 7,014 N/A Inova Health System (1) 5 7,000-10,000 N/A 6 7,000-10,000 N/A George Mason University (1) 6 5,000-10,000 N/A Booz-Allen Hamilton (1)(2) 7 5,300-8,299 N/A 4 7,952-10,952 N/A General Dynamics (1)(2) 8 4,830-7,829 N/A Deloitte (2) 9 7,000 N/A Federal Home Loan Mortgage (1) 10 4, N/A 9 4, N/A Lockheed Martin (1)(2)(7) ,33-10,299 N/A Northrop Grumman (1) ,000-10,000 N/A Sprint (1) ,000-6,999 N/A Sources: (1) through (9) extracted and combined from the following sources: (1) County of Fairfax fiscal year 2016 Comprehensive Annual Financial Report, Statistical Section, Table 4.2, page 278 (2) County of Arlington fiscal year 2016 Comprehensive Annual Financial Report, Statistical Section, Table L, page 201 (3) County of Prince William fiscal year 2016 Comprehensive Annual Financial Report, Statistical Section, Table 17, page 214 (4) County of Stafford fiscal year 2016 Comprehensive Annual Financial Report, Statistical Section, Table S-17, page 146 (5) City of Alexandria fiscal year 2016 Comprehensive Annual Financial Report, Statistical Section, Table XIX, page 191 (6) City of Spotsylvania fiscal year 2016 Comprehensive Annual Financial Report, Statistical Section, Table S-14, page 146 (7) City of Manassas fiscal year 2016 Comprehensive Annual Financial Report, Statistical Section, Table 15, page 134 (8) City of Manassas Park fiscal year 2015 Comprehensive Annual Financial Report, Statistical Section, Table 15, page 131 (9) City of Fredericksburg fiscal year 2016 Comprehensive Annual Financial Report, Statistical Section, Table 15, page 167
79 DEMOGRAPHICS AND ECONOMIC STATISTICS OF PARTICIPATING JURISDICTIONS (Continued) Fiscal Years 2008 to 2017 (Unaudited) 61 Prince City of Fairfax William City of Manassas Stafford City of Spotsylvania City of Arlington County County Manassas Park County Fredericksburg County Alexandria County Year/Description (1) (2) (3) (4) (5) (6) (7) (8) (9) 2017 (all categories) N/A N/A N/A N/A N/A N/A N/A N/A N/A 2016 Population N/A 454,096 N/A N/A 142,380 28, , , ,400 Personal Income (in thousands) N/A $25,795,450 N/A N/A $6,425,740 $1,256,818,364 $5,869,029 $11,789,823 $18,601,760 Per Capita Personal Income N/A $48,146 N/A N/A $45,131 $44,698 $44,698 N/A $84,400 Unemployment Rate N/A 3.7% 3.4% N/A 4.0% 4.8% 4.0% 2.9% 2.9% 2015 Population 1,142, ,094 41,764 15, ,299 28, , , ,700 Personal Income (in thousands) $85,675,546 $24,943,113 N/A $700,000 $6,296,162 $1,201,676 $5,684,634 $12,071,851 $18,614,530 Per Capita Personal Income $75,007 $47,965 N/A $44,586 $44,246 $42,593 $43,502 N/A $85,900 Unemployment Rate 3.1% 4.4% 4.1% 4.4% 5.2% 6.2% 2.5% 3.5% 3.4% 2014 Population 1,137, ,580 42,081 15, ,423 28, , , ,000 Personal Income (in thousands) $81,620,627 $23,902,844 N/A $694,362 $6,091,966 $1,215,809 N/A $12,115,212 $18,554,500 Per Capita Personal Income $71,752 $46,954 N/A $45,760 $44,010 $43,218 N/A N/A $86,300 Unemployment Rate 3.5% 4.7% 4.8% 4.5% 5.2% 5.9% 5.0% 4.6% 3.5% 2013 Population 1,130, ,100 39,902 14, ,311 27, , , ,045 Personal Income (in thousands) $80,982,075 $24,558,604 N/A $419,100 $5,900,913 $1,116,665 N/A $11,760,450 $18,234,223 Per Capita Personal Income $71,607 $48,617 N/A $28,245 $43,610 $40,893 N/A N/A $82,491 Unemployment Rate 3.7% 4.7% 4.6% 5.0% 5.1% 8.2% 5.3% 4.7% 4.0% 2012 Population 1,118, ,268 39,060 15, ,352 26, , , ,004 Personal Income (in thousands) $77,012,392 $23,024,777 N/A $419,100 $5,744,220 $1,064,199 N/A $10,758,922 $17,273,192 Per Capita Personal Income $68,847 $47,309 N/A $27,335 $42,755 $40,893 $43,218 $83,242 $79,967 Unemployment Rate 4.4% 4.9% 6.3% 4.7% 4.9% 8.8% 5.0% 4.6% 3.5% 2011 Population 1,100, ,392 37,821 14, ,961 25, , , ,280 Personal Income (in thousands) $71,145,429 $22,156,021 N/A $455,635 $5,405,658 $1,050,582 N/A $10,627,334 $15,707,916 Per Capita Personal Income $64,637 $46,719 N/A $31,670 $41,917 $40,893 $40,893 $82,491 $74,700 Unemployment Rate 4.7% 5.3% 6.7% 5.2% 5.2% 10.3% 5.6% 4.8% 3.9%
80 DEMOGRAPHICS AND ECONOMIC STATISTICS OF PARTICIPATING JURISDICTIONS (Continued) Fiscal Years 2008 to 2017 (Unaudited) 62 Prince City of Fairfax William City of Manassas Stafford City of Spotsylvania City of Arlington County County Manassas Park County Fredericksburg County Alexandria County Year/Description (1) (2) (3) (4) (5) (6) (7) (8) (9) 2010 Population 1,081, ,002 35,648 12, ,961 24, , , ,200 Personal Income (in thousands) $72,577,324 $20,662,164 N/A $391,776 $5,265,160 $954,391 N/A $10,441,443 $15,217,499 Per Capita Personal Income $67,094 $44,995 N/A $32,534 $40,828 $39,298 $39,298 $76,362 $71,713 Unemployment Rate 5.1% 5.7% 7.7% 5.8% 5.7% 9.6% 6.0% 4.8% 4.3% 2009 Population 1,074, ,776 35,883 11, ,800 23, , , ,300 Personal Income (in thousands) $74,380,758 $19,428,508 N/A $382,695 $4,915,316 $892,131 N/A $10,178,071 $14,841,044 Per Capita Personal Income $69,241 $44,227 N/A $33,540 $40,027 $38,202 $38,202 $70,846 $70,908 Unemployment Rate 4.9% 5.9% 7.4% 6.5% 5.4% 9.2% 5.7% 2.8% 4.7% 2008 Population 1,050, ,016 36,666 11, ,736 22, , , ,000 Personal Income (in thousands) $74,385,409 $18,681,748 $918,630 $394,715 $4,897,196 $889,030 N/A $10,204,006 $14,040,000 Per Capita Personal Income $70,822 $44,230 $25,054 $34,225 $40,228 $38,824 $38,824 $72,220 $67,500 Unemployment Rate 2.8% 3.4% 4.2% 3.2% 3.4% 5.7% 3.4% 2.9% 2.6% Sources: (1) Fairfax County fiscal year 2016 Comprehensive Annual Financial Report, Statistical Section, Table 4.1, page 277 (2) Prince William County fiscal year 2016 Comprehensive Annual Financial Report, Statistical Section, Table 16, page 213 (3) City of Manassas fiscal year 2016 Comprehensive Annual Financial Report, Statistical Section, Table 14, page 133 (4) City of Manassas Park fiscal year 2015 Comprehensive Annual Financial Report, Statistical Section, Table 14, page 130 (5) Stafford County fiscal year 2016 Comprehensive Annual Financial Report, Statistical Section, Table S-15; page 144 (6) City of Fredericksburg fiscal year 2016 Comprehensive Annual Financial Report, Statistical Section, Table 14, page 166 (7) Spotsylvania County fiscal year 2016 Comprehensive Annual Financial Report, Statistical Section, Table S-13, page 145 (8) City of Alexandria fiscal year 2016 Comprehensive Annual Financial Report, Statistical Section, Table XIV, page 186, Table XI, Page 184 (9) Arlington County fiscal year 2016 Comprehensive Annual Financial Report, Statistical Section, Table K, page 200 N/A = Not Available
81 Compliance Section
82
83 INDEPENDENT AUDITOR S REPORT ON INTERNAL CONTROL OVER FINANCIAL REPORTING AND ON COMPLIANCE AND OTHER MATTERS BASED ON AN AUDIT OF FINANCIAL STATEMENTS PERFORMED IN ACCORDANCE WITH GOVERNMENT AUDITING STANDARDS To the Honorable Operations Board Members and Commissioners The Northern Virginia Transportation Commission The Potomac and Rappahannock Transportation Commission We have audited, in accordance with the auditing standards generally accepted in the United States of America; the standards applicable to financial audits contained in Government Auditing Standards issued by the Comptroller General of the United States; and the Specifications for Audits of Authorities, Boards, and Commissions, issued by the Auditor of Public Accounts of the Commonwealth of Virginia, the financial statements of Virginia Railway Express (VRE), as of and for the year ended June 30, 2017, and the related notes to the financial statements, which collectively comprise VRE s basic financial statements, and have issued our report thereon dated October 30, Internal Control over Financial Reporting In planning and performing our audit of the financial statements, we considered VRE s internal control over financial reporting (internal control) to determine the audit procedures that are appropriate in the circumstances for the purpose of expressing our opinion on the financial statements, but not for the purpose of expressing an opinion on the effectiveness of VRE s internal control. Accordingly, we do not express an opinion on the effectiveness of VRE s internal control. A deficiency in internal control exists when the design or operation of a control does not allow management or employees, in the normal course of performing their assigned functions, to prevent, or detect and correct, misstatements on a timely basis. A material weakness is a deficiency, or a combination of deficiencies, in internal control, such that there is a reasonable possibility that a material misstatement of VRE s financial statements will not be prevented, or detected and corrected on a timely basis. A significant deficiency is a deficiency, or a combination of deficiencies, in internal control that is less severe than a material weakness, yet important enough to merit attention by those charged with governance. Our consideration of internal control was for the limited purpose described in the first paragraph of this section and was not designed to identify all deficiencies in internal control that might be material weaknesses or significant deficiencies. Given these limitations, during our audit we did not identify any deficiencies in internal control that we consider to be material weaknesses. However, material weaknesses may exist that have not been identified. 63
84 Compliance and Other Matters As part of obtaining reasonable assurance about whether VRE s financial statements are free from material misstatement, we performed tests of its compliance with certain provisions of laws, regulations, contracts, and grant agreements, noncompliance with which could have a direct and material effect on the determination of financial statement amounts. However, providing an opinion on compliance with those provisions was not an objective of our audit and, accordingly, we do not express such an opinion. The results of our tests disclosed no instances of noncompliance or other matters that are required to be reported under Government Auditing Standards. Purpose of this Report The purpose of this report is solely to describe the scope of our testing of internal control and compliance and the results of that testing, and not to provide an opinion on the effectiveness of VRE s internal control or on compliance. This report is an integral part of an audit performed in accordance with Government Auditing Standards in considering VRE s internal control and compliance. Accordingly, this communication is not suitable for any other purpose. Harrisonburg, Virginia October 30,
85
FOR THE YEARS ENDED JUNE 30, 2016 AND 2015
 . FOR THE YEARS ENDED JUNE 30, 2016 AND 2015 Government Finance Officers Association Certificate of Achievement for Excellence in Financial Reporting Presented to Text38: Text53: Virginia Railway Express
COMPREHENSIVE ANNUAL FINANCIAL REPORT
 COMPREHENSIVE ANNUAL FINANCIAL REPORT FOR THE YEARS ENDED JUNE 30, 2018 AND 2017 tr. A COMMUTER RAIL SERVICE JOINTLY O NED AND OPERATED BYTHE NORTHERN VIRGINIA TRANSPORTATION COMMISSION AND THE POTOMAC
Certificate of Achievement for Excellence in Financial Reporting
 Government Finance Officers Association Certificate of Achievement for Excellence in Financial Reporting Presented to Text38: Text53: Virginia Railway Express For its Comprehensive Annual Financial Report
Certificate of Achievement for Excellence in Financial Reporting
 Certificate of Achievement for Excellence in Financial Reporting Presented to Text38: Virginia Railway Express Text53: For its Comprehensive Annual Financial Report for the Fiscal Year Ended June 30, 2011
Certificate of Achievement for Excellence in Financial Reporting
 Government Finance Officers Association Certificate of Achievement for Excellence in Financial Reporting Presented to Text38: Text53: Virginia Railway Express For its Comprehensive Annual Financial Report
Certificate of Achievement for Excellence in Financial Reporting
 Government Finance Officers Association Certificate of Achievement for Excellence in Financial Reporting Presented to Text38: Text53: Virginia Railway Express For its Comprehensive Annual Financial Report
POTOMAC AND RAPPAHANNOCK TRANSPORTATION COMMISSION
 POTOMAC AND RAPPAHANNOCK TRANSPORTATION COMMISSION FINANCIAL AND COMPLIANCE REPORTS YEAR ENDED JUNE 30, 2017 ASSURANCE, TAX & ADVISORY SERVICES TABLE OF CONTENTS FINANCIAL SECTION INDEPENDENT AUDITOR S
NORTHERN VIRGINIA TRANSPORTATION COMMISSION
 NORTHERN VIRGINIA TRANSPORTATION COMMISSION Financial and Compliance Reports Year Ended June 30, 2018 ASSURANCE, TAX & ADVISORY SERVICES Table of Contents Page Independent Auditor s Report 1-3 Required
M I N U T E S VRE Operations Board Meeting PRTC Headquarters Prince William County, Virginia September 16, 2016
 M I N U T E S VRE Operations Board Meeting PRTC Headquarters Prince William County, Virginia September 16, 2016 Virginia Railway Express Gary Skinner Chairman Paul Smedberg Vice-Chairman Maureen Caddigan
VIRGINIA RAILWAY EXPRESS
 VIRGINIA RAILWAY EXPRESS FINANCIAL STATEMENTS FOR THE YEARS ENDED JUNE 30, 2004 AND 2003 VIRGINIA RAILWAY EXPRESS Financial Statements for the Years Ended June 30, 2004 and June 30, 2003 Table of Contents
VIRGINIA RAILWAY EXPRESS
 VIRGINIA RAILWAY EXPRESS Recommended Budget for Fiscal Year 2019 Amended Budget for Fiscal Year 2018 Six-Year Financial Forecast & Capital Improvement Program December 15, 2017 0 1 TABLE OF CONTENTS Recommended
Virginia Railway Express
 Virginia Railway Express FINANCIAL STATEMENTS FOR THE YEARS ENDED JUNE 30, 2005 AND 2004 www.vre.or e.org VIRGINIA RAILWAY EXPRESS FINANCIAL STATEMENTS YEARS ENDED JUNE 30, 2005 AND 2004 THIS PAGE NOT
Transit Subsidy. Mission Statement. Mandates
 Mission Statement The Potomac and Rappahannock Transportation Commission (PRTC) is a multi-jurisdictional agency representing Prince William, Stafford, and Spotsylvania Counties and the Cities of Manassas,
Chairman Smedberg and the VRE Operations Board
 Agenda Item 9-A Action Item To: From: Chairman Smedberg and the VRE Operations Board Doug Allen Date: March 17, 2017 Re: Approval of Gainesville-Haymarket Extension Study Alternative for Preliminary Engineering
Washington Metropolitan Area Transit Authority
 Washington Metropolitan Area Transit Authority Financial Report issued in Accordance with Government Auditing Standards For the Years Ended June 30, 2016 and 2015 Single Audit Reports issued in Accordance
Transit Subsidy. Mission Statement. Mandates
 Mission Statement The Potomac and Rappahannock Transportation Commission (PRTC) is a multi-jurisdictional agency representing Prince William, Stafford, and Spotsylvania Counties and the Cities of Manassas,
Chairman Skinner and the VRE Operations Board. Authorization to Issue a Request for Proposals for Federal Legislative Services
 Agenda Item 8-A Consent Item To: From: Chairman Skinner and the VRE Operations Board Doug Allen Date: February 19, 2016 Re: Authorization to Issue a Request for Proposals for Federal Legislative Services
Transit Subsidy. Mission Statement. Mandates
 Mission Statement The Potomac and Rappahannock Transportation Commission (PRTC) is a multi-jurisdictional agency representing Prince William, Stafford, and Spotsylvania Counties and the Cities of Manassas,
FY 2018 PUBLIC HEARINGS PROPOSED FARE INCREASE
 FY 2018 PUBLIC HEARINGS PROPOSED FARE INCREASE 1 VRE BUDGET DEVELOPMENT July August December January March April-June July Budget Key Issues and Guidelines Present Draft Budget VRE Board Budget Approval
Financial Analysis Working Paper 1 Existing Funding Sources Draft: April 2007
 Financial Analysis Working Paper 1 Existing Funding Sources Draft: April 2007 Prepared for: By: TABLE OF CONTENTS INTRODUCTION... 1 REVIEW OF FRED AND VRE EXISTING FUNDING SOURCES... 1 Federal Funding...
COMMUTER RAIL DIVISION OF THE REGIONAL TRANSPORTATION AUTHORITY AND THE NORTHEAST ILLINOIS REGIONAL COMMUTER RAILROAD CORPORATION
 Financial Statements and Supplementary Information (With Independent Auditors Report Thereon) Table of Contents Page(s) Independent Auditors Report 1 2 Management s Discussion and Analysis (Unaudited)
Transit Subsidy. Projected FY17 Transit Subsidy
 Mission Statement Transit Subsidy The Potomac and Rappahannock Transportation Commission (PRTC) is a multi-jurisdictional agency representing Prince William, Stafford, and Spotsylvania Counties and the
Washington Metropolitan Area Transit Authority
 Washington Metropolitan Area Transit Authority Financial Report For the Fiscal Years Ended June 30, 2017 and 2016 Table of Contents Washington Metropolitan Area Transit Authority Financial Report For the
Technical Memorandum #1: Baseline Conditions. This section provides an overview of the main services operated and assets maintained by PRTC.
 Technical Memorandum #1: Baseline Conditions INTRODUCTION This Baseline Conditions Technical Memorandum provides a summary of the key services provided by the Potomac and Rappahannock Transportation Commission
Northern Virginia Transportation Commission: 2018 Legislative and Policy Agenda
 Northern Virginia Transportation Commission: 2018 Legislative and Policy Agenda Northern Virginia s economic growth and global competitiveness are directly tied to the region s transit network. Transit
The Potomac and Rappahannock Transportation Commission (PRTC) is a multijurisdictional agency representing Prince William, Stafford and Spotsylvania
 is a multijurisdictional agency representing Prince William, Stafford and Spotsylvania") Planning and Development Development Services, Department of Economic Development, Department of Housing and Community Development, Office of Planning Prince William County/ Manassas Convention and Visitors
Planning and Development Development Services, Department of Economic Development, Department of Housing and Community Development, Office of Planning Prince William County/ Manassas Convention and Visitors
SOUTHEASTERN PENNSYLVANIA TRANSPORTATION AUTHORITY. Financial Statements June 30, 2018 and (With Independent Auditors Report Thereon)
") SOUTHEASTERN PENNSYLVANIA TRANSPORTATION AUTHORITY Financial Statements June 30, 2018 and 2017 (With Independent Auditors Report Thereon) SOUTHEASTERN PENNSYLVANIA TRANSPORTATION AUTHORITY YEARS ENDED
SOUTHEASTERN PENNSYLVANIA TRANSPORTATION AUTHORITY Financial Statements June 30, 2018 and 2017 (With Independent Auditors Report Thereon) SOUTHEASTERN PENNSYLVANIA TRANSPORTATION AUTHORITY YEARS ENDED
Central Puget Sound Regional Transit Authority
 Central Puget Sound Regional Transit Authority Single Audit Reports for the Year Ended December 31, 2014 TABLE OF CONTENTS Audited Financial Statements Management s Discussion and Analysis... 1 Independent
CHICAGO TRANSIT AUTHORITY CHICAGO, ILLINOIS
 CHICAGO, ILLINOIS FINANCIAL STATEMENTS AND SUPPLEMENTARY INFORMATION Years Ended (With Independent Auditor s Report Thereon) Chicago, Illinois FINANCIAL STATEMENTS Years Ended TABLE OF CONTENTS Independent
Executive Summary. Introduction
 Executive Summary Introduction Virginia Railway Express (VRE), in cooperation with the Virginia Department of Rail and Public Transportation (DRPT), has completed a Transit Development Plan (TDP) for fiscal
NORTH CAROLINA DEPARTMENT OF TRANSPORTATION
 STATE OF NORTH CAROLINA OFFICE OF THE STATE AUDITOR BETH A. WOOD, CPA NORTH CAROLINA DEPARTMENT OF TRANSPORTATION RALEIGH, NORTH CAROLINA FINANCIAL STATEMENT AUDIT REPORT FOR THE YEAR ENDED JUNE 30, 2017
SOUTHEASTERN PENNSYLVANIA TRANSPORTATION AUTHORITY. Financial Statements June 30, 2017 and (With Independent Auditors Report Thereon)
") SOUTHEASTERN PENNSYLVANIA TRANSPORTATION AUTHORITY Financial Statements June 30, 2017 and 2016 (With Independent Auditors Report Thereon) SOUTHEASTERN PENNSYLVANIA TRANSPORTATION AUTHORITY YEARS ENDED
SOUTHEASTERN PENNSYLVANIA TRANSPORTATION AUTHORITY Financial Statements June 30, 2017 and 2016 (With Independent Auditors Report Thereon) SOUTHEASTERN PENNSYLVANIA TRANSPORTATION AUTHORITY YEARS ENDED
WASHINGTON METROPOLITAN AREA TRANSIT AUTHORITY WASHINGTON, DC. FINANCIAL STATEMENTS June 30, 2013
 WASHINGTON METROPOLITAN AREA TRANSIT AUTHORITY WASHINGTON, DC FINANCIAL STATEMENTS TABLE OF CONTENTS PAGE INDEPENDENT AUDITORS REPORT... 1 FINANCIAL STATEMENTS Statement of Net Position... 3 Statement
Central Puget Sound Regional Transit Authority
 Central Puget Sound Regional Transit Authority Single Audit Reports for the Year Ended December 31, 2017 This page intentionally left blank. TABLE OF CONTENTS Audited Financial Statements Statement of
TEXAS DEPARTMENT OF TRANSPORTATION. Annual Financial Report For The Fiscal Year Ended August 31, (With Independent Auditor s Report)
") TEXAS DEPARTMENT OF TRANSPORTATION Annual Financial Report For The Fiscal Year Ended August 31, 2018 (With Independent Auditor s Report) Texas Department of Transportation Annual Financial Report (With
TEXAS DEPARTMENT OF TRANSPORTATION Annual Financial Report For The Fiscal Year Ended August 31, 2018 (With Independent Auditor s Report) Texas Department of Transportation Annual Financial Report (With
TEXAS DEPARTMENT OF TRANSPORTATION. Annual Financial Report For The Fiscal Year Ended August 31, (With Independent Auditor s Report)
") TEXAS DEPARTMENT OF TRANSPORTATION Annual Financial Report For The Fiscal Year Ended August 31, 2017 (With Independent Auditor s Report) Texas Department of Transportation Annual Financial Report (With
TEXAS DEPARTMENT OF TRANSPORTATION Annual Financial Report For The Fiscal Year Ended August 31, 2017 (With Independent Auditor s Report) Texas Department of Transportation Annual Financial Report (With
2007 Legislative Program Northern Virginia Transportation Authority Approved: November 10, 2006
 State Legislative Items: Additional Transportation Funding 2007 Legislative Program Northern Virginia Transportation Authority Approved: November 10, 2006 Position: The Northern Virginia Transportation
CHICAGO TRANSIT AUTHORITY. FINANCIAL STATEMENTS AND SUPPLEMENTARY INFORMATION December 31, 2011 and 2010 (With Independent Auditors Report Thereon)
") FINANCIAL STATEMENTS AND SUPPLEMENTARY INFORMATION (With Independent Auditors Report Thereon) Chicago, Illinois FINANCIAL STATEMENTS CONTENTS Independent Auditors Report... 1 Management s Discussion and
FINANCIAL STATEMENTS AND SUPPLEMENTARY INFORMATION (With Independent Auditors Report Thereon) Chicago, Illinois FINANCIAL STATEMENTS CONTENTS Independent Auditors Report... 1 Management s Discussion and
SCHAUMBURG PARK DISTRICT, ILLINOIS COMPREHENSIVE ANNUAL FINANCIAL REPORT
 SCHAUMBURG PARK DISTRICT, ILLINOIS COMPREHENSIVE ANNUAL FINANCIAL REPORT FOR THE FISCAL YEAR ENDED MARCH 31, 2017 COMPREHENSIVE ANNUAL FINANCIAL REPORT FOR THE FISCAL YEAR ENDED MARCH 31, 2017 Prepared
Chairman Milde and the VRE Operations Board
 Agenda Item 10-B Action Item To: From: Chairman Milde and the VRE Operations Board Doug Allen Date: January 17, 2014 Re: Purchase of Expansion Rail Cars Recommendation: The VRE Operations Board is being
Tri-County Metropolitan Transportation District of Oregon 2014 Annual Report
 Report of Independent Auditors and Financial Statements with Supplementary Information June 30, 2014 and 2013 Board of Directors Name District Bruce Warner, President #1 Joe Esmonde #2 Vacant #3 Consuelo
VRE Financial Plan Analysis Updated January 15, 2016
 Attachment 10A.1 VRE Financial Plan Analysis Updated January 15, 2016 VRE and PFM have been working on the development of a long term strategic Financial Plan since February 2015. The primary objective
PROPOSED FY 2012 PRTC BUDGET & SIX YEAR PLAN
 POTOMAC AND RAPPAHANNOCK TRANSPORTATION COMMISSION PROPOSED FY 2012 PRTC BUDGET & SIX YEAR PLAN Presentation to Potomac and Rappahannock Transportation Commission January 13, 2011 Presentation Overview
VIRGINIA RAILWAY EXPRESS REQUEST FOR PROPOSALS (RFP) RFP No INSURANCE BROKERAGE SERVICES
 RFP No INSURANCE BROKERAGE SERVICES") VIRGINIA RAILWAY EXPRESS REQUEST FOR PROPOSALS (RFP) INSURANCE BROKERAGE SERVICES RFP Issued: January 10, 2018 Contact: Kristin Nutter, Acting Manager of Purchasing and Contract Administration, 1500 King
VIRGINIA RAILWAY EXPRESS REQUEST FOR PROPOSALS (RFP) INSURANCE BROKERAGE SERVICES RFP Issued: January 10, 2018 Contact: Kristin Nutter, Acting Manager of Purchasing and Contract Administration, 1500 King
The following items were handed out at the November 2, 2017 NVTC Meeting.
 The following items were handed out at the November 2, 2017 NVTC Meeting. Blue Item #6 Washington Metropolitan Area Transit Authority FY2019 Proposed Budget FY2017 Budget: Ridership and Revenue Finance
Getting Metro Back on Track
 NVTC Presents: Getting Metro Back on Track A discussion with Virginia members of the WMATA Board @NovaTransit This forum is sponsored by the Northern Virginia Transportation Commission. Learn more about
VIRGINIA RAILWAY EXPRESS REQUEST FOR PROPOSALS (RFP) RFP No MAINTENANCE SERVICES / CUSTODIAL AND SEASONAL SERVICES FOR VRE FACILITIES
 RFP No MAINTENANCE SERVICES / CUSTODIAL AND SEASONAL SERVICES FOR VRE FACILITIES") VIRGINIA RAILWAY EXPRESS REQUEST FOR PROPOSALS (RFP) MAINTENANCE SERVICES / CUSTODIAL AND SEASONAL SERVICES FOR VRE FACILITIES RFP Issued: January 31, 2018 Contact: Kristin Nutter, Acting Manager of Purchasing
VIRGINIA RAILWAY EXPRESS REQUEST FOR PROPOSALS (RFP) MAINTENANCE SERVICES / CUSTODIAL AND SEASONAL SERVICES FOR VRE FACILITIES RFP Issued: January 31, 2018 Contact: Kristin Nutter, Acting Manager of Purchasing
Report of Independent Auditors and Financial Statements with Supplementary Information June 30, 2017 and 2016
 Report of Independent Auditors and Financial Statements with Supplementary Information June 30, 2017 and 2016 (including Audit Comments and Disclosures Required by State Regulations) Board of Directors
HAMPTON ROADS TRANSPORTATION ACCOUNTABILITY COMMISSION
 HAMPTON ROADS TRANSPORTATION ACCOUNTABILITY COMMISSION A COMPONENT UNIT OF THE COMMONWEALTH OF VIRGINIA FINANCIAL AND COMPLIANCE REPORTS YEAR ENDED JUNE 30, 2018 ASSURANCE, TAX & ADVISORY SERVICES TABLE
City of Chicago Chicago Midway International Airport An Enterprise Fund of the City of Chicago
 City of Chicago Chicago Midway International Airport An Enterprise Fund of the City of Chicago Comprehensive Annual Financial Report For the Years Ended December 31, 2017 and 2016 Rahm Emanuel, Mayor Carole
METROPOLITAN TRANSIT AUTHORITY NASHVILLE, TENNESSEE AUDITED FINANCIAL STATEMENTS AND OTHER FINANCIAL INFORMATION JUNE 30, 2017 AND 2016
 NASHVILLE, TENNESSEE AUDITED FINANCIAL STATEMENTS AND OTHER FINANCIAL INFORMATION JUNE 30, 2017 AND 2016 Table of Contents Page INTRODUCTION... 1-2 INDEPENDENT AUDITOR S REPORT... 3-5 MANAGEMENT S DISCUSSION
The Transit Authority of the City of Omaha FINANCIAL STATEMENTS AND INDEPENDENT AUDITORS REPORT For the years ended December 31, 2014, and 2013
 FINANCIAL STATEMENTS AND INDEPENDENT AUDITORS REPORT For the years ended December 31, 2014, and 2013 TABLE OF CONTENTS INDEPENDENT AUDITOR S REPORT 2-4 MANAGEMENT S DISCUSSION AND ANALYSIS 5-11 GENERAL
FINANCIAL STATEMENTS OF THE CITY OF VIRGINIA BEACH DEVELOPMENT AUTHORITY A COMPONENT UNIT OF THE CITY OF VIRGINIA BEACH, VIRGINIA
 FINANCIAL STATEMENTS OF THE CITY OF VIRGINIA BEACH DEVELOPMENT AUTHORITY A COMPONENT UNIT OF THE CITY OF VIRGINIA BEACH, VIRGINIA FOR FISCAL YEARS ENDED JUNE 30, 2018 AND JUNE 30, 2017 PREPARED BY DEPARTMENT
The Transit Fiscal Cliff:
 The Transit Fiscal Cliff: The Potential Loss of State Transit Funding and What it Means for Localities Lisa Guthrie, VTA Executive Director 1 The State Program Support Virginia Economic Benefits Transit
CHICAGO TRANSIT AUTHORITY. FINANCIAL STATEMENTS AND SUPPLEMENTARY INFORMATION December 31, 2010 and 2009 (With Independent Auditors Report Thereon)
") FINANCIAL STATEMENTS AND SUPPLEMENTARY INFORMATION (With Independent Auditors Report Thereon) Chicago, Illinois FINANCIAL STATEMENTS CONTENTS Independent Auditors Report... 1 Management s Discussion and
FINANCIAL STATEMENTS AND SUPPLEMENTARY INFORMATION (With Independent Auditors Report Thereon) Chicago, Illinois FINANCIAL STATEMENTS CONTENTS Independent Auditors Report... 1 Management s Discussion and
GREENVILLE TRANSIT AUTHORITY GREENVILLE, SOUTH CAROLINA
 GREENVILLE TRANSIT AUTHORITY GREENVILLE, SOUTH CAROLINA FINANCIAL STATEMENTS YEAR ENDED JUNE 30, 2014 AND NINE MONTHS ENDED JUNE 30, 2013 TABLE OF CONTENTS YEAR ENDED JUNE 30, 2014 AND NINE MONTHS ENDED
MARYLAND TRANSPORTATION AUTHORITY. An Enterprise Fund of the State of Maryland. FINANCIAL STATEMENTS For the Fiscal Year Ended June 30, 2015
 MARYLAND TRANSPORTATION AUTHORITY An Enterprise Fund of the State of Maryland FINANCIAL STATEMENTS For the Fiscal Year Ended TABLE OF CONTENTS PAGE INDEPENDENT AUDITORS REPORT... 1 MANAGEMENT S DISCUSSION
FINANCIAL STATEMENTS AND INDEPENDENT AUDITORS REPORT GAINESVILLE REGIONAL UTILITIES GAINESVILLE, FLORIDA SEPTEMBER 30, 2018 AND 2017
 FINANCIAL STATEMENTS AND INDEPENDENT AUDITORS REPORT GAINESVILLE REGIONAL UTILITIES GAINESVILLE, FLORIDA SEPTEMBER 30, 2018 AND 2017 FINANCIAL STATEMENTS AND INDEPENDENT AUDITORS REPORT GAINESVILLE REGIONAL
Comprehensive Annual Financial Report
 Comprehensive Annual Financial Report Cambrian Commons, Rosemount - Built in 2016 For the Year Ended June 30, 2016 Dakota County Community Development Agency A component unit of Dakota County, Minnesota
Dallas Area Rapid Transit Dallas, Texas. Financial Statements Years Ended September 30, 2016 and 2015 and Independent Auditor s Report
 Dallas Area Rapid Transit Dallas, Texas Financial Statements Years Ended September 30, 2016 and 2015 and Independent Auditor s Report DALLAS, TEXAS FINANCIAL STATEMENTS AS OF AND FOR THE YEARS ENDED SEPTEMBER
YOSEMITE AREA REGIONAL TRANSPORTATION SYSTEM FINANCIAL STATEMENTS AND INDEPENDENT AUDITOR S REPORT FOR THE YEAR ENDED JUNE 30, 2016
 YOSEMITE AREA REGIONAL TRANSPORTATION SYSTEM FINANCIAL STATEMENTS AND INDEPENDENT AUDITOR S REPORT FOR THE YEAR ENDED JUNE 30, 2016 JUNE 30, 2016 TABLE OF CONTENTS Page FINANCIAL SECTION Independent Auditor
County of Lackawanna, Pennsylvania
 Financial Statements and Supplementary Information Table of Contents Independent Auditors Report 1 Management s Discussion and Analysis (Unaudited) 4 Financial Statements Statement of Net Position 14 Statement
BLOOMINGTON-NORMAL AIRPORT AUTHORITY OF MCLEAN COUNTY, ILLINOIS FINANCIAL STATEMENTS AND INDEPENDENT AUDITOR S REPORT.
 OF MCLEAN COUNTY, ILLINOIS FINANCIAL STATEMENTS AND INDEPENDENT AUDITOR S REPORT April 30, 2015 OF MCLEAN COUNTY, ILLINOIS TABLE OF CONTENTS Page(s) INDEPENDENT AUDITOR S REPORT... 1-3 MANAGEMENT S DISCUSSION
HUNTSVILLE-MADISON COUNTY AIRPORT AUTHORITY AUDITED FINANCIAL STATEMENTS JUNE 30, 2017 AND 2016
 HUNTSVILLE-MADISON COUNTY AIRPORT AUTHORITY AUDITED FINANCIAL STATEMENTS JUNE 30, 2017 AND 2016 CONTENTS FINANCIAL STATEMENTS Independent Auditor's Report Page 1 Management s Discussion and Analysis 3
HARRISON COUNTY, MISSISSIPPI Audited Financial Statements and Special Reports For the Year Ended September 30, 2014
 Audited Financial Statements and Special Reports TABLE OF CONTENTS FINANCIAL SECTION 1 INDEPENDENT AUDITOR'S REPORT 2 MANAGEMENT'S DISCUSSION AND ANALYSIS 5 FINANCIAL STATEMENTS 13 Statement of Net Position
NORTHERN VIRGINIA REGIONAL COMMISSION FINANCIAL STATEMENTS YEAR ENDED JUNE 30, 2018
 FINANCIAL STATEMENTS YEAR ENDED JUNE 30, 2018 DIRECTORY OF PRINCIPAL OFFICIALS AS OF JUNE 30, 2018 OFFICERS Laurie A. DiRocco, Chairperson David Tarter, Vice Chairperson John C. Cook, Treasurer Robert
MADISON COUNTY, FLORIDA ANNUAL FINANCIAL REPORT SEPTEMBER 30, 2017
 MADISON COUNTY, FLORIDA ANNUAL FINANCIAL REPORT SEPTEMBER 30, 2017 MADISON COUNTY, FLORIDA THIS REPORT CONTAINS THE FOLLOWING SECTIONS Madison County, Florida (Government-Wide) Basic Financial Statements,
Report of Independent Auditors and Financial Statements with Supplementary Information June 30, 2016 and 2015
 Report of Independent Auditors and Financial Statements with Supplementary Information and 2015 Board of Directors Name District Bruce Warner, President #1 Joe Esmonde #2 Vacant #3 Lori Irish Bauman #4
Independent Auditor s Report
 Independent Auditor s Report To the City Council City of Hyattsville, Maryland We have audited the accompanying financial statements of the governmental activities, each major fund, and the aggregate remaining
Bailey, Hodshire & Company, P.C. CERTIFIED PUBLIC ACCOUNTANTS
 Bailey, Hodshire & Company, P.C. CERTIFIED PUBLIC ACCOUNTANTS 479 E. CHICAGO STREET PHONE: (517) 849-2410 P.O. BOX 215 FAX: (517) 849-2493 JONESVILLE, MI 49250 E-MAIL: baileyhodshire@sbcglobal.net INDEPENDENT
ANNUAL SYSTEM FINANCIAL REPORT
 SYSTEM FINANCIAL REPORT 2016 ANNUAL SYSTEM FINANCIAL REPORT Funds associated with the following functions and revenue sources: housing, dining, services and activities fee, student union building fee,
TOWNS COUNTY, GEORGIA HIAWASSEE, GEORGIA FINANCIAL STATEMENTS WITH SUPPLEMENTAL MATERIAL FOR THE YEAR ENDED
 HIAWASSEE, GEORGIA FINANCIAL STATEMENTS WITH SUPPLEMENTAL MATERIAL FOR THE YEAR ENDED DECEMBER 31, 2016 FINANCIAL STATEMENTS For the Year Ended December 31, 2016 PAGE INDEPENDENT AUDITOR'S REPORT 1-2 MANAGEMENT'S
Celebrating 25 Years of Excellence
 Celebrating 25 Years of Excellence Comprehensive Annual Financial Report Fiscal Year Ended June 30, 2017 Chino Hills, California , CALIFORNIA COMPREHENSIVE ANNUAL FINANCIAL REPORT FISCAL YEAR ENDED JUNE
City of Chicago Department of Water Management Sewer Fund Comprehensive Annual Financial Report For the Year Ended December 31, 2012
 City of Chicago Department of Water Management Sewer Fund Comprehensive Annual Financial Report For the Year Ended December 31, 2012 Rahm Emanuel, Mayor Lois Scott, Chief Financial Officer Amer Ahmad,
City of Chicago Department of Water Management Water Fund Comprehensive Annual Financial Report For the Years Ended December 31, 2016 and 2015
 City of Chicago Department of Water Management Water Fund Comprehensive Annual Financial Report For the Years Ended December 31, 2016 and 2015 Rahm Emanuel, Mayor Carole L. Brown, Chief Financial Officer
Ross Local School District, Butler County, Ohio
 Ross Local School District, Butler County, Ohio Comprehensive Annual Financial Report For the Fiscal Year Ended June 30, 2012 COMPREHENSIVE ANNUAL FINANCIAL REPORT of the ROSS LOCAL SCHOOL DISTRICT, BUTLER
WINSTON-SALEM STATE UNIVERSITY
 STATE OF NORTH f CAROLINA OFFICE OF THE STATE AUDITOR BETH A. WOOD, CPA WINSTON-SALEM STATE UNIVERSITY WINSTON-SALEM, NORTH CAROLINA FINANCIAL STATEMENT AUDIT REPORT FOR THE YEAR ENDED JUNE 30, 2017 A
CHAPTER 7: Financial Plan
 CHAPTER 7: Financial Plan Report Prepared by: Contents 7 FINANCIAL PLAN... 7-1 7.1 Introduction... 7-1 7.2 Assumptions... 7-1 7.2.1 Operating Revenue Assumptions... 7-2 7.2.2 Operating Cost Assumptions...
WORCESTER REGIONAL TRANSIT AUTHORITY (A Component Unit of the Massachusetts Department of Transportation) Financial Statements And Supplementary
 Financial Statements And Supplementary") Financial Statements And Supplementary Information For The Year Ended June 30, 2018 And Independent Auditors Report Financial Statements and Supplementary Information For The Year Ended June 30, 2018 And
Financial Statements And Supplementary Information For The Year Ended June 30, 2018 And Independent Auditors Report Financial Statements and Supplementary Information For The Year Ended June 30, 2018 And
Eden Prairie, Minnesota
 Comprehensive Annual Financial Report For the Fiscal Year Ended December 31, 2017 SOUTHWEST TRANSIT Comprehensive Annual Financial Report For the Year Ended December 31, 2017 Mission Statement SouthWest
FINANCIAL REPORT JUNE 30, 2017
 FINANCIAL REPORT JUNE 30, 2017 This Page Intentionally Left Blank FINANCIAL REPORT JUNE 30, 2017 Terry McAuliffe Governor Aubrey L. Layne, Jr. Secretary of Transportation Charles A. Kilpatrick, P.E. Commissioner
City of Marianna Marianna, Florida
 Marianna, Florida Basic Financial Statements For the year ended September 30, 2014 Table of Contents September 30, 2014 REPORT Independent Auditors' Report 1 MANAGEMENT'S DISCUSSION AND ANALYSIS Management's
Berks Area Regional Transportation Authority. Financial Statements and Supplementary Information. June 30, 2014 and 2013
 Financial Statements and Supplementary Information Table of Contents Page INDEPENDENT AUDITOR'S REPORT 1 to 3 MANAGEMENT'S DISCUSSION AND ANALYSIS 4 to 14 FINANCIAL STATEMENTS Statement of Net Position
Beaufort-Jasper Higher Education Commission
 Report on Financial Statements Contents Page Independent Auditor's Report... 1-2 Financial Statements Statement of Net Position... 3 Statement of Revenues, Expenses and Changes in Net Position... 4 Statement
THE SUBURBAN BUS DIVISION OF THE REGIONAL TRANSPORTATION AUTHORITY SERVING NORTHEASTERN ILLINOIS
 THE SUBURBAN BUS DIVISION OF THE REGIONAL TRANSPORTATION AUTHORITY SERVING NORTHEASTERN ILLINOIS COMPREHENSIVE ANNUAL FINANCIAL REPORT FOR THE YEAR ENDED DECEMBER 31, 2013 2013 Comprehensive Annual Financial
BROCK INDEPENDENT SCHOOL DISTRICT
 ANNUAL FINANCIAL REPORT FOR THE YEAR ENDED JUNE 30, 2017 Introductory Section Brock Independent School District AnnuaiRnan~aiReport For The Year Ended June 30, 2017 TABLE OF CONTENTS INTRODUCTORY SECTION
VIRGINIA RAILWAY EXPRESS REQUEST FOR QUOTES (RFQ) PRINTING SERVICES FOR VRE MARKETING MATERIALS. RFQ ISSUED: May 2, 2017
 PRINTING SERVICES FOR VRE MARKETING MATERIALS. RFQ ISSUED: May 2, 2017") VIRGINIA RAILWAY EXPRESS REQUEST FOR QUOTES (RFQ) PRINTING SERVICES FOR VRE MARKETING MATERIALS RFQ ISSUED: May 2, 2017 QUESTIONS DUE: May 8, 2017 at 10:00 A.M. EST QUOTES DUE: May 15, 2017 at 4:00 P.M.
VIRGINIA RAILWAY EXPRESS REQUEST FOR QUOTES (RFQ) PRINTING SERVICES FOR VRE MARKETING MATERIALS RFQ ISSUED: May 2, 2017 QUESTIONS DUE: May 8, 2017 at 10:00 A.M. EST QUOTES DUE: May 15, 2017 at 4:00 P.M.
Getting Metro Back on Track
 NVTC Presents: Getting Metro Back on Track A discussion with Virginia members of the WMATA Board This forum is sponsored by the Northern Virginia Transportation Commission. It is separate and distinct
CITY OF ST. PAUL PARK FINANCIAL STATEMENTS FOR THE FISCAL YEAR ENDED DECEMBER 31, 2014
 FINANCIAL STATEMENTS FOR THE FISCAL YEAR ENDED DECEMBER 31, 2014 FINANCIAL STATEMENTS For the Fiscal Year Ended December 31, 2014 TABLE OF CONTENTS INTRODUCTORY SECTION Elected and Appointed Officials
CITY OF LAGUNA BEACH, CALIFORNIA. Comprehensive Annual Financial Report. For the Fiscal Year Ended June 30, 2015
 CITY OF LAGUNA BEACH, CALIFORNIA Comprehensive Annual Financial Report For the Fiscal Year Ended June 30, 2015 CITY OF LAGUNA BEACH, CALIFORNIA COMPREHENSIVE ANNUAL FINANCIAL REPORT FOR THE FISCAL YEAR
GROVER CLEVELAND MASTERY CHARTER SCHOOL FINANCIAL STATEMENTS AND SUPPLEMENTARY INFORMATION
 FINANCIAL STATEMENTS AND SUPPLEMENTARY INFORMATION YEAR ENDED (WITH COMPARATIVE TOTALS FOR JUNE 30, 2016) CliftonLarsonAllen LLP TABLE OF CONTENTS YEAR ENDED INDEPENDENT AUDITORS REPORT 1 REQUIRED SUPPLEMENTARY
Comprehensive Annual Financial Report
 Comprehensive Annual Financial Report For the Fiscal Year Ended December 31, 2016 SOUTHWEST TRANSIT Comprehensive Annual Financial Report For the Year Ended December 31, 2016 Mission Statement SouthWest
Osage Nation. Independent Auditor s Report and Financial Statements. September 30, 2015
 Independent Auditor s Report and Financial Statements Contents Independent Auditor s Report... 1 Management s Discussion and Analysis... 4 Government-Wide Financial Statements Statement of Net Position...
FINANCIAL REPORT JUNE 30, 2015
 FINANCIAL REPORT JUNE 30, 2015 This Page Intentionally Left Blank FINANCIAL REPORT JUNE 30, 2015 Terry McAuliffe Governor Aubrey L. Layne, Jr. Secretary of Transportation Charles A. Kilpatrick, P.E. Commissioner
Central Puget Sound Regional Transit Authority
 Central Puget Sound Regional Transit Authority Single Audit Reports for the Year Ended December 31, 2013 TABLE OF CONTENTS Audited Financial Statements Management s Discussion and Analysis...1 Independent
Bailey, Hodshire & Company, P.C. CERTIFIED PUBLIC ACCOUNTANTS
 Bailey, Hodshire & Company, P.C. CERTIFIED PUBLIC ACCOUNTANTS 479 E. CHICAGO STREET PHONE: (517) 849-2410 P.O. BOX 215 FAX: (517) 849-2493 JONESVILLE, MI 49250 E-MAIL: baileyhodshire@sbcglobal.net INDEPENDENT
CITY OF NEDERLAND, TEXAS. Comprehensive Annual Financial Report
 Comprehensive Annual Financial Report For the Year Ended September 30, 2014 Prepared by the Finance Department INTRODUCTORY SECTION Comprehensive Annual Financial Report September 30, 2014 Table of Contents
City of Bentonville, Arkansas
 Comprehensive Annual Financial Report For the Year Ended December 31, 2016 Prepared by: Denise Land Finance Director Jake Harper Assistant Finance Director Visit our web site at: www.bentonvillear.com
DETROIT TRANSPORTATION CORPORATION
 FINANCIAL REPORT JUNE 30, 2015 Contents Page No. Independent Auditor s Report... 1 Management Discussion & Analysis... 3 Basic Financial Statements: Statement of Net Position... 8 Statement of Revenues,