Westpac Fiji ECONOMIC UPDATE. 03 November
|
|
|
- Pearl Lyons
- 5 years ago
- Views:
Transcription
1 Westpac Fiji ECONOMIC UPDATE 3 November
2 Outline Global Economy Domestic Economy Overview of Fiji Economy Sectoral Performances Consumption & Investment Activities Fiscal Policy Trade & Foreign Exchange Earners Tourism Earnings & Personal Remittances Financial & Monetary Aggregates Summary Twin Objectives

3 GLOBAL ECONOMY Weaker growth prospects Risks prevail Deceleration in China US monetary policy normalisation Implications of Brexit to the rest of the world Commodity price volatility
4 WORLD GDP GROWTH % f 217f World output Advanced Economies Emerging and Developing Economies Source: IMF World Economic Outlook October 216
5 PACIFIC ISLANDS GROWTH OUTOOK % 14. Papua New Guinea Solomon Islands Vanuatu Samoa Fiji e 216f 217f Source: IMF World Economic Outlook October 216


6 COMMODITIES

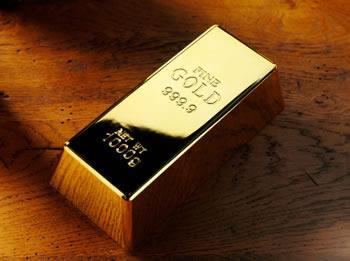
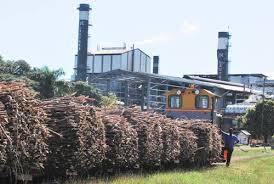
7 COMMODITIES World Market Sugar Prices (New York) cents/lb EU Sugar Price(USc) WM Sugar Price (USc) FJ Price F 6 u 5 t 4 22/1 FJ$46.44cents/pound u 3 r e 2 s 1 WM 22/1 US$ 22.46cents/pound Sources: Bloomberg and Fiji Sugar Corporation Index FAO Food Price Index 3 MOM 2.9% YOY 1.% Sep-8 Sep-9 Sep-1 Sep-11 Sep-12 Sep-13 Sep-14 Sep-15 Sep-16 Source: Global Food Price Monitor September, 216 $/oz 4, 3, 2, 1, Gold Prices (End of Month) 22/1 FJ$2,594.8/oz 22/1 US$ 1,254.8/oz Source: Bloomberg F u t u r e s
8 BRENT CRUDE OIL PRICES (ACTUALS AND FUTURES) US$/barrel Futures (as at 22/1/16) Oil price as at 22 October 216 Futures (as at 21/7/15) Futures (as at 15/9/16) Source: Bloomberg

9 OVERVIEW OF THE FIJIAN ECONOMY
10 GDP GROWTH Fiji is set for its 7 th consecutive year of economic growth despite natural disasters this year % 6. Actual Oct-15 Forecast May-16 Forecast Gene 29 Mick 21 Tomas Evan p 215e 216f Winston 217f 218f Sources: Fiji Bureau of Statistics & Macroeconomic

11 TRANS FISH WH & RETAIL FORESTRY PUB ADMIN FINANCIAL AGRI ACCOMMO EDU CONS INFO & COM MINING PROF HEALTH WATER REAL EST ADMIN MAN OTHER SER Source: Macroeconomic Committee ELECT ARTS 216 CONTRIBUTION TO GROWTH +3.5% +2.4% % The services category is dominating economic activity, followed by the industrial and primary sectors Services % Primary Industry


12 SECTOR PERFORMANCES & EXPECTATIONS
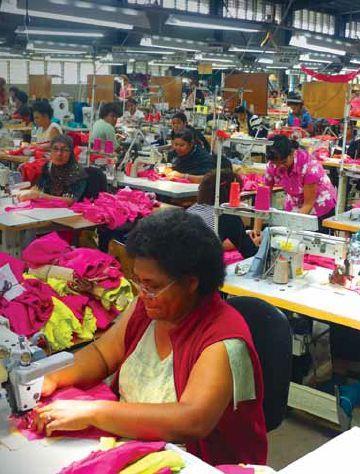
13 Sectoral performances (annual percent change, unless specified otherwise) Sector Tourism Visitor Arrivals Cum. to Sept: +4.2 T/Earnings Cum. to Jun: +3.9 Forecast: +8. Gold Cum. to Sept: Forecast: +1. Electricity Production Consumption Cum. to Sept: +3.5 Cum to Aug: +.3 Cement Production Cum. to Sept: Garment Production Exports Timber Pinewood Intake Woodchip Production Forecast:+5. Forecast:+7. Cum. to Aug: -38. Cum. to Aug: Mahogany Production Cum. to Sept: Sources: Fiji Bureau of Statistics, Vatukoula Gold Mine Limited, Fiji Electricity Authority, Tropik wood Industries Limited, Fiji Hardwood Corporation Limited, Bureau of Statistics and Macroeconomic Committee
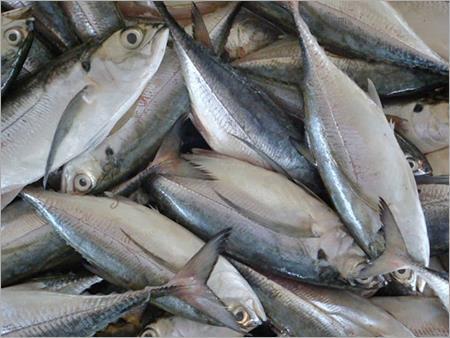
14 Sources: Fiji Sugar Corporation, Fiji Bureau of Statistics, Fisheries Companies and Macroeconomic Committee Sectoral performances are generally positive (annual percent change, unless specified otherwise) Sector Sugar Production (cane) Jun- 1 Oct: (99,556 tonnes) Forecast: Production (sugar) Jun- 1 Oct: -4.2 (11,195 tonnes) Forecast: TCTS (ratio) Sugar Exports Forecast: Fish Production (Industry Source) Cum. to Jun: Total Fish Exports Forecast: +2.
15 EXPECTATIONS FOR GENERAL BUSINESS CONDITIONS Weaker expectations but still positive % Next 3 months Next 12 months Jun.12 Dec.12 Jun.13 Dec.13 Jun.14 Dec.14 Jun.15 Dec.15 Jun.16

16 CONSUMPTION & INVESTMENT
17 Consumption spending remained mixed (annual percent change, unless specified otherwise) Partial Indicators Net VAT Domestic VAT Import VAT Jan-Jul: -26.3* Jan-Jul: Jan-Jul: New Consumption Lending Jan-Sept: New Vehicle Registration Jan-Sept: Second Hand Vehicle Registration Jan-Sept: +1.7 Electricity Consumption Jan-Aug: +.3 Imports of Consumption Goods Forecast: Personal Remittances Jan-Sept: +7.4 PAYE Collections Jan-Jul: +3.7 Job Advertisements (FT) Jan-Sept: +7.2 * due to the change in the VAT rate from 15% to 9%. consumption activity is expected to pick-up further inline with higher anticipated retailing activity post cyclone and FNPF handouts as well as loan packages provided by the banks. Sources: Fiji Revenue & Customs Authority, Land Transport Authority, Fiji Electricity Authority, Reserve Bank of Fiji, Fiji Bureau of Statistics and Macroeconomic Committee
18 Investment spending is also mixed (annual percent change, unless specified otherwise) Partial Indicators New Investment Lending Jan-Sept: Domestic Cement Sales Jan-Sept: +1. Completion Certificates Issued Value Number Jan-Jun: Building Permits Issued Value Number Jan-Jun: Value of Work Put-in-Place Jan-Jun: +1.3 Imports of Investment Goods (Excluding Aircraft) Forecast: Sources: Reserve Bank of Fiji, Fiji Bureau of Statistics, Basic Industries Ltd, Tengy Cement Company (Fiji) Ltd, Ministry of Finance, 215 National Budget Estimate and Budget Supplement, Bureau of Statistics and Macroeconomic Committee

19 Source: Reserve Bank of Fiji RBF RETAIL SALES SURVEY Annual Percent Change Stronger retail sale prospects for 216 % Dec-15 Jun f

20 % 3 Government Target: 25% INVESTMENT Share of Nominal GDP 2 Government Private & Public Enterprises Change in Inventories p 215e Source: Fiji Bureau of Statistics
21 EXPECTATIONS ON INVESTMENT ACTIVITY Improved short term expectations, but medium term expectations remain unchanged for buildings and softened for plant & machinery % Next 3 months Investment (Buildings) Next 12 months % Investment (Plant & Machinery) Next 3 months Next 12 months Jun.12 Dec.12 Jun.13 Dec.13 Jun.14 Dec.14 Jun.15 Dec.15 Jun.16 Jun.12 Dec.12 Jun.13 Dec.13 Jun.14 Dec.14 Jun.15 Dec.15 Jun.16

22 FISCAL POLICY
23 GOVERNMENT BALANCE % of GDP 2. Underlying Deficit (Excluding Asset Sales) Net Deficit /15 15/16 16/17 17/18 (t) 18/19 (t) Sources: Ministry of Economy, National Budget Supplement
24 GOVERNMENT DEBT % of GDP Domestic External Total Public Debt /15 15/16 Sep-16 16/17(b) 17/18(t) 18/19(t) Sources: Ministry of Economy, National Budget Supplement

25 LABOUR MARKET
26 JOB ADVERTISEMENTS SURVEY No. 12, JAN-SEPT 18.7% 1, 8, 2.5% 7.2% 6, 4, 2, Source: The Fiji Times


27 TRADE AND FOREIGN EXCHANGE EARNERS
28 OET EXPORT RECEIPTS: JAN-SEP (+5.1%) 216 ($645.8m) vs 215 ($614.2m) Total Reexports** Sugar Jan-Sep 216 Jan-Sep Fish 1.6 Gold 8.7 Other Exports* 72.3 Mineral Water 8.9 TCF 45.3 Timber F$M *Other Exports Includes: Ginger, Copra, Merchant Goods and other exports ** Total Re-exports includes: Mineral fuel and Others Source: OET
29 OET IMPORT PAYMENTS: JAN-SEP(+13.%) 216 ($2,615.9m) vs 215 ($2,315.8m) Other Imports Food,Beverages & Tobacco Machinery & Elec. Equip Transport Equipment Duty Free Goods Mineral Fuels Chemicals TCF Raw Materials Government Imports Merchanted Goods Jan- Sep 216 Jan- Sep F$M Source: OET
30 TRADE BALANCE OET F$M Export Imports Trade Bal Jan-Sep 4, 3, , 1, , -2, -3, (Jan-Sep) Source: OET
31 MAJOR FOREIGN EXCHANGE EARNERS $M 2, ,5 1,56 1, Tourism Receipts Remittances Mineral Water Sugar Gold Fish Garments Timber Sources: FBOS and


32 TOURISM EARNINGS & PERSONAL REMITTANCES
33 PERSONAL REMITTANCES Personal remittances slowing driven largely by personal receipts F$M Jan-Sep 23% 11% F$M Gifts, Maintenance & Donations Personal Receipts Immigrant Transfers % % p 216f 217f 5-5 Sep-14 Nov-14 Jan-15 Mar-15May-15 Jul-15 Sep-15 Nov-15 Jan-16 Mar-16May-16 Jul-16 Sep-16. Sources: OET & Macroeconomic Technical Committee
34 TOURISM EARNINGS F$M 1,8 Jan-Jun 8% 5% 1,6 11% 1,4 1,2 1, 8 1.6% 3.9% p 216f 217f Sources: Fiji Bureau of Statistics and Macroeconomic Committee

35 MONETARY & FINANCIAL INDICATORS
36 BROAD MONEY & CREDIT Monetary conditions remain favourable but credit growth slowing % 3 Broad Money Domestic Credit Net Foreign Assets (RHS) % Domestic Credit Private Sector Credit Sep-1 Sep-11 Sep-12 Sep-13 Sep-14 Sep-15 Sep-16-1 Sep-1 Sep-11 Sep-12 Sep-13 Sep-14 Sep-15 Sep-16 Source: Reserve Bank of Fiji
37 COMMERCIAL BANKS NEW LENDING, SEPT Slow growth due to reduced new investment related lending F$M 2, 1,5 Total Y-O-Y (rhs) % F$M 2, 1,5 Others Professional & Business Services Electricity, Gas & Water Building & Construction Transport & Storage Real & Estate Manufacturing Private Individuals Wholesale, Retail, Hotels & Restaurants , 5 1, From March 214 HFC lending is included in Commercial Banks Source: Reserve Bank of Fiji
38 BANKS NEW INVESTMENT & CONSUMPTION LOANS, SEPT Credit growth remains positive, but annual slowing is investment-related F$M Building & Construction % 4 Real Estate Y-o-Y (rhs) F$M Private Individuals (Others) WRHR Y-o-Y (rhs) % From March 214 HFC lending is included in Commercial Banks Source: Reserve Bank of Fiji
39 BANKS LIQUIDITY Ample liquidity exists and interest rates at historical lows INTEREST RATES F$M Oct-9 Oct-1 Oct-11 Oct-12 Oct-13 Oct-14 Oct-15 Oct-16 As at 21 October, 216 % Outstanding Lending Savings Deposit Time Deposit Sep-8 Sep-9 Sep-1 Sep-11 Sep-12 Sep-13 Sep-14 Sep-15 Sep-16 % 12. New Lending New Time Deposit Sep-8 Sep-9 Sep-1 Sep-11 Sep-12 Sep-13 Sep-14 Sep-15 Sep-16 Source: Reserve Bank of Fiji

40 MOVEMENTS IN F$ AGAINST BASKET CURRENCIES CHANGE IN VALUE OF FJD AUD NZD JPY USD EUR 3 th September MONTHLY % CHANGE ANNUAL % CHANGE % CHANGE FROM 1 st JAN TO 3 th SEP % CHANGE FROM 15 th APR 9* TO 3 th SEP * 15 th April 9 was the last devaluation of the FJD Source: Reserve Bank of Fiji
41 REER/NEER (Monthly Average) Index REER NEER Sep-8 Mar-9 Sep-9 Mar-1 Sep-1 Mar-11 Sep-11 Mar-12 Sep-12 Mar-13 Sep-13 Mar-14 Sep-14 Mar-15 Sep-15 Mar-16 Sep-16 Source: Reserve Bank of Fiji

42 TWIN OBJECTIVES
43 INFLATION Headline Inflation Contribution to Inflation % Monthly % Change Headline % 5.6% Alcoholic Beverages, Tobacco & Narcotics Food & Nonalcoholic Beverages Education.1 Restaraunts & Hotels -.1 Others* -.6 Housing, Water, Elec., Gas & other Fuels *Others include Health, Communication. Furnishings, Hhld., Equip. Routine Hhld. maintenance, Recreation & Culture, Clothing & Footwear and Misc. Sources: Reserve Bank of Fiji and Fiji Bureau of Statistics
44 FOREIGN RESERVES F$M 2,5 MORI 7. 2, 1,5 Benchmark MORI Cover Retained Imports Cover ,944 1, , /9/ Source: Reserve Bank of Fiji
45 SUMMARY Domestic economic prospects remain firm against the subdued global outlook Opportunities exist for various sectors Labour market conditions remain positive. Private sector optimism persists Supportive fiscal and monetary policy stances Inflation rose due to TC Winston and Floods. Expected to be 3.5% by year-end. Foreign reserves are currently comfortable at $1,981 (5.5 MORI) and expected to remain comfortable for the rest of 216.

46 THANK YOU
Reserve Bank of Fiji 24 January FIJI ECONOMY - Recent Economic Developments
 Reserve Bank of Fiji 24 January 217 FIJI ECONOMY - Recent Economic Developments Developments in the International Economy that would impact on Fiji s Economy? Global growth/us/china Trading partner performances
CURRENT ECONOMIC CONDITIONS
 Presentation to the FIA CURRENT ECONOMIC CONDITIONS 5 October 2017 Global economic outlook Has improved Global Economy Consolidating Healthy Growth Trajectory Global growth (%) Source: 2017 July IMF World
FIJI INSITITUTE OF ACCOUNTANTS SEMINAR FIJI: CURRENT ECONOMIC CONDITIONS & OUTLOOK. Ariff Ali Governor, Reserve Bank of Fiji 18 September, 2018
 FIJI INSITITUTE OF ACCOUNTANTS SEMINAR FIJI: CURRENT ECONOMIC CONDITIONS & OUTLOOK Ariff Ali Governor, Reserve Bank of Fiji 18 September, 218 ROLE OF CENTRAL BANKS? Central Banking is a high impact organization.
2018 PACIFIC UPDATE FIJI: CURRENT ECONOMIC CONDITIONS & OUTLOOK
 218 PACIFIC UPDATE FIJI: CURRENT ECONOMIC CONDITIONS & OUTLOOK Ariff Ali Governor, Reserve Bank of Fiji 6 July, 218 FIJI ECONOMY How have we transformed since independence? 1977 Base 1995 Base 211 Base
FIJIAN ECONOMY RISKS AND CHALLENGES. FIA Workshop, June 2017 Esala Masitabua
 FIJIAN ECONOMY RISKS AND CHALLENGES FIA Workshop, 23-24 June 217 Esala Masitabua BIG PICTURE RISKS CHALLENGES CONCLUDING REMARKS unprecedented period of growth % 6. 5. 4. 3. 2. 1. 1.9 Actual Forecast
SACU INFLATION REPORT. December 2017
 SACU INFLATION REPORT December 20 The content of this publication is intended for general information only. While precaution is taken to ensure the accuracy of information, the SACU Secretariat shall not
SACU INFLATION REPORT. April 2018
 SACU INFLATION REPORT April 2018 The content of this publication is intended for general information only. While precaution is taken to ensure the accuracy of information, the SACU Secretariat shall not
SACU INFLATION REPORT. January 2018
 SACU INFLATION REPORT January 2018 The content of this publication is intended for general information only. While precaution is taken to ensure the accuracy of information, the SACU Secretariat shall
Sada Reddy: Fiji s economy
 Sada Reddy: Fiji s economy Presentation by Mr Sada Reddy, Deputy Governor of the Reserve Bank of Fiji, to the FIJI NZ Business Council, Suva, 3 October 2008. * * * Outline The outline of my presentation
SACU INFLATION REPORT. February 2017
 SACU INFLATION REPORT February 2017 The content of this publication is intended for general information only. While precaution is taken to ensure the accuracy of information, the SACU Secretariat shall
SACU INFLATION REPORT. February 2018
 SACU INFLATION REPORT February 2018 The content of this publication is intended for general information only. While precaution is taken to ensure the accuracy of information, the SACU Secretariat shall
SACU INFLATION REPORT. October 2018
 SACU INFLATION REPORT October 2018 The content of this publication is intended for general information only. While precaution is taken to ensure the accuracy of information, the SACU Secretariat shall
SACU INFLATION REPORT. February 2016
 SACU INFLATION REPORT February 2016 The content of this publication is intended for general information only. While precaution is taken to ensure the accuracy of information, the SACU Secretariat shall
SACU INFLATION REPORT. July 2018
 SACU INFLATION REPORT July 2018 The content of this publication is intended for general information only. While precaution is taken to ensure the accuracy of information, the SACU Secretariat shall not
SACU INFLATION REPORT. January 2017
 SACU INFLATION REPORT January 2017 The content of this publication is intended for general information only. While precaution is taken to ensure the accuracy of information, the SACU Secretariat shall
SACU INFLATION REPORT. December 2018
 SACU INFLATION REPORT December 201 The content of this publication is intended for general information only. While precaution is taken to ensure the accuracy of information, the SACU Secretariat shall
SACU INFLATION REPORT. November 2018
 SACU INFLATION REPORT November 2018 The content of this publication is intended for general information only. While precaution is taken to ensure the accuracy of information, the SACU Secretariat shall
MONTHLY ECONOMIC INDICATORS
 MONTHLY ECONOMIC INDICATORS SEPTEMBER 0 Table of Contents 1. INFLATION... 2 2. MONEY, CREDIT AND INTEREST RATES... 6 3. REAL SECTOR INDICATORS... 9 4. BALANCE OF PAYMENTS AND EXTERNAL SECTOR INDICATORS...
CONTENTS COMMENTARY CHARTS TABLES GLOSSARY. Section 1: Headline Inflation Section 2: Core Inflation
 COMMENTARY CONTENTS Section 1: Headline Inflation Section 2: Core Inflation CHARTS 1. National Rates of Inflation, January 2010 April 2013 2. Monthly Changes in the Cost-of-Living Index, January 2010 April
MINISTRY OF NATIONAL PLANNING AND DEVELOPMENT REPUBLIC OF SOMALILAND Central Statistics Department OFFICIAL RELEASE
 MINISTRY OF NATIONAL PLANNING AND DEVELOPMENT REPUBLIC OF SOMALILAND Central Statistics Department OFFICIAL RELEASE Monthly Consumer Price Index September 20 Methodology This publication provides the monthly
REPUBLIC OF SOMALILAND
 REPUBLIC OF SOMALILAND Ministry of National Planning & Development Central Statistics Department OFFICIAL RELEASE Monthly Consumer Price Index October 2016 2016 Page 1 of 9 Consumer Price Index (CPI) October,
Inflation Update. Mild pick-up in inflation rates
 December 8 Saudi CPI inflation Monthly change Annual change October 8 -.3. September 8 -.. Year-to-October average.3. Inflation rates in trade partners (latest) Kuwait Bahrain Oman Japan UAE S. Korea Euro
1 RED September/October 2018 SEPTEMBER/OCTOBER 2018
 1 RED September/October 20 SEPTEMBER/OCTOBER 20 2 RED September/October 20 MAJOR HIGHLIGHTS The country s annual consumer inflation grew by 0.2 percentage points to reach 5.1 per cent in September 20,
Monetary Policy Report
 CENTRAL BANK OF THE GAMBIA Monetary Policy Report November 20 The Central Bank of The Gambia Monetary Policy Report provides summary of reports presented at the Monetary Policy Committee Meeting. It entails
QUARTERLY ECONOMIC REVIEW (QER)
") QUARTERLY ECONOMIC REVIEW (QER) Volume 2 No 4 January - March 2018 OBJECTIVES OF THE CENTRAL BANK OF KENYA The principal objectives of the Central Bank of Kenya (CBK) as established in the CBK Act are:
QUARTERLY ECONOMIC REVIEW (QER) Volume 2 No 4 January - March 2018 OBJECTIVES OF THE CENTRAL BANK OF KENYA The principal objectives of the Central Bank of Kenya (CBK) as established in the CBK Act are:
Economic & Financial Indicators. November Banco de Cabo Verde
 Economic & Financial Indicators November Banco de Cabo Verde Monetary Policy Report BANCO DE CABO VERDE Department of Economic Studies and Statistics Avenida Amílcar Cabral, 27 CP 7600-101 - Praia - Cabo
MONETARY POLICY COMMITTEE STATEMENT FOR THIRD QUARTER Governor s Presentation to the Media. 16 th November, 2016
 1 MONETARY POLICY COMMITTEE STATEMENT FOR THIRD QUARTER 2016 Governor s Presentation to the Media 16 th November, 2016 INTRODUCTION 2 This presentation is structured as follows: 1. Decision of the Monetary
Major Highlights. Recent Economic Developments April/May Central Bank of Swaziland 1
 Major Highlights Annual consumer inflation increased to 7.0 per cent in April 2017 from 6.0 per cent in March 2017. Inflation rate (% y/y) 7.0 (Apr) Discount and prime lending rates remained unchanged
MONTHLY ECONOMIC INDICATORS
 MONTHLY ECONOMIC INDICATORS JULY Table of Contents 1. INFLATION... 2 2. MONEY, CREDIT AND INTEREST RATES... 6 3. REAL SECTOR INDICATORS... 9 4. BALANCE OF PAYMENT AND EXTERNAL SECTOR INDICATORS... 10 5.
2.1 Supply. Nominal Farm Income. Bank of Thailand, October 2017
 Bank of Thailand, October 2.1 Supply Farm income contracted from both decreased agricultural prices and output. Manufacturing production remained unchanged from the same period last year. The overall services
Sep 2017 = 21.9 Bn USD Ex. Gold = 20.6 Bn USD. H1 H2 Q1 Q2 Q3 Aug Sep %MoM
 1 Aug = 21.0 Bn USD Ex. Gold = 20.0 Bn USD Source: Compiled from Customs Department s data P = Preliminary data Sep = 21.9 Bn USD Ex. Gold = 20.6 Bn USD P P Share %YoY P P H1 H2 Q1 Q2 Q3 Aug Sep %MoM sa
MONETARY POLICY COMMITTEE STATEMENT FOR FIRST QUARTER Governor s Presentation to the Media. 16 th May, 2018
 1 MONETARY POLICY COMMITTEE STATEMENT FOR FIRST QUARTER 2018 Governor s Presentation to the Media 16 th May, 2018 INTRODUCTION 2 The presentation is structured as follows: 1. Decision of the Monetary Policy
2017 FIRST QUARTER ECONOMIC REVIEW
 2017 FIRST QUARTER ECONOMIC REVIEW MAY 2017 0 P a g e Overview The performance of the economy in the first quarter of 2017 was on a positive trajectory with annual growth projected to be about 3.9 % from
Presentation to Chief Executive Officers of Commercial and Microfinance Banks Dr. Patrick Njoroge Governor, Central Bank of Kenya
 Presentation to Chief Executive Officers of Commercial and Microfinance Banks Dr. Patrick Njoroge Governor, Central Bank of Kenya August 6, 2015 Outline 1. The Information basis for the MPC meeting 2.
The national monthly CPI (2008=100) increased from per cent in September, 2017 to per cent
 increased from per cent in September, 2017 to per cent") CONSUMER PRICE INDEX (CPI) October, 2017: PRESS RELEASE Released on Monday November 21, 2017 at 1:00 pm OCTOBER 2017 MONTHLY INFLATION RATE INCREASES SLIGHTLY The national monthly CPI (2008=100) increased
CONSUMER PRICE INDEX (CPI) October, 2017: PRESS RELEASE Released on Monday November 21, 2017 at 1:00 pm OCTOBER 2017 MONTHLY INFLATION RATE INCREASES SLIGHTLY The national monthly CPI (2008=100) increased
1.0 BANK OF TANZANIA MONTHLY ECONOMIC REVIEW
 1.0 BANK OF TANZANIA MONTHLY ECONOMIC REVIEW April 2016 Contents 1.0 Inflation and Food Supply Situation... 1 1.1 Inflation Developments... 1 1.2 Food Supply Situation... 1 1.3 Prices of Food Crops...
1.0 BANK OF TANZANIA MONTHLY ECONOMIC REVIEW
 1.0 BANK OF TANZANIA MONTHLY ECONOMIC REVIEW October 2016 Contents 1.0 Inflation and Food Supply Situation... 1 1.1 Inflation Developments... 1 1.2 Food Supply Situation... 2 1.3 Prices of Food Crops...
SACU INFLATION REPORT. February 2015
 SACU INFLATION REPORT February 2015 The content of this publication is intended for general information only. While precaution is taken to ensure the accuracy of information, the SACU Secretariat shall
SACU INFLATION REPORT. December 2014
 SACU INFLATION REPORT December 2014 The content of this publication is intended for general information only. While precaution is taken to ensure the accuracy of information, the SACU Secretariat shall
Oct 2017 = 20.0 Bn USD Ex. Gold = 19.9 Bn USD
 1 Sep = 21.9 Bn USD Ex. Gold = 20.6 Bn USD %YoY Oct = 20.0 Bn USD Ex. Gold = 19.9 Bn USD Share P P P H1 Q2 Q3 Sep Oct %MoM sa Agriculture 7.0-6.2 19.8 19.2 28.4 9.8 10.2-5.2 Fishery 1.0 15.1 6.5 10.4 11.5
Inflation rate in Camarines Sur increases to 6.8 percent in September 2017
 Inflation Rate (in Percent) [ Inflation rate in Camarines Sur increases to 6.8 percent in September Date of Release: October 30, Reference No. -83 The provincial headline inflation rate in September increased
To be a World Class Modern Central Bank
 1 Monthly Economic Bulletin June 2018 Table of Contents SYMBOLS... 3 DEFINITIONS... 4 1. INFLATION... 6 2. MONEY, CREDIT AND INTEREST RATES... 10 3. REAL SECTOR INDICATORS... 13 4. BALANCE OF PAYMENTS
Inflation rate in Camarines Sur decreases to 5.1 percent in December 2017
 Inflation Rate (in Percent) [ Inflation rate in Camarines Sur decreases to 5.1 percent in ember Date of Release: January 11, 2018 Reference No. 2018-4 The provincial headline inflation rate in ember decreased
Short-term Inflation analysis and forecasts. November 2017 RESEARCH SERVICES DEPARTMENT RESEARCH AND ECONOMIC PROGRAMMING DIVISION
 Short-term Inflation analysis and forecasts November 2017 RESEARCH SERVICES DEPARTMENT RESEARCH AND ECONOMIC PROGRAMMING DIVISION c 2017 Bank of Jamaica Nethersole Place Kingston Jamaica Telephone: (876)
QUARTERLY ECONOMIC REVIEW (QER)
") QUARTERLY ECONOMIC REVIEW (QER) Volume 2 No 5 April - June 2018 OBJECTIVES OF THE CENTRAL BANK OF KENYA The principal objectives of the Central Bank of Kenya (CBK) as established in the CBK Act are: 1)
QUARTERLY ECONOMIC REVIEW (QER) Volume 2 No 5 April - June 2018 OBJECTIVES OF THE CENTRAL BANK OF KENYA The principal objectives of the Central Bank of Kenya (CBK) as established in the CBK Act are: 1)
QUARTERLY ECONOMIC REVIEW (QER)
") QUARTERLY ECONOMIC REVIEW (QER) Volume 3 No 3 July - September 2018 OBJECTIVES OF THE CENTRAL BANK OF KENYA The principal objectives of the Central Bank of Kenya (CBK) as established in the CBK Act are:
QUARTERLY ECONOMIC REVIEW (QER) Volume 3 No 3 July - September 2018 OBJECTIVES OF THE CENTRAL BANK OF KENYA The principal objectives of the Central Bank of Kenya (CBK) as established in the CBK Act are:
MONETARY POLICY COMMITTEE STATEMENT FOR THIRD QUARTER Governor s Presentation to the Media. 22 nd November, 2017
 1 MONETARY POLICY COMMITTEE STATEMENT FOR THIRD QUARTER 2017 Governor s Presentation to the Media 22 nd November, 2017 INTRODUCTION 2 The presentation is structured as follows: 1. Decision of the Monetary
CENTRAL BANK OF LIBERIA (CBL)
") CENTRAL BANK OF LIBERIA (CBL) MONTHLY ECONOMIC REVIEW JULY. 2017 VOLUME 3 No. 7 The Monthly Economic Review is produced by the Bank s Research, Policy & Planning Department. Inquiries concerning this publication
CENTRAL BANK OF LIBERIA (CBL) MONTHLY ECONOMIC REVIEW JULY. 2017 VOLUME 3 No. 7 The Monthly Economic Review is produced by the Bank s Research, Policy & Planning Department. Inquiries concerning this publication
NOVEMBER 22, : MONTHLY INFLATION RATE INCREASES SIGNIFICANTLY
 CONSUMER PRICE INDEX (CPI) November, 2016: PRESS RELEASE Released on Thursday December 22, 2016 at 1:00 pm NOVEMBER 2016 MONTHLY INFLATION RATE INCREASES SIGNIFICANTLY The national monthly CPI (2008=100)
Regional economic overview: Midyear assessment. Christopher Edmonds Senior Economist Pacific Department, Asian Development Bank, Manila
 Regional economic overview: Midyear assessment Christopher Edmonds Senior Economist Pacific Department, Asian Development Bank, Manila ADB Developing Member Countries in the Pacific International and regional
Supply. Bank of Thailand, December Nominal Farm Income. Real Farm Income. Manufacturing Production Index (MPI)
") Bank of Thailand, December Supply Farm income continued to decline from decreased agricultural prices which outweighed the expansion in agricultural production Manufacturing production expanded from the
Bank of Thailand, December Supply Farm income continued to decline from decreased agricultural prices which outweighed the expansion in agricultural production Manufacturing production expanded from the
Inflation Remains Tepid in November at 0.2% as Transport Cost Trending Downward
 19 December 2018 ECONOMIC REVIEW November 2018 Consumer Price Index Inflation Remains Tepid in November at 0.2% as Transport Cost Trending Downward Headline inflation back to near 4-year low. Consumer
THE WEEKLY ISSUE TH DECEMBER 2017 THE IMF COMPLETES THE SECOND REVIEW OF EGYPT S REFORM PROGRAM IN THIS ISSUE
 THE IMF COMPLETES THE SECOND REVIEW OF EGYPT S REFORM PROGRAM The International Monetary Fund (IMF) completed the second review of Egypt s reform program. The completion of the review allows the authorities
2.1 Supply. Nominal Farm Income. Economic and Monetary Conditions, June Real Farm Income. Manufacturing Production Index (MPI)
") Economic and Monetary Conditions, June 2.1 Supply Farm income expanded from the same period last year as supported mainly by increased agricultural production, while agricultural prices continued to contract
Economic and Monetary Conditions, June 2.1 Supply Farm income expanded from the same period last year as supported mainly by increased agricultural production, while agricultural prices continued to contract
REPUBLIC OF SOMALILAND MINISTRY OF PLANNING AND NATIONAL DEVELOPMENT Central Statistics Department OFFICIAL RELEASE
 REPUBLIC OF SOMALILAND MINISTRY OF PLANNING AND NATIONAL DEVELOPMENT Central Statistics Department OFFICIAL RELEASE Monthly Consumer Price Index April 2018 Methodology This publication provides the monthly
REPUBLIC OF SOMALILAND
 REPUBLIC OF SOMALILAND Ministry Of National Planning &Development Central Statistics Department OFFICIAL RELEASE Monthly Consumer Price Index September 2016 2016 Page 1 of 9 Consumer Price Index (CPI)
SOMALILAND CONSUMER PRICE INDEX
 Methodology This publication provides monthly Consumer Price Indices Composite of Somaliland which is based on two main market baskets of Hargeisa urban households. The current Consumer Price Index was
CONSUMER PRICE INDEX JULY 2018 PRESS RELEASE
 CONSUMER PRICE INDEX JULY 2018 PRESS RELEASE Released: 21 st August, 2018 @ 12: 00 noon Contact Persons: Abu Bakarr Turay Director, Economic Statistics Division Statistics Sierra Leone Mobile: +23276690948
Monthly Economic and Financial Developments April 2006
 Release Date: 30 May Monthly Economic and Financial Developments April In an effort to provide the public with more frequent information on its economic surveillance activities, the Central Bank has decided
2.1 Supply. Economic and Monetary Conditions, July Nominal Farm Income. Real Farm Income
 Economic and Monetary Conditions, y 2.1 Supply Farm income expanded from the same period last year as supported mainly by increased agricultural production, while agricultural prices slightly contracted.
MONTHLY ECONOMIC INDICATORS
 MONTHLY ECONOMIC INDICATORS May 2018 1 Monthly Economic Bulletin May 2018 Table of Contents SYMBOLS... 3 DEFINITIONS... 4 1. INFLATION... 6 2. MONEY, CREDIT AND INTEREST RATES... 10 3. REAL SECTOR INDICATORS...
MONTHLY ECONOMIC INDICATORS
 To be a World Class Modern Central Bank MONTHLY ECONOMIC INDICATORS August 2018 1 Monthly Economic Bulletin August 2018 Table of Contents SYMBOLS... 3 DEFINITIONS... 4 1. INFLATION... 6 2. MONEY, CREDIT
Camarines Sur Consumer Price Index
 Inflation Rates (in Percent) Camarines Sur Consumer Price Index SR No. - 50 JULY Inflation rate in Camarines Sur increases to 6.4 percent in April The provincial headline inflation rate in Camarines Sur
Nauru. Key Indicators for Asia and the Pacific Item
 Key Indicators for Asia and the Pacific 2018 1 POPULATION Total population a as of 1 July ( 000) 10.1 10.1 10.1 9.9 9.7 9.5 9.1 9.2 9.4 9.5 9.7 10.1 10.3 10.8 11.9 12.5 13.0 13.3 Population density (persons/km
Supply. Nominal Farm Income. Economic and Monetary Conditions, Febuary Real Farm Income. Manufacturing Production Index (MPI)
") Economic and Monetary Conditions, Febuary Supply Farm income continued to contract, attributed mainly to decreased agricultural prices which outweighed the expansion in agricultural production. Manufacturing
Economic and Monetary Conditions, Febuary Supply Farm income continued to contract, attributed mainly to decreased agricultural prices which outweighed the expansion in agricultural production. Manufacturing
Sri Lanka: Recent Economic Trends. January 2018
 Sri Lanka: Recent Economic Trends January 2018 1 Agenda Summary Economic Growth Inflation and Monetary Policy External Account Fiscal Scenario of Government of Sri Lanka ICRA Lanka Limited 2 2 Agenda Summary
Consumer Price Index (Base year 2014) Consumer Price Index
 Consumer Price Index") Consumer Price Index December 2017 (Base year 2014) Consumer Price Index 1 Release Date: January 2018 Detailed by: Expenditure groups Household welfare levels Household type Regions Briefing This publication
Consumer Price Index December 2017 (Base year 2014) Consumer Price Index 1 Release Date: January 2018 Detailed by: Expenditure groups Household welfare levels Household type Regions Briefing This publication
Revised October 17, 2016
 Revised October 17, 2016 60 ISM Manufacturing Purchasing Managers Index (September 2015 September 2016) 58 56 54 52 50 48 46 44 42 Sept-15 Oct Nov Dec Jan-16 Feb Mar Apr May Jun Jul Aug Sept Purchasing
MONTHLY ECONOMIC REVIEW
 MONTHLY ECONOMIC REVIEW December INSIDE THIS ISSUE: Selected Economic Indicators 2 Stock Market Developments 3 Banking Sector Developments 3 Inflation 4 National Payments System 6 Statistical Tables 8
Consumer Price Index (Base year 2014) Consumer Price Index
 Consumer Price Index") Consumer Price Index December 2016 (Base year 2014) Consumer Price Index 1 Release Date: January 2017 Detailed by: Expenditure groups Household welfare levels Household type Regions Briefing This publication
Consumer Price Index December 2016 (Base year 2014) Consumer Price Index 1 Release Date: January 2017 Detailed by: Expenditure groups Household welfare levels Household type Regions Briefing This publication
MONTHLY ECONOMIC REVIEW
 MONTHLY ECONOMIC REVIEW AUGUST INSIDE THIS ISSUE: Selected Economic Indicators 2 Stock Market Developments 3 Monetary Developments 4 Inflation 5 National Payments System 6 Statistical Tables 8 SELECTED
The national monthly CPI (2008=100) increased from per cent in November, 2017 to per cent
 increased from per cent in November, 2017 to per cent") CONSUMER PRICE INDEX (CPI) December, 2017: PRESS RELEASE Released on Monday January 17, 2017 at 1:00 pm DECEMBER 2017 MONTHLY INFLATION RATE INCREASES SIGHTLY The national monthly CPI (2008=100) increased
CONSUMER PRICE INDEX (CPI) December, 2017: PRESS RELEASE Released on Monday January 17, 2017 at 1:00 pm DECEMBER 2017 MONTHLY INFLATION RATE INCREASES SIGHTLY The national monthly CPI (2008=100) increased
Indian Economy. GDP growth slowed down but remained above the comfortable 7% Manufacturing GVAbp
 Indian Economy Economic Growth GDP growth slowed down but remained above the comfortable 7% Domestic economy witnessed 7.1% GDP growth during the first quarter (Apr - Jun) of fiscal 2016-17 (Q1FY17) as
SUMMARY OF SELECTED ECONOMIC INDICATORS
 SUMMARY OF SELECTED ECONOMIC INDICATORS RECENT DATA GRAPHS HISTORICAL DATA GRAPHS P.E.I. CONSUMER PRICE INDEX P.E.I. LABOUR FORCE STATISTICS CANADA/P.E.I. GROSS DOMESTIC PRODUCT, INCOME-BASED CANADA /
Inflation rate in Camarines Sur decreases to 5.2 percent in June 2018
 Inflation Rate (in Percent) [ Inflation rate in Camarines Sur decreases to 5.2 percent in Date of Release: July 13, Reference No. -028 The provincial headline inflation rate slightly decreased to 5.2 percent
2.1 Supply. Nominal Farm Income. Bank of Thailand, November Real Farm Income
 Bank of Thailand, November 2.1 Supply Farm income contracted from both decreased agricultural prices and production. Manufacturing and services sector activities expanded from the same period last year.
REPUBLIC OF SOMALILAND MINISTRY OF PLANNING AND NATIONAL DEVELOPMENT Central Statistics Department OFFICIAL RELEASE
 REPUBLIC OF SOMALILAND MINISTRY OF PLANNING AND NATIONAL DEVELOPMENT Central Statistics Department OFFICIAL RELEASE Monthly Consumer Price Index October 2018 Methodology This publication provides the monthly
REPUBLIC OF SOMALILAND MINISTRY OFPLANNING AND NATIONALDEVELOPMENT Central Statistics Department OFFICIAL RELEASE
 REPUBLIC OF SOMALILAND MINISTRY OFPLANNING AND NATIONALDEVELOPMENT Central Statistics Department OFFICIAL RELEASE Monthly Consumer Price Index November 2018 Methodology This publication provides the monthly
Consumer Price Index (Base year 2014) Consumer Price Index
 Consumer Price Index") Consumer Price Index July 207 (Base year 204) Consumer Price Index Release Date: Augest 207 Detailed by: Expenditure groups Household welfare levels Household type Regions Briefing This publication provides
Consumer Price Index July 207 (Base year 204) Consumer Price Index Release Date: Augest 207 Detailed by: Expenditure groups Household welfare levels Household type Regions Briefing This publication provides
Inflation rate in Camarines Sur increases to 5.3 percent in May 2018
 Inflation Rate (in Percent) [ Inflation rate in Camarines Sur increases to 5.3 percent in May Date of Release: July 13, Reference No. -027 The provincial headline inflation rate significantly increased
KGkh BANK OF TANZANIA MONTHLY ECONOMIC REVIEW
 KGkh BANK OF TANZANIA MONTHLY ECONOMIC REVIEW June 218 Contents 1. Inflation and Food Stocks... 1 1.1 Inflation Developments... 1 1.2 Food Stocks... 1 1.3 Prices of Food Crops... 2 2. Monetary and Financial
Jun 2018 = 21.8 Bn USD Ex. Gold = 21.3 Bn USD
 1 May = 22.3 Bn USD Ex. Gold = 21.9 Bn USD %YoY Source: Compiled from Customs Department s data P = Preliminary data Jun = 21.8 Bn USD Ex. Gold = 21.3 Bn USD P P Share P P H1 H2 H1 Q1 Q2 May Jun %MoM sa
CENTRAL BANK OF SOLOMON ISLANDS
 CENTRAL BANK OF SOLOMON ISLANDS MONETARY POLICY STATEMENT March 2018 P. O. Box 634, Honiara, Solomon Islands. Tel (+677) 21791 1 Table of Contents 1 Overview... 4 2 International Economic Developments...
Moderating External Trade Caused IPI to Hit 3-Month Low at 3%
 12 July 2018 ECONOMIC REVIEW May 2018 Industrial Production Index Moderating External Trade Caused IPI to Hit 3-Month Low at 3% IPI meets market estimates. Malaysia s industrial production expands by 3%yoy
OFFICIAL RELEASE. Monthly Consumer Price Index September 2018
 REPUBLIC OF SOMALILAND MINISTRY OFPLANNING AND NATIONALDEVELOPMENT Central Statistics Department OFFICIAL RELEASE Monthly Consumer Price Index September 2018 Methodology This publication provides the monthly
2.1 Supply. Bank of Thailand, January Nominal Farm Income. Manufacturing Production Index (MPI)
") Bank of Thailand, uary 2.1 Supply Farm income continually increased but concentrated in certain crops and regions. Service sector continued to expand, especially for tourism-related activities on the back
Bank of Thailand, uary 2.1 Supply Farm income continually increased but concentrated in certain crops and regions. Service sector continued to expand, especially for tourism-related activities on the back
International Monetary Fund Washington, D.C.
 2005 International Monetary Fund September 2005 IMF Country Report No. 05/357 Brunei Darussalam: Statistical Appendix This Statistical Appendix paper for Brunei Darussalam was prepared by a staff team
Supply. Nominal Farm Income. Economic and Monetary Conditions, March Real Farm Income. Manufacturing Production Index (MPI)
") Economic and Monetary Conditions, March Supply Farm income continued to decline from the same period last year albeit at a decelerated rate, attributed mainly to decreased agricultural prices which outweighed
Economic and Monetary Conditions, March Supply Farm income continued to decline from the same period last year albeit at a decelerated rate, attributed mainly to decreased agricultural prices which outweighed
Short-term Inflation analysis and forecast. April 2018 RESEARCH SERVICES DEPARTMENT RESEARCH AND ECONOMIC PROGRAMMING DIVISION
 Short-term Inflation analysis and forecast April 2018 RESEARCH SERVICES DEPARTMENT RESEARCH AND ECONOMIC PROGRAMMING DIVISION c 2018 Bank of Jamaica Nethersole Place Kingston Jamaica Telephone: (876) 922
MONTHLY ECONOMIC REVIEW
 October 218 a BANK OF TANZANIA MONTHLY ECONOMIC REVIEW October 218 b October 218 October 218 i Contents 1. Inflation and Food Stocks... 1 1.1 Inflation Developments... 1 1.2 Food Stocks... 1 1.3 Prices
CENTRAL BANK OF SOLOMON ISLANDS MONETARY POLICY STATEMENT. September 2014
 CENTRAL BANK OF SOLOMON ISLANDS MONETARY POLICY STATEMENT September 214 Central Bank of Solomon Islands P. O. Box 634, Honiara, Solomon Islands. Tel: (677) 21791 Table of Contents 1. OVERVIEW... 3 2. INTERNATIONAL
Namibia Consumer Price Index
 Namibia Consumer Price Index March, 2016 Namibia Statistics Namibia Consumer Price Index: March, 2016 Agency 1 OUR MISSION In a coordinated manner produce and disseminate relevant, quality and timely statistics
Valentyn Povroznyuk, Radu Mihai Balan, Edilberto L. Segura
 September 214 GDP grew by 1.2% yoy in Q2 214. Industrial output growth was equal to 1.4% yoy in June 214. The consolidated budget deficit narrowed to.2% of GDP in January-July 214. Consumer inflation slightly
MONTHLY ECONOMIC INDICATORS
 MONTHLY ECONOMIC INDICATORS April 1 Monthly Economic Bulletin April Table of Contents 1. INFLATION...3 2. MONEY, CREDIT AND INTEREST RATES...7 3. REAL SECTOR INDICATORS...10 4. BALANCE OF PAYMENTS AND
Nielsen s FMCG Index & Fuel Index Jan 2014 = 100 Jan 2014 = 100. Service Index* & Net Tourist Spending Index Jan 2014 = 100
 1 = Nielsen s FMCG Index & Fuel Index = = 115 105 95 85 Durable and Semi-durable Indices Nielsen s FMCG Index sa, 3mma Fuel Index, sa Fuel Index sa, 3mma (RHS) Semi-durable Index sa,3mma Durable Index
Jul 2018 = 20.3 Bn USD Ex. Gold = 20.1 Bn USD. H1 H2 H1 Q1 Q2 Jun Jul
 1 Jun = 21.8 Bn USD Ex. Gold = 21.3 Bn USD %YoY Export Value Source: Compiled from Customs Department s data P = Preliminary data = 20.3 Bn USD Ex. Gold = 20.1 Bn USD P P Share P P H1 H2 H1 Q1 Q2 Jun %MoM
Short-term Inflation analysis and forecast. January 2018 RESEARCH SERVICES DEPARTMENT RESEARCH AND ECONOMIC PROGRAMMING DIVISION
 Short-term Inflation analysis and forecast January 2018 RESEARCH SERVICES DEPARTMENT RESEARCH AND ECONOMIC PROGRAMMING DIVISION c 2018 Bank of Jamaica Nethersole Place Kingston Jamaica Telephone: (876)
Zambia s Economic Outlook
 Zambia s Economic Outlook F R A N C I S C H I P I M O D I R E C T O R E C O N O M I C S B A N K O F Z A M B I A Z A M B I A I N V E S T M E N T C O N F E R E N C E N O V E M B E R 4, 2 0 1 5 L O N D O
Consumer Price Index (Base year 2014) Consumer Price Index
 Consumer Price Index") Consumer Price Index uary 2018 (Base year 2014) Consumer Price Index 1 Release Date: uary 2018 Detailed by: Expenditure groups Household welfare levels Household type Regions Briefing This publication
Consumer Price Index uary 2018 (Base year 2014) Consumer Price Index 1 Release Date: uary 2018 Detailed by: Expenditure groups Household welfare levels Household type Regions Briefing This publication
Nielsen s FMCG Index & Fuel Index Jan 2014 = 100 Jan 2014 = 100. Service Index* & Net Tourist Spending Index Jan 2014 = 100
 1 = Nielsen s FMCG Index & Fuel Index = = 115 15 95 85 Durable and Semi-durable Indices Nielsen s FMCG Index sa, 3mma Fuel Index, sa Fuel Index sa, 3mma (RHS) Semi-durable Index sa,3mma Durable Index sa,