Sapp Center for Science Teaching and Learning
|
|
|
- Everett Thornton
- 5 years ago
- Views:
Transcription
1
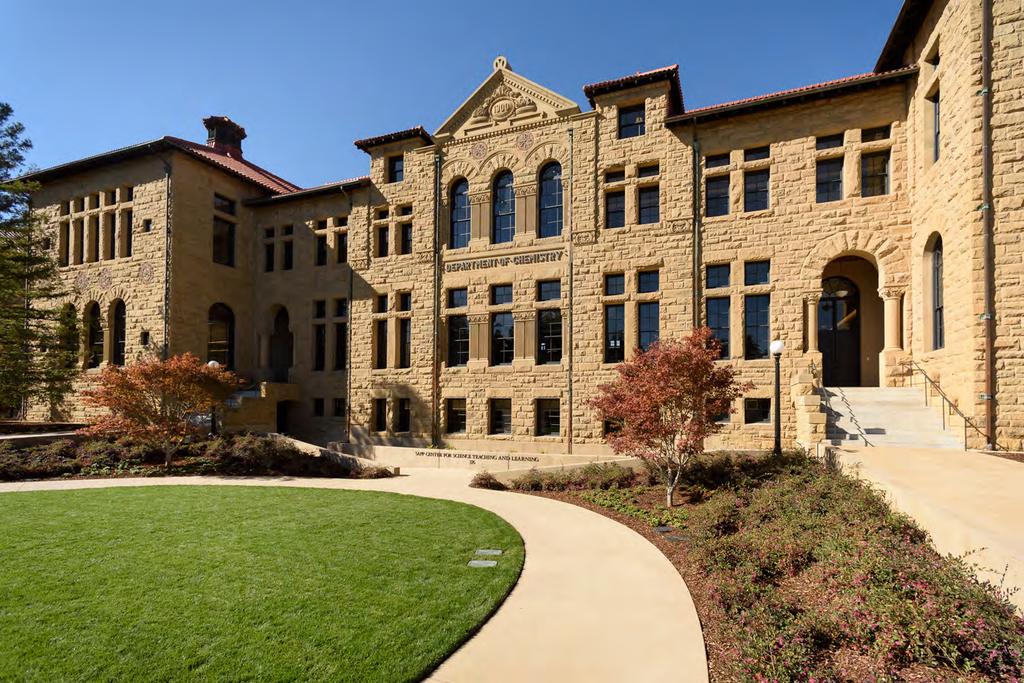
2 Sapp Center for Science Teaching and Learning Stanford s long empty historic Old Chemistry building reopened in the fall of 2016 as the Sapp Center for Science Teaching and Learning. As a center for undergraduate education and anchor for the future Biology Chemistry quad, the renovated building serves as a multidisciplinary instruction space for chemistry, biology, art and economics, among other subjects. Stanford estimates that around 4,000 students make use of the Sapp Center s facilities. Photograph: Linda A. Cicero / Stanford News Service
3 STANFORD UNIVERSITY ANNUAL FINANCIAL REPORT MANAGEMENT S DISCUSSION AND ANALYSIS... 1 SELECTED FINANCIAL AND OTHER DATA MANAGEMENT RESPONSIBILITY FOR FINANCIAL STATEMENTS CONSOLIDATED FINANCIAL STATEMENTS REPORT OF INDEPENDENT AUDITORS CONSOLIDATED STATEMENTS OF FINANCIAL POSITION CONSOLIDATED STATEMENTS OF ACTIVITIES CONSOLIDATED STATEMENTS OF CASH FLOWS NOTES TO THE CONSOLIDATED FINANCIAL STATEMENTS BASIS OF PRESENTATION AND SIGNIFICANT ACCOUNTING POLICIES 2. ACCOUNTS RECEIVABLE 3. HEALTH CARE SERVICES REVENUE 4. PLEDGES RECEIVABLE 5. LOANS RECEIVABLE 6. INVESTMENTS 7. INVESTMENT POOLS 8. DERIVATIVES 9. PLANT FACILITIES 10. LIABILITIES ASSOCIATED WITH INVESTMENTS 11. NOTES AND BONDS PAYABLE 12. ENDOWMENTS 13. GIFTS AND PLEDGES 14. FUNCTIONAL EXPENSES 15. UNIVERSITY RETIREMENT PLANS 16. SHC AND LPCH RETIREMENT PLANS 17. OPERATING LEASES 18. RELATED PARTY TRANSACTIONS 19. COMMITMENTS AND CONTINGENCIES 20. SUBSEQUENT EVENTS 21. CONSOLIDATING ENTITY STATEMENTS
4 MANAGEMENT S DISCUSSION AND ANALYSIS CONSOLIDATED FINANCIAL HIGHLIGHTS Stanford s FY17 financial results reflect the consolidated financial position and results of the University, Stanford Health Care (SHC) and Lucile Salter Packard Children s Hospital at Stanford (LPCH), including their respective controlled affiliates. Operating revenues exceeded expenses by $448 million, compared to $490 million in FY16. Net assets increased $3.6 billion to end the year at $40.6 billion. Stanford achieved these positive results through the generosity of its donors, solid investment performance and continued growth in health care services. Generous Donor Support The University s Office of Development reported $1.1 billion in gifts benefiting the University, SHC and LPCH. This amount, which includes $33 million and $77 million in support of SHC and LPCH, respectively, represents contributions from more than 75,000 donors. These results reflect our donors ongoing commitment to Stanford s mission. The generosity of Stanford s donors is integral to advancing the University s mission. Many of these gifts are restricted by donors for specific programs and purposes. Our donors make it possible to provide financial aid to our undergraduate and graduate students, steadily improve the quality and breadth of our academic programs, and update and expand the physical infrastructure of the University, SHC and LPCH. Investment Performance Total consolidated investments at August 31, 2017 were $35.8 billion, compared to $31.3 billion at August 31, Consolidated investment returns in FY17 were $3.9 billion, resulting from investment returns in both the Merged Pool (MP), which is the University s primary investment vehicle, and income-generating properties on Stanford s lands. Health Care Services Stanford Medicine, comprising Stanford s School of Medicine (SOM), SHC and LPCH, continues to focus on precision health, personalized health care that empowers people to lead healthy lives. Consolidated health care services represented approximately 54% of consolidated revenues in FY17, which have grown at a five-year compound annual rate of approximately 12%. See further discussion in the sections for Stanford Health Care and Lucile Salter Packard Children s Hospital at Stanford. The sections below provide additional details about the University s, SHC s and LPCH s financial position, financial results and operations. 1

5 UNIVERSITY FY17 net assets increased 9% to $34.7 billion compared to $31.7 billion in the prior year. The University s endowment grew by $2.4 billion after distributing $1.2 billion to support operations. The endowment ended the year at $24.8 billion. UNIVERSITY OPERATING RESULTS The Statements of Activities include results from both operating and non-operating activities. Operating activities include the revenues earned and expenses incurred in the current year to support the University s core activities of teaching and research, and the SOM s patient care. The University ended the year with a surplus from operating activities of $227 million, compared to a FY16 surplus of $303 million. In FY17, operating expenses increased $463 million or 9%, outpacing the operating revenue increase of $387 million or 7%. FY17 operating margin was unfavorably impacted by lower royalty revenues resulting from the expiration of a significant patent, lower payout from expendable funds (see the Total Investment Income Distributed for Operations section), and higher interest expense from the FY16 and FY17 bond issuances. Non-operating activities are discussed in the University Financial Position section of this analysis. UNIVERSITY OPERATING REVENUES FY17 operating revenues of $5.6 billion were derived from diverse sources, as shown in Figure 1. FIGURE 1 UNIVERSITY OPERATING REVENUES Net assets released from restrictions 3% Current year gifts in support of operations 6% Health care services 18% Investment income distributed for operations 23% Student income 11% Sponsored research support 29% Special program fees and other income 9% 2
6 Student Income Total student income, which represents 11% of University operating revenues, increased 5% to $618 million in FY17. Total student income includes tuition and fees from undergraduate and graduate programs and room and board, offset by financial aid in the form of scholarship and fellowship grants that cover a portion of tuition, living and other costs. ($ in millions) FIGURE 2 UNIVERSITY STUDENT INCOME AND FINANCIAL AID $1,000 $800 $600 $400 $200 $0 FY13 FY14 FY15 FY16 FY17 Student income, net Student financial aid Student Tuition Tuition revenue supports many of the University's core academic programs and administrative functions, including portions of the undergraduate financial aid program, faculty and staff salaries, Stanford s two dozen libraries, and student services. Revenues from student tuition and fees before the deduction for student financial aid increased by $35 million in FY17 primarily as a result of undergraduate and graduate tuition rate increases of 3.5% and higher graduate enrollments. Student Room and Board Revenues from room and board increased 7% in FY17 due to an increase in room and board rates of 3.5%, an increase in housing from the opening of the Meier and Norcliffe Halls at Lagunita Court for undergraduates and Highland Hall for graduate students, and from Stanford s off-campus graduate housing program. The University continues to increase its capacity to house more students on campus. See the Capital Projects section. Student Financial Aid and Other Graduate Support One of the University s highest priorities is to remain affordable and accessible to all admitted students, regardless of their financial circumstances. The University s admission process for undergraduate students from the United States is need-blind, which means that students are admitted irrespective of their ability to pay. 3
7 Since 2000, the University has continued to enhance its financial aid programs for both its undergraduate and graduate students. Currently, families of undergraduate students from the U.S. with incomes below $125,000 and assets typical of that income level are not expected to pay tuition. Those with incomes below $65,000 and typical assets receive enough scholarship funds to cover tuition, room and board, and other expenses. In FY17, approximately 46% of undergraduates were awarded need-based financial aid from Stanford. Graduate student financial aid and other support is awarded based on academic merit and the availability of financial aid. In the face of diminishing federal support, Stanford has increased its support for graduate students. In FY17, approximately 78% of graduate students received some form of financial support from Stanford. The University provides financial assistance to students in the form of scholarships, fellowships, and stipends, as well as teaching and research assistantships. Total student financial aid and other graduate support for FY17 and FY16 is as follows: ($ in millions) FY17 FY16 Student Financial Aid Undergraduate $ 174 $ 163 Graduate Total Student Financial Aid Other Graduate Support Stipends Assistantships (research and teaching) Allowance for tuition (for assistantship recipients) Total Other Graduate Support Total Student Financial Aid and Other Graduate Support $ 586 $ 552 FY17 undergraduate aid and graduate fellowships of $287 million represent an increase of 6% over the prior year and are included in Student Financial Aid, offsetting Student Income in the Consolidated Statements of Activities. For FY17, the University also provided other graduate student support in the form of stipends of $102 million, and teaching and research assistantships and related allowances for tuition of $197 million. During FY17, sources of the total $586 million of student financial aid and graduate support included approximately $212 million in payout from restricted endowment funds, $216 million from unrestricted University funds (including unrestricted endowment funds) and approximately $158 million from grants and contracts. 4

8 Sponsored Research Support FY17 sponsored research support increased $183 million or 13% to $1.6 billion. This represents 29% of the University s operating revenues, and is the largest source of operating revenue for the University. Sponsored research support for SLAC National Accelerator Laboratory (SLAC) was $585 million in FY17, which included $301 million for ongoing support of research operations and $284 million of capital expenditures for construction of new facilities and instruments. Excluding SLAC capital expenditures from both FY17 and FY16, sponsored research support increased by 5%. The U.S. Department of Energy (DOE) provided substantially all of the sponsored research support for SLAC. FY17 included $232 million for the Linac Coherent Light Source (LCLS) II project expected to be completed in LCLS II is a major upgrade to increase the power and capacity of LCLS, the revolutionary X-ray free-electron laser that first became operational in October ($ in millions) $2,000 $1,600 FIGURE 3 UNIVERSITY SPONSORED RESEARCH SUPPORT $1,200 $800 $400 $0 FY13 FY14 FY15 FY16 FY17 DHHS DOE Other Federal Non federal Approximately 81% of the University s sponsored research support (including support for SLAC) is received directly or indirectly from the federal government (See Figure 3). The Department of Health and Human Services (DHHS) provided support of $496 million in FY17 compared to $468 million in the prior year, primarily through the National Institutes of Health. Most of these funds support research within the University s SOM. In addition to payment for the direct costs of performing research, the University receives an amount from sponsors for facilities and administrative costs, known as indirect costs. Recovery of facility and administrative costs associated with federally sponsored awards is recorded at rates negotiated with the University s cognizant federal agency, the Office of Naval Research. For FY17, the amount of federal and non-federal indirect cost recovery increased by 5% to $265 million. 5
9 Health Care Services FY17 health care services revenue represented 18% of University operating revenues, increasing $117 million (13%) to $1.0 billion. This increase primarily reflects increased services at higher rates performed by the University s physicians for SHC and LPCH. SOM faculty serve as physicians for the Hospitals. Clinical services are billed and collected by the Hospitals, and a portion is remitted to the University as payment for these physician services. In addition, the Hospitals pay the University for other essential services such as medical direction and various infrastructure and administrative services. Health care services revenues of $986 million represent the net value of services provided between the University and the Hospitals; these amounts are eliminated in consolidation. The remaining $37 million in health care services revenue is for services provided to other health care systems, primarily the Veterans Affairs Palo Alto Health Care System and Santa Clara Valley Medical Center. The results of operations and financial position for SHC and LPCH are discussed in more detail in the Stanford Health Care and Lucile Salter Packard Children s Hospital at Stanford sections. Current Year Gifts in Support of Operations Current year gifts in support of operations increased nearly 30% to $325 million in FY17. See The University s Gifts and Pledges section below for more information. Net Assets Released from Restrictions Net assets released from restrictions, which consisted primarily of pledge payments and gifts released from donor restrictions, increased slightly compared to the prior year. 6
10 THE UNIVERSITY S GIFTS AND PLEDGES Donations from the University's donors are a key source of funding for the University's current operations as well as capital projects and new endowments. The majority of the University s gifts and pledges are restricted by donors for specific purposes. The University has both legal and fiduciary obligations to use the funds according to the donor s restrictions, which guide how they are reported in the financial statements. In FY17, current year gifts in support of operations were $325 million, and were recorded in the operating section of the Statement of Activities. In addition, gifts and pledges of $592 million were recorded in the non-operating section of the Statements of Activities, bringing the FY17 total University gifts and pledges recorded in the University s financial statements to $917 million. The University's Office of Development (OOD) fundraising results include certain gifts that are not recognized as contributions in the University's financial statements. Grants from foundations and corporations are reflected as sponsored research support revenue rather than gifts and pledges. Donations of art collections are not recorded on the University's financial statements. In addition, the University's Statement of Activities recognizes pledges as revenue when the pledges are made by donors, while OOD includes them in the fundraising results when the pledge payments are received. In FY17, OOD reported gifts benefiting the University, SHC and LPCH of $1.1 billion. Figure 4 reflects the gifts and pledges in the Statement of Activities as well as the fundraising results reported by OOD. ($ in millions) $1,800 FIGURE 4 GIFTS AND PLEDGES: STATEMENTS OF ACTIVITIES AND FUNDRAISING RESULTS $1,350 $1.3B $900 $695M $786M $761M $917M $450 $0 FY13 FY14 FY15* FY16 FY17 Permanently restricted Temporarily restricted Unrestricted Fundraising results reported by OOD *FY15 amount reported by OOD includes $626 million in works of art and special collections 7
11 Total Investment Income Distributed for Operations The University distributes investment income for use in operations according to policies approved by the Board of Trustees (Board). Total investment income distributed for operations was $1.3 billion in FY17, with endowment payout of $1.2 billion and the remainder from the Expendable Funds Pool (EFP) and other sources. This revenue source represented 23% of University operating revenues in FY17, the University s second highest source of operating revenues. Through the combination of investment strategy and payout policy, the University strives to provide a reasonably consistent payout from endowment to support operations, while preserving the purchasing power of the endowment adjusted for inflation so that the endowment can continue to support the University in perpetuity. Endowment Income Distributed for Operations Endowment income distributed for operations (also referred to as endowment payout) increased 3% to $1.2 billion in FY17. This includes payout from the University s MP based on a Board approved formula, and income received from endowment real estate and other investments not included in the MP. As shown in Figure 5, annual payout to operations from the endowment continues to be a significant source of operating revenue for the University, covering approximately 22% of operating expenses in FY17. As shown in Figure 6, 77% of the endowment payout is restricted as to purpose, and provided funding for instruction and research activities (28%), student aid (23%), faculty salaries and support (20%), and libraries (2%). Unrestricted endowment payout is used to support these same activities and other critical strategic priorities. FIGURE 5 FIGURE 6 UNIVERSITY ENDOWMENT PAYOUT UNIVERSITY ENDOWMENT PAYOUT BY PURPOSE ($ in millions) Other $1,200 $1.1B $1.2B 4% $921M $985M $1.1B $800 Student aid 23% Unrestricted 23% $400 $0 FY13 FY14 FY15 FY16 FY17 Libraries 2% Instruction and research 28% Faculty related 20% Endowment payout Expendable Funds Pool and Other Investment Income Distributed for Operations EFP and other investment income distributed for operations was $143 million in FY17, compared to $190 million in FY16. This category primarily includes the payout to operations from the EFP and Endowment Income Funds Pool (EIFP), the principal investment vehicles for the University s expendable funds. See Note 7 to the FY17 Consolidated Financial Statements. The EFP policy provides a variable payout to operations based on the prior year s investment returns. Payout on the EFP in FY17 was $65 million less than the prior year due primarily to weak investment returns in FY16. EFP payout should return to normal levels in FY18 based on stronger FY17 investment returns. 8

12 The EIFP holds previously distributed but unspent endowment payout. These amounts are held, for instance, until there is adequate funding to support a program, scholarship or professorship. These amounts are invested in highly liquid instruments in order to preserve the principal balance. Earnings on these investments are fully distributed to the University fund holders. See the University Investment Pools and Liquidity Management section. UNIVERSITY OPERATING EXPENSES Total expenses increased $463 million, or 9%, to $5.4 billion in FY17. As shown in Figure 7, salaries and benefits comprised 61% of the University s total expenses; depreciation expense was 7% and other operating expenses represented 32%. FIGURE 7 UNIVERSITY OPERATING EXPENSES Other operating expenses 32% Salaries and benefits 61% Depreciation 7% Salaries and benefits increased 7% in FY17 to $3.3 billion. The increase resulted from a combination of factors including additional headcount growth of almost 3% to support new programs and sponsored research activities, particularly within the SOM, salary programs designed to maintain Stanford s competitive position, and higher benefit costs. Depreciation expense increased by 5% to $365 million in FY17 from $346 million in FY16. The increase resulted from buildings recently placed in service as described in the Capital Projects section below. Other operating expenses increased by 16% to $1.7 billion in FY17. The increase resulted primarily from expenses for sponsored research support at both the University and SLAC, and interest expense resulting from the FY16 and FY17 bond issuances. Excluding SLAC construction expenditures and interest on these bond issuances, other operating expenses would have increased by 7%. 9
13 UNIVERSITY FINANCIAL POSITION Total University assets increased $4.2 billion in FY17 to end the year at $42.0 billion. Total University liabilities increased $1.2 billion to $7.3 billion, and net assets increased $3.0 billion to $34.7 billion. THE UNIVERSITY S INVESTMENT POOLS AND LIQUIDITY MANAGEMENT The University s investments are held in various investment pools or in specific investments with varying levels of liquidity. The University closely monitors liquidity required to meet its operating needs and contractual commitments. The University continues to refine its investment strategy to better manage its near-term liquidity needs and longer term investment objectives. The majority of Stanford s cash and other highly liquid investments are accumulated and managed in a short-term investment pool (STIP). The primary objective of this pool is to preserve the principal value of the portfolio while meeting the liquidity needs of the University. The Merged Pool (MP) is the primary investment pool in which endowment and other long-term funds are invested. The MP maintains sufficient liquidity to distribute the annual endowment payout that supports expenditures, and to meet call obligations associated with limited partnership investments. The EFP and EIFP are the principal investment vehicles for the University s expendable funds. A substantial portion of the EFP is cross-invested in the MP with the remainder being invested in the STIP. The entire balance of the EIFP is invested in the STIP. In FY17, the University created the Intermediate Pool (IPool). The IPool was established to invest funds with the objective of achieving greater liquidity than the MP and higher returns than the STIP. To meet short-term operating needs, cash is managed by matching the timing of cash inflows and outflows as closely as possible. Back-up borrowing facilities of $500 million are available when needed. Cash and Cash Equivalents At August 31, 2017, the University s cash and cash equivalents (as defined in Note 1 to the FY17 Consolidated Financial Statements) decreased by $380 million to $260 million. This decrease was primarily due to the use of bond proceeds on capital projects, and EFP and EIFP funds invested in cash vehicles with original maturities over 90 days, which are categorized as investments in the Consolidated Statements of Financial Position. At August 31, 2017, there was $1.3 billion in cash and short-term investments in the University s investments providing liquidity primarily for payout and MP needs. See Notes 6 and 7 to the FY17 Consolidated Financial Statements. Assets Limited as to Use Assets limited as to use consist primarily of proceeds of tax-exempt bonds issued for the benefit of the University and limited by the terms of indentures to use for qualified capital projects. This amount decreased by $122 million to $194 million as the proceeds from tax-exempt bonds were spent on the University s eligible capital projects during the year. 10
 $35 $30 $25 $20 $15 $10 $5 $0 FY13 FY14 FY15 FY16 FY17 Other Public equities Private equities Absolute return Real estate There are")
14 Investments University investments at August 31, 2017 were $33.3 billion. Investments by asset class are shown in Figure 8. FIGURE 8 UNIVERSITY INVESTMENTS BY ASSET CLASS ($ in billions) $35 $30 $25 $20 $15 $10 $5 $0 FY13 FY14 FY15 FY16 FY17 Other Public equities Private equities Absolute return Real estate There are three primary categories of investments as shown in Figure 9: the MP, real estate investments on endowed lands, and other specific investments. Real estate on endowed lands (not included in the Merged Pool) $4.5B FIGURE 9 UNIVERSITY INVESTMENTS BY CATEGORY Other specific investments $3.2B Merged Pool $25.5B (includes real estate on endowed lands of $781M) Investments in MP $25.5 billion of the University s investments was held in the MP at August 31, The majority of the University s endowment assets are invested in the MP, as well as a majority of the EFP and capital reserves from SHC and LPCH. The MP is a diversified portfolio of actively managed public and private equity, absolute return, natural resources and real estate assets. The MP is managed by the Stanford Management Company (SMC), a division of the University with oversight by a Board of Directors appointed by the University Board of Trustees. The portfolio is designed to optimize long-term returns, create consistent annual payouts to support the University s operations and preserve purchasing power for future generations of Stanford students and scholars. 11
15 Real Estate on Endowed Lands A portion of Stanford s 8,180 acres of endowed lands, including the Stanford Research Park, is designated for the production of income by the Board of Trustees. As of August 31, 2017, $5.3 billion of real estate investments (including $781 million in the MP) are located on these lands. In FY17, these properties (including MP real estate) generated $131 million in income, net of expenses, and appreciated in value by $404 million. These lands have been developed for various uses, including research, medical and commercial offices, hotels, retail properties and a regional shopping center. The University further diversifies this portfolio by employing a variety of financial structures, including ground leases, direct leases and participation arrangements. In recent years, the value of these properties have benefited from strong dynamics in the regional market including rising investor demand for real estate; high office, hotel and apartment occupancy rates; increased office rents; and strong retail sales. Other Specific Investments The remaining $3.2 billion of investments includes a portion of the EFP, the EIFP, IPool and STIP, and other specific investments. Capital Projects The University continues to make significant investments in its physical facilities, driven by the academic priorities for teaching, research, and related activities, and the initiatives of the administrative and auxiliary units that support the academic mission. During FY17, the University invested $814 million in capital projects, bringing gross plant facilities (before accumulated depreciation) to $10.1 billion. Plant facilities, net of accumulated depreciation, increased $455 million to $5.6 billion, as shown in Figure 10. ($ in millions) FIGURE 10 Plant Facilities and Accumulated Depreciation $12,000 $8,000 $4,000 $0 FY13 FY14 FY15 FY16 FY17 Plant facilities, net Accumulated depreciation The University completed several significant projects in FY17, as it continues to invest in its academic infrastructure to facilitate teaching and research. The Sapp Center for Science Teaching and Learning opened in the historic Old Chem building. As a center for undergraduate education and anchor for the future Biology Chemistry Quad, the Sapp Center will launch a new era for interdisciplinary science education and research at Stanford by encouraging collaboration across various disciplines. The Roble Field Parking Structure opened, providing 1,162 parking spaces under the Roble Recreation Field. Lastly, Kingscote Gardens was constructed in 1917, and its renovation was completed in time to celebrate its 100 th birthday. In addition, the David and Joan Traitel Building at the Hoover Institution (opened in September 2017), provides added capacity in both office and conferencing facilities to meet its demand for public policy research and education. 12
16 Construction continued on almost 200 projects, including the following projects with budgets greater than $100 million. The Anne T. and Robert M. Bass Biology Research Building is a new laboratory research facility designed to support the University s biochemistry and computational research initiative. The new Stanford ChEM-H (Chemistry, Engineering and Medicine for Human Health) and the Stanford Neurosciences Institute complex will house an emerging interdisciplinary research institute and is designed to bring faculty from many disciplines together to stimulate novel interactions. The Center for Academic Medicine 1 (CAM 1) will consolidate office space for clinical faculty, computational researchers, departmental administration and leadership. The BioMedical Innovations Building 1 will replace aging structures and house a synergistic mix of disciplines, research labs and leading edge translational studies. Stanford in Redwood City phase 1 s off-site administrative campus is underway and is expected to be completed with occupancy in Approximately 2,700 staff will relocate to this site in order to preserve core campus space for the University s highest academic priorities. Approximately half of the University s FY17 capital expenditures were focused on student, faculty and staff housing to address the acute shortage of affordable housing in the region. The Escondido Village Graduate Residences (EV) project, currently under construction, will address the critical need for additional graduate student housing on campus. With occupancy targeted for fall 2020, EV is expected to have 2,431 new graduate beds, resulting in an overall gain of 2,020 net new beds and raising the percentage of graduate students housed to approximately 75% from just over 50% today. Stanford s Housing Acquisition Initiative is expanding the University s supply of faculty and staff housing by acquiring land or residential units proximate to, or within easy transit of, campus. During FY17, the Colonnade apartment community in Los Altos was purchased under this initiative and provides 167 rental apartments near the campus. Debt The University s debt policy governs the amount and type of debt Stanford may incur and is designed to preserve debt capacity, financial flexibility and access to capital markets at competitive rates. A combination of fixed and variable rate debt of varying maturities is used to fund academic facilities, residential housing and dining facilities, real estate investment projects, faculty and staff mortgage loans and other infrastructure projects. The University is not an obligor or guarantor with respect to any debt obligations of SHC or LPCH, nor are SHC or LPCH obligors or guarantors with respect to any debt obligations of the University, or each other. During FY17, the University issued $750 million in taxable debt to finance various facilities and infrastructure and to achieve long-term savings in interest costs. The debt was issued with a yield to maturity of 3.65% and matures in In addition, the University has $500 million of unsecured revolving credit facilities, of which $33 million has been drawn down as of August 31, Total debt increased $684 million to $4.0 billion as of August 31, During FY17, Standard and Poor s, Moody s and Fitch affirmed the University s debt ratings in the highest rating categories for short and longterm debt. Net Assets The University s net assets are classified as unrestricted, temporarily restricted or permanently restricted. See Note 1 to the FY17 Consolidated Financial Statements. As previously noted, FY17 net assets increased 9% to $34.7 billion compared to $31.7 billion in the prior year. The increase of $3.0 billion resulted from investment gains of $2.2 billion, non-operating gifts and pledges, net of $592 million (including donoradvised gifts, net) and operating income of $227 million. 13
17 THE UNIVERSITY S ENDOWMENT The University s endowment is a collection of gift funds and reserves invested to generate income to support the University s teaching and research missions, while preserving the purchasing power of the endowment, after inflation, for future generations of students and scholars. Many of these funds are designated by donors for specific purposes. Endowment funds are designed to support programs in perpetuity, including scholarships, fellowships, professorships or other academic initiatives. The University s endowment is crucial to providing funding for education and research programs, including increasing the amount spent on student financial aid. As discussed in the Student Financial Aid and Other Graduate Support section, a significant portion of the $586 million of student financial aid and graduate support comes from endowment payout. At August 31, 2017, the endowment totaled $24.8 billion (See Figure 11) and represented approximately 71% of the University s net assets. The endowment, which includes the University s endowed lands, is comprised of pure endowment funds, term endowment funds and funds functioning as endowment. Approximately 15% of the University s endowment is invested in real estate on Stanford s lands, including the Stanford Research Park. Through a combination of investment strategy and payout policy, the University strives to provide a reasonably consistent payout from endowment to support operations, while preserving the purchasing power of the endowment, adjusted for cost inflation, so that the endowment can continue to support the University in perpetuity. The endowment payout as a percentage of the beginning endowment value was 5.2% for FY17 and 5.1% for FY16. The Board is responsible for determining endowment payout with the aim of balancing current and future needs of the University. For the majority of endowment invested in the MP, the target payout rate is 5.5%. The actual payout amount is determined by applying a smoothing rule designed to mitigate the impact of short-term market volatility. In situations when the payout rate reaches 6% or drops below 4%, the Board has the authority to override the smoothing rule and set the payout rate directly. For endowment represented by real estate on Stanford endowed lands, all of the net lease income is paid out to operations each year. The University s endowment provides funding annually for a wide variety of important purposes. See the Total Investment Income Distributed for Operations section for more information. ($ in billions) $30 $25 $20 $15 $10 $5 $0 FIGURE 11 UNIVERSITY ENDOWMENT 14
18 HOSPITALS The financial results and financial position of Stanford Health Care (SHC) and Lucile Salter Packard Children s Hospital at Stanford (LPCH) and their controlled affiliates are included in the FY17 Consolidated Financial Statements. In FY11, SHC and LPCH received local government approval to rebuild and expand their principal facilities. Construction is projected to be completed in 2017 for LPCH and 2019 for SHC. These improvements will assure that SHC and LPCH have additional inpatient capacity in modern, technologically-advanced and patient-centered facilities, and meet state-mandated earthquake safety standards. The total estimated cost, inclusive of contingencies, is approximately $2.1 billion for SHC and exceeds $1.2 billion for LPCH. Management of each hospital believes that sources of funding are adequate to cover remaining costs. To improve and expand their services, the Hospitals have established community-based ambulatory clinic organizations SHC s University HealthCare Alliance (UHA) and LPCH s Packard Children s Health Alliance (PCHA) that support Stanford Medicine s mission to deliver quality care to the community and conduct research and education. Working collaboratively with their respective hospitals and the SOM faculty, these organizations have acquired multi-specialty practices to form a network of coordinated care throughout the Bay Area. SHC and LPCH continue to participate in the California Hospital Quality Assurance Fee (QAF) Program and the Hospital Fee Program. These programs are designed to provide supplemental payments to certain hospitals and support the State s effort to maintain health care coverage for children. The discussion below provides additional detail about SHC s and LPCH s consolidated operations and financial results as derived from their separate consolidated financial statements. 15

19 STANFORD HEALTH CARE Stanford Health Care ( SHC ) experienced positive financial results in FY17. SHC s results benefited from its operating performance and fundraising. The financial results reflect the consolidation of SHC and its subsidiaries. SHC FINANCIAL HIGHLIGHTS Net assets increased $450 million to end the year at $3.5 billion. Operating revenues exceeded operating expenses by $234 million, or 5%, compared to $148 million in FY16. As shown in Figure 12, the change in net assets from operating activities ( operating margin ) increased compared to prior years, primarily due to cost management initiatives. ($ in millions) FIGURE 12 SHC OPERATING MARGIN $300 $250 $200 $150 $100 $50 $0 FY13 FY14 FY15 FY16 FY17 SHC OPERATING RESULTS SHC s Consolidated Statements of Operations and Changes in Net Assets include results from both operating and non-operating changes in the net assets of SHC. Operating activities include the revenues earned and expenses incurred in the current year to support patient care. FY17 operating revenues increased 9% compared to an increase in operating expenses of 7% during the same period. Revenues grew more than expenses mainly due to renewed focus to grow strategically, such as the March 2017 opening of SHC Emeryville (see the Capital Projects section), while implementing cost reduction initiatives. In addition, SHC continues to market its two health plans: SHC Advantage, a Medicare health plan offered to Santa Clara County residents, and increased membership in SHC Alliance, a benefit plan that allows University employees, SHC employees and other employers access to the Stanford network of care. Other changes in net assets are discussed in the SHC Financial Position section of this analysis. SHC OPERATING REVENUES FY17 operating revenues were $4.5 billion, a 9% increase over FY16. Health Care Services Revenue FY17 health care services revenue (including capitation/premium revenue) less doubtful accounts increased $350 million, or 9%, from FY16 to $4.3 billion and represented 97% of operating revenues. 16
20 Patient care revenue consists of revenue from patient and third-party payers and comprises nearly all of SHC s health care services revenue. Patient care revenue by major payer, net of contractual allowances (but before provision for doubtful accounts), is shown in Figure 13. FIGURE 13 SHC PATIENT CARE REVENUE Other support 1% Self pay and other 5% Medicare 20% Medi-Cal 2% Managed care - discounted fee for service 72% Inpatient and outpatient, which represented 42% and 58% of net patient revenues (including capitation / premium revenue), respectively, grew significantly due to strong volume growth in multiple areas, such as operating rooms, emergency department, pharmacy, cath angio, imaging, clinical labs and other ambulatory care services. Other Operating Revenues Other operating revenues, which include revenues from various related entities and outreach clinical activities, increased 5% to $129 million. Net Assets Released from Restrictions Net assets released from restrictions for use in operations was $9.9 million in FY17 compared to $9.4 million in FY16. 17
21 SHC OPERATING EXPENSES Total expenses increased $271 million, or 7%, to $4.2 billion in FY17, primarily due to higher salaries and benefits, physician services, and supplies required to provide high quality patient care. FIGURE 14 SHC OPERATING EXPENSES Depreciation 4% Other operating expenses 49% Salaries and benefits 47% As shown in Figure 14, salaries and benefits comprised 47% of SHC s total expenses, depreciation expense was 4%, and all other operating expenses represented 49%. Salaries and benefits increased 7% in FY17 to $2.0 billion (inclusive of UHA and network growth). The increase resulted from expanded headcount to support current growth in patient volumes and future expansion (see the Capital Projects section below). The remaining increase was due to annual salary increases necessary to maintain SHC s position in the competitive market for healthcare professionals and higher benefit costs. Depreciation expense increased by 13% to $155 million in FY17 from $136 million in FY16. The increase resulted from buildings and equipment recently placed in service, such as the SHC Emeryville, and a full year of service for the Stanford Neuroscience Health Center. Other operating expenses increased by 6% to $2.1 billion for FY17. The majority of this increase is purchased services related to payments to the University under a revised inter-entity agreement with the SOM to provide high quality patient care, support renewed focus on the clinical enterprise, and create a more cohesive and coordinated strategic plan. In addition, supplies expense increased by 10% to $586 million in response to patient volume growth and inflation. SHC FINANCIAL POSITION SHC s Consolidated Statements of Financial Position reflect strong operating results and positive investment returns. Total SHC assets increased $472 million in FY17 to end the year at $6.2 billion. Total SHC liabilities remained the same as FY16 at $2.7 billion. Unrestricted Cash and Investments Unrestricted cash and investments increased to $2.3 billion in FY17 from $2.1 billion at the end of FY16. 18
22 Capital Projects SHC continues to invest in facilities and systems required to remain at the forefront of medicine and to be the provider of choice for complex and network care in the communities it serves. During FY17, SHC invested $636 million in capital projects, bringing property and equipment, net of accumulated depreciation, to $2.9 billion, a $467 million increase from FY16. The majority of the FY17 spending was for the New Stanford Hospital (to meet State-mandated earthquake safety standards, and provide modern, technologically-advanced hospital facilities), expansion of healthcare services in Redwood City, and SHC - Emeryville (state-of-the-art building that brings access to Stanford Medicine primary care, specialty care, diagnostics, and procedures to a convenient East Bay location). Debt Total debt, including the current portion, was $1.6 billion as of August 31, A combination of fixed and variable rate debt of varying maturities is used to fund SHC s mission. Taxexempt bonds with fixed interest rates account for 65% of the total, while the remaining 35% consists of tax-exempt bonds and a revolving credit facility with variable rates. At August 31, 2017, there was $135 million outstanding on the revolver. This was paid down in September Swap agreements (included in other long-term liabilities) had a fair market value of $246 million at the end of FY17. The swap liability decreased by $85 million in FY17 mainly due to the rise in interest rates. In September and October 2016, Standard & Poor s, Moody s Investors Service and Fitch Ratings affirmed their previous long-term ratings at AA-/Aa3/AA, respectively. Net Assets SHC s net assets are classified as unrestricted, temporarily restricted or permanently restricted. See Note 1 to the Consolidated Financial Statements. FY17 net assets increased $450 million to $3.5 billion. SHC s operating surplus of $234 million, an increase of $166 million on investments (majority from the University MP), and an increase of $85 million on swap valuations, was partially offset by net transfers to the University of $69 million, of which the majority was funding for the Center for Academic Medicine 1 (CAM 1) building and parking structure (part of renewed efforts on clinical enterprise), and academic grants. Temporarily restricted net assets increased by $26 million to $603 million in large part due to fundraising commitments for the New Stanford Hospital, while permanently restricted net assets increased modestly by $250 thousand from contributions. 19
 effective September 1, 2016. See Note 1 to the University s Consolidated Financial Statements.")
23 LUCILE SALTER PACKARD CHILDREN S HOSPITAL AT STANFORD The financial results reflect the consolidation of LPCH and its subsidiaries. LPCH became the sole member in Lucile Packard Foundation for Children s Health (LPFCH) effective September 1, See Note 1 to the University s Consolidated Financial Statements. LPCH FINANCIAL HIGHLIGHTS Net assets at August 31, 2017 were $2.4 billion, reflecting an increase of $227 million over FY16. However, operating revenues were lower than operating expenses by $13 million in FY17, compared to a positive operating margin of $39 million in FY16. In the first half of FY17, volumes were down and LPCH served a higher population of patients supported by Medi-Cal contracts. In addition, FY17 operating results experienced pressure due to an increase of 10% in operating expenses over FY16 primarily related to higher personnel costs, physician payments to the University s SOM and non-capitalizable costs related to bringing the Renewal Project live. In the second half of the year, benefitting from program growth and outreach, volumes were stronger and patients supported by Medi-Cal contracts were back to a more normalized range. Additionally, a direct focus on cost containment helped to reduce costs during that period. Figure 15 shows the change in net assets from operating activities, or operating margin, over the past five years. ($ in millions) FIGURE 15 LPCH OPERATING MARGIN $160 $140 $120 $100 $80 $60 $40 $20 $0 $(20) FY13 FY14 FY15 FY16 FY17 20

24 LPCH OPERATING RESULTS The loss from operations was $13 million in FY17, as compared to income from operations of $39 million in FY16. LPCH OPERATING REVENUES FY17 operating revenues increased $85 million, or 6%, compared to the prior year. Patient Care Revenue Patient care revenue increased $71 million from the prior year, mainly due to increases in outpatient visits and commercial managed care contract rates. This increase was partially offset by a decrease in the California Hospital Quality Assurance Fee (QAF) Program and Hospital Fee program revenues from $52 million in FY16 to $41 million in FY17. These programs are designed to provide supplemental payments to certain hospitals and support the State s effort to maintain health care coverage for children. Patient care revenue by major payer, net of contractual allowances (but before provision for doubtful accounts), is shown in Figure 16. FIGURE 16 LPCH PATIENT CARE REVENUE Self Pay and other 6% Medi-Cal 19% Medicare 1% Managed Care - Discounted Fee for Service 74% LPCH s community benefits, including services to patients under Medi-Cal and other publicly sponsored programs that reimburse at amounts less than the cost of services, were $240 million in FY17 compared with $214 million in FY16. These amounts also include investments LPCH makes in improving the health of children through a range of community-based programs. Other Operating Revenues LPCH s other operating revenues increased $13 million from the prior year, primarily due to the consolidation of the LPFCH which added $10 million in other revenues from development fees. Net Assets Released from Restrictions LPCH s net assets released from restrictions for use in operations was $24 million in both FY17 and FY16. 21
25 LPCH OPERATING EXPENSES Operating expenses increased $136 million, or 10%, compared to the prior year. This increase was mainly attributable to higher salaries and benefits as LPCH ramps up headcount in preparation for the launch of the new hospital expansion in 2017 and higher annual salary rates needed to maintain a competitive market position. In addition, LPCH experienced increases in payments to the SOM for services provided by the physician faculty (included in other operating expenses). The increases were partially offset by a decrease of $2 million in the expense recorded from the QAF and Hospital Fee programs compared to the prior year and a $1 million decrease in consulting services. FIGURE 17 LPCH OPERATING EXPENSES Depreciation 4% Other operating expenses 52% Salaries and benefits 44% As shown in Figure 17, salaries and benefits comprised 44% of LPCH s total expenses, depreciation expense was 4%, and all other operating expenses represented 52%. LPCH FINANCIAL POSITION Total assets increased by $491 million, or 16%, driven by a combination of cash generated from operations, proceeds from the 2017 Series A Bonds, acquisition of LPFCH, and continued support from the donor community. These cash flows were used to fund the ongoing construction of the new hospital expansion. As a result, fixed assets increased $301 million to $1.7 billion as of August 31, Total liabilities increased by $263 million, or 28%, primarily due to the issuance of the 2017 Series A Bonds referenced above. Unrestricted Cash and Investments Unrestricted cash and investments increased by $188 million, or 25%, mainly due to the acquisition of LPFCH, income and gains on University managed pools and other investments, and unspent proceeds of the 2017 bond issuance. Capital Projects LPCH s Statements of Financial Position reflects significant investments in the facilities and systems required to continue to provide the highest quality children s hospital services to the community it serves. The majority of the FY17 spending was for LPCH s portion of the Renewal Project, which represented $335 million of the increase in property and equipment. 22
26 Debt Total debt, including the current portion, increased by $218 million, or 33% from the prior year. In August 2017, the California Health Facilities Financing Authority issued, on behalf of LPCH, a series of revenue bonds in the aggregate par amount of $200 million. Proceeds of the bonds were used to finance a portion of the Renewal Project, and to pay for the cost of issuance. Remaining proceeds may be used to finance costs of routine capital and the acquisition of a long-term ground lease interest in land and improvements of a parcel located adjacent to the existing facility. During FY17, S&P, Fitch and Moody s assigned ratings on the new debt of A+, AA-, and A1, respectively. In addition, the ratings agencies adjusted their previous ratings on the existing debt from AA-, AA, and Aa3 to A+, AA-, and A1, respectively, with a stable outlook. Net Assets Total net assets increased by $227 million, or 10%, from August 31, 2016 to August 31, Unrestricted net assets increased by $134 million to end the year at $1.5 billion. The increase was due to income and gains from University managed pools and other investments, and the acquisition of LPFCH, partially offset by the loss from operations and funding its portion of certain projects at the SOM and SHC through equity transfers. Temporarily restricted net assets increased by $77 million to $652 million in large part due to fundraising commitments for LPCH s portion of the Renewal Project and other capital projects. Permanently restricted net assets increased from $211 million in FY16 to $227 million in FY17. The principal value of these assets must be invested in perpetuity to generate endowment income to be used only for the purposes designated by donors. LOOKING FORWARD Stanford begins FY18 with a solid financial base. Under the new leadership of President Marc Tessier- Lavigne and Provost Persis Drell, the University s interdisciplinary research and education programs continue to grow and we have reaffirmed our commitment to providing generous student financial aid. In recent years, we have updated our physical plant with an emphasis on creating collaborative spaces and sustainable facilities. The expanded LPCH hospital which opens in December 2017 and new SHC hospital, targeted to open in 2019, will provide state-of-the-art-facilities to support patient care. However, the challenges Stanford faces continue to grow, and exist on local, national and global levels. On the local front, housing remains one of our greatest challenges despite recent efforts to provide additional accommodations for faculty, staff and students. The robust Bay Area economy has placed severe pressure on housing costs and transportation. In addition, we are constrained by local building restrictions. These factors make hiring and retaining faculty and staff difficult and we continue to search for creative solutions. On the national front, uncertainty exists in a number of areas, making planning for the near and long term difficult. As this document is written, tax reform is looming, and the proposed tax changes could have significant adverse impacts on higher education institutions such as Stanford. There is continued pressure on tuition revenues and federal sponsored research. Health care reform continues to be debated, and will no doubt impact Stanford Medicine and employee benefit costs. While recent investment returns have been positive, investment markets over the past decade have been volatile and are forecast to provide moderate returns in the coming decade. Investment returns impact Stanford s ability to maintain sufficient endowment payout to support academic priorities such as student financial aid and important academic programs and initiatives. As Stanford expands its core activities beyond the United States, we continue to feel the impact of political unrest, natural disasters and changing regulations throughout the globe. Our global profile is important for 23
27 the advancement of academic programs and sound investment strategies; therefore, building the infrastructure to support these efforts and being agile to adapt to these changes has been an important priority. In the spring of 2017, Stanford embarked on a Long-Range Planning effort, inviting members of our campus and local communities and alumni to submit proposals and ideas to invigorate our education and research, to support and strengthen our community, and to engage and contribute to the world around us. We received an impressive 2,700 responses. As we begin to cull through these proposals, we are identifying themes and ideas to help move us forward thoughtfully as we continue to educate students to be global citizens and leaders, and discover and apply knowledge for the benefit of humanity. Today, more than ever, complex global issues call for Stanford to contribute to the public good and to incorporate public service more deeply into our identity and culture to be a purposeful university. We continue to explore innovative ways to stay current and address these challenges. Since its founding over 125 years ago, Stanford has weathered challenges and approached them with optimism and spirit. Encouraged by the continued generous support of our donors, alumni, faculty and staff, we will continue on this path. Randall S. Livingston Vice President for Business Affairs and Chief Financial Officer Stanford University M. Suzanne Calandra Senior Associate Vice President for Finance Stanford University Linda Hoff Chief Financial Officer Stanford Health Care Dana Haering Chief Financial Officer Lucile Salter Packard Children s Hospital at Stanford 24
28 SELECTED FINANCIAL AND OTHER DATA Fiscal Years Ended August (dollars in millions) CONSOLIDATED STATEMENT OF ACTIVITIES HIGHLIGHTS: Total operating revenues $ 10,504 $ 9,797 $ 9,051 $ 7,924 $ 7,359 Student income (A) Sponsored research support 1,636 1,453 1,387 1,266 1,233 Health care services 5,682 5,264 4,744 3,942 3,734 Investment income distributed for operations 1,327 1,338 1,292 1,181 1,019 Total operating expenses 10,056 9,307 8,351 7,389 6,794 Change in net assets from operating activities Other changes in net assets 3, ,034 3,582 2,441 Net change in total net assets $ 3,604 $ 1,437 $ 1,734 $ 4,117 $ 3,006 CONSOLIDATED STATEMENT OF FINANCIAL POSITION HIGHLIGHTS: Investments at fair value $ 35,842 $ 31,332 $ 31,399 $ 30,464 $ 26,974 Plant facilities, net of accumulated depreciation 10,223 9,000 7,797 6,832 5,995 Notes and bonds payable 6,401 5,402 5,125 5,139 4,782 Total assets 51,648 46,586 44,509 42,547 37,988 Total liabilities 11,074 9,616 8,976 8,748 8,306 Total net assets 40,574 36,970 35,533 33,799 29,682 UNIVERSITY STATEMENT OF FINANCIAL POSITION HIGHLIGHTS: Investments at fair value $ 33,297 $ 29,086 $ 28,766 $ 27,829 $ 24,703 Plant facilities, net of accumulated depreciation 5,623 5,169 4,796 4,559 4,208 Notes and bonds payable 3,954 3,271 3,085 3,265 3,098 Total assets 41,954 37,767 36,214 35,227 31,540 Total liabilities 7,263 6,048 5,780 6,006 5,817 Total net assets 34,691 31,719 30,434 29,221 25,723 OTHER FINANCIAL DATA AND METRICS: University endowment at year end $ 24,785 $ 22,398 $ 22,223 $ 21,446 $ 18,689 University endowment payout in support of operations 1,166 1,132 1, As a % of beginning of year University endowment 5.2% 5.1% 4.9% 5.3% 5.4% As a % of University total expenses 21.7% 23.0% 22.8% 24.8% 24.5% Total gifts as reported by the Office of Development (B) 1, , ,010 STUDENTS: ENROLLMENT: (C) Undergraduate 7,056 7,032 6,994 7,018 6,980 Graduate 9,368 9,304 9,196 9,118 8,980 DEGREES CONFERRED: Bachelor degrees 1,669 1,744 1,671 1,651 1,661 Advanced degrees 3,429 3,370 3,286 3,292 3,365 FACULTY: Total Professoriate (C) 2,219 2,180 2,153 2,118 2,043 ANNUAL UNDERGRADUATE TUITION RATE (IN DOLLARS) $ 47,331 $ 45,729 $ 44,184 $ 42,690 $ 41,250 (A) Student income is reported net of financial aid in the Consolidated Statements of Activities. (B) Includes University, SHC and LPCH gifts. The FY15 amount includes $626 million in works of art and special collections. In FY15, the University received a significant collection of artwork which is included with other donations reported by the Office of Development. As stated in Note 1, Stanford does not capitalize works of art and special collections. (C) Fall quarter immediately following fiscal year end. 25
. SHC and LPCH each have their own separate management with responsibility for their own financial reporting.")
29 MANAGEMENT RESPONSIBILITY FOR FINANCIAL STATEMENTS The Leland Stanford Junior University ( Stanford University or the University ) is the sole member of Stanford Health Care (SHC) and Lucile Salter Packard Children s Hospital at Stanford (LPCH). SHC and LPCH each have their own separate management with responsibility for their own financial reporting. Management of the University, SHC and LPCH is each responsible for the integrity and reliability of their respective portions of these financial statements. The University oversees the process of consolidating SHC s and LPCH s information into the consolidated financial statements. Management of each entity represents that, with respect to its financial information, the consolidated financial statements in this annual report have been prepared in conformity with accounting principles generally accepted in the United States of America ( U.S. GAAP ). In accumulating and controlling financial data, management of the University, SHC and LPCH maintains separate systems of internal control. Management of the respective entities believes that effective internal control has been designed, implemented and maintained to provide reasonable assurance that assets are protected and that transactions and events are recorded properly. All internal control systems, however, no matter how well designed, have inherent limitations and can provide only reasonable assurance that their objectives are met. The accompanying consolidated financial statements have been audited by the University s, SHC s and LPCH s independent auditor, PricewaterhouseCoopers LLP. Their report expresses an opinion as to whether the consolidated financial statements, considered in their entirety, present fairly, in conformity with U.S. GAAP, the consolidated financial position and changes in net assets and cash flows. The independent auditor s opinion is based on audit procedures described in their report, which include considering internal control relevant to the preparation and fair presentation of the consolidated financial statements in order to design audit procedures to provide reasonable assurance that the financial statements are free from material misstatement. The Board of Trustees of the University and the separate Boards of Directors of SHC and LPCH, through their respective audit committees, comprised of trustees and directors not employed by the University, SHC or LPCH, are responsible for engaging the independent auditor and meeting with management, internal auditors and the independent auditor to independently assess whether each is carrying out its responsibility and to discuss auditing, internal control and financial reporting matters. Both the internal auditors and the independent auditor have full and free access to the respective audit committees. Both meet with the respective audit committees at least annually, with and without each other, and without the presence of management representatives. Randall S. Livingston Vice President for Business Affairs and Chief Financial Officer Stanford University M. Suzanne Calandra Senior Associate Vice President for Finance Stanford University Linda Hoff Chief Financial Officer Stanford Health Care Dana Haering Chief Financial Officer Lucile Salter Packard Children s Hospital at Stanford 26
, which comprise the consolidated statements of financial position as of August 31, 2017 and 2016, and the related consolidated statements of activities")
30 Report of Independent Auditors To the Board of Trustees of the Leland Stanford Junior University We have audited the accompanying consolidated financial statements of the Leland Stanford Junior University and its subsidiaries ( Stanford ), which comprise the consolidated statements of financial position as of August 31, 2017 and 2016, and the related consolidated statements of activities and cash flows for the years then ended. Management's Responsibility for the Consolidated Financial Statements Management is responsible for the preparation and fair presentation of the consolidated financial statements in accordance with accounting principles generally accepted in the United States of America; this includes the design, implementation, and maintenance of internal control relevant to the preparation and fair presentation of consolidated financial statements that are free from material misstatement, whether due to fraud or error. Auditors Responsibility Our responsibility is to express an opinion on the consolidated financial statements based on our audits. We conducted our audits in accordance with auditing standards generally accepted in the United States of America. Those standards require that we plan and perform the audit to obtain reasonable assurance about whether the consolidated financial statements are free from material misstatement. An audit involves performing procedures to obtain audit evidence about the amounts and disclosures in the consolidated financial statements. The procedures selected depend on our judgment, including the assessment of the risks of material misstatement of the consolidated financial statements, whether due to fraud or error. In making those risk assessments, we consider internal control relevant to Stanford s preparation and fair presentation of the consolidated financial statements in order to design audit procedures that are appropriate in the circumstances, but not for the purpose of expressing an opinion on the effectiveness of Stanford s internal control. Accordingly, we express no such opinion. An audit also includes evaluating the appropriateness of accounting policies used and the reasonableness of significant accounting estimates made by management, as well as evaluating the overall presentation of the consolidated financial statements. We believe that the audit evidence we have obtained is sufficient and appropriate to provide a basis for our audit opinion. Opinion In our opinion, the consolidated financial statements referred to above present fairly, in all material respects, the financial position of the Leland Stanford Junior University and its subsidiaries as of August 31, 2017 and 2016, and the changes in their net assets and their cash flows for the years then ended in accordance with accounting principles generally accepted in the United States of America. December 5, 2017 PricewaterhouseCoopers LLP, Three Embarcadero Center, San Francisco, CA T(415) , F: (415) ,
Denning House. Photograph: Eric Koziol / Office of Development
 St anf or duni v e r s i t y Annual Fi nanc i al Repor t Augus t31, 2018and2017 Denning House Denning House, home to the Knight-Hennessy Scholars program, is located in the heart of campus overlooking
STANFORD UNIVERSITY ANNUAL FINANCIAL REPORT
 STANFORD UNIVERSITY ANNUAL FINANCIAL REPORT MANAGEMENT S DISCUSSION AND ANALYSIS... 3 SELECTED FINANCIAL AND OTHER DATA... 11 MANAGEMENT RESPONSIBILITY FOR FINANCIAL STATEMENTS... 12 REPORT OF INDEPENDENT
thesespacesalsofeaturethelatestinefficientdesign. Photographs: CourtesyZGFArchitectsLLP; RobertCanfield(top) LindaA.Cicero/StanfordNewsService(botom)
 LindaA.Cicero/StanfordNewsService(botom)") TheCe nt r al Ene r gyf ac i l i t y( CEF )i nc l ude st hr e el ar gewat e rt ank sf ort he r mal e ne r gys t or age, ahi ghv ol t ages ubs t at i ont hatr e c e i v e se l e c t r i c i t yf r om t
TheCe nt r al Ene r gyf ac i l i t y( CEF )i nc l ude st hr e el ar gewat e rt ank sf ort he r mal e ne r gys t or age, ahi ghv ol t ages ubs t at i ont hatr e c e i v e se l e c t r i c i t yf r om t
In this section we will review the details of the
 FINANCIAL OVERVIEW 1 Section 1 Financial Overview In this section we will review the details of the 2004/05 Consolidated Budget for Operations, discuss the impact of the Capital Budget on the Consolidated
ANNUAL DISCLOSURE REPORT OF THE BOARD OF TRUSTEES OF THE LELAND STANFORD JUNIOR UNIVERSITY FOR THE FISCAL YEAR ENDED AUGUST 31, 2017
 ANNUAL DISCLOSURE REPORT OF THE BOARD OF TRUSTEES OF THE LELAND STANFORD JUNIOR UNIVERSITY FOR THE FISCAL YEAR ENDED AUGUST 31, 2017 DATED JANUARY 26, 2018 ANNUAL DISCLOSURE REPORT OF THE BOARD OF TRUSTEES
UNIVERSITY OF CALIFORNIA, BERKELEY. Annual Financial Report
 UNIVERSITY OF CALIFORNIA, BERKELEY Annual Financial Report 2008-09 TABLE OF CONTENTS Management's Discussion and Analysis 1 Financial Statements: Statements of Net Assets at June 30, 2009 and 2008 11 Statements
The Stanford University Budget Plan
 i The Stanford University Budget Plan 2000/01 Submitted for Action to the Board of Trustees June 8-9, 2000 This publication can also be found on the World Wide Web at: http://www.stanford.edu/dept/pres-provost/budget/plans/plan01.html
UNIVERSITY OF CALIFORNIA
 Independent Auditors Reports as Required by Office of Management and Budget (OMB) Circular A-133 and Government Auditing Standards and Related Information Year ended June 30, 2014 Location EIN Office of
FINANCIAL OVERVIEW (UNAUDITED)
") FINANCIAL OVERVIEW (UNAUDITED) FINANCIAL HIGHLIGHTS Summarized Selected Data for the Past Six Years 32 Statement of Net Assets 33 Statement of Revenues Expenses, and Changes in Net Assets 34 Statement
FINANCIAL OVERVIEW (UNAUDITED) FINANCIAL HIGHLIGHTS Summarized Selected Data for the Past Six Years 32 Statement of Net Assets 33 Statement of Revenues Expenses, and Changes in Net Assets 34 Statement
Section 1 Financial Overview
 Financial Overview 1 Section 1 Financial Overview The purpose of this section is to review the principal financial components of the 2001/02 Budget Plan. The programmatic elements are addressed in the
NOTES TO FINANCIAL STATEMENTS
 ORGANIZATION/FINANCIAL REPORTING ENTITY The University of California (the University) was founded in 1868 as a public, state-supported institution. The California State Constitution provides that the University
Management s Discussion and Analysis. Statement of Net Assets. Statement of Revenues, Expenses and Changes in Net Assets. Statement of Cash Flows
 2 0 0 6 f i n a n c i a l r e p o r t UC DAV I S 2 0 0 6 FINANCIAL REPORT TA B LE OF CONTENT S Management s Discussion and Analysis 2 Statement of Net Assets 14 Statement of Revenues, Expenses and Changes
Stanford Hospital and Clinics and Subsidiaries Consolidated Financial Statements August 31, 2013 and 2012
 Stanford Hospital and Clinics and Subsidiaries Consolidated Financial Statements August 31, 2013 and 2012 Index August 31, 2013 and 2012 Page(s) Independent Auditor s Report... 1 Consolidated Financial
Stanford Hospital and Clinics and Subsidiaries Consolidated Financial Statements August 31, 2011 and 2010
 Stanford Hospital and Clinics and Subsidiaries Consolidated Financial Statements August 31, 2011 and 2010 Index August 31, 2011 and 2010 Page(s) Report of Independent Auditors... 1 Consolidated Financial
Lucile Salter Packard Children s Hospital at Stanford Consolidated Financial Statements and Accompanying Consolidating Information August 31, 2017
 Lucile Salter Packard Children s Hospital at Stanford Consolidated Financial Statements and Accompanying Consolidating Information Index Page(s) Report of Independent Auditors... 1 Consolidated Financial
For Yale Faculty, Staff, and Students only
 For Yale Faculty, Staff, and Students only Budget Book Fiscal Year 2017 Cover photo: Brandon Boyer YC 15 Analyst, Office of Financial Planning & Analysis, Yale University FY17 Operating and Capital Budget
Financial Statements and Uniform Guidance Supplementary Information Together with Report of Independent Certified Public Accountants
 Financial Statements and Uniform Guidance Supplementary Information Together with Report of Independent Certified Public Accountants UNIVERSITY OF MASSACHUSETTS June 30, 2016 and 2015 UNIVERSITY OF MASSACHUSETTS
Highlights financial report. June 30 June (in thousands)
") Highlights FINANCIAL (in thousands) June 30 June 30 2000 1999 Total revenues $1,680,943 $1,367,175 Total cash gifts and equipment gifts $220,642 $211,215 Capital expenditures $118,799 $94,896 Total assets
Highlights FINANCIAL (in thousands) June 30 June 30 2000 1999 Total revenues $1,680,943 $1,367,175 Total cash gifts and equipment gifts $220,642 $211,215 Capital expenditures $118,799 $94,896 Total assets
Rensselaer Polytechnic Institute Consolidated Financial Statements June 30, 2016 and 2015
 Rensselaer Polytechnic Institute Consolidated Financial Statements Index Page(s) Report of Independent Auditors... 1 2 Consolidated Financial Statements Statements Financial Position... 3 Statements of
Rensselaer Polytechnic Institute Consolidated Financial Statements June 30, 2018 and 2017
 Rensselaer Polytechnic Institute Consolidated Financial Statements Index Page(s) Report of Independent Auditors... 1 Consolidated Financial Statements Statements Financial Position... 2 Statements of Activities...
LEHIGH University. Financial Planning Report With Budget
 LEHIGH University Financial Planning Report With 2012-2013 Budget L E H I G H U N I V E R S I T Y 2 0 1 2-1 3 B U D G E T ------------------------- T A B L E O F C O N T E N T S PAGE I. COMMENTARY 1-9
Stanford Hospital and Clinics and Subsidiaries Consolidated Financial Statements August 31, 2009 and 2008
 Stanford Hospital and Clinics and Subsidiaries Consolidated Financial Statements August 31, 2009 and 2008 Index August 31, 2009 and 2008 Page(s) Report of Independent Auditors... 1 Consolidated Financial
Lucile Salter Packard Children s Hospital at Stanford Consolidated Financial Statements August 31, 2013 and 2012
 Lucile Salter Packard Children s Hospital at Stanford Consolidated Financial Statements Index Page(s) Independent Auditor s Report... 1 Consolidated Financial Statements Consolidated Balance Sheets...
Stanford Health Care Consolidated Financial Statements and Accompanying Consolidating Information August 31, 2017 and 2016
 Consolidated Financial Statements and Accompanying Consolidating Information August 31, 2017 and 2016 Index August 31, 2017 and 2016 Page(s) Report of Independent Auditors... 1 Consolidated Financial Statements:
UNIVERSITY OF ALASKA
 UNIVERSITY OF ALASKA (A Component Unit of the State of Alaska) Financial Statements (With Independent Auditors Report Thereon) University of Alaska (A Component Unit of the State of Alaska) Financial Statements
stanford university budget plan
 stanford university budget plan 2007/08 This Budget Plan was approved by the Stanford University Board of Trustees June 14, 2007. Distribution of this document is made in the interest of greater understanding
Stanfordʼs Disclaimer on Forward-Looking Statements
 Stanfordʼs Disclaimer on Forward-Looking Statements Statements in this presentation that are not historical facts are forwardlooking statements based on current expectations of future events and are subject
2013 financial report
 2013 financial report TABLE OF CONTENTS Management s Discussion and Analysis 2 Statement of Net Position 13 Statement of Revenues, Expenses and Changes in Net Position 14 Statement of Cash Flows 15 Notes
2007 Financial Report
 2007 Financial Report 2007 Financial Report TABLE OF CONTENTS Management s Discussion and Analysis 2 Statement of Net Assets 13 Statement of Revenues, Expenses and Changes in Net Assets 14 Statement of
TRUMAN STATE UNIVERSITY A COMPONENT UNIT OF THE STATE OF MISSOURI FINANCIAL STATEMENTS JUNE 30, 2017
 A COMPONENT UNIT OF THE STATE OF MISSOURI FINANCIAL STATEMENTS JUNE 30, 2017 Contents Page Independent Auditors Report... 1-2 Management s Discussion And Analysis... 3-12 Financial Statements Statement
DARTMOUTH COLLEGE. Year ended June 30, (With Independent Auditors Report Thereon)
") DARTMOUTH COLLEGE Independent Auditors Reports as Required by Office of Management and Budget (OMB) Circular A-133 and Government Auditing Standards and Related Information Year ended June 30, 2013 (With
DARTMOUTH COLLEGE Independent Auditors Reports as Required by Office of Management and Budget (OMB) Circular A-133 and Government Auditing Standards and Related Information Year ended June 30, 2013 (With
Financial Overview MANAGEMENT S DISCUSSION AND ANALYSIS (UNAUDITED) The University s Assets. The University s Financial Position
 The University s Assets. The University s Financial Position") Financial Overview 50 Management s Discussion and Analysis 54 Statement of Net Position 55 Statement of Revenues, Expenses, and Changes in Net Position 56 Statement of Cash Flows 57 Notes to the Financial
Financial Overview 50 Management s Discussion and Analysis 54 Statement of Net Position 55 Statement of Revenues, Expenses, and Changes in Net Position 56 Statement of Cash Flows 57 Notes to the Financial
2015 FINANCIAL REPORT
 2015 FINANCIAL REPORT TABLE OF CONTENTS Discussion of Financial Results (unaudited) Selected Financial Data (unaudited) Report of Independent Auditors Consolidated Statements of Financial Position Consolidated
UNIVERSITY OF ALASKA
 UNIVERSITY OF ALASKA (A Component Unit of the State of Alaska) Financial Statements (With Independent Auditors Report Thereon) University of Alaska (A Component Unit of the State of Alaska) Financial Statements
University of Connecticut Fiscal Year 2015 Budget Highlights
 University of Connecticut Fiscal Year 2015 Budget Highlights The FY15 budget supports the President s four priority areas: student success, strengthening research and economic development, increasing philanthropy
Stanford University Budget Plan
 Stanford University Budget Plan 2003/04 Submitted for Action to the Board of Trustees June 12-13, 2003 This publication can also be found on the World Wide Web at: http://www.stanford.edu/dept/pres-provost/budget/plans/plan04.html
California Institute of Technology Financial Statements For the Years Ended September 30, 2013 and 2012
 Financial Statements For the Years Ended Index to the Financial Statements For the Years Ended Page(s) Independent Auditor s Report 1 Balance Sheets 2 Statements of Activities 3 Statements of Cash Flows
UNIVERSITY OF SOUTH ALABAMA (A Component Unit of the State of Alabama)
") Basic Financial Statements and Single Audit Reporting in Accordance with the Uniform Guidance Table of Contents Management s Discussion and Analysis (Unaudited) 1 Independent Auditors Report 15 Basic Financial
Basic Financial Statements and Single Audit Reporting in Accordance with the Uniform Guidance Table of Contents Management s Discussion and Analysis (Unaudited) 1 Independent Auditors Report 15 Basic Financial
University of California Table of Contents June 30, 2008
 University of California Report on Audit of Financial Statements and on Federal Awards Programs in Accordance with OMB Circular A-133 For the Year Ended June 30, 2008 Location EIN Office of the President
APPENDIX FACULTY OF ARTS AND SCIENCES MANAGERIAL FINANCIAL REPORT FISCAL YEAR 2013 HARVARD UNIVERSITY
 APPENDIX FACULTY OF ARTS AND SCIENCES MANAGERIAL FINANCIAL REPORT FISCAL YEAR 2013 HARVARD UNIVERSITY (in millions) Faculty of Arts and Sciences Consolidated Statement of Activity Fiscal Year Ending June
F I N A N C I A L R E P O R T
 3 M A N A G E M E N T S D I S C U S S I O N A N D A N A L Y S I S Beginning in fiscal year 2002 the university will implement the new financial reporting requirements contained in Statement Numbers 34
OVERVIEW OF FINANCIAL ACTIVITIES UNIVERSITY AT BUFFALO THE STATE UNIVERSITY OF NEW YORK Financial Overview 0
 2012-2013 OVERVIEW OF FINANCIAL ACTIVITIES UNIVERSITY AT BUFFALO THE STATE UNIVERSITY OF NEW YORK 2013 Financial Overview 0 Introduction... 2 Overview... 3 Core Operating Activities Financial Highlights...
Oakland University. Annual Financial Report. Years ended June 30, 2003 and 2002 with Report of Independent Auditors
 Annual Financial Report Years ended June 30, 2003 and 2002 with Report of Independent Auditors Annual Financial Statements Years ended June 30, 2003 and 2002 Contents Management s Discussion and Analysis...
UNIVERSITY OF ALASKA
 UNIVERSITY OF ALASKA (A Component Unit of the State of Alaska) Financial Statements (With Independent Auditors Report Thereon) University of Alaska (A Component Unit of the State of Alaska) Financial Statements
2014 FINANCIAL REPORT
 2014 FINANCIAL REPORT TABLE OF CONTENTS Management s Discussion and Analysis 2 Statement of Net Position 12 Statement of Revenues, Expenses and Changes in Net Position 13 Statement of Cash Flows 14 Notes
Obligated Group Financial Statements
 Obligated Group Financial Statements 3rd Quarter June 30, 2015 Scripps Health Obligated Group Table of Contents For the Quarter and Nine Months Ended June 30, 2015 Obligated Group Financial Statements
Xavier University. Financial Statements as of and for the Years Ended June 30, 2013 and 2012, and Independent Auditors Report
 Xavier University Financial Statements as of and for the Years Ended June 30, 2013 and 2012, and Independent Auditors Report INDEPENDENT AUDITORS REPORT Board of Trustees Xavier University Cincinnati,
Financial Statements. Wheelock College. June 30, 2015 and 2014
 Financial Statements Wheelock College June 30, 2015 and 2014 Financial Statements Table of Contents Financial Statements: Independent Auditors Report 1-2 Statements of Financial Position 3 Statements of
Table of Contents...1. Letter to the President...3. Financial Highlights Balance Sheet...8, 9. Statement of Changes in Fund Balances...
 ANNUAL FINANCIAL REPORT 1 T ABLE OF CONTENTS Table of Contents...1 Letter to the President...3 Financial Highlights...4-7 Balance Sheet...8, 9 Statement of Changes in Fund Balances...10 Statement of Current
UC Davis: A century of doing what matters
 UC Davis: A century of doing what matters Financial Report 2008 TABLE OF CONTENTS Management s Discussion and Analysis 2 Statement of Net Assets 13 Statement of Revenues, Expenses and Changes in Net Assets
UK HealthCare Hospital System
 2017 Financial Statements UK HealthCare Hospital System UK HealthCare Hospital System An Organizational Unit of the University of Kentucky Financial Statements Years Ended June 30, 2017 and 2016 CONTENTS
Stanford Health Care Consolidated Financial Statements August 31, 2015 and 2014
 Consolidated Financial Statements August 31, 2015 and 2014 Index August 31, 2015 and 2014 Page(s) Independent Auditor s Report... 1 Consolidated Financial Statements: Consolidated Balance Sheets... 2 Consolidated
WESTFIELD STATE UNIVERSITY (an agency of the Commonwealth of Massachusetts) FINANCIAL STATEMENTS AND MANAGEMENT S DISCUSSION AND ANALYSIS
 FINANCIAL STATEMENTS AND MANAGEMENT S DISCUSSION AND ANALYSIS") FINANCIAL STATEMENTS AND MANAGEMENT S DISCUSSION AND ANALYSIS JUNE 30, 2016 Financial Statements and Management s Discussion and Analysis June 30, 2016 C O N T E N T S Independent Auditors Report 1-2 Management
FINANCIAL STATEMENTS AND MANAGEMENT S DISCUSSION AND ANALYSIS JUNE 30, 2016 Financial Statements and Management s Discussion and Analysis June 30, 2016 C O N T E N T S Independent Auditors Report 1-2 Management
Financial Report to the Board of Trustees
 Financial Report to the Board of Trustees February 28, 2012 FY11 Closeout and FY12 Six Month Update University of Connecticut Health Center FY11 Closeout 2 University of Connecticut Health Center FY 2011
California Institute of Technology EIN:
 EIN: 95-1643307 Report on Audit of Financial Statements and on Federal Awards Programs in Accordance With OMB Circular A-133 (exclusive of the Jet Propulsion Laboratory) For the Year Ended September 30,
UNIVERSITY OF SOUTH ALABAMA (A Component Unit of the State of Alabama)
") Basic Financial Statements and Supplementary Information on Federal Awards Programs September 30, 2009 Basic Financial Statements Table of Contents Management s Discussion and Analysis (Unaudited) 1 Independent
Basic Financial Statements and Supplementary Information on Federal Awards Programs September 30, 2009 Basic Financial Statements Table of Contents Management s Discussion and Analysis (Unaudited) 1 Independent
Financial Report. Year Ended September 30,
 Financial Report 2013 Year Ended September 30, M. Roy Wilson President Margaret E. Winters Provost and Senior Vice President for Academic Affairs Louis Lessem Vice President and General Counsel Patrick
Total assets 4,902,840 5,437,769
 Statement of Financial Position As of June 30, 2009, with comparative information as of June 30, 2008 (in thousands) Assets 2009 2008 Cash and cash equivalents $ 432,409 $ 91,040 Receivables and other
Wayne State University. Financial Report September 30, 2005
 Financial Report September 30, 2005 Contents Independent Auditor s Report 1 Financial Statements Management s Discussion and Analysis - Unaudited 2-18 Balance Sheets 19 Statements of Revenues, Expenses
Consolidated Financial Statements Salve Regina University
 Consolidated Financial Statements Salve Regina University June 30, 2017 and 2016 Consolidated Financial Statements Table of Contents Consolidated Financial Statements: Independent Auditors Report 1 2 Consolidated
CALIFORNIA STATE UNIVERSITY, POMONA. Financial Statements. June 30, (With Independent Auditors Report Thereon)
") Financial Statements (With Independent Auditors Report Thereon) Table of Contents Page Independent Auditors Report 1 Management s Discussion and Analysis (Unaudited) 3 Financial Statements: Statement of
Financial Statements (With Independent Auditors Report Thereon) Table of Contents Page Independent Auditors Report 1 Management s Discussion and Analysis (Unaudited) 3 Financial Statements: Statement of
The University of Southern California Financial Report University of Southern California University Park, UGB 203, Los Angeles, CA
 The University of Southern California University Park, UGB 203, Los Angeles, CA 90089-8003 Highlights of the University 1 2 3 4 6 8 9 Highlights of the University Report of Independent Auditors Consolidated
APPENDIX FACULTY OF ARTS AND SCIENCES MANAGERIAL FINANCIAL REPORT FISCAL YEAR 2015 HARVARD UNIVERSITY
 APPENDIX FACULTY OF ARTS AND SCIENCES MANAGERIAL FINANCIAL REPORT FISCAL YEAR 2015 HARVARD UNIVERSITY (in millions) Faculty of Arts and Sciences Consolidated Statement of Activity Fiscal Year Ending June
Financial Report Building Partnerships for the Future
 Financial Report 1998-1999 Building Partnerships for the Future Virginia Tech s founding as a land-grant institution was rooted in an important state and federal partnership. The Morrill Act of 1862 apportioned
D A R T M O U T H C O L L E G E. Financial Statements
 D A R T M O U T H C O L L E G E Financial Statements 2013-2014 To the Board of Trustees of Dartmouth College: Independent Auditor s Report We have audited the accompanying consolidated financial statements
Washington University Consolidated Financial Statements June 30, 2014 and 2013
 Consolidated Financial Statements Index Page(s) Independent Auditor s Report... 1 Consolidated Financial Statements Statements of Financial Position... 2 Statements of Activities... 3 4 Statements of Cash
CREIGHTON UNIVERSITY. Table of Contents. Page. Independent Auditors Report 1. Consolidated Financial Statements:
 Table of Contents Independent Auditors Report 1 Consolidated Financial Statements: Page Consolidated Statements of Financial Position 3 Consolidated Statements of Activities 4 Consolidated Statements of
The William Paterson University of New Jersey
 The William Paterson University of New Jersey (A Component Unit of the State of New Jersey) Financial Statements and Management s Discussion and Analysis Table of Contents Page Independent Auditors Report
UNIVERSITY OF CALIFORNIA, BERKELEY. Annual Financial Report
 UNIVERSITY OF CALIFORNIA, BERKELEY Annual Financial Report 2006-07 TABLE OF CONTENTS Fiscal Year 2006-07 Management's Discussion and Analysis 3 Letter from the Associate Vice Chancellor Finance and Controller
Financial Statements. Wheelock College. June 30, 2014 and 2013
 Financial Statements Wheelock College June 30, 2014 and 2013 Financial Statements Table of Contents Financial Statements: Independent Auditors Report 1-2 Statements of Financial Position 3 Statements of
D A R T M O U T H C O L L E G E. Financial Statements
 D A R T M O U T H C O L L E G E Financial Statements 2014-2015 To the Board of Trustees of Dartmouth College: Independent Auditor s Report We have audited the accompanying consolidated financial statements
Audited Financial Report and Reports Required by Uniform Guidance As of and for the Years Ended June 30, 2017 and 2016 The University of Oklahoma
 Audited Financial Report and Reports Required by Uniform Guidance As of and for the Years Ended June 30, 2017 and 2016 The University of Oklahoma Health Sciences Center Table of Contents June 30, 2017
D A R T M O U T H C O L L E G E. Financial Statements
 D A R T M O U T H C O L L E G E Financial Statements 2011-2012 KPMG LLP Suite 400 356 Mountain View Drive Colchester, VT 05446 Independent Auditors Report The Board of Trustees Dartmouth College: We have
THE UNIVERSITY OF CHICAGO. Consolidated Financial Statements and Supplemental University Information. June 30, 1999 and 1998
 Consolidated Financial Statements and Supplemental University Information (With Independent Auditors Report Thereon) Consolidated Statements of Activities Years ended 1999 1998 University Hospitals Consolidated
DARTMOUTH COLLEGE. Year ended June 30, (With Independent Auditors Report Thereon)
") DARTMOUTH COLLEGE Independent Auditors Reports as Required by Office of Management and Budget (OMB) Circular A-133 and Government Auditing Standards and Related Information Year ended June 30, 2011 (With
DARTMOUTH COLLEGE Independent Auditors Reports as Required by Office of Management and Budget (OMB) Circular A-133 and Government Auditing Standards and Related Information Year ended June 30, 2011 (With
THE UNIVERSITY OF IOWA Comprehensive Fiscal Report FY 2016
 THE UNIVERSITY OF IOWA Comprehensive Fiscal Report FY 2016 Each year, the University of Iowa is required to submit to the Board of Regents, a comprehensive fiscal report which compares actual revenues
California Institute of Technology Financial Statements For the Years Ended September 30, 2012 and 2011
 Financial Statements For the Years Ended Index to the Financial Statements For the Years Ended Page(s) Report of Independent Auditors 1 Balance Sheets 2 Statements of Activities 3 Statements of Cash Flows
CALIFORNIA STATE UNIVERSITY, NORTHRIDGE. Financial Statements. June 30, (With Independent Auditors Report Thereon)
") Financial Statements (With Independent Auditors Report Thereon) Table of Contents Page Independent Auditors Report 1 Management s Discussion and Analysis 3 Basic Financial Statements: Statement of Net
Financial Statements (With Independent Auditors Report Thereon) Table of Contents Page Independent Auditors Report 1 Management s Discussion and Analysis 3 Basic Financial Statements: Statement of Net
University of Alaska (A Component Unit of the State of Alaska) Financial Statements June 30, 2010 and Table of Contents
 Financial Statements June 30, 2010 and Table of Contents") Financial Statements June 30, 2010 and 2009 University of Alaska (A Component Unit of the State of Alaska) Financial Statements June 30, 2010 and 2009 Table of Contents Page Management s Discussion and
Financial Statements June 30, 2010 and 2009 University of Alaska (A Component Unit of the State of Alaska) Financial Statements June 30, 2010 and 2009 Table of Contents Page Management s Discussion and
ST. JOHN S COLLEGE. Financial Statements. June 30, 2017 and (With Independent Auditors Report Thereon)
") Financial Statements (With Independent Auditors Report Thereon) Independent Auditors Report The Board of Visitors and Governors St. John s College: We have audited the accompanying financial statements
Financial Statements (With Independent Auditors Report Thereon) Independent Auditors Report The Board of Visitors and Governors St. John s College: We have audited the accompanying financial statements
To the Board of Trustees of Northwestern University:
 Report of the Senior Vice President for Business and Finance To the Board of Trustees of Northwestern University: This Financial Report illustrates that in 2006 Northwestern increased its substantial financial
Financial Statements June 30, 2017 Rogers State University
 Financial Statements Rogers State University www.eidebailly.com Table of Contents Independent Auditor s Report... 1 Management s Discussion and Analysis... 4 Financial Statements Statement of Net Position...
Rensselaer Polytechnic Institute
 Consolidated Financial Statements For the Years Ended June 30, 2010 and 2009 Consolidated Financial Statements For the Years Ended June 30, 2010 and 2009 Contents Report of Independent Auditors 1 Consolidated
EAST CAROLINA UNIVERSITY
 STATE OF NORTH f CAROLINA OFFICE OF THE STATE AUDITOR BETH A. WOOD, CPA EAST CAROLINA UNIVERSITY GREENVILLE, NORTH CAROLINA FINANCIAL STATEMENT AUDIT REPORT FOR THE YEAR ENDED JUNE 30, 2017 A CONSTITUENT
University of South Florida System and DSO Financial Reports FISCAL YEAR MID-YEAR FORECASTS
 University of South Florida System and DSO Financial Reports FISCAL YEAR 2014-2015 MID-YEAR FORECASTS Board of Trustees Finance & Audit Workgroup Meeting February 26, 2015 INDEX University of South Florida
University of Medicine and Dentistry of New Jersey Reports on State Awards in Accordance with New Jersey Department of the Treasury Circular Letter
 University of Medicine and Dentistry of New Jersey Reports on State Awards in Accordance with New Jersey Department of the Treasury Circular Letter 04-04-OMB June 30, 2012 Index June 30, 2012 Page(s) Report
CREIGHTON UNIVERSITY. Consolidated Financial Statements. June 30, 2017 and (With Independent Auditors Report Thereon)
") Consolidated Financial Statements (With Independent Auditors Report Thereon) Table of Contents Page(s) Independent Auditors Report 1 2 Consolidated Statements of Financial Position 3 Consolidated Statements
Consolidated Financial Statements (With Independent Auditors Report Thereon) Table of Contents Page(s) Independent Auditors Report 1 2 Consolidated Statements of Financial Position 3 Consolidated Statements
STATE OF MISSISSIPPI INSTITUTIONS OF HIGHER LEARNING. Financial Statements. June 30, 2016 and (With Independent Auditors Reports Thereon)
") Financial Statements (With Independent Auditors Reports Thereon) (THIS PAGE LEFT BLANK INTENTIONALLY) Table of Contents Independent Auditors Report 1 Management s Discussion and Analysis (Unaudited) 4
Financial Statements (With Independent Auditors Reports Thereon) (THIS PAGE LEFT BLANK INTENTIONALLY) Table of Contents Independent Auditors Report 1 Management s Discussion and Analysis (Unaudited) 4
Stanford Health Care Consolidated Financial Statements and Accompanying Consolidating Information August 31, 2018 and 2017
 Consolidated Financial Statements and Accompanying Consolidating Information August 31, 2018 and 2017 Index August 31, 2018 and 2017 Page(s) Report of Independent Auditors... 1 Consolidated Financial Statements:
Franklin W. Olin College of Engineering. Annual Financial Information and Operating Data Audited Financial Statements.
 Franklin W. Olin College of Engineering Annual Financial Information and Operating Data Audited Financial Statements November, 2014 Table 1 First Year Applications Academic Year Applications Received Applications
UNIVERSITY OF CALIFORNIA, BERKELEY. Annual Financial Report
 UNIVERSITY OF CALIFORNIA, BERKELEY Annual Financial Report 2009-10 TABLE OF CONTENTS Management's Discussion and Analysis 1 Financial Statements: Statements of Net Assets at June 30, 2010 and 2009 11 Statements
Prepared by the Office of the Treasurer
 Prepared by the Office of the Treasurer 0 February 24, 2015 Agenda 1. Budget Principles & Model 2. Operating Budget Highlights 3. Enrollment & Housing 4. Investments & Reserves Overview 5. Debt & Capital
The University of Chicago Financial Statements and Supplemental University Information
 The University of Chicago 2010 2011 Financial Statements and Supplemental University Information Table of Contents Page Independent Auditors Report 2 Consolidated Balance Sheets 3 Consolidated Statements
Cleveland State University (a component unit of the State of Ohio) Financial Report with Supplemental Information June 30, 2018
 Financial Report with Supplemental Information June 30, 2018") Cleveland State University (a component unit of the State of Ohio) Financial Report with Supplemental Information June 30, 2018 Contents Independent Auditor s Report 1-3 Management s Discussion and Analysis
Cleveland State University (a component unit of the State of Ohio) Financial Report with Supplemental Information June 30, 2018 Contents Independent Auditor s Report 1-3 Management s Discussion and Analysis
REPORT OF INDEPENDENT AUDITORS AND FINANCIAL STATEMENTS FOR UNIVERSITY OF SAN DIEGO
 REPORT OF INDEPENDENT AUDITORS AND FINANCIAL STATEMENTS FOR UNIVERSITY OF SAN DIEGO June 30, 2017 and 2016 Table of Contents Report of Independent Auditors 1 2 PAGE Financial Statements Statements of Financial
Financial Report to the Board of Trustees
 Financial Report to the Board of Trustees January 26, 2011 FY10 Closeout and FY11 Six Month Update University of Connecticut Health Center FY10 Closeout University of Connecticut Health Center FY 2010
UNIVERSITY OF OKLAHOMA HEALTH SCIENCES CENTER. June 30, 2012
 UNIVERSITY OF OKLAHOMA HEALTH SCIENCES CENTER June 30, 2012 UNIVERSITY OF OKLAHOMA HEALTH SCIENCES CENTER June 30, 2012 and 2011 AUDITED FINANCIAL STATEMENTS Independent Auditors Report... 1 Management
NORTHEAST OHIO MEDICAL UNIVERSITY (A COMPONENT UNIT OF THE STATE OF OHIO) Financial Report Including Supplemental Information June 30, 2016
 Financial Report Including Supplemental Information June 30, 2016") (A COMPONENT UNIT OF THE STATE OF OHIO) Financial Report Including Supplemental Information June 30, 2016 Contents Management s Discussion and Analysis 1-9 Report Letter 10-12 Basic Financial Statements
(A COMPONENT UNIT OF THE STATE OF OHIO) Financial Report Including Supplemental Information June 30, 2016 Contents Management s Discussion and Analysis 1-9 Report Letter 10-12 Basic Financial Statements
2013 Annual Financial Report
 2013 Annual Financial Report TABLE OF CONTENTS Message from President Norton... 1 Management s Responsibility for Financial Reporting... 2 Independent Auditors Report... 3 Management Discussion and Analysis...
Idaho State University
 Idaho State University Financial Statements for the Years Ended June 30, 2003 and 2002 and Independent Auditors Reports Including Single Audit Reports for the Year Ended June 30, 2003 IDAHO STATE UNIVERSITY