Performance of Municipalities in 2015
|
|
|
- Dylan Jackson
- 5 years ago
- Views:
Transcription
 9 June 2016 Dr Pali")
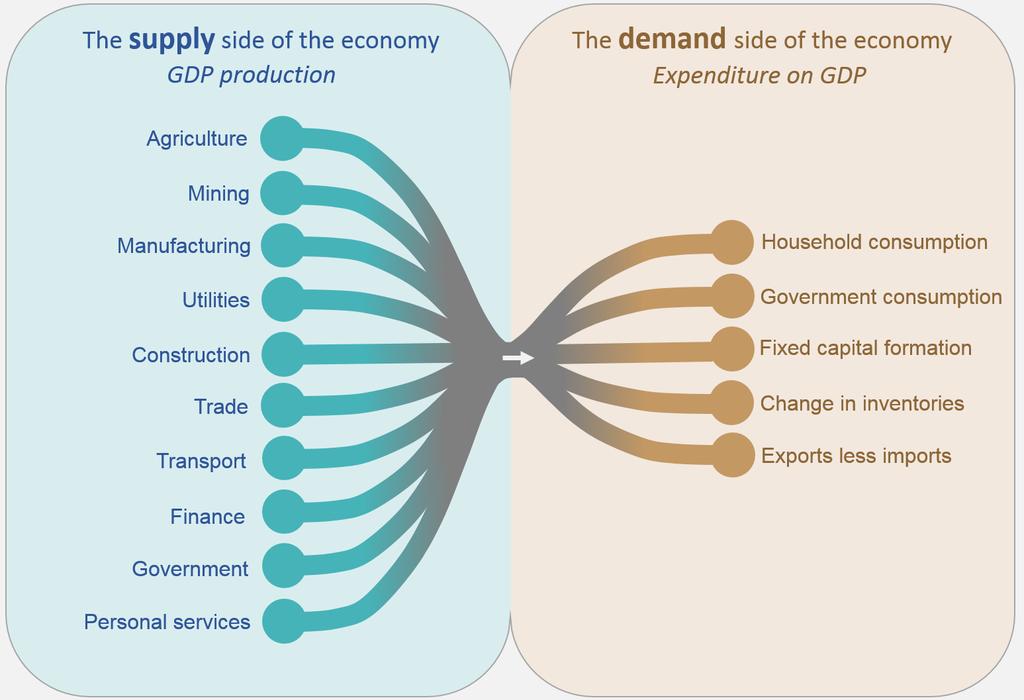
1 Performance of Municipalities in 2015 ( SERVICE DELIVERY, INDIGENT AND EMPLOYMENT NUMBERS FROM MUNICIPALITIES) 9 June 2016 Dr Pali Lehohla 1
2 Context NDP: Address the triple challenge of Poverty Inequality and Unemployment
3 No income education 80% 70% 60% No schooling 50% 40% 30% 20% 10% Age Grade 11 Grade 12 Diploma Bachelors degree
4 Proportion completing a bachelor's degree after completing grade White The alarming evidence points to regressive proportions in Bachelor s completion rates amongst Blacks Indian/Asia n Black African Coloured Year
5 Black African Coloured Indian White Percentage of workers in each age group who are skilled (managers, professionals, technicians) The percentage of workers in skilled occupations increased in all age and all race groups, except for black Africans aged 25-34, which decreased There were much weaker gains in the black African group for all ages 0% 10% 20% 30% 40% 50% 60% 70% 80%
6 Inequality in South Africa % RSA 0.45 Black African Coloured Indian/Asian White

7 Geography as a dimension: Human Settlements policy The 2011 settlement patterns illustrate that policy intentions and public action are at variance with densification on the margins Population Density - Census 2001 Census 2011 shows increasing urban sprawl on the periphery instead Spatio-Cultural and Temporal Dimensions of Measurement
8
9 Real GDP decreased by -1,2% in Q (quarter-on-quarter) Real GDP decreased by -0,2% in Q (year-on-year) Seasonally adjusted and annualised Unadjusted
10 Table of contents: NFCM Background 2. General Results i. Basic Services ii. Free Basic Services iii. Indigent Households iv. Employment 3. Concluding Remarks 2


 CONSUMER")

11 What is asked NFCM questionnaire Household Questionnaires Employment in municipalities By division, type, gender Infrastructure Basic and free basic services: Water Electricity Sewerage & sanitation Solid waste management Compliance Indigents Service provided: Funded by municipality, and /or Agreements with service providers and/or Agreements with national and provincial departments (where the municipality does not have the funds or infrastructure to provide service) CONSUMER UNITS Services - various Income Areas Employment Various other demography Population census Community survey 2016 GHS Etc HOUSEHOLDS 3

12 4 Consumer Unit explained - illustration Households = 140 reporting units Consumer units = 5 minimum; 70? maximum reporting units ? Consumer unit Household 1 10?


13 Free Basic Service Policy: Introduced in kl of water free per household per month 50kwh of electricity free per household per month R50 average for Sewerage and Sanitation R50 average for Solid Waste Management 5
14 Indigent household These are poor households as determined by municipalities. The basis on which a municipality determines if a household is indigent (and the criteria used for such determination) can vary. Not necessarily consistent across municipalities, even in same province. 6

15 Mechanisms used for provision of Free Basic Services Broad-based approach: Each consumer unit in that municipality receives free basic services on the current billing system of the municipality. Geographical approach: The process whereby consumers living in a particular area are assumed to have the same socio-economic profile and therefore tariffs can be set on location. Self-targeting approach: It is essentially an income-based system which municipalities use as a basis to determine if the household receives the service at lower, discounted or on a free basis. Technical targeting approach: The process whereby technology is used to regulate the provision of free basic services (including water and electricity meters). Other targeting methods: Consumption-based Property value Plot size 7
 2,3 million (FBS) Indigent households registered with municipalities 3,5 million 3,6 million Electricity: consumer units Bucket toilets provided by municipalities 10,4 million (BS) 2,6")
16 NFCM 2015: KEY FINDINGS Water: consumer units 12,2 million (BS) 4,7 million (FBS) 12,5 million (BS) 4,6 million (FBS) Solid Waste Management: consumer units 8,6 million (BS) 2,4 million(fbs) 9,0 million (BS) 2,3 million (FBS) Indigent households registered with municipalities 3,5 million 3,6 million Electricity: consumer units Bucket toilets provided by municipalities 10,4 million (BS) 2,6 million (FBS) 10,9 million (BS) 2,7 million (FBS) Sewerage & Sanitation: consumer units 10,4 million (BS) 3,3 million (FBS) 10,9 million (BS) 3,3 million (FBS) BS: Basic Service FBS: Free Basic Service Based on all 278 municipalities (100% response rate) 2014*


17 WATER 9
18 Context NDP: Increase in the percentage of households with access to a functional water service from 85% in 2013 to 90% by 2019.

19 Consumer units Basic water and free basic water consumer units: Basic Water Free Basic Water Year *
20 Consumer units receiving basic water: 2015 Top 3 municipalities per province EC 1. Nelson Mandela MM ( ) 2. O.R. Tambo DM ( ) 3. Amathole DM ( ) FS 1. Mangaung MM ( ) 2. Maluti-A-Phofung ( ) 3. Matjhabeng LM ( ) GP 1. Johannesburg MM ( ) 2. Ekurhuleni MM ( ) 3. Tshwane MM ( ) KZN 1. Ethekwini MM ( ) 2. Msunduzi LM ( ) 3. Ugu DM (152152) LP 1. Mopani DM ( ) 2. Vhembe DM ( ) 3. Greater Sekhukhune ( ) MP 1. Mbombela LM ( ) 2. Bushbuckridge LM ( ) 3. Govan Mbeki LM ( ) NW 1. Matlosana LM ( ) 2. Madibeng LM ( ) 3. Rustenburg LM ( ) NC 1. Sol Plaatjie LM (63 224) 2. Ga-Segonyana LM (24 791) 3. Joe Morolong LM (24 250) WC 1. Cape Town MM ( ) 2. Drakenstein LM (43 711) 3. Stellenbosch LM (37 846) 12

21 Percentage of households with access to piped or tap water in their dwellings, off-site or on-site 2015: 89% 2002: 85%
22 Percentage of households with access to piped or tap water in their dwellings, off-site or on-site by province, There were very high proportions of households in Western Cape (99,2%), Gauteng (97,7%), Northern Cape (96,5%) with access to piped or tap water off and on site 100% 95% 90% 85% 80% 75% WC, 99.2 GP, 97.7 FS, 96.1 MP, 85.5 KZN, 84.2 LP, 78.8 EC, % 65% 60% 55% 50%
23 Percentage of households rating the quality of water services provided by the municipality as good, and those that reported water interruptions, by province, 2015 vs An inverse relationship between the perceived quality of services and the number of interruptions seems to exist. Quality Interruptions WC 86.4% 3.1% NW 76.8% 6.6% SA 62.0% 25.4% FS 57.5% 30.7% KZN EC GP 51.1% 49.4% 51.6% 36.1% 26.1% 37.8% NC MP LP 32.4% 40.2% 40.2% 50.8% 59.4% 60.9% LP MP NC GP EC KZNLP FSMP SA NCNWGP WCEC KZN FS SA NW WC
24 Percentage of households rating the quality of water services provided by the municipality as good, and those that reported water interruptions, by Metro, 2015 An inverse relationship between the perceived vs quality of services and the number of interruptions seems to exist. Quality Interruptions City of Cape Town ethekwini 84.4% 87.8% 3.6% 7.1% City of Johannesburg All Metros Ekurhuleni City of Tshwane Nelson Mandela Bay Buffalo City Mangaung 52.9% 55.6% 58.0% 79.6% 77.4% 75.9% 73.7% 6.0% 7.6% 6.3% 9.6% 5.9% 15.2% 31.1% Mangaung has a significantly higher percentage of interruptions than the average for all metros City of Cape Town ethekwini City of Johannesburg All Metros Ekurhuleni City of Tshwane Nelson Mandela Bay Buffalo City Mangaung
25 Electricity 17
26 Context NDP: The proportion of people with access to the electricity grid should rise to at least 90 percent by 2030
27 Consumer units Number of consumer units basic electricity and free basic electricity: Basic Electricity Free Basic Year *
28 Number of consumer units receiving basic electricity : 2015 Top 3 municipalities per province EC 1. Nelson Mandela MM ( ) 2. Buffalo City MM ( ) 3. King Sabata Dalindyebo (53 362) FS 1. Mangaung MM ( ) 2. Maluti-A-Phofung LM ( ) 3. Matjhabeng LM (91 185) GP 1. Johannesburg MM ( ) 2. Tshwane MM (704056) 3. Ekurhuleni MM ( ) KZN 1. Ethekwini MM ( ) 2. Msunduzi LM ( ) 3. Newcastle LM (81 412) LP 1. Polokwane LM ( ) 2. Makhado LM ( ) 3. Thulamela LM (96 467) MP 1. Bushbuckridge LM ( ) 2. Mbombela LM ( ) 3. Nkomazi LM (86 492) NW 1. City of Matlosana ( ) 2. Madibeng LM ( ) 3. Rustenburg LM (97 791) NC 1. Sol Plaatjie LM (64 297) 2. Joe Morolong LM (25 500) 3. //Khara Hais LM (21 874) WC 1. Cape Town MM ( ) 2. Drakenstein LM (56 809) 3. George LM (44 920) 20 28


29 The percentage of South African households that were connected to the mains electricity supply 2015: 86% 2002: 77%
30 The percentage of households connected to the mains electricity supply by province The percentage of South African households that were connected to the mains electricity supply increased from 77,1% in 2002 to 86% in % 90% 80% 93% 92% 90% 89% 88% 86% 84% 83% 82% 82% 70% 60% 50% 40% 30% 20% 10% 0% LP NC WC FS MP SA NW GP EC KZN
.")

31 Percentage distribution of wood as a source of energy used for cooking by province, 2015 Less than one per cent of households usually used wood for cooking in Western Cape and Gauteng (0,7% and 0,5% respectively). 100% 90% 80% 70% 60% 50% 40% Wood still represent a significant source of energy for cooking in Limpopo, along with other provinces with significant rural communities 30% 20% 10% 0% LP MP KZN EC RSA NW NC FS WC GP


32 Rating of the quality of the electricity supply services, The percentage of households in the country that rated electricity supply as good increased to 66,5% in 2014 before dropping to 60,2% in % 80% EC quality of the electricity supply services has been consistently declining over the time period 70% 60% 50% 40% 30% 20% % 0% WC EC NC FS KZN NW GP MP LP RSA
33 SEWERAGE AND SANITATION 25
34 Context NDP: Increase in the percentage of households with access to a functional sanitation service from 84% in 2013 to 90% by 2019,
35 Consumer units Number of consumer units receiving basic sewerage and sanitation and free basic sewerage and sanitation : Basic Sewerage and Sanitation Free Basic Sewerage and Sanitation Year *
 3. Matjhabeng LM (86 474) GP 1. Johannesburg MM (759 268) 2. Ekurhuleni MM (717 100) 3. Tshwane MM (596 753) KZN 1. Ethekwini MM (801 562) 2. Msunduzi LM (157 554) 3.")
36 Sewerage and sanitation consumer units: 2015 Top 3 municipalities per province EC 1. Nelson Mandela Bay ( ) 2. O.R. Tambo DM ( ) 3. Buffalo City MM ( ) FS 1. Mangaung MM ( ) 2. Maluti-A-Phofung ( ) 3. Matjhabeng LM (86 474) GP 1. Johannesburg MM ( ) 2. Ekurhuleni MM ( ) 3. Tshwane MM ( ) KZN 1. Ethekwini MM ( ) 2. Msunduzi LM ( ) 3. Uthukela DM ( ) LP 1. Polokwane LM ( ) 2. Greater Sekhukhune ( ) 3. Vhembe DM ( ) MP 1. Bushbuckridge LM ( ) 2. Mbombela LM ( ) 3. Govan Mbeki LM (94 717) NW 1. City of Matlosana ( ) 2. Rustenburg LM ( ) 3. Mahikeng LM (77 232) NC 1. Sol Plaatjie LM (63 233) 2. //Khara Hais LM (23 381) 3. Joe Morolong LM (19 095) WC 1. Cape Town MM ( ) 2. Drakenstein LM (51 227) 3. Mossel Bay LM (36 862) 27 36
37 Percentage of households that have access to RDP standard sanitation per province, vs Nationally, the percentage of households with access to RDP standard sanitation increased from 62,3% in 2002 to 80% in % 90% 80% WC, 93.3 GP, 91.0 NC FS, % 60% 50% 40% 30% 20% 10% NW KZN, 77.3 MP, 65.8 LP, %
38 Percentage of households that have access to RDP standard sanitation per province, Nationally, the percentage of households with vs access to RDP standard sanitation increased from 62,3% in 2002 to 80% in % 90% 80% NC WC 93.3 GP 91.0 FS 81.1 RSA % 60% 50% 67.4 KZN has shown steady increases in improving access to RDP sanitation standard over the last 3 years KZN MP LP %

39 Percentage of households that have no toilet facility or were using a bucket toilet, vs Percentage without toilet facilities, or buckets, improved from 12,3% in 2002 to 4,9% in 2002, nationally. Largest decrease in EC (28,3 pct pts to 8,5%) 35% 30% 25% 20% 15% 10% 5% 0%


40 Number of households Municipality provision of bucket toilets: Year *

41 Number of consumer units using bucket toilets provided by the municipalities in each province: 2014 and 2015 Gauteng Limpopo North West Mpumalanga Northern Cape Free State KwaZulu-Natal Eastern Cape Western Cape No bucket toilet system provided by municipality in
42 SOLID WASTE MANAGEMENT 38


43 Number of consumer units receiving solid waste management: ,0 million consumer units nationally received basic solid waste management services Just over 1 in 4 of these units received free basic services 58% of indigent households benefitted from indigent support on solid waste management 39
44 Consumer units Number of consumer units receiving basic solid waste management and free basic solid waste management: Basic Solid Waste Management Free Basic Solid Waste Management Year *
45 Number of consumer units receiving basic solid waste management services: 2015 Top 3 municipalities per province EC 1. Nelson Mandela Bay ( ) 2. Buffalo City MM ( ) 3. King Sabata Dalindyebo (30 000) FS 1. Mangaung MM ( ) 2. Matjhabeng LM ( ) 3. Metsimaholo LM (42 500) GP 1. Johannesburg MM ( ) 2. Tshwane MM ( ) 3. Ekurhuleni MM ( ) KZN 1. Ethekwini MM ( ) 2. Msunduzi LM ( ) 3. umhlathuze LM (64 000) LP 1. Polokwane LM ( ) 2. Mogalakwena LM (52 342) 3. Thulamela LM (49 700) MP 1. Nkomazi LM (82 126) 2. Thembisile LM (74 822) 3. Govan Mbeki LM (68 215) NW 1. Rustenburg LM (90 000) 2. City of Matlosana (88 400) 3. Moses Kotane LM (63 000) NC 1. Sol Plaatjie LM (56 540) 2. //Khara Hais LM (23 245) 3. Gamagara LM (14 791) WC 1Cape Town MM ( ) 2. George LM (53 200) 3. Drakenstein LM (41 515) 41 45
46 Number of consumer units receiving basic solid waste management services: 2015 Magareng 2014*: : Change: Service extended to various communities, including Warrenvale and Ikhutseng areas 42
47 Percentage of households whose refuse is removed by the municipality Households refuse removal by geotype, 2015 Households in urban areas were much more likely to receive some rubbish removal service than those in rural areas, and rural households were therefore much more likely to rely on their own rubbish dumps LP 6% 100% 90% 80% 8.6% 70% 60% 50% 40% 84.1% 86.4% 30% 20% 10% 0% 6.6% Removed at least once a weak Removed less often than once a week Urban Communal refuse dump Own refuse dump Rural Dump or leave rubbish anywhere Other
48 The percentage of households who experience specific kinds of environmental problems, The proportion of households that felt that there were problems with littering and waste removal in their areas increased notably since 2003 when 28,8% of households regarded this as a problem. 45% 40% 35% 30% 25% 20% 15% 10% 5% NDP urges the rapid expansion of recycling infrastructure, and encouraging the composting of organic domestic waste to bolster economic activity in poor urban communities Waste, 39% Land, 31% Air, 19% Water, 16% 0%
49 Number of consumer units receiving basic solid waste management services: 2015 Msinga 2014*: : Change: Municipality solid waste management services was provided for the first time in Keates Drift, Tugela Ferry and Pomeroy 43

50 Number of consumer units receiving basic solid waste management services: 2015 Nyandeni 2014*: : Change: Services extended to: a. Various wards in Ntlaza; b. The Ziphunzana area 44
51 Indigents 45

52 Number of indigent households registered with municipalities per province: 2014 & *: : ,7% (92 444) increase in indigent identified by the municipalities in 2015 Northern Cape Gauteng North West Free State Limpopo Mpumalanga KwaZulu-Natal Western Cape Eastern Cape
53 Benefitting Indigent households in each province and services they receive: 2015 WC EC NC FS KZN NW GP MP LP Identified ,6 million indigent households 47
54 EMPLOYMENT 48


55 Gender breakdown of executive mayors and mayors: 2014 & % 38% 278 posts 62% 62% 2014*
56 Gender breakdown of executive mayors and mayors (%)*: 2015 Limpopo Mpumalanga Eastern Cape North West Northern Cape Gauteng KwaZulu-Natal Free State Western Cape 33% 33% 29% 27% 60% 43% 42% 39% 38% 67% 67% 71% 73% 40% 57% 58% 61% 62% 0% 20% 40% 60% 80% 100% * Rounded off Female Male 50
57 Municipality positions* per province: 2014 & *: : Gauteng North West Limpopo Mpumalanga Northern Cape Free State KwaZulu-Natal Western Cape Eastern Cape *Including: full time + part-time + vacant + managerial positions 51
58 Province Employment by type* of municipality : 2014 & 2015 Type of municipality Metros Districts Locals Total 2014* * * * 2015 Western Cape Eastern Cape Northern Cape Free State KwaZulu-Natal North West Gauteng Mpumalanga Limpopo South Africa *Including: full time + part-time + vacant + managerial positions 52
59 Municipal staff vacancy rates by province: ,3% (41 303) of municipal posts throughout the country are vacant Northern Cape 15,9% Gauteng 10,8% North West 19,4% Free State 25.6% Limpopo 18,4% Mpumalanga 12,4% KwaZulu-Natal 9,2% Western Cape 10,3% Eastern Cape 17,6% 53
60 Vacancy rates in ALL MUNICIPALITIES per department: 2015 Environmental protection Health Finance & administration Sport & recreation 10% 11% 9% 23% 13% vacancy rate in all departments 20% Electricity 18% 16% Road transport Waste water management 11% Waste management 12% 11% 12% 14% Community & Social services Excludes managerial positions & other. Public safety Water 54
61 Vacancy rates in District municipalities per department: 2015 Excludes managerial positions & other. Community & Social services Water Waste management 11% 8% 1% 41% 13% vacancy rate in all departments Electricity 37% Environmental protection 24% 18% Sport & recreation Road transport Waste water management 13% Finance & administration 13% 16% Health 18% Public safety 55
62 Vacancy rates in Metropolitan municipalities per department: 2015 Waste water management Excludes managerial positions & other. Environmental protection 4% 28% 20% Electricity Sport & recreation Public safety 7% 5% 10% vacancy rate in all departments 11% 10% Water Road transport Finance & administration 7% Community & Social services 7% 8% Health 10% Waste management 56
63 Vacancy rates in Local municipalities per department: 2015 Excludes managerial positions & other. Waste management 13% 36% Health 28% Environmental protection Waste water management Sport & recreation 14% 13% 18% vacancy rate in all departments 24% 21% Road transport Public safety 16% Finance & administration Water 16% 21% Electricity 21% Community & Social services 57


64 Results Survey date is October to November 2015
65 Background There are five types of Municipalities in KZN Type A1 Type B1 Type B2 Type B3 Type B4

66 Municipal Infrastructure Investment Framework (MIIF) used to distinguish Municipalities TYPE A : 1 MUNICIPALITY 1 Metropolitan municipalities (metros) TYPE B1: 3 MUNICIPALITIES TYPE B2: 6 MUNICIPALITIES 6 3 Secondary cities, local municipalities with the largest budgets Local municipalities with a large town as core TYPE B3: 13 MUNICIPALITIES 13 Local municipalities with small towns, relatively small population, significant proportion of urban population but with no large town as core TYPE B4: 28 MUNICIPALITIES 28 Local municipalities which are mainly rural with communal tenure and with, at most, one or two small towns in their area
67 Background in terms of service delivery Kzn has shown progressive improvements over time which includes water, sanitation and electricity amongst others and this has resulted in the B4 Municipalities reducing head count poverty the greatest


68 Context: KZN Service Delivery Progress Access to piped water Electricity for lighting Sanitation 76% 87% 82% 76% 69% 51% Source GHS 2014

69 Context: Poverty headcount by municipality (South African multidimensional Poverty index (SAMPI)
70 Poverty headcount by municipality (SAMPI)

 SAMPI 2011 SAMPI")
71 Reductions in intensity and Headcount Poverty headcount by municipality (SAMPI) SAMPI 2011 SAMPI 2001
72 Drivers of Poverty in KZN 2011 (SAMPI) Unemployment Years of Schooling Sanitation Water Heating Dwelling Cooking Lighting Assets School Attendance Child Mortality 3% 2% 8% 7% 7% 6% 6% 6% 5% 15% 35% Strong linkage between years of schooling and unemployment
73 Inequality has remained high especially amongst the Blacks with a gini that dropped marginally from 0.53 to 0.51 Inequality amongst Indians has declined overtime from a gini of 0.53 to 0.46 Amongst Whites the gini is low showing more equality with a gini that dropped from 0.39 to 0.37
74 Significant variations in inequality by population group Note that Colored population Numbers too small in KZN to make conclusive determination on inequality trends Gini-coefficient: KwaZulu- Natal KZN Coloured* Black African Indian/Asian White KwaZulu Natal Black African Coloured Indian/Asian White *Small sample size for Coloured persons in KZN province may influence figure provided
75 in real life circumstances have rapidly increased Yet despite this level of change the Level of satisfaction with overall performance of Kwazulu-Natal provincial government shows surprising results Now the Results follow
76 36% Dissatisfaction with overall performance of KwaZulu-Natal provincial government 31% Somewhat Satisfied with overall performance of KwaZulu-Natal provincial government 33% Outright Satisfaction with overall performance of KwaZulu-Natal provincial government
77 Satisfaction rates are similar across age and Sex However marked differences in the ratings by population group, education level, income level and district
78 Outright Satisfaction with overall performance of provincial government differs by Population Group but colored population numbers too few to be conclusive Coloured 48.0% Satisfaction of Performance of Provincial Government White 35.7% Black African 32.5% Indian/Asian 31.1%

79 Changes in ranking of population groups when viewed from dissatisfaction perspective Outright Dissatisfaction with overall performance of provincial government Dissatisfaction of Performance of Provincial Government Black African 37.6% White 32.4% Indian/Asian 20.1% Coloured 16.2%
80 Lower Educational attainment linked with lower rates of outright satisfaction Outright Satisfaction with performance of provincial government by educational level Certificate with Matric 36% Completed Matric 33% Some High School 34% Some Primary 30% No Education 28%
81 Outright satisfaction with performance of provincial government by Income 50% level 45% Those Households with the least income show the least outright satisfaction More than twice as likely to be satisfied than low income earners 40% 42% 40% 44% 42% 35% 30% 25% 20% 15% 21% 26% 31% 34% 31% 33% 34% 33% 34% 10% 5% 0% R1 - R2400 R2401- R6000 R R12000 R R18000 R R30000 R R42000 R R54000 R R72000 R R96000 R R R R R R R Annual Household Income
82 Locality is also a key differentiator in rates of satisfaction Different municipalities have differing abilities to serve the citizens given based on financial, technical and management resources

83 Outright satisfaction with performance of provincial government by municipality Outright satisfaction % % % % % Areas with higher outright satisfaction with overall performance of provincial government more dispersed


84 Outright dissatisfaction with performance of provincial government by municipality Outright dissatisfaction % % % % % Evidence of clustering with regards to outright dissatisfaction with overall performance of provincial government
85 Outright dissatisfaction with performance of provincial government by Municipality Outright Dissatisfaction % % % % %! Many of the most Outright Dissatisfied areas are governed by coalition
86 Municipal Type Outright satisfaction with performance of provincial government by Municipal Status B1 Despite more resources Ethekwini (only type A municipality) does not rank as high 45% B2 37% A 34% B4 27% B3 23% 0% 5% 10% 15% 20% 25% 30% 35% 40% 45% 50% Outright Satisfaction
87
88 Outright Dissatisfaction is particularly apparent in umkhanyakude, Zululand and uthukela districts Where nearly 7 out of every 10 respondents reported that they are dissatisfied with the overall performance of their local municipality.
89 Perceived importance of municipal services and programmes
90 What are the top three priority areas?

91 KZN Citizens Priority Areas by population group! For All Population Groups Job Creation is the Main Priority Black African #1 #1 Job Creation #2 Provision Housing #3 Provision Housing Coloured #1 #1 Job Creation Education & skills #2 Poverty eradication Development #3 Indian/ Asian #1 #1 Job Creation #2 Crime prevention #3 Fighting corruption White #1 #1 Job Creation #2 Poverty eradication #3 Fighting corruption

92 Ratings of performance of KZN Provincial Government in selected areas


93 Performance Of KZN Provincial Government in selected areas Overall 62.6% of KZN citizens were satisfied* with the provincial government in providing basic education Providing healthcare and maintaining provincial roads also ranked relatively higher performance ratings at around 50% satisfaction rating * Satisfied rating is based on Good, Very Good or Excellent responses

94 Performance Of KZN Provincial Government in selected areas 49.1% Of KZN citizens ranked provincial government as poor in eliminating fraud and corruption Promoting accountable government and enhancing entrepreneurship and SMME were also ranked relatively poorly


95 Municipal services and programmes viewed as critically Important Water 52% Electricity Clinics Sanitation Housing 40% 39% 36% 34% More than 50% view Water as critically important Percentage Critically Important
96 What are the satisfaction rates, of services that are viewed as critically important by type of municipality?


97 Outright Satisfaction with services provided Affordable Housing ranks lowest amongst all MIIF categories High Satisfaction with Electricity services almost universal B3 and B4 Municipality have particular concerns with Quality of water provision Type A Type B1 Type B2 Type B3 Type B4-10% 0% 10% 20% 30% 40% 50% 60% 70% 80% 90% Percentage Outright Satisfied
")

98 Poverty headcount by municipality (SAMPI) Mapping the poverty headcount by Municipality Eastern Cape (SAMPI) 3

99 Poverty headcount by municipality (SAMPI) 4

100 Poverty headcount by municipality (SAMPI) 5


101 Economic activity Living standar d Unemployment Assets Dwelling Sanitation Water Cooking Heating Lighting School attendance Education Years of schooling Health Child mortality Poverty drivers in South Africa are multidimensi onal Men Total Women Unemployment rate Unemployment is now the major driver of poverty in the country
 (Cell: 0829068964 Office: 012 3106928) Dr Patrick Naidoo (patrickn@statssa.gov.za) (Cell: 0828882509 Office: 012 3108307) Thank you 58")
102 Unit data for all 278 municipalities for 2014 and 2015 is available on the Stats SA website (or on request) Technical queries: Mr Malibongwe Mhemhe (Cell: Office: ) Dr Patrick Naidoo (Cell: Office: ) Thank you 58
Focus on Household and Economic Statistics. Insights from Stats SA publications. Nthambeleni Mukwevho Stats SA
 Focus on Household and Economic Statistics Insights from Stats SA publications Nthambeleni Mukwevho Stats SA South African Population Results from CS 2016 Source: CS 2016 EC Household Results from CS 2016
MFMA. Audit outcomes of municipalities
 0- Audit outcomes of municipalities 0- Reputation promise The Auditor-General of South Africa (AGSA) has a constitutional mandate and, as the Supreme Audit Institution (SAI) of South Africa, it exists
Quarterly Labour Force Survey
 Statistical release Quarterly Labour Force Survey Quarter 4: Embargoed until: 14 February 2017 10:30 ENQUIRIES: FORTHCOMING ISSUE: EXPECTED RELEASE DATE User Information Services Quarter 1:2017 May 2017
Labour. Labour market dynamics in South Africa, statistics STATS SA STATISTICS SOUTH AFRICA
 Labour statistics Labour market dynamics in South Africa, 2017 STATS SA STATISTICS SOUTH AFRICA Labour Market Dynamics in South Africa 2017 Report No. 02-11-02 (2017) Risenga Maluleke Statistician-General
LABOUR MARKET PROVINCIAL 54.3 % 45.7 % Unemployed Discouraged work-seekers % 71.4 % QUARTERLY DATA SERIES
 QUARTERLY DATA SERIES ISSUE 6 October 2016 PROVINCIAL LABOUR MARKET introduction introduction The Eastern Cape Quarterly Review of Labour Markets is a statistical release compiled by the Eastern Cape Socio
Quarterly Labour Force Survey Q1:2018
 Quarterly Labour Force Survey Q1:2018 Faizel Mohammed Stats SA discouraged work seekers The labour market Q1:2018 37,7 million People of working age in South Africa (15 64 year olds) Labour force 22,4
LABOUR MARKET PROVINCIAL 51.6 % 48.4 % Unemployed Discouraged work-seekers % 71.8 % QUARTERLY DATA SERIES
 QUARTERLY DATA SERIES ISSUE 7 November 2016 PROVINCIAL LABOUR MARKET introduction introduction The Eastern Cape Quarterly Review of Labour Markets is a statistical release compiled by the Eastern Cape
Taking accountability to improve audit outcomes
 Taking accountability to improve audit outcomes INTEGRATED DEVELOPMENT PLAN (IDP) Plan-Do-Check-Act Cycle, also the Deming cycle, courtesy of the International Organization for Standardization 3 4 5 6
Compliance Monitor Register of Projects
 Compliance Monitor Register of Projects Quarter 2017 CIDB REGISTER OF PROJECTS COMPLIANCE MONITOR; JULY 2017 1. Introduction 1 2. Background and Analysis for Compliance Indicators 3 2.1 Tender Awards
General household survey July 2003
 Statistical release P0318 General household survey July 2003 Co-operation between Statistics South Africa (Stats SA), the citizens of the country, the private sector and government institutions is essential
Labour force survey. September Embargoed until: 29 March :30
 Statistical release P0210 Labour force survey September 2006 Embargoed until: 29 March 2007 12:30 Enquiries: Forthcoming issue: Expected release date User Information Services LFS March 2007 September
Who cares about regional data?
 Who cares about regional data? Development happens somewhere - in a spatial locality. Aggregations hide [important] variety in the data Within South Africa: KwaZulu-Natal is not like the Western Cape Within
IMPACT OF GOVERNMENT PROGRAMMES USING ADMINISTRATIVE DATA SETS SOCIAL ASSISTANCE GRANTS
 IMPACT OF GOVERNMENT PROGRAMMES USING ADMINISTRATIVE DATA SETS SOCIAL ASSISTANCE GRANTS Project 6.2 of the Ten Year Review Research Programme Second draft, 19 June 2003 Dr Ingrid Woolard 1 Introduction
Regional and Local Governments (RLGs) Moody s Approach
 Moody s Approach") Regional and Local Governments (RLGs) Moody s Approach SALGA Municipal Innovative Infrastructure Financing Conference JUNE, 2018 Agenda 1. Moody s Sub-Sovereign Group 2. List of rated RLGs in South Africa
Regional and Local Governments (RLGs) Moody s Approach SALGA Municipal Innovative Infrastructure Financing Conference JUNE, 2018 Agenda 1. Moody s Sub-Sovereign Group 2. List of rated RLGs in South Africa
Quarterly Labour Force Survey
 Statistical release P0211 Quarterly Labour Force Survey Quarter 3, Embargoed until: 01 November 11:30 Enquiries: Forthcoming issue: Expected release date User Information Services Quarter 4, February 2012
Quarterly Labour Force Survey
 Statistical release Quarterly Labour Force Survey Quarter 1, Embargoed until: 08 May 11:30 Enquiries: Forthcoming issue: Expected release date User Information Services Quarter 2, July Tel: (012) 310 8600/4892/8390
Quarterly Labour Force Survey
 Statistical release P0211 Quarterly Labour Force Survey Quarter 2, 2014 Embargoed until: 29 July 2014 13:00 Enquiries: Forthcoming issue: Expected release date User Information Services Quarter 3, 2014
Quarterly Labour Force Survey Q3:2017
 Quarterly Labour Force Survey Q3:2017 Dr Pali Lehohla Statistician-General #StatsSA South African Labour Market: Current state vs NDP target South African Labour Market: Current state vs NDP target Unemployment
Residential Property Indices. Date Published: August 2018
 Residential Property Indices Date Published: August 2018 National Inflation Current annual inflation rate is 3.79% and monthly is 0.26% Market Review As at the end of July 2018 the national house price
South African Baseline Study on Financial Literacy
 Regional Dissemination Conference on Building Financial Capability South African Baseline Study on Financial Literacy Lyndwill Clarke Head: Consumer Education 30-31 January 2013 Nairobi, Kenya Outline
Residential Property Indices. Date Published: September 2018
 Residential Property Indices Date Published: September 2018 National Inflation Current annual inflation rate is 3.85% and monthly is 0.27% Market Review As at the end of August 2018 the national house
Residential Property Indices. Date Published: July 2018
 Residential Property Indices Date Published: July 2018 National Inflation Current annual inflation rate is 3.93% and monthly is 0.28% Market Review As at the end of June 2018 the national house price inflation
Municipal Infrastructure Grant Baseline Study
 Municipal Infrastructure Grant Baseline Study August 2008 Published July 2009 Disclaimer This Research Report for the Municipal Infrastructure Grant (MIG) Baseline Study has been prepared using information
Residential Property Indices. Date Published: October 2018
 Residential Property Indices Date Published: October 2018 National Inflation Current annual inflation rate is 3.77% and monthly is 0.25%. Market Review As at the end of September 2018 the national house
A universal health system for South Africa: a few final words on NHI. Di McIntyre Health Economics Unit University of Cape Town
 A universal health system for South Africa: a few final words on NHI Di McIntyre Health Economics Unit University of Cape Town U-turn to precipice National Advisory Committee on Consolidation of Financing
Status of financial management
 4 Status of financial management 33 4. Status of financial management The effect of poor internal controls on financial management is reflected and demonstrated in this section. 4.1 Financial statements
Quarterly Labour Force Survey
 Statistical release Quarterly Labour Force Survey Quarter 3, Embargoed until: 28 October 11:30 Enquiries: Forthcoming issue: Expected release date User Information Services Quarter 4 February 2009 Tel
Residential Property Indices. Date Published: February 2018
 Residential Property Indices Date Published: February 2018 National Inflation Current annual inflation rate is 4.21% and monthly is 0.34% Market Review As at the end of January 2018 the national house
REVIEW OF THE LOCAL GOVERNMENT EQUITABLE SHARE FORMULA
 T In partnership with: REVIEW OF THE LOCAL GOVERNMENT EQUITABLE SHARE FORMULA Parliament 19 February 2013 INTRODUCING THE NEW FORMULA Structure of the presentation 2 Background to the formula and review
Housing backlog: Protests and the demand for Housing in South Africa BY ESTERI MSINDO PSAM
 Housing backlog: Protests and the demand for Housing in South Africa BY ESTERI MSINDO PSAM Housing delivery law and regulation Section 26 of the constitution stipulates that everyone has the right to adequate
CONSTRUCTION MONITOR Employment Q3 2017
 CONSTRUCTION MONITOR Employment Q3 2017 CIDB CONSTRUCTION MONITOR - EMPLOYMENT; OCTOBER 2017 CIDB CONSTRUCTION MONITOR - EMPLOYMENT; OCTOBER 2017 1. Introduction 1 2. Employment in the Construction Industry;
KwaZulu-Natal Provincial Treasury
 KwaZulu-Natal Provincial Treasury UTHUNGULU DISTRICT: SOCIO-ECONOMIC PROFILE 8.1 Demographics The KwaZulu-Natal Province has both, a growing and maturing population, presenting opportunities and challenges
University of Pretoria Department of Economics Working Paper Series
 University of Pretoria Department of Economics Working Paper Series Assessing Fiscal Capacity at the Local Government Level in South Africa Margaret Chitiga-Mabugu Human Sciences Research Council, Pretoria
Residential Property Indices. Date Published: 30 June 2014
 Residential Property Indices Date Published: 30 June 2014 National Inflation Current annual inflation rate is 7.26% and monthly is 0.59% Market Review National year-on-year house price inflation is at
Quarterly Labour Force Survey
 Statistical release Quarterly Labour Force Survey Quarter 1, 2014 Embargoed until: 05 May 2014 11:30 Enquiries: Forthcoming issue: Expected release date User Information Services Quarter 2, 2014 July 2014
A STUDY OF THE LABOUR MARKET IN SOUTH AFRICA ABSTRACT
 European Journal of Research in Social Sciences Vol. 2 No. 4, 2014 A STUDY OF THE LABOUR MARKET IN SOUTH AFRICA Zeleke Worku Tshwane University of Technology Business School Pretoria, SOUTH AFRICA ABSTRACT
Mid-year population estimates, South Africa 2005
 Statistical release Mid-year population estimates, South Africa 2005 Embargoed until 31 May 2005 11:00 Private Bag X44 Pretoria 0001 South Africa 170 Andries Street, Pretoria 0002 tel: +27(12) 310 8911
A Facilitator Of Incremental Housing Finance RURAL HOUSING LOAN FUND BROCHURE
 A Facilitator Of Incremental Housing Finance RURAL HOUSING LOAN FUND BROCHURE WHAT IS RURAL HOUSING LOAN FUND Rural Housing Loan Fund (RHLF) is one of the Human Settlements Development Finance Institutions
Women in the South African Labour Market
 Women in the South African Labour Market 1995-2005 Carlene van der Westhuizen Sumayya Goga Morné Oosthuizen Carlene.VanDerWesthuizen@uct.ac.za Development Policy Research Unit DPRU Working Paper 07/118
South African ART policies between 2013/ /15: An analysis of ARV Expenditure
 South African ART policies between 2013/14 2014/15: An analysis of ARV Expenditure Gavin Surgey Teresa Guthrie 31 March 2015 DRAFT [Do not quote without prior permission] Background Over 2.5m people on
8. Inequality GAUTENG CITY-REGION OBSERVATORY QUALITY OF LIFE SURVEY 2015 CHANGING SOCIAL FABRIC
 GAUTENG CITY-REGION OBSERVATORY QUALITY OF LIFE SURVEY 1 8. Inequality Darlington Mushongera, darlington.mushongera@gcro.ac.za, 11 717 79 Graeme Götz, graeme.gotz@gcro.ac.za, 11 717 78 This brief gives
SOL PLAATJE LOCAL MUNICIPALITY
 introduction The Housing Development Agency ( HDA ) is a national public development agency that promotes sustainable communities by making well located and appropriately planned land and buildings available
LINKING POPULATION DYNAMICS TO MUNICIPAL REVENUE ALLOCATION IN SOUTH AFRICAN CITIES
 LINKING POPULATION DYNAMICS TO MUNICIPAL REVENUE ALLOCATION IN SOUTH AFRICAN CITIES SACN Programme: Well Governed Cities Document Type: Report Document Status: Final Date: March 2017 Joburg Metro Building,
The cidb Quarterly Monitor. T h e C o n s t r u c t i o n I n d u s t r y D e v e l o p m e n t B o a r d Development Through Partnership
 THE ECONOMICS OF CONSTRUCTION IN SOUTH AFRICA The cidb Quarterly Monitor T h e C o n s t r u c t i o n I n d u s t r y D e v e l o p m e n t B o a r d Development Through Partnership OCTOBER 2012 Acknowledgements:
Table 1 sets out national accounts information from 1994 to 2001 and includes the consumer price index and the population for these years.
 WHAT HAPPENED TO THE DISTRIBUTION OF INCOME IN SOUTH AFRICA BETWEEN 1995 AND 2001? Charles Simkins University of the Witwatersrand 22 November 2004 He read each wound, each weakness clear; And struck his
Urban Settlements Development Grant
 Urban Settlements Development Grant Presentation to Select Committee on Appropriations Presenter: Marissa Moore Chief Director: Urban Development and Infrastructure, National Treasury 12 September 2012
JUTA'S WEEKLY STATUTES BULLETIN
 (Bulletin 50 of 2015, based on Gazettes received during the week 4 to 11 December 2015) JUTA'S WEEKLY E-MAIL SERVICE ISSN 1022-6397 PROCLAMATIONS AND NOTICES Department of Arts and Culture: Official geographical
Residential Property Indices. Date Published: August 2016
 Residential Property Indices Date Published: August 2016 National Inflation Current annual inflation rate is 5.20% and monthly is 0.35% Market Review As at the end of July 2016 the national house price
Residential Property Indices. Date Published: March 2018
 Residential Property Indices Date Published: March 2018 National Inflation Current annual inflation rate is 4.08% and monthly is 0.31% Market Review As at the end of February 2018 the national house price
Presentation to Portfolio Committee on CoGTA on debts owed to Eskom and Water Boards
 Presentation to Portfolio Committee on CoGTA on debts owed to Eskom and Water Boards Withholding of Equitable Share for serious and persistent defaulters Local Government Budget Analysis: 12 May 2015 What
Government Gazette Staatskoerant
 Government Gazette Staatskoerant REPUBLIC OF SOUTH AFRICA REPUBLIEK VAN SUID AFRIKA Regulation Gazette No. 10177 Regulasiekoerant Vol. 640 4 October Oktober 2018 No. 41958 N.B. The Government Printing
Biannual Economic and Capacity Survey. July December2017
 Biannual Economic and Capacity Survey July December2017 1 Firm distribution based on Annual Turnover (based on responses received) July December 2017 Full survey Category by gross annual income % of firms
Regional explorer (ReX) Latest updates and new developments
 Latest updates and new developments") Regional explorer (ReX) Latest updates and new developments November 2017 Evan Burger Spatial Economist 2017 2016 IHS IHS Markit. All Rights All Rights Reserved. Reserved. & are now A merger of global
Regional explorer (ReX) Latest updates and new developments November 2017 Evan Burger Spatial Economist 2017 2016 IHS IHS Markit. All Rights All Rights Reserved. Reserved. & are now A merger of global
Evaluating the performance of Development Charges in financing municipal infrastructure investment. Discussion Paper. Second Draft 23 March 2009
 Evaluating the performance of Development Charges in financing municipal infrastructure investment Discussion Paper Second Draft 23 March 2009 Prepared by David Savage for the World Bank Contents Executive
ADDRESSING PUBLIC PRIVATE SECTOR INEQUALITIES PROFESSOR EMERITUS YOSUF VERIAVA
 ADDRESSING PUBLIC PRIVATE SECTOR INEQUALITIES PROFESSOR EMERITUS YOSUF VERIAVA HEALTH INEQUALITY AND INEQUITY Disparity: Is there a difference in the health status rates between population groups? Inequality:
Salary Survey. The Association of South African Quantity Surveyors (ASAQS) March 2017 (Published in October 2017) South African Construction Industry
 March 2017 (Published in October 2017) South African Construction Industry") The Association of South African Quantity Surveyors (ASAQS) Salary Survey March 2017 (Published in October 2017) South African Construction Industry Business Information Services www.industryinsight.co.za
The Association of South African Quantity Surveyors (ASAQS) Salary Survey March 2017 (Published in October 2017) South African Construction Industry Business Information Services www.industryinsight.co.za
Poverty: Analysis of the NIDS Wave 1 Dataset
 Poverty: Analysis of the NIDS Wave 1 Dataset Discussion Paper no. 13 Jonathan Argent Graduate Student, University of Cape Town jtargent@gmail.com Arden Finn Graduate student, University of Cape Town ardenfinn@gmail.com
Labour force survey February 2001
 Statistical release P0210 Labour force survey February 2001 Co-operation between Statistics South Africa (Stats SA), the citizens of the country, the private sector and government institutions is essential
Poverty, inequality and human development in a postpost apartheid South Africa
 Poverty, inequality and human development in a postpost apartheid South Africa Vusi Gumede University of Johannesburg Conference paper presented at Overcoming inequality and structural poverty in South
SECTION 2: OVERVIEW OF AUDIT OUTCOMES. Consolidated general report on national and provincial audit outcomes for
 SECTION 2: OVERVIEW OF AUDIT OUTCOMES 45 Consolidated general report on national and provincial audit outcomes for 204-5 Figure : Slight improvement in audit outcomes (all auditees) 7% (76) 28% (3) 26%
URBAN RENEWAL TAX INCENTIVE
 URBAN RENEWAL TAX INCENTIVE ABOUT THIS GUIDE This guide contains a summary of the main features of the Urban Renewal Tax Incentive legislation (section 13quat of the Income Tax Act (Act No. 58 of 1962)).
economic growth QUARTERLY DATA SERIES
 ISSUE 8 December 2016 PROVINCIAL economic growth QUARTERLY DATA SERIES introduction The Quarterly Economic Review is a statistical release compiled by the Eastern Cape Socio Economic Consultative Council
Provincial Report 2009/ 2010: Limpopo
 Provincial Report 2009/ 2010: Limpopo 1 Background The provincial reports have been compiled in response to requests from stakeholders, in particular provincial committees, for provincial profiles, updates
Provincial Budgeting and Financial Management
 Provincial Budgeting and Financial Management Presentation to Select Committee on Appropriations Presenter: Edgar Sishi National Treasury 15 July 2014 INTRODUCTION Provincial functions are assigned by
Integrating climate risk assessment/management/drr into national policies, programmes and sectoral planning. G Midgley, South Africa
 Integrating climate risk assessment/management/drr into national policies, programmes and sectoral planning G Midgley, South Africa The national policy framework South Africa s Disaster Management Act,
Children and South Africa s Budget
 Children and South Africa s Budget Children and South Africa s Budget 1. Macro context 2. Health 3. Education 4. Social Development 1. MACRO CONTEXT South Africa Key message 1 The nearly 20 million children
South Africa. UNICEF South Africa
 South Africa UNICEF South Africa Education BUDGET SOUTH AFRICA 2017/2018 1 17% Budget for school children remains at 17% of total government expenditure Preface This budget brief is one of four that explore
ECONOMIC GROWTH PROVINCIAL INTRODUCTION QUARTERLY DATA SERIES
 ISSUE 7 OCTOBER 2016 PROVINCIAL QUARTERLY DATA SERIES ECONOMIC GROWTH INTRODUCTION The Quarterly Economic Review is a statistical release compiled by the Eastern Cape Socio Economic Consultative Council
HOSPITALITY SECTOR MINIMUM WAGES AS FROM 1 JULY 2017 TABLE 1:
 HOSPITALITY SECTOR MINIMUM WAGES AS FROM 1 JULY 2017 TABLE 1: 1 July 2016 to 30 June 2017 Table 1: Minimum wages for employers with 10 or less employees 1 July 2017 to 30 June 2018 1 July 2018 to 30 June
Fourth ASISA Insurance Gap Study (performed by True South Actuaries & Consultants)
") Fourth ASISA Insurance Gap Study (performed by True South Actuaries & Consultants) October 2016 Agenda (A trillion has 12 zeros) Agenda (A trillion has 12 zeros) within the SA population landscape 55 million
Fourth ASISA Insurance Gap Study (performed by True South Actuaries & Consultants) October 2016 Agenda (A trillion has 12 zeros) Agenda (A trillion has 12 zeros) within the SA population landscape 55 million
Prepared by cde Khwezi Mabasa ( FES Socio-economic Transformation Programme Manager) JANUARY 2016
 JANUARY 2016") Prepared by cde Khwezi Mabasa ( FES Socio-economic Transformation Programme Manager) JANUARY 2016 Political Context: Social Democratic Values Social policy and the access to basic public goods are the
Prepared by cde Khwezi Mabasa ( FES Socio-economic Transformation Programme Manager) JANUARY 2016 Political Context: Social Democratic Values Social policy and the access to basic public goods are the
Estimating a poverty line: An application to free basic municipal services in South Africa
 Estimating a poverty line: An application to free basic municipal services in South Africa Development Policy Research Unit Haroon Bhorat Development Policy Research Unit haroon.bhorat@uct.ac.za Morne
PROGRESS REPORT ON LAND RESTITUTION CLAIMS
 PROGRESS REPORT ON LAND RESTITUTION CLAIMS db3sqepoi5n3s.cloudfront.net/files/docs/1202 07progress.ppt PRESENTATION TO THE PORTFOLIO COMMITTEE ON RURAL DEVELOPMENT AND LAND REFORM 07 FEBRUARY 2012 MR T.
Stakeholder perspective. Financial perspective
 ORGANISATIONAL PERFORMANCE ORGANISATIONAL PERFORMANCE Performance against predeined objectives The Rural Housing Loan Fund uses the balanced scorecard method as its strategic planning tool. We provide
REPORT OF THE SELECT COMMITTEE ON FINANCE ON THE PROVINCIAL TREASURIES EXPENDITURE REVIEW FOR THE 2014/15 FINANCIAL YEAR, DATED 14 OCTOBER 2015
 REPORT OF THE SELECT COMMITTEE ON FINANCE ON THE PROVINCIAL TREASURIES EXPENDITURE REVIEW FOR THE 2014/15 FINANCIAL YEAR, DATED 14 OCTOBER 2015 1. Introduction and Background The Select Committee on Finance
Provincial Reports 2009/ 2010:
 Provincial Reports 2009/ 2010: 1 Provincial Report 2009/2010: Background The provincial reports have been compiled in response to requests from stakeholders, in particular provincial committees, for provincial
SWARTLAND SPATIAL DEVELOPMENT FRAMEWORK ADDENDUM F
 SWARTLAND SPATIAL DEVELOPMENT FRAMEWORK ADDENDUM F DEMOGRAPHIC PROFILE 2011 Census APRIL 2014 By CK Rumboll and Partners 1 1. Introduction Swartland Municipality is located on the north western boundary
A Diagnostic Evaluation of Poverty and Relative Deprivation at small area level for the Eastern Cape Province
 PSPPD II a partnership between the Presidency, the Republic of South Africa and the European Union Service Contract No. DCI AFS/2013 333 292 PROVISION OF PROJECT MANAGEMENT CONSULTANCY AND TECHNICAL ASSISTANCE
GUIDE TO THE URBAN DEVELOPMENT ZONE TAX INCENTIVE
 GUIDE TO THE URBAN DEVELOPMENT ZONE TAX INCENTIVE Foreword This guide is a general guide with regard to the urban development zone tax incentive. It is not meant to delve into the precise technical and
Patrick Kelly. The new CPI: Sources, methods and results
 Patrick Kelly The new CPI: Sources, methods and results Contents Understanding the CPI Key changes to the CPI in 2009 Results Looking forward Objectives of the CPI CPI is a measure of average price changes
PORTFOLIO COMMITTEE ON RURAL DEVELOPMENT AND LAND REFORM 3 MAY 2017
 2017 ENE ALLOCATION PORTFOLIO COMMITTEE ON RURAL DEVELOPMENT AND LAND REFORM 3 MAY 2017 1 Branches allocation to Total Branches Final ENE allocation % baseline R'000 % Administration 1,721,620 16.9% Ministerial
Knowledge is too important to leave in the hands of the bosses INFLATION MONITOR MARCH 2018
 Knowledge is too important to leave in the hands of the bosses INFLATION MONITOR MARCH 2018 1 The Consumer Price Index (CPI) declined to 3.8% in March 2018 The term inflation means a sustained increase
Commission District 4 Census Data Aggregation
 Commission District 4 Census Data Aggregation 2011-2015 American Community Survey Data, U.S. Census Bureau Table 1 (page 2) Table 2 (page 2) Table 3 (page 3) Table 4 (page 4) Table 5 (page 4) Table 6 (page
RANDFONTEIN LOCAL MUNICIPALITY Municipal Profile
 introduction The Housing Development Agency ("HDA") is a national public development agency that promotes sustainable communities by making well located and appropriately planned land and buildings available
CONSTRUCTION MONITOR Transformation Q4 2014
 CONSTRUCTION MONITOR Transformation Q4 2014 CIDB CONSTRUCTION MONITOR - TRANSFORMATION; JANUARY 2015 1. Introduction 1 2. Transformation of the Construction Industry 2 2.1 Transformation Summit (November
A COMPARISON OF INFLATION EXPECTATIONS AND INFLATION CREDIBILITY IN SOUTH AFRICA: RESULTS FROM SURVEY DATA
 SAJEMS NS 14 (2011) No 3 263 A COMPARISON OF INFLATION EXPECTATIONS AND INFLATION CREDIBILITY IN SOUTH AFRICA: RESULTS FROM SURVEY DATA Jannie Rossouw SA Reserve Bank and Department of Economics, University
Northwest Census Data Aggregation
 Northwest Census Data Aggregation 2011-2015 American Community Survey Data, U.S. Census Bureau Table 1 (page 2) Table 2 (page 2) Table 3 (page 3) Table 4 (page 4) Table 5 (page 4) Table 6 (page 5) Table
Considerations in City Economic Development Strategy
 Considerations in City Economic Development Strategy Johannesburg City Improvement District Forum ERIS Properties. 3 Gwen Lane. 3 February 2015 Thomas Scott, Chief Economist, DED, City of Johannesburg
Riverview Census Data Aggregation
 Riverview Census Data Aggregation 2011-2015 American Community Survey Data, U.S. Census Bureau Table 1 (page 2) Table 2 (page 2) Table 3 (page 3) Table 4 (page 4) Table 5 (page 4) Table 6 (page 5) Table
Any changes in media consumption may or may not be an indication of shifting performance in the marketplace.
 MEDIA RELEASE 4 November 2013 SAARF RAMS NOV 2013 A new benchmark for radio listening SAARF RAMS Nov 2013 establishes a new trend line for radio listening data in South Africa, following the inclusion
KING SABATA DALINDYEBO LOCAL MUNICIPAILTY SOCIO ECONOMIC REVIEW AND OUTLOOK, 2017
 KING SABATA DALINDYEBO LOCAL MUNICIPAILTY SOCIO ECONOMIC REVIEW AND OUTLOOK, 2017 0 P a g e Published by ECSECC Postnet Vincent, P/Bag X9063, Suite No 302, Vincent 5247 www.ecsecc.org 2017 Eastern Cape
Zipe Code Census Data Aggregation
 Zipe Code 66101 Census Data Aggregation 2011-2015 American Community Survey Data, U.S. Census Bureau Table 1 (page 2) Table 2 (page 2) Table 3 (page 3) Table 4 (page 4) Table 5 (page 4) Table 6 (page 5)
Zipe Code Census Data Aggregation
 Zipe Code 66103 Census Data Aggregation 2011-2015 American Community Survey Data, U.S. Census Bureau Table 1 (page 2) Table 2 (page 2) Table 3 (page 3) Table 4 (page 4) Table 5 (page 4) Table 6 (page 5)
BUFFALO CITY METRO MUNICIPALITY SOCIO ECONOMIC REVIEW AND OUTLOOK, 2017
 BUFFALO CITY METRO MUNICIPALITY SOCIO ECONOMIC REVIEW AND OUTLOOK, 2017 Published by ECSECC Postnet Vincent, P/Bag X9063, Suite No 302, Vincent 5247 www.ecsecc.org 2017 Eastern Cape Socio Economic Consultative
SECOND QUARTER PERFORMANCE REPORT OF THE NATIONAL HOME BUILDERS REGISTRATION COUNCIL 1 JULY 2014 TO 30 SEPTEMBER 2014
 SECOND QUARTER PERFORMANCE REPORT OF THE NATIONAL HOME BUILDERS REGISTRATION COUNCIL 1 JULY 2014 TO 30 SEPTEMBER 2014 NATIONAL DEPARTMENT OF HUMAN SETTLEMENTS Contact Mr. Mongezi Mnyani Designation Chief
Provincial Report 2009/ 2010: Gauteng
 Provincial Report 2009/ 2010: Background The provincial reports have been compiled in response to requests from stakeholders, in particular provincial committees, for provincial profiles, updates and summaries
Statistical release P0141
 Statistical release Consumer Price Index June 2015 Embargoed until: 22 July 2015 10:00 Enquiries: Forthcoming issue: Expected release date Marietjie Bennett / Anita Voges July 2015 19 August 2015 (012)
Business Partners Limited SME Confidence Index
 Business Partners Limited SME Confidence Index Fourth Quarter of 2017: October December Issued February 2018 1 RATIONALE FOR THE BUSINESS PARTNERS LIMITED SME CONFIDENCE INDEX SMEs are often punted as
Income and Non-Income Inequality in Post- Apartheid South Africa: What are the Drivers and Possible Policy Interventions?
 Income and Non-Income Inequality in Post- Apartheid South Africa: What are the Drivers and Possible Policy Interventions? Haroon Bhorat Carlene van der Westhuizen Toughedah Jacobs Haroon.Bhorat@uct.ac.za
Terms of Reference Development of the City of Tshwane Sustainability Financing Mechanism Strategy
 Terms of Reference Development of the City of Tshwane Sustainability Financing Mechanism Strategy 1. ABOUT THE SACN The South African Cities Network (SACN) as established in 2002, is a network of the nine