Chapter 6. Data Analysis and Interpretation
|
|
|
- Frank Rodgers
- 5 years ago
- Views:
Transcription
1 Chapter 6 Data Analysis and Interpretation 6.1 Introduction. 6.2 Current Ratio. 6.3 Quick Ratio. 6.4 Debt Equity Ratio. 6.5 Interest Coverage Ratio. 6.6 Operating Profit Margin Ratio. 6.7 Net Profit Margin Ratio. 6.8 Inventory Turnover Ratio. 6.9 Dividend Payout Ratio Return on Capital Employed Return on Owners Equity. References.
2 6.1 Introduction: Chapter 6 Data Analysis and Interpretation Financial efficiency is a measurement of the organization s ability to run its business and managed its financial resources to achieve overall success in the business related activities. Financial Efficiency measures the strength with which a business uses it assets to generate gross revenue and the effectiveness of producing, purchasing, pricing, financing, and marketing decisions. The overall financial efficiency of the Steel Industry can be described from the point of view of duration of time Short-Term and Long- Term funds, ordinary shareholders and relative contribution of owners and creditors. The long term sources of these companies include the net worth as represented by equity shares, preference shares, reserve funds plus long-term liability. The-long term liability was represented by loans from financial institutions and state governments. The shortterm sources were loans from commercial banks, sundry creditors and other provisions. According to S.K. Das 1 The Primary objectives of efficiency of financial statements are to determine the measure the efficiency of operations or the profitability from its income statement and to appraise financial strength as compared with similarly situated concern. At the micro level financial efficiency refers to the efficiency with which resources are correctly allocated among competing uses at a point of time. Financial efficiency is regarded as a measure of total efficiency and a management guide to greater efficiency and the extent of the profitability, liquidity, productivity and capital strength can be taken as a final proof of a financial efficiency. Financial efficiency directed towards evaluating the liquidity, stability, and profitability of a concern which put together of a concern. These are including measures, productivity, unit of volume of service etc. The researcher/analyst should not be interested only in a short span of time only. Rather, his interest extends mainly beyond that. Indeed, a business corporation, which is financially sound today, may eventually lose its strength in the long period if it fails to sustain the long series of risks and losses. Keeping in view this, certain ratios have been
3 calculated to analyze the financial efficiency of the Indian Steel Industry with the help of selected companies form the Indian Steel Industry to know their long-term solvency. However there are few factors affecting to the firm s financial efficiency. In present study financial efficiency is measured by Liquidity Ratio, Profitability Ratios, solvency ratio, Efficiency Ratio, and other key ratio to measure the financial efficiency of Indian Steel Industry. Ratio Analysis 2 is a form of Financial Statement Analysis that is used to obtain a quick indication of a firm's financial efficiency in several key areas. These relationships between the financial statement accounts help investors, creditors, and internal company management understand how well a business is performing and areas of needing improvement. Financial ratios 3 are the most common and widespread tools used to analyze a business' financial standing. Ratios are easy to understand and simple to compute. They can also be used to compare different companies in different industries. Since a ratio is simply a mathematically comparison based on proportions, big and small companies can be use ratios to compare their financial information. In a sense, financial ratios don't take into consideration the size of a company or the industry. Ratios allow us to compare companies across industries, big and small, to identify their strengths and weaknesses. Financial ratios are often divided up into six main categories: liquidity, solvency, efficiency, profitability, market prospect, investment leverage, and coverage. The following ratios have been used to analyze the financial efficiency of the selected steel companies from Indian Steel industry: Current Ratio (CR) Quick Ratio (QR) Debt Equity Ratio (DER) Interest Coverage Ratio (ICR) Operating Profit Margin Ratio Net Profit Margin Ratio (NPM) Inventory Turnover Ratio (ITR) Dividend Payout Ratio (DPR) Return on Capital Employed (ROCE) Return on Net Worth (RONW)
4 6.2 Current Ratio: The Current ratio 4 measures a company s ability to repay short-term liabilities such as accounts payable and current debt using short-term assets such as cash, inventory and receivables. Another way to look at it would be the value of a company s current assets that will be converted to cash over the next twelve months compared to the value of liabilities that will mature over the same period. The Current ratio is useful as it shows whether a company has adequate resources to repay short-term debt or if it will experience cash flow problems in the near term. This most widely used ratio shows the proportion of current assets to current liabilities. It is also known as 'Working Capital Ratio' as it is a measure of working Capital available at a particular time. The ratio is obtained by dividing current assets by the current liabilities. It is a measure of short-term financial strength of the business and shows whether the business will be able to meet its current liabilities, as and when they mature. Remember that a liability which will mature within a period of 12 months is a current liability; they include creditors, bills payable, bank overdraft, outstanding expenses, provision for taxation etc. Similarly, current assets are in the form of' cash or can be readily converted into cash within a short time. They include cash, bank balance, Stock, debtors, bills receivable, prepaid expenses, accrued income, readily marketable securities etc. Current Assets Current Ratio = Current Liabilities The current ratio can give a sense of the efficiency of a company's operating cycle or its ability to turn its product into cash. Companies that have trouble getting paid on their receivables or have long inventory turnover can run into liquidity problems because they are unable to alleviate their obligations. It is always more useful to compare companies within the same industry. Generally, a current ratio of less than 1 is taken as indicative of potential future liquidity problems, while a ratio of 1.5 to 2.0 is interpreted as indicating a company on solid financial ground in terms of liquidity.
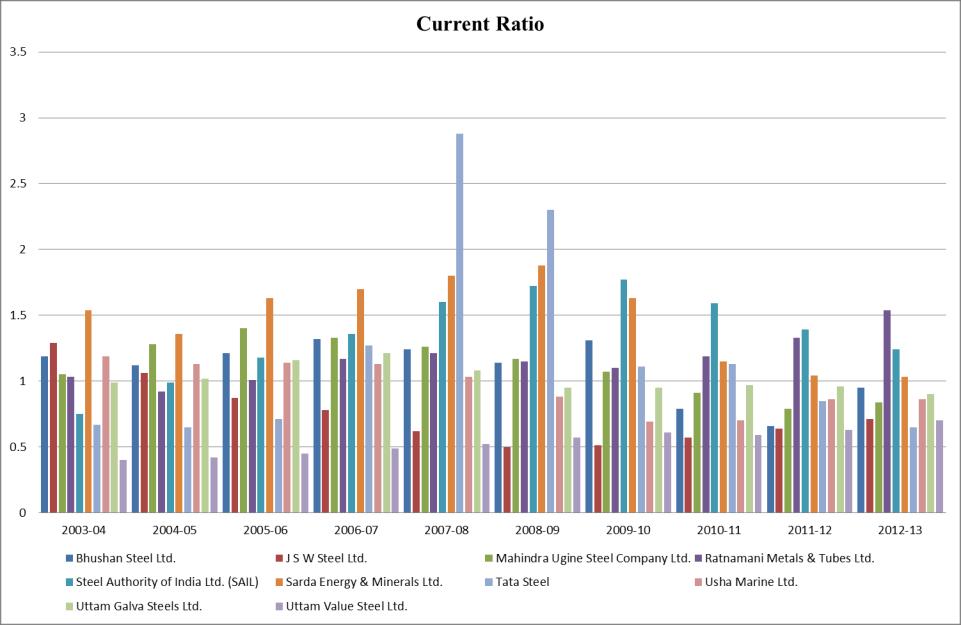
5 Table 6.1 Current Ratio Sr. No. Name of the Companies Average 1 Bhushan Steel Ltd J S W Steel Ltd Mahindra Ugine Steel Co. Ltd Ratnamani Metals & Tubes Ltd Steel Authority of India Ltd Sarda Energy & Minerals Ltd Tata Steel Ltd Usha Marine Ltd Uttam Galva Steels Ltd Uttam Value Steel Ltd Average Source: Calculated from Annual Published Report of Selected Companies.
6 Chart 6.1
7 Above table no.6.1 and Chart No. 6.1 indicates the performance of Current Ratio for the selected sample companies from Steel Industry of India and indicates the average Industry trend of Indian Steel Industry. The Bhushan Steel Limited (BSL) shows the ratio in was 1.19, which decrease in to 1.12 and it increase again in and up to 1.21 and 1.32, and then decrease again at 1.24 in , 1.14 in , and increased at 1.31 in and decreased again at 0.79 in and 0.66 in and increased at 0.95 in Across the years from to maximum current ratio is 1.32 and minimum ratio is 0.66 whereas Average performance of BSL is 1.09 and overall trend of BSL shows mix trend. When J S W Steel limited (JSWSL) shows the current ratio in was 1.29, which continuously decrease from to at 1.06 in , 0.87 in , 0.78 in , 0.62 in and 0.50 in and it start increasing from to from 0.51 in , 0.57 in , 0.64 in and 0.71 in Across the years from to maximum current ratios is 1.29 and minimum ratio is 0.50 whereas Average performance of J S W Steel Limited is 0.76 and it shows increasing trend after to When Mahindra Ugine Steel Company Limited (MUSCL) shows the current ratio in was 1.05, which increase in and to up 1.28 and 1.4 and then from to shows declining trend in current ratio of MUSCL from 1.33 to 0.79 end of the year it increase by 0.05 point and stayed at 0.84 in Across the years from to maximum current ratio is 1.40 and minimum ratio is 0.79 whereas average performance of MUSCL is 1.11 and overall performance of MUSCL shows mix trend. When Ratnamani Metals & Tubes Limited (RMTL) shows the current ratio in was 1.03, which decrease in at 0.92 and then increases till at 1.21 and once again it decreased at 1.15 and 1.1 by and After current ratio gives increasing trend for the mentioned period till by 1.19, 1.33 and Across the years from to maximum current ratio is 1.54 and minimum
8 ratio is 0.92 whereas average performance of RMTL is 1.17 and overall performance of RMTL shows mix trend. When Steel Authority of India Limited (SAIL) shows the current ratio in was 0.75, which shows increasing trend from to from 0.99 to 1.77 and then start decreasing till by 1.59 in , 1.39 in and 1.24 in Across the years from to maximum current ratio is 1.77 and minimum ratio is 0.99 whereas average performance of SAIL is 1.36 and overall performance of SAIL shows increasing in till 2010 and then declining trend. When Sarda Energy & Minerals Limited (SEML) shows the current ratio in was 1.54, which decreased in at 1.36 then the current ratio increased till from 1.63 in , 1.70 in , 1.80 in and 1.88 in and then started decreasing from to by 1.63 in , 1.15 in , 1.04 in and 1.03 in Across the years from to maximum current ratio is 1.88 and minimum ratio is 1.03 whereas average performance of SEML is 1.48 and overall performance of SEML shows mix trend. When Tata Steel Limited (TSL) shows the current ratio in was 0.67, which decreased in at 0.65 then the current ratio increased till from 0.71 in , 1.27 in , 2.88 in and then started decreasing from to by 2.30 in and 1.11 in , for it increased by 0.02 and shows 1.13 then again starts decreasing in at 0.85 and 0.65 in Across the years from to maximum current ratio is 2.88 and minimum ratio is 0.65 whereas average performance of TSL is 1.22 and overall performance of TSL shows mix trend. When Usha Marine Limited (UML) shows the current ratio in was 1.19, which decreased in at 1.13 and in increase by 0.01 and shows 1.14 in this ratio comes again at 1.13 and then starts decreasing for next three years from to from 1.03 to 0.69 after ratio increased at 0.70 and then remain stable for the next two years at 0.86 for and Across the years from
9 to maximum current ratio is 1.19 and minimum ratio is 0.69 whereas average performance of UML is 0.96 and overall performance of UML shows mix trend. When Uttam Galva Steel Limited (UGSL) shows the current ratio in was 0.99, which increasing till from 1.02 in , 1.16 in , and 1.21 in , this ratio decrease in at 1.08 and then decrease by 0.07 and stable for two years from and at 0.95, in this ratio increased by 0.02 and then decreased in at 0.96 and 0.90 in Across the years from to maximum current ratio is 1.21 and minimum ratio is 0.90 whereas average performance of UHSL is 1.02 and overall performance of UGSL shows mix trend. When Uttam Value Steel Limited (UVSL) shows the current ratio in was 0.40, which shows increasing trend from to from 0.42 in , 0.45 in , 0.49 in , 0.52 in , 0.57 in and 0.61 in , for one year it reduced by 0.02 and then again it increases by 0.63 and 0.70 in and Across the years from to maximum current ratio is 0.70 and minimum ratio is 0.42 whereas average performance of UVSL is 0.54 and overall performance of UVSL shows mix trend. Test of Hypotheses for Current Ratio ANOVA F Test Null Hypothesis Ho: The variance arose in the Current Ratio over the years and among the various companies did not differ significantly Alternative Hypothesis H1: The variance arose in the Current Ratio over the years and among the various companies differs significantly. If the, Null Hypothesis is accepted, the Alternative. Hypothesis will be rejected or vice versa.
10 Table No. 6.2 ANOVA F Test for Current Ratio Source of Variation SS DF MS F P-value F crit Between the Companies Between the Years Error Total In above table 6.2 indicates the calculated value of F is higher than the tabulated F value at 5% level of significance in between the companies. Hence, the null hypothesis stands rejected i.e. there is no significant difference between the selected companies from Indian Steel Industry. However, the difference in between the years where significant because the calculated value of F is smaller than the tabulated F value at 5% level of significance in between the years Hence we Accepted the null hypotheses. 6.3 Quick Ratio: The quick ratio 5 or acid test ratio is a liquidity ratio that measures the ability of a company to pay its current liabilities when they come due with only quick assets. Quick assets are current assets that can be converted to cash within 90 days or in the short-term. Cash, cash equivalents, short-term investments or marketable securities, and current accounts receivable are considered quick assets. Short-term investments or marketable securities include trading securities and available for sale securities that can easily be converted into cash within the next 90 days. Marketable securities are traded on an open market with a known price and readily available buyers. Any stock on the New York Stock Exchange would be considered a marketable security because they can easily be sold to any investor when the market is open. The quick ratio is often called the acid test ratio in reference to the historical use of acid to test metals for gold by the early miners. If the metal passed the acid test, it was pure gold. If metal failed the acid test by corroding from the acid, it was a base metal and of no value. The acid test of finance shows how well a company can quickly convert its assets into cash in order to pay off its current liabilities. It also shows the level of quick assets to current liabilities.
11 The Quick Ratio 6 recognizes that, for many firms, Inventories can be rather illiquid. If these Inventories had to be sold off in a hurry to meet an obligation the firm might have difficulty in finding a buyer and the inventory items would likely have to be sold at a substantial discount from their fair market value. This ratio attempts to measure the ability of the firm to meet its obligations relying solely on its more liquid Current Asset accounts such as Cash and Accounts Receivable. This ratio is calculated by dividing Current Assets less Inventories by Current Liabilities. Quick ratio is a measure of the instant debt paying capacity of the business enterprise. It is a measure of the extent to which liquid resources are immediately available to meet current obligations. A quick ratio of 1: 1 is considered good/favorable for a company. Quick Assets Quick Ratio = Quick Liability
12 Table 6.3 Quick Ratio Sr. No. Name of the Companies Average 1 Bhushan Steel Ltd J S W Steel Ltd Mahindra Ugine Steel Co. Ltd Ratnamani Metals & Tubes Ltd Steel Authority of India Ltd Sarda Energy & Minerals Ltd Tata Steel Ltd Usha Marine Ltd Uttam Galva Steels Ltd Uttam Value Steel Ltd Industry Average Source: Calculated from Annual Published Report of Selected Companies.
13 Chart 6.2
14 Above table no.6.3 and Chart No. 6.2 indicates the performance of Quick Ratio for the selected sample companies from Steel Industry of India and indicates the average Industry trend of Indian Steel Industry. The Bhushan Steel Limited (BSL) shows the ratio in was 1.08, which shows decreasing trend from to wherein it was 0.90, 0.89 in , 0.78 in , 0.51 in and 0.41 in This ratio bit increased in at 0.53 and again decreased for at For and this ratio shows increasing at 0.96 and Across the years from to maximum current ratio is 1.15 and minimum ratio is 0.36 whereas Average performance of BSL is 0.76 and overall trend of BSL shows mix trend. When J S W Steel limited (JSWSL) shows the Quick Ratio in was 0.82, which increased at 0.84 in and 0.86 in , where this ratio shows decreasing trend from to by 0.66 in , 0.41 in and 0.35 in , whereas this ratio shows increasing trend from to by 0.40 in , 0.49 in , 0.68 in and 0.73 in Across the years from to maximum Quick Ratios is 0.86 and minimum ratio is 0.35 whereas Average performance of J S W Steel Limited is 0.73 and it shows increasing trend after to When Mahindra Ugine Steel Company Limited (MUSCL) shows the Quick Ratio in was 1.03, which increase in and to up 1.12 and 1.61 and then from it decreased at 1.33 and again increased at 1.60 in , in this ratio decreased and again come at 1.33 and then decreasing till at 1.25 in , 1.04 in and 0.99 in whereas in this ratio increase at Across the years from to maximum Quick Ratio is 1.73 and minimum ratio is 0.99 whereas average performance of MUSCL is 1.30 and overall performance of MUSCL shows mix trend. When Ratnamani Metals & Tubes Limited (RMTL) shows the Quick Ratio in was 0.77, which decrease in at 0.71 and then increase 0.98 in and decrease again at 0.75 in and after that this ratio increase till at 1.02 in
15 , 1.33 in and 3.11 in , in this ratio decreased at 1.15 and increase in at 2.39 and decreased again in at Across the years from to maximum Quick Ratio is 3.11 and minimum ratio is 0.75 whereas average performance of RMTL is 1.99 and overall performance of RMTL shows mix trend. When Steel Authority of India Limited (SAIL) shows the Quick Ratio in was 1.18, which increased by 2.12 in and decreased at 1.18 in , this ratio increased from to as 2.54 in , 3.04 in and 3.19 in after the this ratio shows declining trends as in ratio was 2.76, 2.26 in , 1.23 in and 0.98 in Across the years from to maximum Quick Ratio is 3.19 and minimum ratio is 0.98 whereas average performance of SAIL is 2.11 and overall performance of SAIL shows mix trend. When Sarda Energy & Minerals Limited (SEML) shows the Quick Ratio in was 5.16, which increased in at 8.82 and then the decreased in at 6.45, 2.04 in whereas this ratio increased in by 0.05 and in increase at 5.57 and then after decreased in at 1.55 and increased in and at 1.67 and 2.16 in this ratio decreased by 0.04 and stood at Across the years from to maximum Quick Ratio is 8.82 and minimum ratio is 1.55 whereas average performance of SEML is 3.76 and overall performance of SEML shows mix trend. When Tata Steel Limited (TSL) shows the Quick Ratio in was 0.71, which increased in at 0.82 then the ratio decreased at 0.73 in and increased at 3.23 in and 8.92 in This ratio decreased in at 1.20 and again increased at 1.38 in and 1.58 in , where this ratio decreased in and at 0.69 and Across the years from to maximum Quick Ratio is 8.92 and minimum ratio is 0.53 whereas average performance of TSL is 1.98 and overall performance of TSL shows mix trend. When Usha Marine Limited (UML) shows the Quick Ratio in was 1.52, which shows decreasing trends from to at 1.18 in , 1.13 in ,
16 1.08 in , 0.86 in , 0.71 in , and 0.28 in in and this ratio increased at 0.38 and 0.52 and decreased again in at Across the years from to maximum Quick Ratio is 1.52 and minimum ratio is 0.28 whereas average performance of UML is 0.82 and overall performance of UML shows mix trend. When Uttam Galva Steel Limited (UGSL) shows the Quick Ratio in was 0.35, which increased in and at 0.63 and 1.05 and decreased again for next two years and at 0.79 and 0.48, it increased 0.70 and 0.87 in and , in it decreased at 0.49 and then increase for next two year at 0.58 and 0.71 in and Across the years from to maximum Quick Ratio is 1.05 and minimum ratio is 0.48 whereas average performance of UGSL is 0.67 and overall performance of UGSL shows mix trend. When Uttam Value Steel Limited (UVSL) shows the Quick Ratio in was 1.04, which decreased in and at 0.52 and 0.38 and decreased again for next three years , and at 0.42, 0.49 and 0.61, it increased 0.46 and 0.45 in and , and then increase for next two year at 0.51 and 0.55 in and Across the years from to maximum Quick Ratio is 1.04 and minimum ratio is 0.38 whereas average performance of UVSL is 0.54 and overall performance of UVSL shows mix trend. Test of Hypotheses for Quick Ratio ANOVA F Test Null Hypothesis Ho: The variance arose in the Quick Ratio over the years and among the various companies did not differ significantly Alternative Hypothesis H1: The variance arose in the Quick Ratio over the years and among the various companies differs significantly.
17 If the, Null Hypothesis is accepted, the Alternative. Hypothesis will be rejected or vice versa. Table No. 6.4 ANOVA F Test for Quick Ratio Source of Variation SS DF MS F P-value F crit Between the Companies Between the Years Error Total In above table 6.4 indicates the calculated value of F is higher than the tabulated F value at 5% level of significance in between the companies. Hence, the null hypothesis stands rejected i.e. there is no significant difference between the selected companies from Indian Steel Industry. However, the difference in between the years where significant because the calculated value of F is smaller than the tabulated F value at 5% level of significance in between the year and hence we Accepted the null hypotheses Debt Equity Ratio The Debt to Equity Ratio 7 provides an indication of a company s capital structure and whether the company is more reliant on borrowings (debt) or shareholder capital (equity) to fund assets and activities. Contrary to what many believe, debt is not necessarily a bad thing. Debt can be positive, provided it is used for productive purposes such as purchasing assets and improving processes to increase net profits. Acceptable debt to equity ratios may also vary across industries. Generally, companies that are capital intensive tend to have higher ratios because of the requirement to invest more heavily in fixed assets. A higher ratio generally indicates greater risk. Greater debt can result in volatile earnings due to additional interest expense as well as increased vulnerability to business downturns. But as with all other ratios, the DE ratio will be more meaningful when compared over a period of time. A change in ratios could mean that previous investments
18 are starting to pay off, leading to higher retained earnings and, therefore, higher shareholder equity. Total debt DE ratio = Shareholders equity The purpose of this ratio is to find out the amount of capital supplied to a business enterprise by the owners and also of asset 'cushion' available to creditors on liquidation. Generally acceptable norm of this ratio is 1: 1. Theoretically, the higher are the interests of the proprietors as compared with that of creditors, the more solid would be the financial conditions of a business. Significantly, this ratio holds the same importance as the current ratio in the analysis of short-term financial position. A higher ratio means that outside creditors have a larger claim than the owners of the business. The pressure from creditors would increase and their interference will also increase. The company with high-debt position will have to accept stricter conditions from the lenders, while borrowing money.
19 Table No. 6.5 Debt Equity Ratio Sr. No. Name of the Companies Average 1 Bhushan Steel Ltd J S W Steel Ltd Mahindra Ugine Steel Co. Ltd Ratnamani Metals & Tubes Ltd Steel Authority of India Ltd Sarda Energy & Minerals Ltd Tata Steel Ltd Usha Marine Ltd Uttam Galva Steels Ltd Uttam Value Steel Ltd Industry Average Source: Calculated from Annual Published Report of Selected Companies.
20 Chart No. 6.3
21 Above table no.6.5 and Chart No. 6.3 indicates the performance of Debt Equity Ratio for the selected sample companies from Steel Industry of India and indicates the average Industry trend of Indian Steel Industry. The Bhushan Steel Limited (BSL) shows the Debt Equity Ratio in was 1.57, which shows increasing trend from to wherein it was 1.70, 2.07 in , 2.51 in , 3.16 in and 3.77 in This ratio bit increased in at 3.23 and then declining for at 2.83, 2.78 in and then increased in at Across the years from to maximum Debt Equity Ratio is 3.77 and minimum ratio is 1.70 whereas Average performance of BSL is 2.66 and overall trend of BSL shows mix trend. When J S W Steel limited (JSWSL) shows the Debt Equity Ratio in was 4.90, which decreased at 1.85 in , 1.06 in and 0.83 in wherein this ratio shows increasing trend from to by 0.88 in , 1.20 in and 1.29 in , whereas this ratio decreased in at 0.87 and 0.78 in and in ratio shows Across the years from to maximum Debt Equity Ratios is 4.90 and minimum ratio is 0.78 whereas Average performance of J S W Steel Limited is 1.45 and overall trend of JSW Steel shows mix trend. When Mahindra Ugine Steel Company Limited (MUSCL) shows the Debt Equity Ratio in was 1.64, which decrease in and to by 1.60 and 0.68 and then from to it increased at 0.96 in , 1.46 in , 1.83 in , 1.99 in and 2.03 in and again decreased at 1.77 in and 1.46 in Across the years from to maximum Debt Equity Ratio is 2.03 and minimum ratio is 0.68 whereas average performance of MUSCL is 1.49 and overall performance of MUSCL shows mix trend. When Ratnamani Metals & Tubes Limited (RMTL) shows the Debt Equity Ratio in was 0.36, which increase in to at 0.70 in , 1.18 in and 1.31 in , and then decrease at 0.91 in and 0.67 in and then increase again at 0.79 in and after that this ratio decrease till at 0.72 in , 0.56 in and 0.36 in Across the years from to
22 maximum Debt Equity Ratio is 1.31 and minimum ratio is 0.36 whereas average performance of RMTL is 0.76 and overall performance of RMTL shows mix trend. When Steel Authority of India Limited (SAIL) shows the Debt Equity Ratio in was 2.86, which decreased from to by 0.94 in , 0.44 in , 0.28 in and 0.18 in and then increased from to at 0.21 in , 0.39 in and 0.51 in , and then decreased 0.46 in and bit increased in at Across the years from to maximum Debt Equity Ratio is 2.86 and minimum ratio is 0.18 whereas average performance of SAIL is 0.67 and overall performance of SAIL shows mix trend. When Sarda Energy & Minerals Limited (SEML) shows the Debt Equity Ratio in was 1.19, which decreased in at 0.96 and then the increased in at 1.36, and decreased 1.12 in , 0.87 in whereas this ratio increased in by 0.94 and decreased in by 0.92 and 0.88 in , and then after increased in at 0.91 and decreased in at Across the years from to maximum Debt Equity Ratio is 1.36 and minimum ratio is 0.80 whereas average performance of SEML is 1.00 and overall performance of SEML shows mix trend. When Tata Steel Limited (TSL) shows the Debt Equity Ratio in was 0.99, which decreased in and at 0.53 and 0.31 then the ratio increased from to at 0.51 in , 0.67 in , 0.78 in and stable in at 0.78, and then after it decreased from to at 0.64 in , 0.55 in and 0.50 in Across the years from to maximum Debt Equity Ratio is 0.99 and minimum ratio is 0.31 whereas average performance of TSL is 0.50 and overall performance of TSL shows mix trend. When Usha Marine Limited (UML) shows the Debt Equity Ratio in was 2.03, which shows decreasing trends from to at 1.94 in , 1.46 in , 1.11 in , and 1.05 in , and then increased in by 1.26, then decreased at 0.92 in and 0.80 in , after this ratio increased at 1.30 in and 1.75 in Across the years from to maximum Debt
23 Equity Ratio is 2.03 and minimum ratio is 0.80 whereas average performance of UML is 1.36 and overall performance of UML shows mix trend. When Uttam Galva Steel Limited (UGSL) shows the Debt Equity Ratio in was 2.75, which decreased in at 2.17 and increased in at 2.24, in ratio decreased at 2.06, 1.58 in and 1.57 in , ratio increased in and by 2.00 and 2.20 and then again decreased at 2.05 in and 1.94 in Across the years from to maximum Debt Equity Ratio is 2.75 and minimum ratio is 1.57 whereas average performance of UGSL is 2.06 and overall performance of UGSL shows mix trend. When Uttam Value Steel Limited (UVSL) shows the Debt Equity Ratio in was , which decreased in at and in , ratio increased in at -3.67, in , in , and , and in and shows highest in at 6.01 and 0.96 in Across the years from to maximum Debt Equity Ratio is 6.01 and minimum ratio is whereas average performance of UVSL is and overall performance of UVSL shows mix trend. Test of Hypotheses for Debt to Equity Ratio ANOVA F Test Null Hypothesis Ho: The variance arose in the Debt to Equity Ratio over the years and among the various companies did not differ significantly Alternative Hypothesis H1: The variance arose in the Debt to Equity Ratio over the years and among the various companies differs significantly. If the, Null Hypothesis is accepted, the Alternative. Hypothesis will be rejected or vice versa.
24 Table 6.6 ANOVA F Test for Debt to Equity Ratio Source of Variation SS DF MS F P-value F crit Between the Companies Between the Years Error Total In above table 6.6 indicates the calculated value of F is higher than the tabulated F value at 5% level of significance in between the companies. Hence, the null hypothesis stands rejected i.e. there is no significant difference between the selected companies from Indian Steel Industry. However, the difference in between the years where significant because the calculated value of F is smaller than the tabulated F value at 5% level of significance in between the years and hence we Accepted the null hypotheses. 6.5 Interest Coverage Ratio: A company s Interest Cover Ratio 8 measures its ability to meet interest expenses on debt using profits. Generally, a ratio of greater than two is regarded as a healthy position to cover interest. Interest Coverage ratio (PBDIT/Interest) measures the margin of safety between the earnings of the firm and its interest liability. A high ratio means the firm can easily meet the interest burden even if earnings before interest and tax suffer a considerable decline. A low ratio may result in financial embarrassment if earnings decline. The lower the ratio, the more the company is burdened by debt expense. When a company's interest coverage ratio is 1.5 or lower, its ability to meet interest expenses may be questionable. An interest coverage ratio below 1 indicates the company is not generating sufficient revenues to satisfy interest expenses. A ratio under 1 means that the company is having problems generating enough cash flow to pay its interest expenses. Ideally you want the ratio to be over 1.5.
25 This ratio indicates the extent to which earnings may fall without causing any embarrassment to the firm regarding the payment of the interest charges. A higher ratio is desirable; but too high a ratio indicates that the firm is very conservative in using debt and that it is not using credit to the best advantage of shareholders. A lower ratio indicates excessive use of debt or inefficient operations. Earnings before Interest and Tax Interest Coverage Ratio = Interest Expense A company that barely manages to cover its interest costs may easily fall into bankruptcy if its earnings suffer for even a single month. To understand more on the importance of this ratio, read Why Interest Coverage Matters to Investors.
26 Sr. No. Name of the Companies Table No. 6.7 Interest Coverage Ratio Average 1 Bhushan Steel Ltd J S W Steel Ltd Mahindra Ugine Steel Co. Ltd Ratnamani Metals & Tubes Ltd Steel Authority of India Ltd Sarda Energy & Minerals Ltd Tata Steel Ltd Usha Marine Ltd Uttam Galva Steels Ltd Uttam Value Steel Ltd Industry Average Source: Calculated from Annual Published Report of Selected Companies.
27 Chart 6.4
28 Above table no. 6.7 and Chart No. 6.4 indicates the performance of Interest Coverage Ratio for the selected sample companies from Steel Industry of India and indicates the average Industry trend of Indian Steel Industry. The Bhushan Steel Limited (BSL) shows the Interest Coverage Ratio in was 2.57, which increased in at 3.09, and decreased at 2.92 in and increased again in by 5.34 and then decreased to 4.93 in and 3.22 in where it increased at 6.48 in and then after it decreased 4.08 in , 2.30 in and 1.94 in Across the years from to maximum Interest Coverage Ratio is 6.48 and minimum ratio is 1.94 whereas Average performance of BSL is 3.69 and overall trend of BSL shows mix trend. When J S W Steel limited (JSWSL) shows the Interest Coverage Ratio in was 1.73, which increased at 4.10 in , and decreased 3.53 in and increased 5.71 in , and 6.02 in , in it decreased by 2.76 and increased again 4.13 in and 4.25 in , and then decreased 3.43 in and 2.65 in Across the years from to maximum Interest Coverage Ratios is 6.02 and minimum ratio is 2.65 whereas Average performance of J S W Steel Limited is 3.83 and overall trend of JSW Steel shows mix trend. When Mahindra Ugine Steel Company Limited (MUSCL) shows the Interest Coverage Ratio in was 1.43, which increase in and to by 6.75 and 9.55 and then decreased from to at 6.76 in , 2.54 in , and 0.21 in , it increased at 1.21 in and then decreased 0.78 in , 0.37 in and in Across the years from to maximum Interest Coverage Ratio is 9.55 and minimum ratio is whereas average performance of MUSCL is 2.96 and overall performance of MUSCL shows mix trend. When Ratnamani Metals & Tubes Limited (RMTL) shows the Interest Coverage Ratio in was 3.13, which increased in to at 5.79 in , 5.81 in , 6.84 in , and 8.37 in , and then decreased 6.30 in and then increased again at 7.55 in , bit decreased at 7.17 in and after that this ratio increased till at in and in Across the
29 years from to maximum Interest Coverage Ratio is and minimum ratio is 5.79 whereas average performance of RMTL is 7.90 and overall performance of RMTL shows mix trend. When Steel Authority of India Limited (SAIL) shows the Interest Coverage Ratio in was 3.75, which increased in at 15.36, and decreased at in , and increased again at in and in and decreased at in , in , in , 6.23 in and 5.33 in Across the years from to maximum Interest Coverage Ratio is and minimum ratio is 5.33 whereas average performance of SAIL is and overall performance of SAIL shows mix trend. When Sarda Energy & Minerals Limited (SEML) shows the Interest Coverage Ratio in was 12.11, which decreased in at and 2.84 in then the increased in at 4.09 and 9.73 in , and decreased at 6.89 in , 4.97 in , 2.94 in and 2.48 in whereas this ratio increased in by Across the years from to maximum Interest Coverage Ratio is and minimum ratio is 2.48 whereas average performance of SEML is 6.16 and overall performance of SEML shows mix trend. When Tata Steel Limited (TSL) shows the Interest Coverage Ratio in was 12.74, which increased in and at and then the ratio increased from to at in , 8.67 in , 5.91 in and in at 4.42 and then increased in at 6.63 and then decreased again in and at 6.12 and Across the years from to maximum Interest Coverage Ratio is and minimum ratio is 4.42 whereas average performance of TSL is and overall performance of TSL shows mix trend. When Usha Marine Limited (UML) shows the Interest Coverage Ratio in was 1.18, which shows increasing trends from to at 1.69 in , 2.22 in , 2.79 in , and 3.32 in , and then decreased in at 2.65, 2.10 in and 1.80 in , and 0.83 in and increased 1.03 in Across the years from to maximum Interest Coverage Ratio is 3.32 and
30 minimum ratio is 0.83 whereas average performance of UML is 1.96 and overall performance of UML shows mix trend. When Uttam Galva Steel Limited (UGSL) shows the Interest Coverage Ratio in was 1.99 which increased in at 2.33 and decreased at 1.96 in , and 1.71 in and ratio increased in at 1.86, and decreased again in at 1.56 and increased at 1.80 in , and decreased at 1.53 in and increased at 1.57 in and decreased at 1.38 in Across the years from to maximum Interest Coverage Ratio is 2.33 and minimum ratio is 1.38 whereas average performance of UGSL is 1.77 and overall performance of UGSL shows mix trend. When Uttam Value Steel Limited (UVSL) shows the Interest Coverage Ratio in was which increased in at 2.93 and decreased at in , and increased at in and decreased in at -0.70, in and increased again in at and increased at in , and increased at 0.44 in and 0.97 in Across the years from to maximum Interest Coverage Ratio is 2.93 and minimum ratio is whereas average performance of UVSL is and overall performance of UVSL shows mix trend. Test of Hypotheses for Interest Coverage Ratio ANOVA F Test Null Hypothesis Ho: The variance arose in the Interest Coverage Ratio over the years and among the various companies did not differ significantly Alternative Hypothesis H1: The variance arose in the Interest Coverage Ratio over the years and among the various companies differs significantly. If the, Null Hypothesis is accepted, the Alternative. Hypothesis will be rejected or vice versa.
31 Table 6.8 ANOVA F Test for Interest Coverage Ratio Source of Variation SS DF MS F P-value F crit Between the Companies Between the Years Error Total In above table 6.8 indicates the calculated value of F is higher than the tabulated F value at 5% level of significance in between the companies. Hence, the null hypothesis stands rejected i.e. there is no significant difference between the selected companies from Indian Steel Industry. However, the difference in between the years where significant because the calculated value of F is smaller than the tabulated F value at 5% level of significance in between the years and hence we Accepted the null hypotheses Operating Profit Margin Ratio: This ratio indicates the relationship between operating profit and net sales in the form of percentage. Operating Profit arrived at by adjusting all non-operating expenses and incomes in net profit in the other words it can be said profit before depreciation and taxes. A consistently high ratio tells us the effective and efficient operation of the business. This ratio helps find out the profit arising out of pure production process i.e. the main business of production and sales. Thereby reflecting the effect of other incomes and expenses included in net profit. Operation Profit Operating Profit Ratio = X 100 Net Sales Operation profit = Sales - (Cost of goods sold + operational expenditure) Operating Margin 9 is a measurement of what proportion of a company's revenue is left over after paying for variable costs of production such as wages, raw materials, etc. A
32 healthy operating margin is required for a company to be able to pay for its fixed costs, such as interest on debt. Operating margin 10 gives analysts an idea of how much a company makes (before interest and taxes) on each dollar of sales. When looking at operating margin to determine the quality of a company, it is best to look at the change in operating margin over time and to compare the company's yearly or quarterly figures to those of its competitors. If a company's margin is increasing, it is earning more per dollar of sales. If the higher is the margin, the better financial condition of the firm.
33 Table No. 6.9 Operating Profit Margin Ratio Sr. No. Name of the Companies Average 1 Bhushan Steel Ltd J S W Steel Ltd Mahindra Ugine Steel Co. Ltd Ratnamani Metals & Tubes Ltd Steel Authority of India Ltd Sarda Energy & Minerals Ltd Tata Steel Ltd Usha Marine Ltd Uttam Galva Steels Ltd Uttam Value Steel Ltd Industry Average Source: Calculated from Annual Published Report of Selected Companies.

34 Chart No. 6.5
35 Above table no. 6.9 and Chart No. 6.5 indicates the performance of Operating Profit Margin Ratio for the selected sample companies from Steel Industry of India and indicates the average Industry trend of Indian Steel Industry. The Bhushan Steel Limited (BSL) shows the Operating Profit Margin Ratio in was 0.18, which decreased in at 0.16 and at 0.15, and increased at 0.18 in , 0.21 in , and stable in at 0.21 and increased again in by 0.28 and 0.30 in and stable in at 0.30 and then increased to 0.31 in Across the years from to maximum Operating Profit Margin Ratio is 0.31 and minimum ratio is 0.15 whereas Average performance of BSL is 0.23 and overall trend of BSL shows mix trend. When J S W Steel limited (JSWSL) shows the Operating Profit Margin Ratio in was 0.44, which decreased at 0.36 in , 0.33 in and remain stable in and continue decreased at 0.32 in , 0.17 in and increased at 0.27 in and 0.21 in , 0.16 in and bit increased at 0.17 in Across the years from to maximum Operating Profit Margin Ratios is 0.44 and minimum ratio is 0.16 whereas Average performance of J S W Steel Limited is 0.28 and overall trend of JSW Steel shows mix trend. When Mahindra Ugine Steel Company Limited (MUSCL) shows the Operating Profit Margin Ratio in was 0.08, which increase in and to by 0.17 and 0.19 and then decreased from to at 0.14 in , 0.11 in , and 0.03 in , it increased at 0.07 in and then decreased 0.05 in , and increased at 0.09 in and decreased again at 0.02 in Across the years from to maximum Operating Profit Margin Ratio is 0.19 and minimum ratio is 0.02 whereas average performance of MUSCL is 0.10 and overall performance of MUSCL shows mix trend. When Ratnamani Metals & Tubes Limited (RMTL) shows the Operating Profit Margin Ratio in was 0.11, which increased in to at 0.16 in , 0.20 in , and 0.23 in , and then decreased at 0.22 in , 0.17 in , and then increased 0.20 in , 0.21 in and then decreased 0.18 in
36 and increased again at 0.21 in Across the years from to maximum Operating Profit Margin Ratio is 0.23 and minimum ratio is 0.16whereas average performance of RMTL is 0.19 and overall performance of RMTL shows mix trend. When Steel Authority of India Limited (SAIL) shows the Operating Profit Margin Ratio in was 0.22, which increased in at 0.39, and decreased at 0.26 in , and increased again at 0.32 in and 0.33 in and decreased at 0.25 in , and increased again at 0.29 in , and decreased 0.21 in , 0.17 in and 0.12 in Across the years from to maximum Operating Profit Margin Ratio is 0.39 and minimum ratio is 0.12 whereas average performance of SAIL is 0.26 and overall performance of SAIL shows mix trend. When Sarda Energy & Minerals Limited (SEML) shows the Operating Profit Margin Ratio in was 0.27, which decreased in at 0.16 and 0.13 in then the increased in at 0.24 and 0.29 in , and decreased at 0.21 in , and increased 0.26 in , then decreased 0.18 in and increased 0.22 in and then decreased in by Across the years from to maximum Operating Profit Margin Ratio is 0.29 and minimum ratio is 0.13 whereas average performance of SEML is 0.22 and overall performance of SEML shows mix trend. When Tata Steel Limited (TSL) shows the Operating Profit Margin Ratio in was 0.33, which increased in at 0.42 and decreased at 0.41 in and increased again at 0.42 in , 0.45 in , and decreased again at 0.40 in and bit increased at 0.41 in , 0.43 in and then decreased again in and at 0.38 and Across the years from to maximum Operating Profit Margin Ratio is 0.45 and minimum ratio is 0.30 whereas average performance of TSL is 0.39 and overall performance of TSL shows mix trend. When Usha Marine Limited (UML) shows the Operating Profit Margin Ratio in was 0.25, which decreasing at 0.18 in and then increased at 0.22 in and again bit decreased at 0.21 in and then bit increased at 0.22 in and then
37 decreased at 0.20 in and then stable at 0.20 in and in , and decreased at 0.14 in and increased 0.19 in Across the years from to maximum Operating Profit Margin Ratio is 0.25 and minimum ratio is 0.14 whereas average performance of UML is 0.20 and overall performance of UML shows mix trend. When Uttam Galva Steel Limited (UGSL) shows the Operating Profit Margin Ratio in was 0.09 which increased in at 0.10, 0.11 in and 0.12 in and then decreased at 0.11 in , and 0.09 in and then bit increased at 0.10 in and decreased again at 0.09 in and then after increased at 0.10 in and 0.11 in Across the years from to maximum Operating Profit Margin Ratio is 0.12 and minimum ratio is 0.09 whereas average performance of UGSL is 0.10 and overall performance of UGSL shows mix trend. When Uttam Value Steel Limited (UVSL) shows the Operating Profit Margin Ratio in was 0.16 which increased in at 0.18 and decreased at 0.06 in , and stable in and then continue to decreased at 0.05 in , and 0.01 in and then after increased at 0.03 in and stable in and then increased at 0.04 in and 0.05 in Across the years from to maximum Operating Profit Margin Ratio is 0.18 and minimum ratio is 0.01 whereas average performance of UVSL is 0.07 and overall performance of UVSL shows mix trend. Test of Hypotheses for Operating Profit Margin Ratio ANOVA F Test Null Hypothesis Ho: The variance arose in the Operating Profit Margin Ratios over the years and among the various companies did not differ significantly Alternative Hypothesis H1: The variance arose in the Operating Profit Margin Ratios over the years and among the various companies differs significantly.
38 If the, Null Hypothesis is accepted, the Alternative. Hypothesis will be rejected or vice versa. Table 6.10 ANOVA F Test for Operating Profit Margin Ratio Source of Variation SS DF MS F P-value F crit Between the Company Between the Years Error Total In above table 6.10 indicates the calculated value of F is higher than the tabulated F value at 5% level of significance in between the companies. Hence, the null hypothesis stands rejected i.e. there is no significant difference between the selected companies from Indian Steel Industry. However, the difference in between the years where significant because the calculated value of F is higher than the tabulated F value at 5% level of significance in between the years, hence the null hypotheses stands rejected. 6.7 Net Profit Margin Ratio: Net Profit Ratio 11 is obtained when operating expenses, interest and taxes are deducted from the gross profit. It indicates that the proportions of sales are left to the proprietors after all costs; charges and expenses have been deducted. Net profit Ratio is differing from the operating profit ratio to sales ratio in as much as it computed after adding non-operating surplus/deficit. (Difference of non-operating income and none operating expenses) The net profit ratio is measured by dividing profit after tax by net sales. Net Profit Margin Ratio 12 establishing relationship between net profit and sales and it indicates management efficiency in administrating, manufacturing and selling the products. This ratio is the overall measure of the firm s ability to turn each rupees sale into net profit. While the net profit is inadequate, the firm will fail to achieve satisfactory return on owner s equity, due to various reasons. Such as (a) falling price (b) Rising costs
39 and declining sales. Thus, this ratio is very useful to the proprietors and widely used as a measure of overall profitability. A high net profit ratio would ensure adequate return to the owners as well as enable a firm to withstand adverse economic conditions when the selling price declining, the cost of production is rising and demand for the products is falling. Profit after tax Net Profit Ratio = X 100 Net Sales Net profit margin is one of the most closely followed numbers in finance. Shareholders look at net profit margin closely because it shows how good a company is at converting revenue into profits available for shareholders. Net profit margin is often used to compare companies within the same industry, in a process known as "margin analysis." Net profit margin is a percentage of sales, not an absolute number, so it can be extremely useful to compare net profit margins among a group of companies to see which are most effective at converting sales into profits.
40 Table No Net Profit Margin Ratio Sr. No. Name of the Companies Average 1 Bhushan Steel Ltd J S W Steel Ltd Mahindra Ugine Steel Co. Ltd Ratnamani Metals & Tubes Ltd Steel Authority of India Ltd Sarda Energy & Minerals Ltd Tata Steel Ltd Usha Marine Ltd Uttam Galva Steels Ltd Uttam Value Steel Ltd Industry Average Source: Calculated from Annual Published Report of Selected Companies.
41 Chart No. 6.6
42 Above table no and Chart No. 6.6 indicates the performance of Net Profit Margin Ratio for the selected sample companies from Steel Industry of India and indicates the average Industry trend of Indian Steel Industry. The Bhushan Steel Limited (BSL) shows the Net Profit Margin Ratio in was 0.08, which increased in to at 0.10 in , at 0.14 in and at 0.15 in and then decreased at 0.09 in , and then increased at 0.10 in and then decreased at 0.08 in and 0.08 in and then stable at 0.06 till Across the years from to maximum Net Profit Margin Ratio is 0.15 and minimum ratio is 0.06 whereas Average performance of BSL is 0.09 and overall trend of BSL shows mix trend. When J S W Steel limited (JSWSL) shows the Net Profit Margin Ratio in and was 0.05, and then increased at 0.09 in , and at 0.11 in and then decreased at 0.03 in and increased again at 0.15 in and stable at 0.15 in and at 0.14 for next two years in and and then increased at 0.16 in Across the years from to maximum Net Profit Margin Ratios is 0.16 and minimum ratio is 0.03 whereas Average performance of J S W Steel Limited is 0.11 and overall trend of JSW Steel shows mix trend. When Mahindra Ugine Steel Company Limited (MUSCL) shows the Net Profit Margin Ratio in was -0.04, which increase in at 0.03 and decreased again at in and increased again at 0.01 in , and decreased again in at in , and increased again at 0.05 in and 0.10 in and 0.16 in and then decreased again at 0.13 in and 0.02 in Across the years from to maximum Net Profit Margin Ratio is 0.16 and minimum ratio is whereas average performance of MUSCL is 0.04 and overall performance of MUSCL shows mix trend. When Ratnamani Metals & Tubes Limited (RMTL) shows the Net Profit Margin Ratio in was 0.17, which decreased in at 0.13 and increased in at 0.14 and 0.15 in and decreased at 0.12 in and increased again at 0.16 in and 0.18 in and then decreased again at 0.15 in , at 0.12 in
43 and 0.05 in Across the years from to maximum Net Profit Margin Ratio is 0.18 and minimum ratio is 0.05 whereas average performance of RMTL is 0.14 and overall performance of RMTL shows mix trend. When Steel Authority of India Limited (SAIL) shows the Net Profit Margin Ratio in was 0.07, which increased in at 0.11, in at 0.17 and in at 0.25 then decreased in at 0.22 and increased again at 0.29 in and then decreased at 0.28 in , at 0.20 in and increased again in at 0.33 and decreased again at 0.12 in Across the years from to maximum Net Profit Margin Ratio is 0.33 and minimum ratio is 0.07 whereas average performance of SAIL is 0.20 and overall performance of SAIL shows mix trend. When Sarda Energy & Minerals Limited (SEML) shows the Net Profit Margin Ratio in was 0.12, which decreased in at 0.09 and in at 0.08 and then increased at 0.15 in , at 0.16 in , and at 0.22 in and then decreased at 0.14 in and 0.07 in and then increased 0.13 in and decreased 0.24 in Across the years from to maximum Net Profit Margin Ratio is 0.24 and minimum ratio is 0.07 whereas average performance of SEML is 0.14 and overall performance of SEML shows mix trend. When Tata Steel Limited (TSL) shows the Net Profit Margin Ratio in was 0.21, which increased in at 0.29 and in at 0.33, and then decreased at 0.29 in , and then bit increased at 0.30 in , 0.36 in and and then decreased again at 0.35 in and then increased again in at 0.37 and decreased again at 0.25 in Across the years from to maximum Net Profit Margin Ratio is 0.37 and minimum ratio is 0.21 whereas average performance of TSL is 0.31 and overall performance of TSL shows mix trend. When Usha Marine Limited (UML) shows the Net Profit Margin Ratio in was 0.00, which decreasing in at and increased at 0.06 in , at 0.08 in , 0.10 in and 0.12 in and then decreased again at 0.10 in , 0.08 in , 0.05 in and 0.03 in Across the years from to maximum Net Profit Margin Ratio is 0.12 and minimum ratio is -0.02
44 whereas average performance of UML is 0.06 and overall performance of UML shows mix trend. When Uttam Galva Steel Limited (UGSL) shows the Net Profit Margin Ratio in was 0.01 which increased in at 0.02 and remain stable till and then increased at 0.04 in and remain stable till and increased again at 0.05 in and then decreased at 0.02 in Across the years from to maximum Net Profit Margin Ratio is 0.05 and minimum ratio is 0.01 whereas average performance of UGSL is 0.03 and overall performance of UGSL shows mix trend. When Uttam Value Steel Limited (UVSL) shows the Net Profit Margin Ratio in was 0.00 which decreased in at -0.02, in and at -0.03, in and increased (recover) at in and decreased at in , in and then increased (recover) at 0.09 in and decreased at in Across the years from to maximum Net Profit Margin Ratio is 0.09 and minimum ratio is whereas average performance of UVSL is and overall performance of UVSL shows mix trend. Test of Hypotheses for Net Profit Margin Ratio ANOVA F Test Null Hypothesis Ho: The variance arose in the Net Profit Margin Ratios over the years and among the various companies did not differ significantly Alternative Hypothesis H1: The variance arose in the Net Profit Margin Ratios over the years and among the various companies differs significantly. If the, Null Hypothesis is accepted, the Alternative. Hypothesis will be rejected or vice versa.
45 Table 6.12 ANOVA F Test for Net Margin Ratio Source of Variation SS DF MS F P-value F crit Between the Companies Between the Years Error Total In above table 6.12 indicates the calculated value of F is higher than the tabulated F value at 5% level of significance in between the companies. Hence, the null hypothesis stands rejected i.e. there is no significant difference between the selected companies from Indian Steel Industry. However, the difference in between the years where significant because the calculated value of F is higher than the tabulated F value at 5% level of significance in between the years, and hence the null hypotheses stands rejected. 6.8 Inventory Turnover Ratio: Inventory Turnover Ratio 13 indicates the efficiency of the firm in manufacturing and selling of its product. The ratio is arrived at by dividing cost of goods sold by the average inventory. The inventory turnover indicates how fast the inventory is turning into receivable through sales. Generally, a high level of inventory turnover indicates of good inventory management. The inventory turnover ratio 14 is a common measure of the firm s operational efficiency in the management of its assets. As noted earlier, minimizing inventory holdings reduces overhead costs and, hence, improves the profitability performance of the enterprise. Ideally the inventory turnover ratio would be calculated as units sold divided by units on hand. However, the financial statements themselves will only capture monetary valuations and hence external evaluation of inventory turnover must rely on the valuation metrics recorded under GAAP, namely: While it is theoretically superior to average the snapshot balance sheet amounts of inventory in order to benchmark Cost of Goods Sold for the entire year, some analysts
46 simply utilize the ending inventory number for computational expediency a minor inaccuracy for firms with relatively static year-to-year inventory levels. The inventory turnover ratio is often interpreted as a measure of the number of times that the company sold through its inventory during the year. Cost of Goods Sold Inventory Turnover = Average Inventory Where, Average Inventory is the average of opening and closing balance of inventory. When 360 (Approx. No. of days in a year) is divided by this ratio, it gives us days of inventory holding. Therefore, Days of Inventory Holding = 360 Inventory Turnover.
47 Table No Inventory Turnover Ratio Sr. No. Name of the Companies Average 1 Bhushan Steel Ltd J S W Steel Ltd Mahindra Ugine Steel Co. Ltd Ratnamani Metals & Tubes Ltd Steel Authority of India Ltd Sarda Energy & Minerals Ltd Tata Steel Ltd Usha Marine Ltd Uttam Galva Steels Ltd Uttam Value Steel Ltd Industry Average Source: Calculated from Annual Published Report of Selected Companies.

48 Chart No. 6.7
Chapter 7. Summary Findings and Suggestions Chapter 1 Conceptual Framework of Financial Efficiency.
 Chapter 7 Summary Findings and Suggestions 7.1. Chapter 1 Conceptual Framework of Financial Efficiency. 7.2. Chapter 2 An Overview of Indian Steel Industry. 7.3. Chapter 3 Literature Review. 7.4. Chapter
CHAPTER V: DATA ANALYSIS AND INTERPRETATION OF DATA
 CHAPTER V: DATA ANALYSIS AND INTERPRETATION OF DATA 5.1. VARIOUS PARAMETERS USED FOR THE DATA ANALYSIS AND TESTING OF HYPOTHESIS Following are the various parameters re used for the analysis & interpretation
CHAPTER-8 SUMMARY, FINDINGS & SUGGESTIONS
 CHAPTER-8 SUMMARY, FINDINGS & SUGGESTIONS SR. NO. PARTICULAR P. NO 8.1 INTRODUCTION 166 8.2 METHODOLOGY 166 8.3 ANALYSIS OF LIQUIDITY 167 8.4 ANALYSIS OF PROFITABILITY 168 8.5 ANALYSIS OF FINANCIAL STRUCTURE
CHAPTER-4 ANALYSIS OF LIQUIDITY
 CHAPTER-4 ANALYSIS OF LIQUIDITY SR. NO. PARTICULAR P. NO 4.1 INTRODUCTION OF LIQUIDITY 81 4.2 CONCEPT OF LIQUIDITY 81 4.3 SIGNIFICANCE OF THE LIQUIDITY ANALYSIS 82 4.4 LIQUIDITY ANALYSIS OF SELECTEDAUTOMOBILE
CHAPTER 4. ANALYSIS AND INTERPRETATION OF DATA Ratio Analysis - Meaning of Ratio (A) Return on Investment Ratios
 Return on Investment Ratios") CHAPTER 4 ANALYSIS AND INTERPRETATION OF DATA Ratio Analysis - Meaning of Ratio (A) Return on Investment Ratios - Concept of Return on Investment - Advantages of ROI - Limitations of ROI - Evaluation of
CHAPTER 4 ANALYSIS AND INTERPRETATION OF DATA Ratio Analysis - Meaning of Ratio (A) Return on Investment Ratios - Concept of Return on Investment - Advantages of ROI - Limitations of ROI - Evaluation of
FINANCIAL STATEMENTS ANALYSIS - AN INTRODUCTION
 Financial Statements Analysis - An Introduction 27 FINANCIAL STATEMENTS ANALYSIS - AN INTRODUCTION You have already learnt about the preparation of financial statements i.e. Balance Sheet and Trading and
WORKING CAPITAL ANALYSIS OF SELECT CEMENT COMPANIES IN INDIA
 CHAPTER - IV WORKING CAPITAL ANALYSIS OF SELECT CEMENT COMPANIES IN INDIA CHAPTER IV WORKING CAPITAL ANALYSIS OF SELECT CEMENT COMPANIES IN INDIA In this chapter an attempt has been made to analyse the
CHAPTER-5 DATA ANALYSIS PART-3 LIQUIDITY AND SOLVENCY
 CHAPTER-5 DATA ANALYSIS PART-3 LIQUIDITY AND SOLVENCY 190 CHAPTER 5 DATA ANALYSIS PART-3 LIQUIDITY & SOLVENCY 5.1 INTRODUCTION:... 192 5.2 LIQUIDITY & SOLVENCY RATIOS:... 194 5.2.1 CURRENT RATIO:... 194
condition & operating results in a condensed form. Financial statements are used as a
 2.1 FINANCIAL ANALYSIS Financial statements are formal records of the financial activities of a business, person or other entity and provide an overview of a business or person s financial condition in
Chapter 4 Financial Strength Analysis
 Chapter 4 Financial Strength Analysis 4.1 Meaning of Financial Strength Finance is an essential requirement for every business enterprise. Various type of finance was needed by the concern for their activity
Chapter-5. Data Analysis & Interpretation
 Chapter-5 Data Analysis & Interpretation CHAPTER 5 DATA ANALYSIS AND INTERPRETATION Ratio Analysis - Meaning of Ratio (A) Return on Investment Ratios 5.1 Return on Capital Employed Ratio 5.2 Return on
Liquidity and Profitability Analysis Chapter is divided into four parts. comprising of part I dealing with Liquidity Analysis divided into short-term
 163 5.1 INTRODUCTION Liquidity and Profitability Analysis Chapter is divided into four parts comprising of part I dealing with Liquidity Analysis divided into short-term and long-term. Part II deals with
CHAPTER - VI RATIO ANALYSIS 6.3 UTILITY OF RATIO ANALYSIS 6.4 LIMITATIONS OF RATIO ANALYSIS 6.5 RATIO TABLES, CHARTS, ANALYSIS AND
 CHAPTER - VI RATIO ANALYSIS 6.1 INTRODUCTION 6.2 NATURE OF RATIO 6.3 UTILITY OF RATIO ANALYSIS 6.4 LIMITATIONS OF RATIO ANALYSIS 6.5 RATIO TABLES, CHARTS, ANALYSIS AND INTERPRETATION OF DIFFERENT RATIOS
WEEK 10 Analysis of Financial Statements
 WEEK 10 Analysis of Financial Statements Learning Objectives 1. Organize a systematic financial statements analysis using common-size financial statements and ratio analysis. 2. Recognize the potential
CHAPTER-4 ANALYSIS OF FINANCIAL EFFICIENCY. The word efficiency as defined by the Oxford dictionary states that:
 CHAPTER-4 ANALYSIS OF FINANCIAL EFFICIENCY 4.1 Concept of Efficiency and Performance The word efficiency as defined by the Oxford dictionary states that: "Efficiency is the accomplishment of or the ability
Week 4 and Week 5 Handout Financial Statement Analysis
 Week 4 and Week 5 Handout Financial Statement Analysis Introduction After understanding the basic financial statements, one may be interested in analysing the financial statements to understand the performance
ANALYSIS OF VALUE ADDED RATIOs
 ANALYSIS OF VALUE ADDED RATIOs 4.1 INTRODUCTION. 4.2 MEANING & DEFINITION OF VALUE ADDED RATIO. 4.3 OBJECTIVE & UTILITY OF RATIO ANALYSIS. 4.4 LIMITATION OF RATIO ANALYSIS. 4.5 CLASSIFICATION OF RATIO.
CHAPTER - 5 ANALYSIS OF PROFITABILITY
 CHAPTER - 5 ANALYSIS OF PROFITABILITY 5.1 INTRODUCTION 5.2. CONCEPT OF PROFITABILITY 5.3 MEARUREMENT OF PROFITABILITY 5.4 IMPORTANCE OF PROFITABILITY 5.5 ANALYSIS OF PROFITABILITY 5.5.1 Gross Profit Ratio
Disciplined thinking focuses inspiration rather than constricts it. ~ Anonymous
 Ratio Analysis Disciplined thinking focuses inspiration rather than constricts it. ~ Anonymous Ratio Analysis compares significant numbers from your financial statements. Rather than focusing on specific
Key Business Ratios v 2.0 Course Transcript Presented by: TeachUcomp, Inc.
 Key Business Ratios v 2.0 Course Transcript Presented by: TeachUcomp, Inc. Course Introduction Welcome to Key Business Ratios, a presentation of TeachUcomp, Inc. This course examines key ratios used to
CHAPTER-5 ANALYSIS AND EVALUATION OF WORKING CAPITAL
 CHAPTER-5 ANALYSIS AND EVALUATION OF WORKING CAPITAL 5.1 INTRODUCTION 5.2 CONCEPT OF WORKING CAPITAL MANAGEMENT 5.3 SIGNIFICANCE OF WORKING CAPITAL 5.4 OBJECTIVES OF WORKING CAPITAL 5.5 STRUCTURE OF WORKING
TOTAL TRAINING SOLUTIONS
 TOTAL TRAINING SOLUTIONS RATIO ANALYSIS TO DETERMINE FINANCIAL STRENGTH Examining a Borrowers Five Vital Signs Jeffery W. Johnson Bankers Insight Group, LLC jeffery.johnson@bankers-insight.com October
Ratio Analysis Part II
 Chapter-04 Ratio Analysis Part II Ex: 1.1 Profitability Ratios Profitable Ratios are a class of financial metrics that are used to assess a business's ability to generate earnings as compared to its expenses
CHAPTER 5. Liquidity AnALysis. of Sample Real. EstatE CompaniEs
 CHAPTER 5 Liquidity AnALysis of Sample Real EstatE CompaniEs 150 MEANING The ability of a company to meet the short and long term obligations is known as Liquidity. The maturity period of Short term means
LESSON 6 RATIO ANALYSIS CONTENTS
 LESSON 6 RATIO ANALYSIS CONTENTS 6.0 Aims and Objectives 6.1 Introduction 6.2 Definition 6.3 How the Accounting Ratios are Expressed? 6.4 Purpose, Utility & Limitations of Ratio Analysis 6.5 Classification
ANALYSIS OF THE FINANCIAL STATEMENTS
 5 ANALYSIS OF THE FINANCIAL STATEMENTS CONTENTS PAGE STUDY OBJECTIVES 166 INTRODUCTION 167 METHODS OF STATEMENT ANALYSIS 167 A. ANALYSIS WITH THE AID OF FINANCIAL RATIOS 168 GROUPS OF FINANCIAL RATIOS
Assessing the Probability of Failure by Using Altman s Model and Exploring its Relationship with Company Size: An Evidence from Indian Steel Sector
 DOI: 10.15415/jtmge.2017.82003 Assessing the Probability of Failure by Using Altman s Model and Exploring its Relationship with Company Size: An Evidence from Indian Steel Sector Abstract Corporate failure
6.1 Introduction. 6.2 Meaning of Ratio
 6.1 Introduction Ratio analysis has emerged as the principal technique of analysis of financial statements. The system of analysis of financial statements by means of ratio was first made in 1919 be Alexander
Accounting Advance Certificate in Business Administration Study Notes & Practice Questions Chapter 2: Financial Ratios
 Accounting Advance Certificate in Business Administration Study Notes & Practice Questions Chapter 2: Financial Ratios 1 INTRODUCTION Chapter 2: Financial Ratios 2014 Financial statement is a data summary
Chapter-4. Data Analysis and Interpretation
 Chapter-4 Data Analysis and Interpretation Chapter-4 Data Analysis and Interpretation 4.1 Introduction. 4.2 Meaning of Finance. 4.3 Definition of Financial Efficiency. 4.4 Concept of Financial Efficiency.
CHAPTER-6 FINDINGS, CONCLUSIONS AND SUGGESTIONS
 CHAPTER-6 FINDINGS, CONCLUSIONS AND SUGGESTIONS 219 CHAPTER -6 FINDINGS, CONCLUSIONS AND SUGGESTIONS 6.1 FINDINGS:... 221 6.1.1 CAPITAL STRUCTURE POSITION:... 221 6.1.2 PROFITABILITY POSITION:... 222 6.1.3
FAQ: Financial Ratio Analysis
 Question 1: What is horizontal analysis of financial statement data? Answer 1: Horizontal analysis is a method of financial ratio analysis. Horizontal analysis is comparing each item on the financial statements
Compound Growth Rate (CAGR), Coefficient of Variation (CV), Gearing, Linear Growth Rate (LGR). Long-term solvency, Short-term solvency,
, Coefficient of Variation (CV), Gearing, Linear Growth Rate (LGR). Long-term solvency, Short-term solvency,") LONG-TERM AND SHORT-TERM SOLVENCY STATUS OF SELECT CEMENT INDUSTRIAL UNITS IN TAMIL NADU * R. ANGAMUTHU **Dr. A. SIVANANDAM *Assistant Professor, Commerce Wing, DDE, Annamalai University, Chidambaram.
LONG-TERM AND SHORT-TERM SOLVENCY STATUS OF SELECT CEMENT INDUSTRIAL UNITS IN TAMIL NADU * R. ANGAMUTHU **Dr. A. SIVANANDAM *Assistant Professor, Commerce Wing, DDE, Annamalai University, Chidambaram.
A STUDY ON LIQUIDITY MANAGEMENT OF PHARMACEUTICAL COMPANIES IN INDIA
 A STUDY ON LIQUIDITY MANAGEMENT OF PHARMACEUTICAL COMPANIES IN INDIA Dr A.L KAMALAVALLI 1 S.PUSHPAVATHI 2 1 Associate Professor, Department of Commerce, N.G.M College, Pollachi. 2 Research Scholar, Department
RATIO ANALYSIS. The preceding chapters concentrated on developing a general but solid understanding
 C H A P T E R 4 RATIO ANALYSIS I N T R O D U C T I O N The preceding chapters concentrated on developing a general but solid understanding of accounting principles and concepts and their applications to
Classification: 1. Profitability. 2. Efficiency. 3. Liquidity
 BUSS1030 Semester 2 2012 1 - Simple means of examining the health of a business - Help highlight the financial strengths and weaknesses of a business o Cannot, however, explain why certain strengths/weaknesses
Financial Management Masters of Business Administration Study Notes & Tutorial Questions Chapter 7: Analysis & Interpretation of Financial Statement
 Financial Management Masters of Business Administration Study Notes & Tutorial Questions Chapter 7: Analysis & Interpretation of Financial 1 INTRODUCTION Financial statement is a data summary on asset,
Business Finance Bachelors of Business Study Notes & Tutorial Questions Chapter 5: Financial Analysis
 Business Finance Bachelors of Business Study Notes & Tutorial Questions Chapter 5: Financial Analysis 1 INTRODUCTION Chapter 5: Financial Analysis 2018 Financial statement is a data summary on asset, liability
LIQUIDITY SALES BORROWING ASSETS
 Report prepared for: ABC Company Industry: 339999 - All Other Miscellaneous Manufacturing Periods: 12 months against the same 12 months from the previous year LIQUIDITY PROFITS & PROFIT MARGIN SALES BORROWING
Cash Ratio Analysis of Indian Steel Industries: A Case Study of TATA Steel Ltd. and JSW Steel Ltd.
 Analysis of Indian Steel Industries: A Case Study of TATA Steel Ltd. and JSW Steel Ltd. Dr. Vineet Singh 1 and Nand Kishore Bhardwaj 2 1 (Assistant Professor, Department of Commerce, Guru Ghasidas Vishwavidyalaya,
CHAPTER :- 4 CONCEPTUAL FRAMEWORK OF FINANCIAL PERFORMANCE.
 CHAPTER :- 4 CONCEPTUAL FRAMEWORK OF FINANCIAL PERFORMANCE. 4.1 INTRODUCTION. 4.2 FINANCIAL PERFORMANCE. 4.3 FINANCIAL STATEMENT. 4.4 FINANCIAL STATEMENT ANALYSIS. 4.5 METHODS OF ANALYSIS OF FINANCIAL
Financial Performance of RINL Using Financial Ratios and
 Financial Performance of RINL Using Financial Ratios and Comparison with TATA, SAIL and JSW Kommu U. K.S. Alekhya, K. Simhachalam Naidu, Tippana Lochana MVGR College of Engineering (A) ABSTRACT: This paper
VI SEM BCOM STUDY MATERIAL MANAGEMENT ACCOUNTING. Prepared By SREEJA NAIR PADMA NANDANAN
 NEW HORIZON COLLEGE MARATHALLI, BANGALORE (Affiliated to Bangalore University) A Recipient of Prestigious Rajyotsava State Award 2012 conferred by the Government of Karnataka VI SEM BCOM STUDY MATERIAL
A COMPARATIVE STUDY ON PERFORMANCE AND WORKING CAPITAL MANAGEMENT OF ICICI AND HDFC BANKS
 A COMPARATIVE STUDY ON PERFORMANCE AND WORKING CAPITAL MANAGEMENT OF ICICI AND HDFC BANKS R. Devaraj Assistant Professor, Alagappa University Arts and Science College, Paramakudi Abstract Working capital
CHAPTER - 4 ANALYSIS OF PERFORMANCE OF SELECTED FMCG COMPANIES
 CHAPTER - 4 ANALYSIS OF PERFORMANCE OF SELECTED FMCG COMPANIES The performance of the FMCG Companies can be evaluated in three ways, they are: (1) Solvency: This is the measure of the firm s ability to
A Study on Financial Efficiency of Selected FMCG Companies in India
 Continuous Issue 22 August September 2017 A Study on Financial Efficiency of Selected FMCG Companies in India Abstract Products which are having a quick turnover, and relatively low cost are known as Fast
Research Article Volume 6 Issue No. 5
 DOI 10.4010/2016.1292 ISSN 2321 3361 2016 IJESC Research Article Volume 6 Issue No. 5 The Effect of Working Capital Management in the Liquidity of Nokia Corporation: A Study with Special Reference to the
Financial statements provide a common format for. cash management RATIO ANALYSIS. Figure 1: Income statement of ABC group (management accounts format)
") How to illuminate your business IN THE FIRST PART OF THIS FEATURE, WILL SPINNEY SETS OUT SOME ELEMENTS OF RATIO ANALYSIS THAT CASH MANAGERS SHOULD BE AWARE OF, BOTH IN THEIR DAY-TO-DAY JOB AND ALSO TO
How to illuminate your business IN THE FIRST PART OF THIS FEATURE, WILL SPINNEY SETS OUT SOME ELEMENTS OF RATIO ANALYSIS THAT CASH MANAGERS SHOULD BE AWARE OF, BOTH IN THEIR DAY-TO-DAY JOB AND ALSO TO
Ratio Analysis An Accounting Technique of Analysis and Interpretation of Financial Statements
 Ratio Analysis An Accounting Technique of Analysis and Interpretation of Financial Statements IDRISH ALLAD Research Scholar, Rai University, Saroda, Ahmedabad. DR. MAHENDRA H. MAISURIA Research Supervisor,
Ratio Analysis for Financial Planning and Management (Relevant to PBE Paper II Management Accounting and Finance)
") Ratio Analysis for Financial Planning and Management (Relevant to PBE Paper II Management Accounting and Finance) Dr Fong Chun Cheong, Steve, School of Business, Macao Polytechnic Institute Introduction
Ratio Analysis for Financial Planning and Management (Relevant to PBE Paper II Management Accounting and Finance) Dr Fong Chun Cheong, Steve, School of Business, Macao Polytechnic Institute Introduction
Factors affecting the share price of FMCG Companies
 Factors affecting the share price of FMCG Companies Authors: Dharia Dilasha, Kakadia Sachita ABSTRACT To review the factors affecting the share prices of various FMCG companies like revenues, operating
WORKING CAPITAL MANAGEMENT AND PROFITABILITY ANALYSIS OF SELECTED PAPER COMPANIES IN INDIA
 Primax International Journal of Commerce and Management Research Online ISSN: 221-612 WORKING CAPITAL MANAGEMENT AND PROFITABILITY ANALYSIS OF SELECTED PAPER COMPANIES IN INDIA J. Jeyanthi 1 Abstract Efficient
IJRESS Volume 5, Issue 8 (August, 2015) (ISSN ) International Journal of Research in Economics and Social Sciences (IMPACT FACTOR 5.
 (ISSN ) International Journal of Research in Economics and Social Sciences (IMPACT FACTOR 5.") Fundamental Analysis of the Financial Institutions in India (With Special Reference to Selected Banks) Sri. Megharaja.B Assistant Professor and Research Scholar Department of Studies and Research in Commerce
Fundamental Analysis of the Financial Institutions in India (With Special Reference to Selected Banks) Sri. Megharaja.B Assistant Professor and Research Scholar Department of Studies and Research in Commerce
Online Open Access publishing platform for Management Research. Copyright 2010 All rights reserved Integrated Publishing association
 ASIAN JOURNAL OF MANAGEMENT RESEARCH Online Open Access publishing platform for Management Research Copyright 2010 All rights reserved Integrated Publishing association Review Article ISSN 2229 3795 A
UNIT 3 RATIO ANALYSIS
 Understanding and Analysis of Financial Statements UNIT 3 RATIO ANALYSIS Structure Page Nos. 3.0 Introduction 52 3.1 Objectives 54 3.2 Categories of Ratios 54 3.2.1 Long-term Solvency Ratios 3.2.2 Liquidity
PROJECT REPORT ON FINANCIAL ANALYSIS WITH RESPECT TO VARIOUS RATIOS
 PROJECT REPORT ON FINANCIAL ANALYSIS WITH RESPECT TO VARIOUS RATIOS BROUGHT TO YOU BY MBAHOTSPOT.COM For more free Project Reports Visit MBAhotspot.com Download free MBA/PGP Projects from MBAhotspot.com,
CHAPTER - 5 COMPARATIVE ANALYSIS OF DIVIDEND POLICY
 CHAPTER - 5 COMPARATIVE ANALYSIS OF DIVIDEND POLICY 67 CONTENT 5.1 Introduction 5.2 Analysis of selected Companies 5.2.1 Dabur India Ltd. 5.2.2 Nestle India Ltd. 5.2.3 Britannia Industries Ltd. 5.2.4 NTPC
A Study on the Impact of Working Capital Management on Profitability With Reference To Sugar Companies In Tamil Nadu
 A Study on the Impact of Working Capital Management on Profitability With Reference To Sugar Companies In Tamil Nadu Dr.R.Gowri, Assistant Professor,Dep,artment of Commerce,Sri Vasavi College (SFW), Erode.
Accounting Functions. The various financial statements are- Income Statement Balance Sheet
 Accounting Functions The accounting system provides a structure of maintaining details of business transactions that represent the finances of the organization. The various financial statements are- Income
Measuring Financial Distress of Public Sector Enterprises Using Z-Score Model
 Measuring Financial Distress of Public Sector Enterprises Using Z-Score Model Ms. Jyoti Pandit Research Scholar, P.G. Department of Business Studies,Sardar Patel University, Vallabh Vidyanagar 388120.
An Introduction to Understanding Financial Ratios
 An Introduction to Understanding Financial Ratios Business Information Factsheet BIF009 September 2015 Introduction The financial position of any business can be determined from three key financial statements:
A Study on Financial Analysis of Steel Trading Company: A Case Study on Kalyani Steel
 225 A Study on Financial Analysis of Steel Trading Company: A Case Study on Kalyani Steel Shubham V. Shirsath 1, Pritam B. Bhawar 2 1,2 Student, Department of MBA, MIT School of Management, Pune, India
I m going to cover 6 key points about FCF here:
 Free Cash Flow Overview When you re valuing a company with a DCF analysis, you need to calculate their Free Cash Flow (FCF) to figure out what they re worth. While Free Cash Flow is simple in theory, in
Drafting Financial Statements (Accounting Practice, Industry and Commerce) (DFS) (2003 standards) Suggested Answers
 (DFS) (2003 standards) Suggested Answers") Drafting Financial Statements (Accounting Practice, Industry and Commerce) (DFS) (2003 standards) Suggested Answers SECTION 1 PART A Task 1.1 Loittede plc Consolidated balance sheet as at 30 September,
Drafting Financial Statements (Accounting Practice, Industry and Commerce) (DFS) (2003 standards) Suggested Answers SECTION 1 PART A Task 1.1 Loittede plc Consolidated balance sheet as at 30 September,
STUDY UNIT TWO FINANCIAL PERFORMANCE METRICS FINANCIAL RATIOS
 STUDY UNIT TWO FINANCIAL PERFORMANCE METRICS FINANCIAL RATIOS 1 2.1 Liquidity Ratios.......................................................... 2 2.2 Leverage and Solvency Ratios..............................................
A study on liquidity and profitability position of national thermal power corporation limited New Delhi
 International Journal of Commerce and Management Research ISSN: 2455-627, Impact Factor: RJIF 5.22 www.managejournal.com Volume 3; Issue 2; February 207; Page No. 2-6 A study on liquidity and profitability
Financial statements aim at providing financial
 Accounting Ratios 5 LEARNING OBJECTIVES After studying this chapter, you will be able to : Explain the meaning, objectives and limitations of analysis using accounting ratios; Identify the various types
Dr.M.Manjurani Asst.Professor Dept. of Commerce, T.S.A.Arts Science and Tamil College Perur-10.
 A STUDY ON SOLVENCY AND PROFITABILITY ANALYSIS OF MAHINDRA AND MAHINDRA LIMITED IN POLLACHI INTRODUCTION AND DESIGN OF STUDY Dr.M.Manjurani Asst.Professor Dept. of Commerce, T.S.A.Arts Science and Tamil
Managerial Accounting Prof. Dr. Varadraj Bapat Department of School of Management Indian Institute of Technology, Bombay. Lecture - 14 Ratio Analysis
 Managerial Accounting Prof. Dr. Varadraj Bapat Department of School of Management Indian Institute of Technology, Bombay Lecture - 14 Ratio Analysis Dear students, in our last session we are started the
RTP_Final_Syllabus 2012_Dec 2014
 Paper 20: Financial Analysis & Business Valuation SN 1 [Financial Modeling for Project Appraisal] Question 1. (a) A company is considering the following investment projects: Projects Cash Flows (`) W X
Cranswick Plc is a food supplier company listed on the London Stock Exchange. The following
 Financial Ratio Analysis Cranswick Plc is a food supplier company listed on the London Stock Exchange. The following represent ratios for the company for the year ended 31 st March 2012. Investors ratios
Financial Ratio Analysis
 2012 Financial Ratio Analysis Martin Zander 2 M. Zander Financial Ratio Analysis This book has been purchased online on: XinXii.com ebooks & documents from indie authors http://www.xinxii.com 3 Copyright,
Financial Performance of Kotak Mahindra Bank
 Volume-03 Issue-12 December -2018 ISSN: 2455-3085 (Online) www.rrjournals.com [UGC Listed Journal] Financial Performance of Kotak Mahindra Bank 1 Prayag Chaudhary, 2 Rahul Jain & 3 Divinya Banerjee 1,2,3
UNIT 6 FINANCIAL STATEMENTS: ANALYSIS AND INTERPRETATION MODULE - 2
 UNIT 6 FINANCIAL STATEMENTS: ANALYSIS AND INTERPRETATION MODULE - 2 UNIT 6 FINANCIAL STATEMENTS: ANALYSIS AND INTERPRETATION Financial Statements: Structure 6.0 Introduction 6.1 Unit Objectives 6.2 Relationship
CHAPTER IV COST STRUCTURE ANALYSIS. Please purchase PDF Split-Merge on to remove this watermark.
 CHAPTER IV COST STRUCTURE ANALYSIS CHAPTER IV COST STRUCTURE ANALYSIS INTRODUCTION This is an age of mass production as a result of which competition in every industry is cut-throat. Therefore, it is utmost
FINANCIAL PERFORMANCE ANALYSIS OF SELECT CEMENT COMPANIES
 FINANCIAL PERFORMANCE ANALYSIS OF SELECT CEMENT COMPANIES DR. A.Y. KETTIRAMALINGAM 1 K.SOWMIYA 2 P.SANGEETHA 3 1 Associate Professor, School of Commerce PG, Rathnavel Subramaniam College of Arts & Science
A CLEAR UNDERSTANDING OF THE INDUSTRY
 A CLEAR UNDERSTANDING OF THE INDUSTRY IS CFA INSTITUTE INVESTMENT FOUNDATIONS RIGHT FOR YOU? Investment Foundations is a certificate program designed to give you a clear understanding of the investment
A COMPARATIVE FINANCIAL ANALYSIS BETWEEN PUBLIC AND PRIVATE SECTOR STEEL COMPANIES IN INDIA A CASE STUDY APPROACH
 A COMPARATIVE FINANCIAL ANALYSIS BETWEEN PUBLIC AND PRIVATE SECTOR STEEL COMPANIES IN INDIA A CASE STUDY APPROACH Shrabanti Pal Assistant Professor Pailan College of Management and Technology, Kolkata,
Engineering Economics and Financial Accounting
 Engineering Economics and Financial Accounting Unit 5: Accounting Major Topics are: Balance Sheet - Profit & Loss Statement - Evaluation of Investment decisions Average Rate of Return - Payback Period
Suggested Answer_Syl2012_Jun2014_Paper_20 FINAL EXAMINATION
 FINAL EXAMINATION GROUP IV (SYLLABUS 2012) SUGGESTED ANSWERS TO QUESTIONS JUNE 2014 Paper- 20 : FINANCIAL ANALYSIS & BUSINESS VALUATION Time Allowed : 3 Hours Full Marks : 100 The figures in the margin
Volume-4, Issue-5, October-2017 ISSN No:
 A PROFITABILITY ANALYSIS FROM THE VIEW POINT OF SHAREHOLDERS OF SELECTED INDIAN CEMENT COMPANY Pravin T Patel Ass. Prof. Aroma College of College, Research scholar of Babasaheb Ambedkar, Open University,
Cardinal Health, Inc. - Financial and Strategic SWOT Analysis Review
 Publication Date: FEB 2013 7000 Cardinal Place Phone Revenue Dublin, OH Fax Net Profit 43017 Website Employees United States Exchange Industry Company Overview Cardinal Health, Inc. (Cardinal Health) is
RATIO ANALYSIS. Inventories + Debtors + Cash & Bank + Receivables / Accruals + Short terms Loans + Marketable Investments
 A. LIQUIDITY RATIOS - Short Term Solvency RATIO ANALYSIS Ratio Formula Numerator Denominator Significance/Indicator 1. Current Ratio Current Assets Current Liabilities Inventories + Debtors + Cash & Bank
Understanding and assessing financial risk. By Dennis A. Kaan
 Understanding and assessing financial risk By Dennis A. Kaan While it is impossible to avoid all sources of risk in production agriculture, it can be managed. Exposure to financial risk comes from three
Ratio Analysis. Assets = Liabilities + Shareholder s Equity
 Ratio Analysis The purpose of a financial statement is to disclose information about the financial position of an entity to interested parties. By reporting the finances, shareholders are able to make
International Journal of Business and Administration Research Review, Vol. 3, Issue.12, Oct - Dec, Page 59
 PERFORMANCE EVALUATION, COMPARATIVE ANALYSIS AND FACTORS INFLUENCING THE EFFICIENCY OF DISTRICT CENTRAL CO-OPERATIVE BANKS A STUDY WITH REFERENCE TO SOUTHERN STATES OF INDIA Mr.F.Franco authers * Dr.R.Karpagavalli**
Accounting Principles Guide. Discussion of principles applicable to use of spreadsheet available for download at:
 Accounting Principles Guide Discussion of principles applicable to use of spreadsheet available for download at: www.legaltree.ca Accounting equation (income statement and balance sheet) We should be clear
14. What Use Can Be Made of the Specific FSIs?
 14. What Use Can Be Made of the Specific FSIs? Introduction 14.1 The previous chapter explained the need for FSIs and how they fit into the wider concept of macroprudential analysis. This chapter considers
EVALUATING THE FINANCIAL HEALTH OF TEXTILE COMPANIES IN TAMIL NADU SINCE 2008 Dr. Anas Khan 1, Anubhav Mittal 2 1
 EVALUATING THE FINANCIAL HEALTH OF TEXTILE COMPANIES IN TAMIL NADU SINCE 2008 Dr. Anas Khan 1, Anubhav Mittal 2 1 Assistant Professor, Vidyotma Girls Degree College, Lawar, Meerut 2 Assistant Professor,
9. Short-Term Liquidity Analysis. Operating Cash Conversion Cycle
 9. Short-Term Liquidity Analysis. Operating Cash Conversion Cycle 9.1 Current Assets and 9.1.1 Cash A firm should maintain as little cash as possible, because cash is a nonproductive asset. It earns no
INTRODUCTION MEANING OF WORKING CAPITAL
 INTRODUCTION Working capital management is also one of the important parts of the financial management. It is concerned with short-term finance of the business concern which is a closely related trade
Executive Dashboard. What We ll Cover. Melissa Wood Consultant
 Executive Dashboard Melissa Wood Consultant What We ll Cover 1. What kind of information can I find in the Executive Dashboard? 2. Set Up and Save Criteria 3. Using Graphs for More Detail 4. Analyze Financial
ACTIVITY RATIO OF THE CEMENT COMPANIES
 ACTIVITY RATIO OF THE CEMENT COMPANIES CHAPTER V ACTIVITY PARAMETERS OF THE CEMENT COMPANIES 5.1. Introduction Having studied the short term and long term solvency of select units in earlier chapters,
Financial Guide. Northfield Enterprise Center
 Financial Guide Northfield Enterprise Center 11 1 Table of Contents Introduction.3 General Vocabulary...4 Accounting Principles 5 Balance Sheets 6 Income Statements...9 Cash Flow Statements 10 Financial
CHAPTER-3 DATA ANALYSIS PART-1 CAPITAL STRUCTURE
 CHAPTER-3 DATA ANALYSIS PART-1 CAPITAL STRUCTURE 87 CHAPTER 3 DATA ANALYSIS PART - 1: CAPITAL STRUCTURE 3.1 CONCEPT OF CAPITAL STRUCTURE:... 90 3.2 CAPITAL STRUCTURE ANALYSIS:... 91 3.2.1 FINANCIAL TOOLS:...
International Journal of Management (IJM), ISSN (Print), ISSN (Online), Volume 5, Issue 6, June (2014), pp.
, ISSN (Print), ISSN (Online), Volume 5, Issue 6, June (2014), pp.") INTERNATIONAL JOURNAL OF MANAGEMENT (IJM) International Journal of Management (IJM), ISSN 0976 6502(Print), ISSN 0976-6510(Online), ISSN 0976-6502 (Print) ISSN 0976-6510 (Online) Volume 5, Issue 6, June
INTERNATIONAL JOURNAL OF MANAGEMENT (IJM) International Journal of Management (IJM), ISSN 0976 6502(Print), ISSN 0976-6510(Online), ISSN 0976-6502 (Print) ISSN 0976-6510 (Online) Volume 5, Issue 6, June
Fundamentals of Credit. Arnold Ziegel Mountain Mentors Associates. II. Fundamentals of Financial Analysis
 Fundamentals of Credit Arnold Ziegel Mountain Mentors Associates II. Fundamentals of Financial Analysis Financial Analysis is the basis for Credit Analysis January, 2008 Financial analysis is the starting
16 Statement of Cash Flows
 Chapter 16 Statement of Cash Flows Learning Objectives: Learn about the purpose of the statement of cash flows Learn about the various sections of the statement of cash flows Learn how to prepare a statement
ACCOUNTING RATIOS ACTIVITY / TURNOVER RATIOS BY- ANUJ JINDAL
 ACCOUNTING RATIOS ACTIVITY / TURNOVER RATIOS BY- ANUJ JINDAL ACTIVITY/ TURNOVER/ EFFICIENCY RATIOS Rapidity with which the resources available to the concern are being used to produce revenue from operations
Analysis and Interpretation of Financial Statements
 Analysis and Interpretation of Financial Statements Prof Pieter Pelle INTRODUCTION Objective of financial reporting provide information for decision making Primary statements income statement, balance