ANNUAL ECONOMIC SURVEY OF EMPLOYEE OWNERSHIP IN EUROPEAN COUNTRIES IN 2008
|
|
|
- Prudence Mason
- 6 years ago
- Views:
Transcription
1 ANNUAL ECONOMIC SURVEY OF EMPLOYEE OWNERSHIP IN EUROPEAN COUNTRIES IN 28 INTRODUCTION TO COUNTRY FILES Employee ownership is progressing faster and stronger across Europe than anyone could expect. This is a quick and recent new development in most European countries. However, some countries began earlier while others dawdled on the way (see Graph 1). The new Annual Survey for year 28 shows that employee ownership declined a bit on the threshold of the financial crisis, from to 24.2 billion Euro (-15.2). However, this was still much more than the 26.2 billion one year before. As a percentage, employees' share stabilized on 2.63 in the capital ownership structure. Considering recent trends, employee ownership is going to double within the next 5-1 years, from 9.1 million employee owners now to 16 millions, from 28.2 of all employees in large European companies now to 4-5, and capitalisation held by employees going to raise from 2.63 now to 4-5. This is the main conclusion of the economic survey of employee ownership in the European countries in year 28. This survey is based on information about each of all large European companies which also means a similar information for each of all European countries. Furthermore, it is based on information given by companies themselves in Annual Reports which means a quick information and a high quality. The full version of this Annual Survey is available at the European Federation of Employee Share Ownership. NORWAY (NO) Compared to other European countries, employee ownership is still low in Norway, but changes are on the way. Considering the global percentage of capital held by employees in large companies, it is still low with 1.55 in Norway compared to 2.63 in Europe and 4.52 in France (Graph 2). However, 86 of large Norwegian companies have some employee share ownership, not far from the 85.1 in Europe or even the 1 in Ireland or Finland (Graph 3). On a positive note too: 49 of large Norwegian companies have "broad-based" employee share plans (all-employee plans), not far from the 51.9 in Europe but 86 in France (Graph 4). Good dynamics: 4 of large Norwegian companies launched new employee share plans in 27/8 compared with 36.6 in Europe (but 53 in Belgium or 52 in Denmark, The Netherlands and the UK) see Graph 5. It is a fact that changes are quite recent in Norway compared to other European countries: Irish large companies launched their first employee share plan in 1995 on average it was only in 21 in Norway (Graph 6). Norway appears also close to the European average regarding stock options: 63 of large Norwegian companies have stock option plans, compared with 64.6 in Europe but 97 in Ireland (Graph 7). As a consequence, Norway is still low for the proportion of employee owners amongst all employees, with 2 compared with 28.2 in Europe and 46 in France (Graph 8). Finally, Norway is also increasing when considering companies with "significant" employee ownership: 48 in Norway compared to 53.9 in Europe (but 75 in France) see Graph 9.
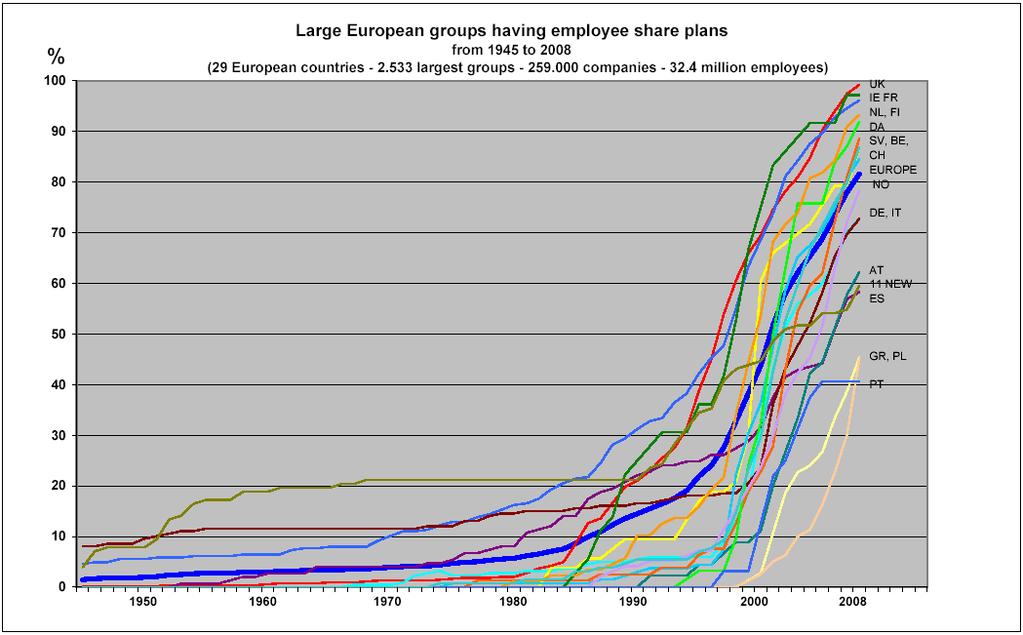
2 Graph 1
3 , CAPITAL HELD BY EMPLOYEES IN EUROPEAN COMPANIES (29 European countries largest European groups companies million employees) CY SL 5, FR 4, 3, 2,63 GR UK EU IT PL IE CH AT ES BE 2, NM NO DE SV HU NL FI 1, SK LU DA PT, RO LV MT BG LT EE CZ RO LV MT BG LT EE CZ SK LU DA PT NM NO DE SV HU NL FI ES BE GR UK EU IT PL IE CH AT FR CY SL
4 ,1 EUROPEAN GROUPS HAVING EMPLOYEE OWNERSHIP (29 European countries largest European groups companies million employees) BE DE PT CZ IT ES EU NO HU DA CH SL FR NL SV UK FI IE 7 6 LT MT GR AT NM CY 5 4 LV PL EE SK LU RO BG RO BG LV PL EE SK LU LT GR MT AT NM CY BE DE PT CZ IT ES EU NO HU DA CH SL FR NL SV UK FI IE
5 1 EUROPEAN GROUPS HAVING BROAD-BASED EMPLOYEE SHARE PLANS (29 European countries largest European groups companies million employees) 9 FR 8 CZ UK ,9 IT BE LV DE NL ES FI AT MT SK CH SV NM NO CY EU SL IE DA HU 2 1 PT BG GR PL EE LT LU RO EE LT LU RO PL BG GR PT IT BE LV DE NL ES FI AT MT SK CH SV NM NO CY EU SL IE DA HU CZ UK FR
6 6 EUROPEAN GROUPS HAVING LAUNCHED NEW EMPLOYEE SHARE PLANS (29 European countries largest European groups companies million employees) 5 SV FI FR UK NL DA BE 4 36,6 EU NO IE 3 CH DE 2 EE PT CY IT AT MT PL GR 1 LU CZ NM HU SL ES BG LT LV RO SK LV RO SK LU CZ NM HU SL ES BG LT EE PT CY IT AT MT PL GR CH DE EU NO IE SV FI FR UK NL DA BE
7 Number of years 14 WHEN DID THEY LAUNCH THEIR FIRST EMPLOYEE SHARE PLAN? (listed groups having employee share plans) (29 European countries largest European groups having employee share plans million employees) IE SL UK FR NL BE EU MT HU DE CH NM SV CY FI PT NO DA CZ AT LV IT ES LU GR PL RO BG EE LT SK
8 1 EUROPEAN GROUPS HAVING STOCK OPTION PLANS (29 European countries largest European groups companies million employees) UK IE 9 8 SV BE FI NL DA 7 64,6 DE NO CH FR EU CY 6 5 LU IT 4 PL PT AT GR MT 3 ES HU 2 1 SL CZ RO EE NM BG LT LV SK BG LT LV SK SL CZ RO EE NM ES HU PL PT AT GR MT LU IT DE NO CH FR EU CY DA SV BE FI NL UK IE
9 5 EMPLOYEE OWNERS AMONGST ALL EMPLOYEES (29 European countries largest European groups companies millions employees) 45 FR 4 35 UK 3 28,2 EU CY 25 IE FI CH SV 2 NL NO BE DA DE AT 15 1 PT LV SK NM PL HU CZ IT SL MT ES GR 5 BG EE LT RO LU BG EE LT RO LU PT LV SK NM PL HU CZ IT SL MT ES GR NL NO BE DA DE AT IE FI CH SV EU CY UK FR
10 European Federation of Employee Ownership EUROPEAN GROUPS HAVING "SIGNIFICANT" EMPLOYEE OWNERSHIP (EO>1) (29 European countries largest European groups companies million employees) IE UK FR CZ CY HU 6 53,9 IT EU SL FI 5 4 DE PT BE DA SK SV AT CH ES NM NL NO 3 LU PL EE GR 2 1 LT BG LV MT RO BG LV MT RO LT LU PL EE GR DE PT BE DA SK SV AT CH ES NM NL NO IT EU SL FI HU IE UK FR CZ CY
11 European Federation of Employee Share Owneship 1 CAPITAL HELD BY EMPLOYEES: EXECUTIVES' AND NON-EXECUTIVES' SHARES (29 European countries largest European groups companies million employees) 9 8 TOP EXECUTIVES NON-EXECUTIVES EE LT RO LU BG GR IT NO PL CZ ES PT IE UK SV DE EU HU NL AT CH BE DA FR NM CY FI MT SL LV SK
ANNUAL ECONOMIC SURVEY OF EMPLOYEE OWNERSHIP IN EUROPEAN COUNTRIES IN 2008
 www.efesonline.org 25.2.29 ANNUAL ECONOMIC SURVEY OF EMPLOYEE OWNERSHIP IN EUROPEAN COUNTRIES IN 28 INTRODUCTION TO COUNTRY FILES Employee ownership is progressing faster and stronger across Europe than
MM, EFES EN. Marc Mathieu
 MM, EFES EN Marc Mathieu La Tribune Hewitt % 100 90 80 EUROPEAN GROUPS HAVING EMPLOYEE SHARE PLANS Graph first year plans UK IE FR NL, FI DA SV, BE, CH EUROPE NO 70 DE, IT 60 50 AT 11 NEW ES 40 30 GR,
State of play of CAP measure Setting up of Young Farmers in the European Union
 State of play of CAP measure Setting up of Young Farmers in the European Union Michael Gregory EN RD Contact Point Seminar CEJA 20 th September 2010 Measure 112 rationale: Measure 112 - Setting up of young
DATA SET ON INVESTMENT FUNDS (IVF) Naming Conventions
 Naming Conventions") DIRECTORATE GENERAL STATISTICS LAST UPDATE: 10 APRIL 2013 DIVISION MONETARY & FINANCIAL STATISTICS ECB-UNRESTRICTED DATA SET ON INVESTMENT FUNDS (IVF) Naming Conventions The series keys related to Investment
DIRECTORATE GENERAL STATISTICS LAST UPDATE: 10 APRIL 2013 DIVISION MONETARY & FINANCIAL STATISTICS ECB-UNRESTRICTED DATA SET ON INVESTMENT FUNDS (IVF) Naming Conventions The series keys related to Investment
Growth, competitiveness and jobs: priorities for the European Semester 2013 Presentation of J.M. Barroso,
 Growth, competitiveness and jobs: priorities for the European Semester 213 Presentation of J.M. Barroso, President of the European Commission, to the European Council of 14-1 March 213 Economic recovery
EBA REPORT ON HIGH EARNERS
 EBA REPORT ON HIGH EARNERS DATA AS OF END 2017 LONDON - 11/03/2019 1 Data on high earners List of figures 3 Executive summary 4 1. Data on high earners 6 1.1 Background 6 1.2 Data collected on high earners
Themes Income and wages in Europe Wages, productivity and the wage share Working poverty and minimum wage The gender pay gap
 5. W A G E D E V E L O P M E N T S At the ETUC Congress in Seville in 27, wage developments in Europe were among the most debated issues. One of the key problems highlighted in this respect was the need
October 2010 Euro area unemployment rate at 10.1% EU27 at 9.6%
 STAT//180 30 November 20 October 20 Euro area unemployment rate at.1% EU27 at 9.6% The euro area 1 (EA16) seasonally-adjusted 2 unemployment rate 3 was.1% in October 20, compared with.0% in September 4.
January 2010 Euro area unemployment rate at 9.9% EU27 at 9.5%
 STAT//29 1 March 20 January 20 Euro area unemployment rate at 9.9% EU27 at 9.5% The euro area 1 (EA16) seasonally-adjusted 2 unemployment rate 3 was 9.9% in January 20, the same as in December 2009 4.
NOTE ON EU27 CHILD POVERTY RATES
 NOTE ON EU7 CHILD POVERTY RATES Research note prepared for Child Poverty Action Group Authors: H. Xavier Jara and Chrysa Leventi Institute for Social and Economic Research (ISER) University of Essex The
EBRD 2016 Transition report presentation. Some additional lessons from the EU
 EBRD 2016 Transition report presentation Some additional lessons from the EU Zsolt Darvas Bruegel 7 December 2016 1 Generational earnings elasticity (less mobility ) Social (or intergenerational) mobility:
Part C. Impact on sample design
 Part C. Impact on sample design Ing. Marie Hörmannová, CSc. Business Cycle Surveys Department Introduction In December 2006, the European Council adopted the regulation establishing the revised EU statistical
HOW RECESSION REFLECTS IN THE LABOUR MARKET INDICATORS
 REPUBLIC OF SLOVENIA HOW RECESSION REFLECTS IN THE LABOUR MARKET INDICATORS Matej Divjak, Irena Svetin, Darjan Petek, Miran Žavbi, Nuška Brnot ??? What is recession?? Why in Europe???? Why in Slovenia?
Macroeconomic Policies in Europe: Quo Vadis A Comment
 Macroeconomic Policies in Europe: Quo Vadis A Comment February 12, 2016 Helene Schuberth Outline Staff Projection of the Euro Area Monetary Policy Investment Rebalancing in the euro area Fiscal Policy
Taxation trends in the European Union EU27 tax ratio at 39.8% of GDP in 2007 Steady decline in top personal and corporate income tax rates since 2000
 DG TAXUD STAT/09/92 22 June 2009 Taxation trends in the European Union EU27 tax ratio at 39.8% of GDP in 2007 Steady decline in top personal and corporate income tax rates since 2000 The overall tax-to-gdp
Fiscal sustainability challenges in Romania
 Preliminary Draft For discussion only Fiscal sustainability challenges in Romania Bucharest, May 10, 2011 Ionut Dumitru Anca Paliu Agenda 1. Main fiscal sustainability challenges 2. Tax collection issues
EU Budget 2009: billion. implemented. 4. The European Union as a global player; ; 6.95% 5. Administration ; 6.
 20.09.2010 EU Budget 2009: 112.107 billion 4. The European Union as a global player; 7 788 ; 6.95% 3. Citizenship, freedom, security and justice; 1 930 ; 1.72% 2. Preservation and management of natural
Overview of Eurofound surveys
 Overview of Eurofound surveys Dublin 21 st October 2010 Maija Lyly-Yrjänäinen Eurofound data European Working Conditions Survey 91, 95, 00, 05, 10 European Quality of Life Survey 03, 07, 09, 10 (EB), 11
On 19/06/2012 the Court delivered its ruling in Case C-307/10 IP Translator, giving the following answers to the referred questions:
 Common Communication on the Implementation of IP Translator v1.2, 20 February 2014 1 On 19/06/2012 the Court delivered its ruling in Case C-307/10 IP Translator, giving the following answers to the referred
Two years to go to the 2014 European elections European Parliament Eurobarometer (EB/EP 77.4)
") Directorate-General for Communication PUBLIC OPINION MONITORING UNIT Brussels, 23 October 2012. Two years to go to the 2014 European elections European Parliament Eurobarometer (EB/EP 77.4) FOCUS ON THE
Directorate-General for Communication PUBLIC OPINION MONITORING UNIT Brussels, 23 October 2012. Two years to go to the 2014 European elections European Parliament Eurobarometer (EB/EP 77.4) FOCUS ON THE
The challenges of an ageing population. Budgetary and labour force projections for Belgium and the EU Member States
 The challenges of an ageing population Budgetary and labour force projections for Belgium and the EU Member States Alexander Schwan, European Commission WSE Arbeidsmarktcongres 2013 07.02.2013 Provinciehuis
FOCUS AREA 5B: Energy efficiency
 Rural Development Programmes 204-2020: Key facts & figures FOCUS AREA 5B: Energy efficiency. Introduction Focus Area (FA) 5B is designed to increase efficiency in energy use in agriculture and food processing.
December 2010 Euro area annual inflation up to 2.2% EU up to 2.6%
 STAT/11/9 14 January 2011 December 2010 Euro area annual inflation up to 2.2% EU up to 2.6% Euro area 1 annual inflation was 2.2% in December 2010 2, up from 1.9% in November. A year earlier the rate was
How much does it cost to make a payment?
 How much does it cost to make a payment? Heiko Schmiedel European Central Bank Directorate General Payments & Market Infrastructure, Market Integration Division World Bank Global Payments Week 23 October
Finnish pension (investment) system. 28th Ljubljana Stock Exchange Conference May 2011 Mika Vidlund
 system. 28th Ljubljana Stock Exchange Conference May 2011 Mika Vidlund") Finnish pension (investment) system 28th Ljubljana Stock Exchange Conference May 2011 Mika Vidlund 2 Contents Overall picture of the Finnish pension system EU-Commission s guidelines for how to make pension
Finnish pension (investment) system 28th Ljubljana Stock Exchange Conference May 2011 Mika Vidlund 2 Contents Overall picture of the Finnish pension system EU-Commission s guidelines for how to make pension
LEADER implementation update Leader/CLLD subgroup meeting Brussels, 21 April 2015
 LEADER 2007-2013 implementation update Leader/CLLD subgroup meeting Brussels, 21 April 2015 #LeaderCLLD 2,416 2,416 8.9 Progress on LAG selection in the EU (2007-2013) 3 000 2 500 2 000 2 182 2 239 2 287
Table of Contents. Part 1 General Section
 About the Editor Foreword v XV Part 1 General Section About this Guide 1-3 Background to the VAT in Europe 2-1 A. Principles of the VAT 2-2 B. VAT in the European Community 2-4 C. The European Union and
Social Protection and Social Inclusion in Europe Key facts and figures
 MEMO/08/625 Brussels, 16 October 2008 Social Protection and Social Inclusion in Europe Key facts and figures What is the report and what are the main highlights? The European Commission today published
FOCUS AREA 6C: Access to and quality of ICT
 Rural Development Programmes 2014-2020: Key facts & figures FOCUS AREA 6C: Access to and quality of ICT 1. Introduction Focus Area (FA) 6C is designed to enhance the accessibility, use and quality of information
The Skillsnet project on Medium-term forecasts of occupational skill needs in Europe: Replacement demand and cohort change analysis
 The Skillsnet project on Medium-term forecasts of occupational skill needs in Europe: Replacement demand and cohort change analysis Paper presented at the Workshop on Medium-term forecast of occupational
May 2009 Euro area annual inflation down to 0.0% EU down to 0.7%
 STAT/09/88 16 June 2009 May 2009 Euro area annual inflation down to 0.0% EU down to 0.7% Euro area 1 annual inflation was 0.0% in May 2009 2, down from 0.6% in April. A year earlier the rate was 3.7%.
Reform strategies: the experience of emerging European economies and their effects on sustainability and equity
 Cross-country experiences Session 3 Reform strategies: the experience of emerging European economies and their effects on sustainability and equity Per Eckefeldt European Commission Directorate General
Gender pension gap economic perspective
 Gender pension gap economic perspective Agnieszka Chłoń-Domińczak Institute of Statistics and Demography SGH Part of this research was supported by European Commission 7th Framework Programme project "Employment
May 2009 Euro area external trade surplus 1.9 bn euro 6.8 bn euro deficit for EU27
 STAT/09/106 17 July 2009 May 2009 Euro area external trade surplus 1.9 6.8 deficit for EU27 The first estimate for the euro area 1 (EA16) trade balance with the rest of the world in May 2009 gave a 1.9
Investment and Investment Finance open questions?
 Investment and Investment Finance open questions? COMPNET 13 th ANNUAL CONFERENCE CHIEF ECONOMISTS PANEL 29 June 2017 Debora Revoltella Economics Department European Investment Bank Key issues Questions
Securing sustainable and adequate social protection in the EU
 Securing sustainable and adequate social protection in the EU Session on Social Protection & Security IFA 12th Global Conference on Ageing 11 June 2014, HICC Hyderabad India Dr Lieve Fransen European Commission
COMMISSION DECISION of 23 April 2012 on the second set of common safety targets as regards the rail system (notified under document C(2012) 2084)
 2084)") 27.4.2012 Official Journal of the European Union L 115/27 COMMISSION DECISION of 23 April 2012 on the second set of common safety targets as regards the rail system (notified under document C(2012) 2084)
27.4.2012 Official Journal of the European Union L 115/27 COMMISSION DECISION of 23 April 2012 on the second set of common safety targets as regards the rail system (notified under document C(2012) 2084)
THE 2015 EU JUSTICE SCOREBOARD
 THE 215 EU JUSTICE SCOREBOARD Communication from the Commission to the European Parliament, the Council, the European Central Bank, the European Economic and Social Committee and the Committee of the Regions
2 ENERGY EFFICIENCY 2030 targets: time for action
 ENERGY EFFICIENCY 2030 targets: time for action The Coalition for Energy Savings The Coalition for Energy Savings strives to make energy efficiency and savings the first consideration of energy policies
COMMISSION STAFF WORKING DOCUMENT Accompanying the document. Report form the Commission to the Council and the European Parliament
 EUROPEAN COMMISSION Brussels, 4.5.2018 SWD(2018) 246 final PART 5/9 COMMISSION STAFF WORKING DOCUMENT Accompanying the document Report form the Commission to the Council and the European Parliament on
August 2008 Euro area external trade deficit 9.3 bn euro 27.2 bn euro deficit for EU27
 STAT/08/143 17 October 2008 August 2008 Euro area external trade deficit 9.3 27.2 deficit for EU27 The first estimate for the euro area 1 (EA15) trade balance with the rest of the world in August 2008
THE 2016 EU JUSTICE SCOREBOARD
 THE 2016 EU JUSTICE SCOREBOARD Quantitative data April 2016 This document contains a selection of graphs with quantitative data from the 2016 EU Justice Scoreboard. (The figure numbers correspond to those
Fiscal competitiveness issues in Romania
 Fiscal competitiveness issues in Romania Ionut Dumitru President of the Fiscal Council, Chief Economist Raiffeisen Bank* October 2014 World Bank Doing Business Report Ranking (out of 189 countries) Ease
FOCUS AREA 6B: Fostering local development
 Rural Development Programmes 014-00: Key facts & figures FOCUS AREA 6B: Fostering local development 1. Introduction Focus Area (FA) 6B is designed to foster local development in rural areas. Two measures
Library statistical spotlight
 /9/2 Library of the European Parliament 6 4 2 This document aims to provide a picture of the, in particular by looking at car production trends since 2, at the number of enterprises and the turnover they
For further information, please see online or contact
 For further information, please see http://ec.europa.eu/research/sme-techweb online or contact Lieve.VanWoensel@ec.europa.eu Seventh Progress Report on SMEs participation in the 7 th R&D Framework Programme
FIRST REPORT COSTS AND PAST PERFORMANCE
 FIRST REPORT COSTS AND PAST PERFORMANCE DECEMBER 2018 https://eiopa.europa.eu/ PDF ISBN 978-92-9473-131-9 ISSN 2599-8862 doi: 10.2854/480813 EI-AM-18-001-EN-N EIOPA, 2018 Reproduction is authorised provided
January 2009 Euro area external trade deficit 10.5 bn euro 26.3 bn euro deficit for EU27
 STAT/09/40 23 March 2009 January 2009 Euro area external trade deficit 10.5 26.3 deficit for EU27 The first estimate for the euro area 1 (EA16) trade balance with the rest of the world in January 2009
Investment in Ireland and the EU
 Investment in and the EU Debora Revoltella Director Economics Department Dublin April 10, 2017 20/04/2017 1 Real investment: IE v EU country groupings Real investment (2008 = 100) 180 160 140 120 100 80
The Eurostars Programme
 The Eurostars Programme The EU-EUREKA joint funding programme for R&D-performing SMEs What is EUREKA? > 2 > EUREKA is a public network supporting R&D-performing businesses > Established in 1985 by French
RETIREMENT Differences in State of Affairs and legacies across the EU28
 RETIREMENT Differences in State of Affairs and legacies across the EU28 EC/OECD Workshop on delivering longer working lives and higher retirement ages Brussels, 12-13 November 2014 Fritz von Nordheim European
Business churn, sectoral performance, and economic policy
 Business churn, sectoral performance, and economic policy CompNet 13/14 March 2014 Banca d'italia Erik Canton Plan Business dynamics Allocative efficiency Relationship between business dynamics and allocative
Axis 4 (Leader) Implementing Local Development Strategies
 Implementing Local Development Strategies") Axis 4 (Leader) Implementing Local Development Strategies Basic Information: Axis 4 Leader: Implementing local development strategies with a view to achieving the objectives of one or more of the axes
Axis 4 (Leader) Implementing Local Development Strategies Basic Information: Axis 4 Leader: Implementing local development strategies with a view to achieving the objectives of one or more of the axes
Gender equality in the Member States
 Women on -- Factsheet 2 Gender equality in the Member States The arguments: On average, a mere 13.7 of board members and 15 of non-executive board members of the largest companies listed on stock exchanges
FOCUS AREA 2A: Improving economic performance of all farms, farm restructuring and modernisation
 Rural Development Programmes 2014-2020: Key facts & figures FOCUS AREA 2A: Improving economic performance of all farms, farm restructuring and modernisation 1. Introduction Focus Area (FA) 2A is designed
Note to ERAC Delegates
 EUROPEAN COMMISSION DIRECTORATE-GENERAL FOR RESEARCH & INNOVATION Directorate A - Policy Development and Coordition Head of Unit A.2 - Programming and interinstitutiol relations Ref. Ares(214)275666-5/2/214
Carving out legacy assets: A successful tool for bank restructuring?
 1 Carving out legacy assets: A successful tool for bank restructuring? Lisbon University of Law 8 May 2017 Willem Pieter de Groen Centre for European Policy Studies (CEPS) Non-performing loans (NPLs) potential
Smoothing Asymmetric Shocks vs. Redistribution in the Euro Area: A simple proposal for dealing with mistrust in the euro area
 Heikki Oksanen Date: 2016-03-23 Published online 23 March 2016 at https://www.researchgate.net/profile/heikki_oksanen. Technical appendix to the paper Smoothing Asymmetric Shocks vs. Redistribution in
REPORT FROM THE COMMISSION TO THE EUROPEAN PARLIAMENT AND THE COUNCIL
 EUROPEAN COMMISSION Brussels, 17.9.2018 COM(2018) 629 final REPORT FROM THE COMMISSION TO THE EUROPEAN PARLIAMENT AND THE COUNCIL 11th FINANCIAL REPORT FROM THE COMMISSION TO THE EUROPEAN PARLIAMENT AND
Inside magazine Issue 18 Part 03 - From corporate strategies & people perspectives
 Partner Baptiste Guionnet Director ever before. In Europe, this trend is further exacerbated by the to the US. However, M&A in the banking sector has risen group priorities in the coming months. F of cross-border
EUROPEAN COMMISSION EUROSTAT
 EUROPEAN COMMISSION EUROSTAT Directorate F: Social statistics Unit F-3: Labour market Doc.: Eurostat/F3/LAMAS/29/14 WORKING GROUP LABOUR MARKET STATISTICS Document for item 3.2.1 of the agenda LCS 2012
H Marie Skłodowska-Curie Actions (MSCA)
") H2020 Key facts and figures (2014-2020) Number of IE researchers funded by MSCA: EU budget awarded to IE organisations (EUR million): Number of IE organisations in MSCA: 253 116,04 116 In detail, the number
H2020 Key facts and figures (2014-2020) Number of IE researchers funded by MSCA: EU budget awarded to IE organisations (EUR million): Number of IE organisations in MSCA: 253 116,04 116 In detail, the number
Albane DEMBLANS Secretariat-General of the European Commission
 Albane DEMBLANS Secretariat-General of the European Commission European Economic and Social Committee 1 June 2016 Economic and social context European Semester 2016 Economic and social context A moderate
H Marie Skłodowska-Curie Actions (MSCA)
") H2020 Key facts and figures (2014-2020) Number of BE researchers funded by MSCA: EU budget awarded to BE organisations (EUR million): Number of BE organisations in MSCA: 274 161,04 227 In detail, the number
H2020 Key facts and figures (2014-2020) Number of BE researchers funded by MSCA: EU budget awarded to BE organisations (EUR million): Number of BE organisations in MSCA: 274 161,04 227 In detail, the number
H Marie Skłodowska-Curie Actions (MSCA)
") H2020 Key facts and figures (2014-2020) Number of NL researchers funded by MSCA: EU budget awarded to NL organisations (EUR million): Number of NL organisations in MSCA: 427 268.91 351 In detail, the number
H2020 Key facts and figures (2014-2020) Number of NL researchers funded by MSCA: EU budget awarded to NL organisations (EUR million): Number of NL organisations in MSCA: 427 268.91 351 In detail, the number
A new approach to education PPPs in the Eurostat/OECD exercise
 A new approach to education PPPs in the Eurostat/OECD exercise OECD Meeting on PPPs for Non-European Countries, 27 29 April 2009 Eurostat losure Authorized Public Disclosure Authorized Public Disclosure
Guidelines compliance table
 Guidelines compliance table EBA/GL/2017/01 Appendix 1 08 March 2017; Date of application 31 December 2017 (Updated: 14 November 2017) Guidelines on LCR disclosure to complement the disclosure of liquidity
TAX EUROPEAN UNION VAT RATES AND THRESHOLDS. At 1 January 2018
 TAX EUROPEAN UNION RATES AND THRESHOLDS EUROPEAN UNION: RATES & THRESHOLDS Format of number registration Austria AT UST ATU12345678 30,000 (nil for non resident Belgium BE BTW BE 0123.456.789 NIL (option
H Marie Skłodowska-Curie Actions (MSCA)
") H2020 Key facts and figures (2014-2020) Number of FR researchers funded by MSCA: EU budget awarded to FR organisations (EUR million): Number of FR organisations in MSCA: 1 072 311.72 479 In detail, the
H2020 Key facts and figures (2014-2020) Number of FR researchers funded by MSCA: EU budget awarded to FR organisations (EUR million): Number of FR organisations in MSCA: 1 072 311.72 479 In detail, the
Imputed Rents in EU-SILC. Results from Net-SILC2 work package on imputed rents
 Imputed Rents in EU-SILC Results from Net-SILC2 work package on imputed rents Meeting of providers of OECD income distribution data Paris 21-22 February 2013 Veli-Matti Törmälehto, Statistics Finland 22/02/2013
H Marie Skłodowska-Curie Actions (MSCA)
") H2020 Key facts and figures (2014-2020) Number of FI researchers funded by MSCA: EU budget awarded to FI organisations (EUR million): Number of FI organisations in MSCA: 155 47.93 89 In detail, the number
H2020 Key facts and figures (2014-2020) Number of FI researchers funded by MSCA: EU budget awarded to FI organisations (EUR million): Number of FI organisations in MSCA: 155 47.93 89 In detail, the number
Income Inequality Within and Between European Countries
 Thema 4: Income Inequality Within and Between European Countries European User Conference for EU-LFS and EU-SILC Mannheim, 6 th March 2009 Judith Niehues GK SOCLIFE, University of Cologne Introduction
Guidelines compliance table
 Guidelines compliance table EBA/GL/2018/01 12 January 2018; Date of application 20 March 2018 Guidelines on uniform disclosures under Article 473a of Regulation (EU) No 575/2013 as regards the transitional
H Marie Skłodowska-Curie Actions (MSCA)
") H2020 Key facts and figures (2014-2020) Number of PT researchers funded by MSCA: EU budget awarded to PT organisations (EUR million): Number of PT organisations in MSCA: 716 66,67 165 In detail, the number
H2020 Key facts and figures (2014-2020) Number of PT researchers funded by MSCA: EU budget awarded to PT organisations (EUR million): Number of PT organisations in MSCA: 716 66,67 165 In detail, the number
QUALITY REPORT: ANNUAL FINANCIAL ACCOUNTS
 QUALITY REPORT: ANNUAL FINANCIAL ACCOUNTS PROGRESS REPORT AND INVENTORY 19 th November 2013 Eurostat C-1 Page 1 TABLE OF CONTENTS 1. ABOUT THIS REPORT... 3 2. DATA TRANSMISSIONS DURING 2013... 3 3. COMPLETENESS
Traffic Safety Basic Facts Main Figures. Traffic Safety Basic Facts Traffic Safety. Motorways Basic Facts 2015.
 Traffic Safety Basic Facts 2013 - Main Figures Traffic Safety Basic Facts 2015 Traffic Safety Motorways Basic Facts 2015 Motorways General Almost 30.000 people were killed in road accidents on motorways
Standard Eurobarometer
 Standard Eurobarometer 67 / Spring 2007 Standard Eurobarometer European Commission SPECIAL EUROBAROMETER EUROPEANS KNOWELEDGE ON ECONOMICAL INDICATORS 1 1 This preliminary analysis is done by Antonis PAPACOSTAS
H Marie Skłodowska-Curie Actions (MSCA)
") H2020 Key facts and figures (2014-2020) Number of SE researchers funded by MSCA: EU budget awarded to SE organisations (EUR million): Number of SE organisations in MSCA: 138 114.71 150 In detail, the number
H2020 Key facts and figures (2014-2020) Number of SE researchers funded by MSCA: EU budget awarded to SE organisations (EUR million): Number of SE organisations in MSCA: 138 114.71 150 In detail, the number
52 ECB. The 2015 Ageing Report: how costly will ageing in Europe be?
 Box 7 The 5 Ageing Report: how costly will ageing in Europe be? Europe is facing a demographic challenge. The old age dependency ratio, i.e. the share of people aged 65 or over relative to the working
H Marie Skłodowska-Curie Actions (MSCA)
") H2020 Key facts and figures (2014-2020) Number of LV researchers funded by MSCA: EU budget awarded to LV organisations (EUR million): Number of LV organisations in MSCA: 35 3.91 11 In detail, the number
H2020 Key facts and figures (2014-2020) Number of LV researchers funded by MSCA: EU budget awarded to LV organisations (EUR million): Number of LV organisations in MSCA: 35 3.91 11 In detail, the number
Eurofound in-house paper: Part-time work in Europe Companies and workers perspective
 Eurofound in-house paper: Part-time work in Europe Companies and workers perspective Presented by: Eszter Sandor Research Officer, Surveys and Trends 26/03/2010 1 Objectives Examine the patterns of part-time
Investment and Investment Finance in Slovenia
 Investment and Investment Finance in Slovenia Debora Revoltella Chief Economist European Investment Bank Bank of Slovenia, European Investment Bank, European Commission Conference Ljubljana November 16,
Macro-financial outlook with a view on NPL s and debt restructuring. Vedran Šošić, Vicegovernor
 Macro-financial outlook with a view on NPL s and debt restructuring Vedran Šošić, Vicegovernor February 215 Outline of the presentation Banking system performing well. Elevated NPL level appears to be
ANNUAL ECONOMIC SURVEY OF EMPLOYEE SHARE OWNERSHIP IN EUROPEAN COUNTRIES
 ANNUAL ECONOMIC SURVEY OF EMPLOYEE SHARE OWNERSHIP IN EUROPEAN COUNTRIES 2016 ANNUAL ECONOMIC SURVEY OF EMPLOYEE SHARE OWNERSHIP IN EUROPEAN COUNTRIES 2016 BY MARC MATHIEU EUROPEAN FEDERATION OF EMPLOYEE
Macroeconomic policies in an open economy
 Macroeconomic policies in an open economy We have seen that monetary and fiscal policies affect the interest rate (i) in the short run: expansionary MP reduce i and viceversa, while expansionary fiscal
In 2009 a 6.5 % rise in per capita social protection expenditure matched a 6.1 % drop in EU-27 GDP
 Population and social conditions Authors: Giuseppe MOSSUTI, Gemma ASERO Statistics in focus 14/2012 In 2009 a 6.5 % rise in per capita social protection expenditure matched a 6.1 % drop in EU-27 GDP Expenditure
PROGRESS TOWARDS THE LISBON OBJECTIVES 2010 IN EDUCATION AND TRAINING
 PROGRESS TOWARDS THE LISBON OBJECTIVES IN EDUCATION AND TRAINING In 7, reaching the benchmarks for continues to pose a serious challenge for education and training systems in Europe, except for the goal
Recommendations compliance table
 Recommendations compliance table EBA/REC/2017/03 20 December 2017; Date of application 1 July 2018 Recommendations on outsourcing to cloud service providers The following competent authorities* or intend
Role of governments and social partners in keeping older workers in the labour market (2013)
") Role of governments and social partners in keeping older workers in the labour market (2013) Oscar Vargas Llave Working Conditions and Industrial Relations Eurofound National Forum Trade Unions Malta,
Role of governments and social partners in keeping older workers in the labour market (2013) Oscar Vargas Llave Working Conditions and Industrial Relations Eurofound National Forum Trade Unions Malta,
Social trends and dynamics of poverty and social exclusion. ESDE conference Brussels 06/02/2013
 Social trends and dynamics of poverty and social exclusion ESDE conference Brussels 06/02/2013 1-in-4 people in the EU at risk of poverty or exclusion 27% of working age population at risk of poverty for
The EFTA Statistical Office: EEA - the figures and their use
 The EFTA Statistical Office: EEA - the figures and their use EEA Seminar Brussels, 13 September 2012 1 Statistics Comparable, impartial and reliable statistical data are a prerequisite for a democratic
In 2008 gross expenditure on social protection in EU-27 accounted for 26.4 % of GDP
 Population and social conditions Author: Antonella PUGLIA Statistics in focus 17/2011 In 2008 gross expenditure on social protection in EU-27 accounted for 26.4 % of GDP Social protection benefits are
PROGRESS TOWARDS THE LISBON OBJECTIVES 2010 IN EDUCATION AND TRAINING
 PROGRESS TOWARDS THE LISBON OBJECTIVES IN EDUCATION AND TRAINING In, reaching the benchmarks for continues to pose a serious challenge for education and training systems in Europe, except for the goal
Evaluation of the Part-Time and Fixed-Term Work Directives. Conference on EU Labour Law, 21 October 2013, Brussels
 Evaluation of the Part-Time and Fixed-Term Work Directives Conference on EU Labour Law, 21 October 2013, Brussels Agenda Aims of the Directives Level of change introduced by the Directives Measures to
Investment and Investment Finance. the EU and the Polish story. Debora Revoltella
 Investment and Investment Finance the EU and the Polish story Debora Revoltella Director - Economics Department EIB Warsaw 27 February 2017 Narodowy Bank Polski European Investment Bank Contents We look
Traffic Safety Basic Facts Main Figures. Traffic Safety Basic Facts Traffic Safety. Motorways Basic Facts 2016.
 Traffic Safety Basic Facts 2013 - Main Figures Traffic Safety Basic Facts 2015 Traffic Safety Motorways Basic Facts 2016 Motorways General Almost 26.000 people were killed in road accidents on motorways
Benchmarking options for the effective achievement of the renewable energy target of the EU energy strategy by 2030
 Benchmarking options for the effective achievement of the renewable energy target of the EU energy strategy by 2030 IAEE 2017 Authors: Lukas Liebmann, Christoph Zehetner, Gustav Resch Energy Economics
STAT/14/ October 2014
 STAT/14/158-21 October 2014 Provision of deficit and debt data for 2013 - second notification Euro area and EU28 government deficit at 2.9% and 3.2% of GDP respectively Government debt at 90.9% and 85.4%
H Marie Skłodowska-Curie Actions (MSCA)
") H2020 Key facts and figures (2014-2020) Number of AT researchers funded by MSCA: EU budget awarded to AT organisations (EUR million): Number of AT organisations in MSCA: 215 78.57 140 In detail, the number
H2020 Key facts and figures (2014-2020) Number of AT researchers funded by MSCA: EU budget awarded to AT organisations (EUR million): Number of AT organisations in MSCA: 215 78.57 140 In detail, the number
Neoclassicism in the Balkans
 Neoclassicism in the Balkans Vladimir Gligorov Vienna, May 12, 21 Neoclassical Growth> Stylized Foreign investment driven because of higher productivity in capital scarce countries Investments mostly in