The Impact of the National Minimum Wage on Earnings, Employment and Hours through the Recession
|
|
|
- Job Lindsey
- 6 years ago
- Views:
Transcription
 University of Essex A report to the Low Pay Commission February")
1 The Impact of the National Minimum Wage on Earnings, Employment and Hours through the Recession Mark Bryan Andrea Salvatori Mark Taylor Institute for Social and Economic Research (ISER) University of Essex A report to the Low Pay Commission February
2 Contents Summary Introduction Background Methodology Employed Horizontal difference-in-difference Vertical difference-in-difference Unemployed Data, sample sizes, specification Treated and control group sample sizes Results Employed Employment retention Basic hours The effect of the NMW on the job entry probability of the unemployed Summary and conclusions References Figures Tables
3 Summary Studies of the effects of the National Minimum Wage (NMW) carried out before the recent recession found almost no evidence of significant adverse impacts on employment and only little evidence of a negative impact on hours worked. But so far little is known about the impact of the NMW upratings during the recession. With the downturn in the economy from early 2008, the NMW may have been a more severe constraint on firms than previously if they were less able to absorb cost increases. In this report we estimate the impacts of the NMW upratings during the recession and its immediate aftermath ( ), and compare them with impacts estimated for the preceding years We focus on three outcomes: employment retention, changes in working hours among employees, and the job finding probability of the unemployed. Data and methods The analysis uses difference-in-difference (DID) methods similar to previous studies of the impacts of the NMW, applied to data from the Labour Force Survey (LFS). The DID method involves comparing outcomes for a treatment group of individuals that is directly affected by the NMW with those for a control group of similar individuals earning just above the NMW. We use two variants of the DID method: (i) we examine changes over time in the outcomes of the treatment and control group (horizontal DID) and (ii) we look at differences between the treatment and control group with respect to two additional groups further up the wage distribution (vertical DID). The two methods embody different assumptions about the effects of macroeconomic trends on the treatment and control groups, so the two sets of results provide a sensitivity check on these assumptions. Samples and outcomes For adults (aged over 21 years), we estimate the impact on job retention and changes in basic hours (both measured over 2 quarters) of all the separate NMW upratings from We also estimate the average effects during (the pre-recessionary period) and (the recession and recovery). In addition we use a sample of unemployed adults (and predictions of their hiring wages) to estimate the impact of the NMW on their probability of finding a job within the following quarter. As for job retention and hours changes, we obtain estimates for each year during , and for the combined years and For youths (aged years), owing to relatively small sample sizes, we estimate the impact on job retention and changes in basic hours only for the two combined periods and Furthermore, we do not investigate the impact of the NMW on job finding probabilities for young people due to sample size issues. 3
4 Impact of NMW on employment retention We find little evidence that the NMW upratings affected employment retention in either the pre-recessionary period or during the (post-)recession. There is some evidence that the NMW upratings had an impact in particular years. Most notably the 2006 uprating may have increased employment retention among adult men by around 10 percentage points. However, these results depend on which model specification is used and so should be treated with caution. There is no evidence that the impacts during the recession differed systematically from those in the pre-recession years. Impact of NMW on changes in basic hours We find some evidence that the NMW upratings had an impact on hours, notably among the youth group, for whom we find that the NMW upratings reduced basic weekly hours by around 3-4 hours. However there is little evidence that this impact was greater during the recession than in the pre-recessionary period. A caveat is that these estimates are based on relatively small sample sizes. For adults, we find no systematic effect of the NMW upratings on basic hours across the years. There is some evidence of impacts (both positive and negative) in particular years but they are not always consistent across model specifications. We also find some evidence that the 2010 uprating reduced both men s and women's weekly hours by around 2-4 hours. However, the sample sizes are lower for 2010 because of limited data availability, so this finding must be considered as provisional until further investigation is possible using the full 2011 LFS data release. The effect of NMW upratings on weekly earnings will depend on both the magnitude of the uprating and the size of the hours impact, which offset each other (if the hours impact is negative). Our estimates suggest that among year olds the NMW upratings reduce weekly hours by 3-4 hours, which would imply a loss in weekly earnings, given that typical recent upratings are less than 5%. However, these estimates are rather imprecise, hindering accurate projections of the associated change in earnings. Impact of NMW on job finding probabilities of the unemployed We find no evidence that the NMW affected the probabilities of unemployed adults entering work in any year. Conclusion We find little evidence that the recession has increased the sensitivity of employment and hours worked to increases in the NMW. However, the results add to existing evidence suggesting that the impact of the NMW on hours worked should be a focus of attention. This holds for both the period before the recession and that during the 4
5 recession. Further investigation to obtain more precise estimates of any hours effect is warranted. 5
6 1 Introduction The National Minimum Wage (NMW) was introduced in 1999 and until the onset of the recession in 2008 it operated in the context of a buoyant labour market when real wages were rising, employment rates were high and unemployment rates were low. Numerous studies examined the effects of the NMW on employment and working hours during this period. They found little evidence that either the introduction of the NMW or its upratings had an adverse effect on employment (Stewart 2002, 2004a, 2004b, Dickens and Draca 2005, Dickens et al 2009, Dolton et al 2009), although the NMW may have slowed employment growth (Galindo-Rueda and Pereira 2004). Studies of working hours found either no impact from the NMW (Connolly and Gregory 2002) or evidence of relatively modest hours reductions (Stewart and Swaffield 2008, Dickens et al 2009). With the downturn in the economy from early 2008, the NMW may have been a more severe constraint on firms to the extent that they were less able to absorb cost increases than previously because of falling demand. So far little is known about effects of a minimum wage in a recession. Existing evidence of the impact of a minimum wage during an economic downturn is based on previous recessions. Using data on the operation of the UK Wages Councils, Dickens and Dolton (2011) found no evidence of more adverse effects during the 1980s and 1990s recessions. Dolton and Rosazza Bondibene (2011) used time series data on 33 developed countries from and found some evidence of more adverse employment effects during downturns for young people aged years, although the results were somewhat sensitive to model specification. The vast literature on the employment effects of the minimum wage has almost entirely focused on the effects on already employed workers, with little or no attention given to its impact on the probability of the unemployed entering work. An exception is Dickens et al. (2009) who look at the effect of the NMW upratings on the probability that someone was employed at time t-1 conditional on being employed at time t. This effectively amounts to investigating whether the minimum wage upratings affected the proportion of new hires among those paid at the NMW. While informative, this approach does not allow us to draw direct inferences about how the NMW (or its upratings) affect the job entry probability of the potentially low-paid unemployed. The minimum wage could affect the chances of the potentially low-paid unemployed entering work by limiting the ability of firms to create low-paid jobs. There is evidence that hiring wages are more sensitive to the business cycle than existing wages (Martins et al. 2010, Pissarides 2009) which suggests that the minimum wage may be a particular constraint for firms hiring during a recession. We provide new and unique evidence by looking directly at the probability of the unemployed entering work. We use difference-in-difference methods and quarterly data from the Labour Force Survey (Office for National Statistics 2011) to examine the effects of the NMW in Britain 6
7 during the latest recession and its immediate aftermath, focussing on the job retention, hours and earnings of the employed and the job finding probability of the unemployed. Officially the recession began in the second quarter of 2008 and ended in the second quarter of 2009, so the 2008 uprating of the NMW was made during the recession while the 2009 and 2010 upratings were made in an economy that was only just recovering. In order to assess whether these weak economic conditions affected the impact of the NMW on job retention, hours, earnings and job entry, we compare our estimates for the period to estimates from Overall we find little evidence that the NMW upratings affected employment retention in either the pre-recessionary period or during the (post-)recession. We find some evidence that the NMW upratings had an impact on hours worked, notably among years olds, for whom we find that the upratings reduced basic weekly hours by around 3-4 hours. However, there is little evidence that this impact was greater during the recession than in the pre-recessionary period. We also find some evidence that the 2010 uprating reduced adult men s and women's basic weekly hours by around 2-4 hours. Although consistent with evidence from previous studies that some NMW upratings may have had a negative effect on hours, a caveat to both these results is that they are based on relatively small sample sizes. There is a clearly a need for further research into the hours effects of the NMW. Finally, we find no evidence that the NMW affected the probabilities of unemployed adults entering work in any year. The plan of this report is as follows. In section 2 we explain the importance of studying the effects of the NMW during a recession and present the research questions. Section 3 describes the difference-in-difference methodology used, and Section 4 gives details of the data and variables used. We report the results in Section 5 and draw conclusions in Section 6. 2 Background In 2008 the UK entered its most severe economic downturn since the 1930s, with output falling by around 7% over a recession that lasted 5 quarters. One possible response of firms to a slump in demand is to try to contain labour costs through reductions or freezes in wages. Data on median pay settlements summarised by LPC (2010) show that the level of pay rises fell sharply from 3 4% in late 2008 to around 1 2% in mid 2009, and a large proportion of people received pay freezes. The impact on real wages was much smaller because inflation was falling at the same time, but firms still experienced a cut in real wage costs of about 1% (Gregg and Wadsworth 2010). 1 Data on average weekly earnings (which include additions to basic wages such as 1 This measure of real producer wages is based on the retail price index (RPI) excluding mortgage interest payments. In contrast, real wages as experienced by workers are likely to have risen at this time because inflation measured by the RPI including mortgage interest payments was negative in
8 overtime payments) tell a similar story: annual increases averaged 4.2% from 2000 to 2007, but fell to only 1.8% in the following three years. 2 In the context of overall wage moderation, increases in the minimum wage raise the relative cost of low-wage workers by more than they would during a period of rapid wage growth, and in a recession firms are less likely to be able to absorb such cost increases. Economic theory predicts that in a perfectly competitive labour market, firms will react to increases in the cost of low-wage workers by reducing low-wage employment. If the labour market is not perfectly competitive, there is an offsetting effect because a higher minimum wage attracts more workers into the labour market, and as long as firms can still make profits, they may maintain or even expand employment. Because of the conflicting predictions of theory, the impact in reality is an empirical question. To assess the relative bite of the NMW, Table 1 shows how the annual NMW upratings have compared to annual growth in average weekly earnings (AWE) since There were some large increases in the NMW in its early years, after research failed to find any adverse employment and hours effects of the relatively low initial rates. For example the adult rate increased by nearly 11% between 2000 and 2001, while average weekly earnings rose by only 5%. Rises in the NMW have been smaller in recent years, but even during the recession they have exceeded AWE growth (with the one exception of the increase in the youth rate in October 2010, which was marginally smaller that AWE growth). In particular, weekly earnings fell by 0.2% in the year to October 2009, while both the adult and youth rates of the NMW increased by over 1.2%. These figures suggest that the NMW upratings may have been a real factor influencing firms employment and wage-setting decisions, and so it is important to know whether they resulted in job losses. As well as the possible effects on the employment of existing workers, the presence of a minimum wage may also affect the hiring of new workers. There is evidence that the wages of new entrants to the labour market are more sensitive to the business cycle than the wages of those already in work (Martins et al. 2010, Pissarides 2009). This implies that a minimum wage may be a particular constraint for firms seeking to recruit employees during a recession, as it forces them to pay a higher wage than they would freely choose. Hence the NMW and its upratings may reduce the chances of the lowskilled unemployed entering work during a recession. The aim of this study is to assess the impact of the NMW upratings during the recent recession and its immediate aftermath, comparing our findings to estimates of the impact of the NMW in the years preceding the recession. This comparison will show whether or not the impacts of the NMW upratings are different during a recession, and so whether the LPC should be more cautious in recommending upratings during fragile economic conditions. We address the following specific questions: 2 Increases to October each year. Authors calculations from ONS average weekly earnings series KAB9. 8
9 Do employers react to NMW upratings during a recession by reducing hours or employment more than they otherwise would have? What are the implications of the NMW upratings and any resulting hours changes for workers' earnings? What are the effects of the NMW upratings during the recession on the probability of the non-employed entering work? 3 Methodology 3.1 Employed We identify the effect of the NMW upratings on employment retention and hours worked from 2003 to 2010, and in particular compare the effects in the pre-recession period to those during the recession. We use quarterly data from the Labour Force Survey and adopt a difference-in-difference (DID) approach which closely follows previous studies, and in particular Dickens et al. (2009), Swaffield (2009) and Stewart and Swaffield (2008). We apply two different versions of the DID approach. The first compares the change in outcome of workers directly affected by the NMW uprating (treated group) with the change in outcome of workers who are slightly higher up the wage distribution (control group). The latter are not affected by the uprating but deemed to be similar in all other respects to those that are affected. This is the standard DID which compares changes in outcomes over time for a treated and a control group. We label it horizontal DID. The second version instead focuses on a specific point in time and compares differences in outcomes between the Treated and Control groups with the differences in outcomes between two additional control groups taken from further up the wage distribution. We label this approach vertical DID. Finally, we use a third approach which combines the previous two which we label triple DID. In the following we describe each of these approaches in more detail Horizontal difference-in-difference We identify the impact of NMW upratings on two different outcomes: the change in hours and employment transitions, both over a 6-month (or 2-quarter) period. The annual minimum wage upratings are introduced in October (i.e. at the beginning of quarter 4 (q4)). We divide individuals into the treated group and the control group based on their wages at a particular point in time t at the beginning of the transition. Employees whose wages at time t lie between the current and upcoming minimum wage are included in the treated group, while those whose wage lies in some range above the upcoming minimum wage are in the control group. Changes in hours and employment are categorised according to the quarters in which they start. Changes from q4 of the previous year to q2 in the current year, and from q1 to q3 within the current year are observed following the previous NMW uprating, but 9
10 before the forthcoming uprating, and so are defined as taking place in the before period. Changes measured between q2 and q4 of the current year, and between q3 of current year and q1 of the subsequent year, straddle the NMW uprating, and are defined as taking place in the after period. Figure 1 provides an illustration to help understand the logic underpinning the horizontal DID approach. For simplicity, we take the 2004 uprating as an example and focus on employment retention. The vertical solid line on the right shows the point in time (horizontal axis) when this uprating came into effect. On the two vertical dotted lines we report the wage distribution at the time indicated on the horizontal axis. The horizontal markers on the dotted line indicate the level of wages we use to define the treated (T) and control (C) groups. We experiment by using different definitions (as explained below) but for simplicity we only refer to a particular case here. The group of workers whose wages fall between the 2003 MW (the diamond marker) and the 2004 MW (the full circle marker) are the treated group. Those with wages between the 2004 MW and 1.1 times the 2004 MW (the arrow marker) are the control group. That is, we compare outcomes for those affected by the NMW uprating with outcomes for those earning between the NMW and 10% above the NMW. The picture illustrates that we classify individuals based on their wage in a given quarter (say 2003q4) and then observe whether they are still in employment two quarters later (2004q2). All transitions which complete before the vertical solid line are not affected by the minimum wage uprating and therefore falls within our before time period. Those straddling the uprating (such as those beginning in 2004q2) fall within the after period. The horizontal DID approach looks at the change in outcomes between the before and the after period for each of the treated and control groups. It then takes the difference between these two changes and interprets this as the effect of the treatment (the MW uprating) based on the assumption that in the absence of treatment the change in outcome over time for the two groups would have been the same. Formally, and following the notation adopted in Dickens et al. (2009) we base our analysis on the following model: (Eq 1) where is a variable which takes the value one if the minimum wage uprating has come into effect at time t+1, and zero if not; I(.) is an indicator function taking value 1 if the expression in brackets is true and 0 otherwise; is the wage at the beginning of the transition, is the minimum wage in place at t, and is the upcoming minimum wage; and determine the width and the position of the comparison group. The vector X includes a set of personal and job characteristics to adjust for systematic differences across workers in job retention probabilities. is a measure of 10
11 the difference between the existing wage of individual i and the upcoming level of the minimum wage,. We return to this latter variable below. The coefficient of interest is which identifies the effect of the minimum wage uprating on those directly affected by it. Note that the omitted group for comparison is that of workers whose wage at t falls in the interval. If, this is the group with the wage just above the level of the upcoming minimum wage, but below a certain multiple of it (. For example, a value of means that the highest wage included in the control group is 10% higher than the upcoming NMW. When, an additional group is introduced to allow for the possibility that the NMW uprating affects indirectly even workers whose wage is just above the new level, perhaps because employers raise their wages to maintain differentials relative to the lowest paid workers. is the coefficient capturing the effect of the uprating on this spill-over group. If there are spill-over effects, including this latter group within the control group will bias the results. The other two groups identified by equation (1) are those paid less than the NMW (perhaps because they belong to groups which are not entitled to it, for example participants in some work experience programmes); and the large group of higher paid workers who are excluded from the control group since they not considered to be comparable to minimum wage workers. We have experimented with alternative widths for the spillover and control groups ( ) to test the robustness of our estimates of the impact of the NMW uprating, but here we report estimates of with, and to maximise comparability with previous studies (see, for example, Dickens et al. 2009). Following previous work, to take into account the different size of different upratings, we also estimate a model which introduces an interaction between the treatment indicator and a measure of the difference between the individual s wage and the upcoming level of the NMW. This latter variable is defined as. We use the model in equation (1) to estimate the effect of all the upratings which took place between 2003 and To do so, we estimate the model pooling data from all years together, restricting the effects of the control variables (the parameters) to be the same across years, but allowing all the other parameters (including those capturing the effect of the upratings themselves) to differ from year to year. We therefore allow for differences across treatment and control groups which change over time and identify the effect of each annual uprating. 11
12 We estimate separate models for workers entitled to the adult minimum wage and for the youth group entitled to the development rate 3 (until 2009, 18 21; from 2010, aged 18 20). For adults, the models are estimated separately by gender, to allow for differences in the experiences of men and women in the labour market. For both genders, we also obtain estimates of the average effect of the upratings in the years before the recession ( ) and in years affected by the recession ( ). These estimates are obtained from models where the differences between groups are still allowed to vary from one year to the other. For the youth, although we pool men and women together the sample sizes remain too small to obtain reliable estimates of the effect of each annual uprating. We therefore compute only the estimates of the average effect of NMW upratings before and during the recession. These models include year dummies, but restrict the differences between the treated and control groups to be constant over time. The DID approach rests on two key assumptions: first, that the control group is unaffected by upratings to the NMW, and second, that in the absence of the uprating, the change in outcomes of the treated and the control groups would be the same. The first assumption will not be valid if increases in the NMW affect the wages of higher paid workers. As discussed above, we allow for this possibility by incorporating spillover groups of various sizes into the analysis. The second assumption, sometimes known as the common trend assumption, implies, for example, that in the absence of changes in the minimum wage, the job retention probability of workers paid very close to the minimum wage (the treated group) and those paid slightly above it (the control group) would be affected in the same way by the economic cycle. This hypothesis cannot be tested with the available data because we cannot observe changes in outcomes of the two groups over a period of time with no changes in the minimum wage. We therefore turn to a different but related approach to verify whether the results that we obtain hinge on the common-trend assumption Vertical difference-in-difference The identification problem we face is the lack of a counterfactual scenario in which we can observe both the treated and the control group in the absence of treatment, that is when there are no increases in the minimum wage. In the vertical DID approach the counterfactual is provided by the difference in outcomes between two additional control groups taken at the same point in time from higher up the wage distribution (Stewart 2004b). Figure 2 illustrates the vertical DID approach. Here we are only interested in transitions straddling the NMW uprating, so as an illustration we focus on those starting in 2004q2 and 2004q3. For each quarter, we now define four groups. The first two, the treated and control group, are defined as in the horizontal DID. The two additional control groups 3 The adult NMW was payable to employees older than 21 until October 2010, and to those older than 20 thereafter. We however define adults as employees older than 21 consistently across all years. 12
13 (C2 and C3 are taken from higher up the wage distribution; that is, they are located somewhere in the higher part of the vertical dotted line in the figure). In this approach, we look at the difference in job retention between the treated and the control group and then compare that to the difference in job retention between the two additional control groups. We interpret this as the effect of the MW uprating under the assumption that in the absence of the uprating these two differences would have been the same. To see clearly the parallels between the two DID approaches, notice that in both approaches four different groups are involved. In the horizontal DID those are the treated group before the uprating, the control group before the uprating, the treated group after the uprating and the control group after the uprating. In the vertical DID, the time dimension is replaced with the position of the wage distribution. Neither of the two additional control groups taken higher up the wage distribution are affected by the NMW. They are therefore the equivalent of the two groups in the before period of the horizontal DID. Similarly, the two original treated and control groups are the equivalent of the two groups after treatment in the horizontal DID. So, mirroring the Post dummy in the horizontal DID exercise, in the vertical DID we can define a binary variable for these two lower-wage groups together. Let and be the binary indicators for the original treated and control groups, the lower-wage binary indicator is: Following this logic, it is now clear that in the vertical DID, the treated group and the first of the two additional control groups higher up the wage distribution play the same role as the treated group before and after treatment in the horizontal DID. In the standard representation used for the horizontal DID exercise, a binary variable is included to indicate the treatment group (before and after treatment). In the vertical DID, we can define a binary variable following the same logic. If are binary variables for the two additional control groups, a binary indicator for mirroring the treatment indicator in the horizontal DID is: and This now allows us to write a simple model which resembles the familiar representation of the horizontal DID (see Angrist and Pischke 2009, for example). It is now straightforward to see that is a DID estimator obtained in a setting where differences over time (as in the standard horizontal DID) are replaced by differences over the wage distribution. We estimate this model including demographic controls and by pooling all years together but allowing the coefficients associated with the group dummies (and their interaction) to vary from year to year. This, as in the horizontal-did, and 13
14 allows us to estimate the effect of each individual uprating separately. Because the vertical DID focuses on a point in time when treatment is in place, only transitions starting in quarters 2 and 3 of each year (and therefore straddling the uprating at beginning of quarter 4) are included in the estimation sample. The fundamental identification assumption is that the difference in average outcomes between the two additional control groups is the same as would be observed between the treated and the control group if there was no NMW uprating. Unlike the identification assumption underlying the horizontal DID approach, this allows the economic cycle to have a different effect on the treatment group compared to the control group, provided that this difference is mirrored in the two additional control groups. If the gap in outcomes between the treatment and control groups would differ from the gap between the two additional control groups ( in the absence of a NMW uprating, then the vertical DID estimate would be biased. To check the sensitivity of our estimates to this common gap assumption, we can construct a further counterfactual estimate. For every NMW uprating, we observe both transitions/changes which happen entirely before the uprating and transitions/changes which straddle the uprating. We therefore can obtain a vertical DID estimate from a period when there was no minimum wage uprating. This estimate can then be subtracted from the vertical DID estimate from the period with the uprating, to allow for a difference in outcomes between groups and relative to groups. This is effectively what is often referred to in the literature as a triple DID, where differences are taken both over different groups in the wage distribution (as in the vertical DID) and over time (as in the horizontal DID). In this paper we report results from this model in addition to the horizontal DID results. Figure 3 illustrates the triple-did approach again by focusing on the 2004 uprating and restricting attention to employment retention. It is immediately clear that this approach is just a combination of the previous two. We define four groups in each period (as in the vertical DID) but then also follow them over time (as in the horizontal DID). The triple DID can therefore be seen as the difference between two vertical DID estimators or, alternatively, as the difference between two horizontal DID estimators. Throughout this part of the analysis, the treated and the control group are constructed as described in the section on the horizontal DID. The two additional groups are constructing following three different methods, as suggested by Stewart (2004b) and Swaffield (2009): 1. The two groups are taken from wage bands of the same relative width as the first control group that is if the control group includes workers with wage such that and, the next control group 14
15 includes workers with wage such that and so on. 2. The two groups are selected to be of equivalent sample size as the first control group. 3. The two groups are selected to ensure that the differences in median wage between consecutive groups are constant. We check the robustness of the results to these three different ways of constructing the additional control groups. 3.2 Unemployed As well as examining the impact of the NMW upratings on employment and hours, we also look at the effect of the NMW on the probability of the unemployed entering work. To do this we adopt a difference-in-difference approach which mirrors that used for the employed, except that the groups are defined using the predicted wage distribution rather than the actual wage distribution. This is necessary because we do not observe the wages of unemployed people. Instead, as described below, we form a prediction of the wage that each unemployed person would get if they worked, and then classify them according to their wage level relative to the NMW. Generating predictions for the unemployed based on the wages of the employed can be problematic because of selection issues. For example, the unemployed and the employed might differ in ways we do not observe and which might also affect their wages when in employment. This would imply that the wage that we would observe for an unemployed person upon entering employment would be different from the average wage observed for alreadyemployed people with similar observable characteristics. This issue has been recognised in the literature, but is rarely addressed 4. To ensure that we predict wages using a population that is as similar as possible to the unemployed we estimate the wage equation using new hires only; that is individuals who have only just entered work from unemployment. There are technical difficulties in identifying accurately which of the unemployed would receive a wage falling within the limited range affected by the minimum wage upratings (i.e. between the current and forthcoming NMW). Instead we classify people into wider treatment and control groups based on receiving the NMW itself rather than being affected by an annual uprating. In addition, since the NMW was in place for the entire time period under consideration ( ) it is not viable to use the horizontal DID approach (we do not observe the outcome both before and after the introduction of the NMW). Hence we restrict our attention to the vertical DID approach. We use a three-step procedure to study the effect of the NMW on the job entry probability of the unemployed. 4 One exception is Neumark and Adams (2003). After acknowledging that there is no credible way to identify the selection mechanism, they check the robustness of their results when predicted wages for the unemployed are reduced by a certain percentage, on the grounds that it seems reasonable to assume that the unemployed would command lower wages than the employed. 15
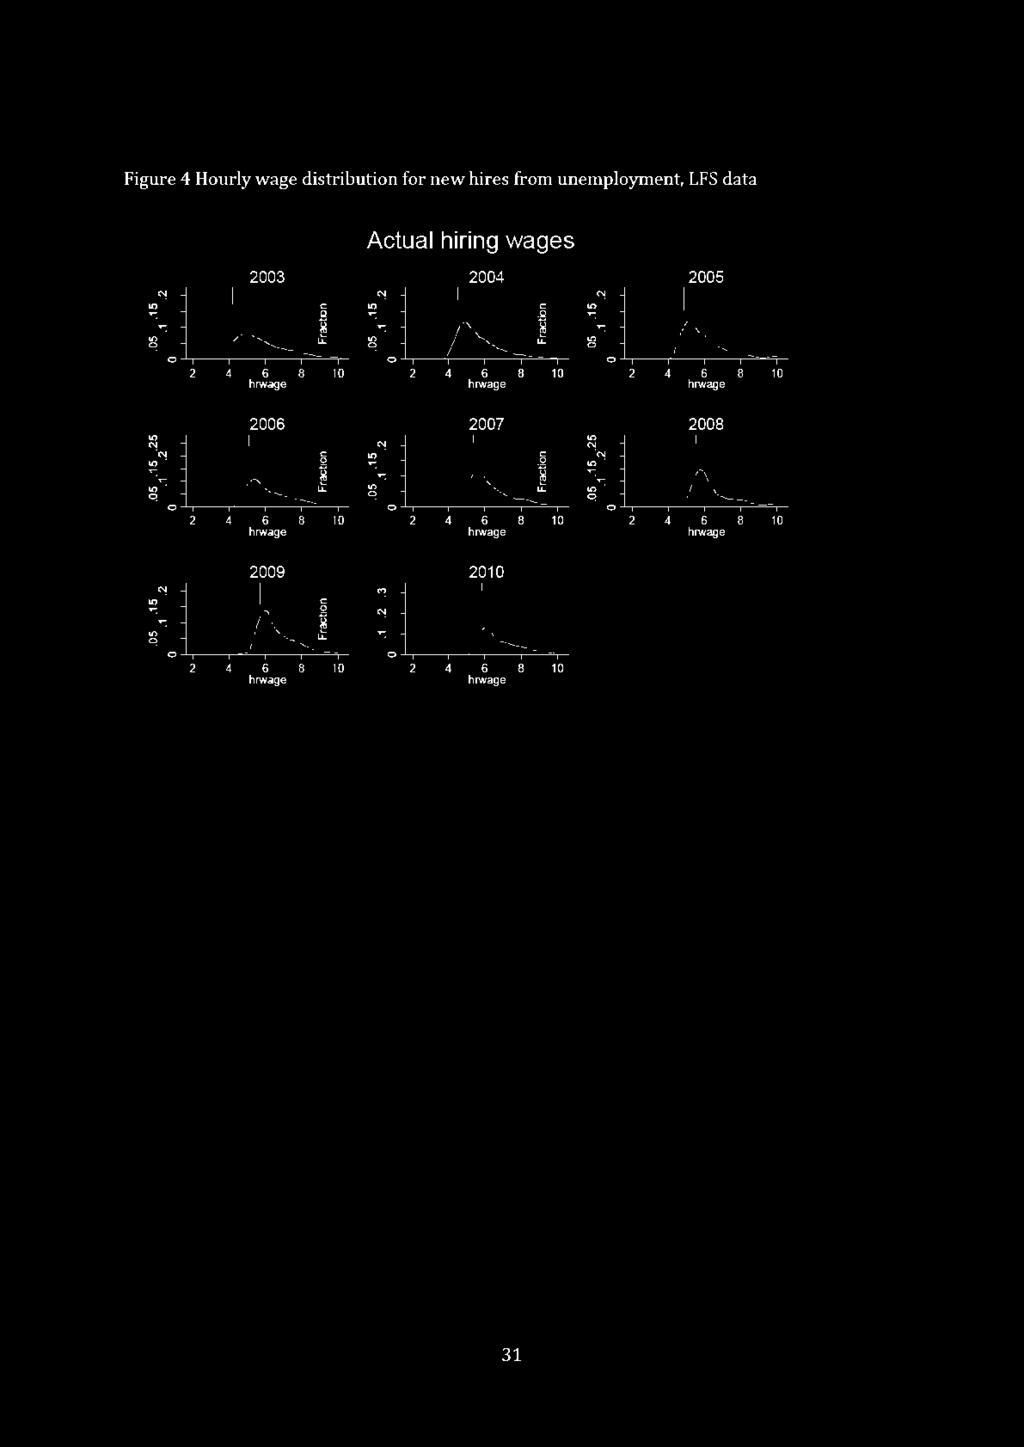
16 First, we estimate a hiring wage equation on the sample of new hires in the LFS, that is the sample of people who move from unemployment to employment over the period of time they remain in the survey. This is estimated using a tobit model which takes into account the left-hand censoring (or spike) of the wage distribution caused by the NMW. We estimate models separately for each four consecutive quarters covered by the same level of the NMW. The variables included in these models include both standard demographic characteristics and information collected specifically about the unemployed, such as the duration of unemployment, and search method used etc. Second, we use the estimates from these tobit models to predict a hiring wage for each unemployed individual in our sample, based on their demographic characteristics and unemployment history etc. Individuals are then assigned to treated or control groups depending on where on the predicted wage distribution they fall. The treated group comprises the unemployed with a predicted hiring wage between 95% and 105% of the NMW in place at a given point in time 5. The first control group includes the unemployed with a predicted hiring wage between 105% and 115% of the NMW 6. The two additional control groups necessary to perform the vertical DID exercise are selected using the first two methods described for the employed 7. The third and final step consists in estimating the effect of the NMW on the job entry probability of the unemployed using the same regression model described for the employed. 4 Data, sample sizes, specification We use data from the Special Licence edition of the Labour Force Survey (LFS) (Office for National Statistics 2011), which contains more information, especially for the unemployed, than the standard edition of the LFS. Special Licence data are available from 2003q1 to 2010q4 so we restrict our attention to this period. Because the minimum wage is changed in October every year, the unavailability of data from 2002q4 and 2011q1 limits the precision of the estimates for the 2003 and 2010 upratings. 8 5 Arguably, even those with a predicted wage below 95% of the NMW should be included in the treated group. In fact, given that the wage floor is legally binding, they too would be hired at the NMW and are affected by it. However, people with very low predicted wages can also be seen as much less likely to enter work. Their inclusion in the treated group could therefore yield a difference in outcomes (job finding probability) between the treated and the control group which is unlikely to be reflected in the difference between the two additional control groups. This would then violate the identification assumption underlying the vertical DID approach adopted here. 6 We have experimented with different thresholds to define the control groups and the results are not substantively affected. 7 Cell sizes were too small for the third method (groups selected to ensure fixed difference in median wages) to be used. 8 The precision of the coefficients on the socio-demographic characteristics will be much less affected because, in the DID exercise, we restrict then to be constant across years to improve precision. 16
17 We use data from the quarterly cross-sectional datasets and match them across quarters to follow individuals over time. Each individual remains in the LFS sample for 5 consecutive quarters at most. As explained in section 3, we look at labour market transitions and changes in hours worked over 3 consecutive quarters. LFS data have already extensively been used in the analysis of the effects of the NMW. Two wage measures are available, namely a self-reported hourly wage (hrrate) and derived hourly pay (hourpay). The relative merits of the two have been widely discussed (see for example Stewart 2004a,b Dickens and Manning 2004, Dickens and Draca 2005 and Dickens et al. 2009). We follow most of the literature in preferring hrrate on the grounds that its distribution exhibits a much clearer spike at the minimum wage and is generally regarded as being less affected by measurement error. As explained in section 3, our methodology to study the effects of the NMW on the job finding probability of the unemployed first requires the estimation of a hiring wage equation. We define as new hires individuals we observe employed (that is, who report a wage) at a given quarter after having being unemployed at some earlier quarter. Note that we restrict attention to those unemployed according to the ILO definition of unemployment. Inactive individuals are excluded from the sample. We estimate a hiring wage equation separately for each of the four consecutive quarters covered by the same level of the NMW. For example, quarters from 2004q4 to 2005q3 are covered by the same level of the NMW and are pooled together and labelled as 2005 for convenience in our analysis. New hires are included in the year in which they were last observed as unemployed. In the LFS, individuals are asked about their wage in wave 1 (that is, upon entering the survey) and in wave 5 (that is, the last quarter they are interviewed). Since we need to observe newly employed workers before they were employed in order to be able to predict the wage for the unemployed, we necessarily restrict our attention to workers in wave 5 in each quarter. Table 2 presents the number of new hires by year and gender. In order to maximise sample sizes, we pool men and women together when estimating the hiring wage equations. Tobit models are used to account for the spike at the minimum wage which can be seen in Figure 4. The hiring wage equations include the following demographic variables: age, gender, marital status, highest level of education, region, ethnicity, number of children, age left education, and whether the respondent has health problems. In addition, we include the following variables relating to their unemployment spell: whether looking for part-time work, whether ever worked, previous occupation if ever worked, whether worked as an employee, duration of unemployment, method of job search and activity before actively looking for work. When we estimate the DID equations for the unemployed we include the same set of controls. The controls we use in the DID equations for the employed include all the demographic variables listed for the unemployed plus additional job characteristics: in particular industry, public sector, occupation, and tenure. 17
18 4.1 Treated and control group sample sizes Table 3 reports sample sizes for the treated and control group in the horizontal DID exercise. These refer to the employed and are presented separately by gender and for the before and after periods. The table shows that cell sizes are generally larger for adult women than for adult men, reflecting the fact that more women are found at the bottom of the wage distribution. Cell sizes for youth are too small to provide reliable estimates for the individual upratings and therefore, following previous studies, we present results based on samples pooled across gender and across groups of years (recession vs pre-recession) for those aged below 22. Table 4 reports cell sizes for the additional control groups constructed for the vertical DID exercise. See section 3 for the details on how such groups are constructed under different methods. The table shows that methods 1 and 2 return satisfactory cell sizes, while method 3 groups defined to maintain a fixed distance between their median wages leads to some small or even empty groups, especially for the more recent years. (This is because there are fewer workers in the region above the NMW, as compared to the spike around the NMW itself, and the difference between the median wages of the original treatment and control groups may be very small.) Table 5 reports sample sizes for the treated and control group for the vertical DID exercise for the unemployed. As described in section 3, the unemployed are assigned to different groups based on the wage predicted by tobit models run on the sample of new hires in every year. 5 Results 5.1 Employed Employment retention We first present the results for the probability of remaining in employment over a 6 month period obtained from the horizontal DID exercise. We report the coefficients obtained using a linear probability model (LPM), but the estimates are substantively the same when the marginal effects from a logit model are considered. The tables report estimates obtained when using both a simple treatment indicator and when using its interaction with the wage gap measure, as described in section 3. In addition, we show results with and without controls, and with and without a spill-over group separate from the reference control group. For adults, we report estimates for each individual uprating (Tables 6 and 7) and also the average effect over and separately (Table 8). These latter estimates are also accompanied by the results of a Wald test for the null hypothesis that the two effects are the same. For youth, we only report estimates for the two aggregate periods due to small sample sizes (Table 8). 18
19 Table 6 reports the estimated impact on employment of the NMW upratings for adult men. The first four columns show results obtained using a simple binary treatment indicator, while in the remaining four columns this is interacted with a wage gap variable. The estimated coefficients are generally small and statistically insignificant and do not seem to be affected systematically by the inclusion of controls or by allowing a spill-over group. A notable exception to the pattern of small and insignificant estimates is given by the 2006 uprating which is estimated to have had a positive impact on job retention in excess of 10 percentage points across columns. This finding is not, however, confirmed when using the wage gap as the treatment variable. Dickens et al. (2009) also found some evidence of a positive (but smaller) effect of this specific uprating, although again the finding was not robust across model specifications. The bottom of the table shows that the estimated coefficients tend to be negative and larger in magnitude in the recession years - particularly for 2010 for which we report an estimated effect in excess of 6 percentage points. None of these estimates are however statistically significant. The top panel of Table 8 shows that we are unable to detect statistically significant differences between the average effect of upratings before and during the recession the Wald tests for equality of coefficients do not reject the null hypothesis that the estimates for pre-recession and recession periods are the same. Table 7 shows that the estimated impact on employment of the NMW upratings for adult women are generally smaller than those for men and are again statistically insignificant across models. The middle panel of Table 8 indicates that as for men there are no statistically significant differences in the impact of NMW upratings in the pre-recession period compared to during the recession. The bottom panel of Table 8 focuses on the estimated impact of the youth NMW upratings (which applies to year olds). We generally find no clear evidence of an effect for this group of workers. We obtain statistically insignificant coefficients with signs that change depending on whether or not controls are included in the specification. This is the case both for the estimates before the recession and for those during the recession. The results of the Wald tests for the differences between the two time periods are also sensitive to the inclusion of controls. In fact, when the treatment indicator is interacted with the wage gap, the Wald tests point to statistically significant differences (in columns 5 and 7), but such differences disappear when controls are included (in columns 6 and 8). The horizontal DID estimates are based on the underlying assumptions that the employment retention probability of the treated and control groups would follow the same trends in the absence of the treatment (the NMW uprating). In order to check the robustness of our results to these underlying identification assumptions, we turn to the estimates from the vertical DID models. We report results from the triple DID where we compare the DID estimates over time for the treated and control group with the DID estimate for two additional control groups from higher up the wage distributions. We therefore relax the assumption that DID estimate would have been zero in the absence 19
20 of the minimum wage uprating and instead assume that the counterfactual for what would have happened in the absence of treatment is represented by these two additional control groups. Three different methods are adopted to define these groups (see section 3.1.2). Table 9 and Table 11 present these results. Each pair of columns in these tables is obtained using the same group definitions 9, with the first column in the pair reporting results for the model with controls and the second column those without controls. Table 11 does not report the results obtained using method 3 since that leads to empty cell sizes in particular in the most recent years and makes averages over the recession potentially misleading. The results of the triple DID exercise are consistent with those from the horizontal DID. For men (Table 9) we obtain estimates which are generally small and statistically insignificant. The estimates for 2006 under method 2 (columns 3 and 4) stand out as they are statistically significant at the 5% level and very large suggesting a positive impact of more than 16 percentage points. The estimates for the same year obtained using the other two methods to construct the control groups (columns 1-2 and 5-6) are however much smaller and statistically insignificant. Overall, therefore, the support for significant positive effect in 2006 is weaker than that provided by the horizontal DID estimates of Table 6. The last row of Table 9 also shows that the indication of a negative effect in 2010 is weaker than in the horizontal DID exercise, as the sign of the coefficient changes across methods. Estimates in the top panel of Table 11 confirms that we do not detect any significant differences in the average effect of the NWM upratings before and during the recession as confirmed by the results of the Wald tests in the same table. Table 10 shows estimated coefficients for women that are also mostly small and statistically insignificant across models. There is some weak evidence of a positive and sizeable effect in Using methods (1) and (2) to define the counterfactual yields estimates which suggest the NMW upratings increased job retention rates by more than 7 percentage points, but statistically significance at the 10% level is only reached under method 1 with no controls (column 1). The estimates in Table 11 indicate that for women the average effects for the pre-recession and the recession periods remain predominantly positive across models, are very small in magnitude, and statistically insignificant as shown. The Wald tests do not reject the null hypothesis of equal coefficients in the pre-recession and recession years. Taking all the results together, we see little evidence that the NMW affected employment retention in either the pre-recessionary period or during the recession. The NMW may have had some impact in particular years, most notably it may have 9 When using method 3, we obtain very small (and even empty) cells for some of the years under consideration. This leads to the missing estimates in columns 5 and 6 of these tables. 20
21 increased employment retention among men in 2006, but these results are quite sensitive to model specification and so should be treated with caution Basic hours Table 12 through Table 14 report the results for the horizontal DID estimates for the effect of the NMW upratings on the change in weekly contracted hours (basic hours) over a 6 month period. The results for the sample of men reported in Table 12 show that the estimated effects of the upratings across years vary in statistical significance, in magnitude and in sign. For example, there is some evidence that the 2004 uprating was associated with an increase in basic hours of around 2 hours per week. Furthermore, this effect was significantly larger for those whose wage required a larger adjustment to comply with the new level of the NMW, as shown by the positive estimates in columns 5 to 8 where the treatment indicator is interacted with a wage gap measure. In contrast, the estimates for 2006 are all negative; the estimates in the first four columns obtained with the simple treatment indicator all imply a decrease of more than 1 hour, with those in the first two columns (no spill-over group) being larger and statistically significant at the 5% or 10% level. The estimates in the final four columns, which allow the effect of the uprating to vary with the wage gap, are also consistently negative. The magnitude of these coefficients does not change dramatically across models, but none reach statistical significance at any conventional level. There is also some indication of a larger negative effect (in excess of 3 hours) for The estimates obtained with a spill-over group are larger (greater than 3.7 hours for the treatment dummy in columns 3 and 4 and greater than 3.1 hours for the interaction between the dummy and the wage gap in columns 7 and 8). However, only two of these estimates reach statistical significance, and only at the 10% level. Furthermore the Wald tests in Table 14 show that there are no systematic differences between the average effects of the upratings on hours before and during the recession among adult men. Table 13 reports the results for women. The estimated effects of the NMW upratings on hours for the years 2004 to 2009 are all small (less than an hour and in most cases less than half an hour) and statistically insignificant. Furthermore there is no consistent pattern in the direction of the effect. However, and consistent with the evidence for adult men, there is some support for a negative effect in 2010 indicating that the NMW uprating reduced working hours by between one and two hours per week. The average effects before and during the recession reported in the second panel of Table 14 are mostly negative but again not statistically significant. The estimates for the recession period tend to be more negative that those for the pre-recession period (by about half an hour) but these differences are not statistically significant. 10 An additional reason to be careful about focusing on individual statistically significant coefficients in a context in which many regressions are estimated is that, for any given level of significance level, it is to be expected that some estimates will be statistically significant even if the true effect is in fact zero. 21
22 The evidence for the youth at the bottom of Table 14 presents much stronger evidence that the NMW upratings reduced working hours among year olds the estimated coefficients are generally negative and statistically significant. This is true for both the pre-recession and the recession period, although the sizes of the effects are larger for the recession period than the pre-recession period (between 3 and 4 hours compared with between 4 and 5). These differences appear statistically significant at least when controls are included in the specification (columns 2 and 4) as indicated by the Wald tests at the bottom of the table. Across models, the NMW upratings seem to have reduced the working hours of the youth by around 5 hours. Table 15 through Table 17 report the estimates obtained by the triple difference approach 11 For men the results in Table 15 are broadly consistent with those from the horizontal DID exercise. In particular, there is some support for a positive effect of the 2004 uprating on hours worked and a negative one for the The triple difference estimates tend to be larger in magnitude. The estimates for 2010, although similar in size to those from the horizontal DID (about 3 hours), fail to reach statistical significance at any conventional level. Overall, however, we do not detect systematic differences between the pre-recession and the recession period as shown by the Wald tests in Table 17. For women, the triple DID exercise also portrays a picture similar to that of the horizontal DID, as shown in Table 17. In fact, the estimates are generally very small and statistically insignificant, with the exception of 2010 which yields negative coefficients in excess of 1 with methods 1 and 2. The estimates obtained under method 2 reach statistical significance at the 10% level. The average estimates in Table 17 are negative and less than one for both the pre-recession and the recession. They appear slightly larger than that from the horizontal DID, but are not found to differ significantly between the pre-recessionary and recessionary periods, as indicated by the Wald tests. Overall, we find more evidence that the NMW upratings had an impact on hours worked than on employment retention. The effect is most evident among the youth group, where we find that the NMW reduced basic weekly hours by around 3-4 hours during both the pre-recessionary and recessionary periods (the impact does not appear to have been larger during the recession). For adults, there does not seem to be a systematic effect of the NMW on basic hours across the years, but there is some evidence of impacts (both positive and negative) in specific years. Of particular interest, we find some evidence that the 2010 uprating reduced both men and women s hours by around 2-4 hours. We stress, however, that the sample sizes are lower for 2010 because of limited 11 Due to the problem of empty cells in the most recent years, Table 17 does not report average estimates obtained under method 3. 22
23 data availability, so this finding is only provisional. Further investigation is warranted when the full 2011 data are released. 5.2 The effect of the NMW on the job entry probability of the unemployed The estimates of the effect of the NMW on the probability of the unemployed entering work are presented in Table 18 to Table 20. All of these estimates are from linear probability models where the dependent variable is the probability of moving from unemployment to employment from one quarter to the following one. The results are from a vertical DID exercise where the unemployed are grouped into treated and control groups based on their predicted hiring wages. This prediction is from a hiring wage equation which is estimated separately for each year using a tobit model to take into account the left censoring induced by the minimum wage. These first-stage tobit models always include all the controls discussed in section 4. We report results from the second-stage linear probability models with and without controls, as indicated at the bottom of the tables. Two different methods (discussed in section 3) are adopted to define the treated and the control groups. Results for the two methods (with and without controls) are reported in columns 1 2 and 3 4 of the tables respectively. To account for the additional variation induced by the presence of the first step tobit models, the standard errors presented here have been bootstrapped 12. Table 18 presents the results for men. The estimated coefficients are generally small and never statistically significant. We do not find any clear pattern before or during the recession. For example, the estimates for 2008 are all very close to zero, those for 2009 are positive and slightly larger (ranging from 1.5 percentage points to 5.4) and those for 2010 are negative and all just above 2 percentage points. The lack of clear differences before and during the recession is clearly confirmed by the average estimates for men over these periods reported in the top panel of Table 20. Table 19 shows the results for women. As for men, we find no statistically significant effect across years, methods of constructing the control groups and specifications. The estimates tend to be small on either side of zero and we observe changes in signs across columns for 5 of 8 of the years considered. For 2004 and 2005, we obtain estimates that are consistently positive across the columns of Table 19 and between 4-7 and 3-4 percentage points respectively. For 2009, we obtain negative estimates between -3 and -5.5 percentage points.. The average effects for the periods before and during the recession reported in the bottom panel of Table 20 are always statistically insignificant. While the estimates for the recession are negative across the four columns, those obtained with method 1 are effectively indistinguishable from zero and those obtained with method 2 are no larger than 2.2 percentage points. Not surprisingly, the Wald tests fail to reveal any significant difference between the pre-recession and the recession estimates. 12 We performed a cluster bootstrap in STATA with 500 repetitions with clusters defined at the individual level. The clustering was necessary because an individual can be observed repeatedly in our sample. 23
24 6 Summary and conclusions In this report we have analysed the impact of the NMW upratings from 2003 to 2010 on employment retention, changes in working hours, and on the job finding probability of the unemployed. We have used DID methods applied to the LFS, looking both at changes over time in the outcomes of a treatment and control group (horizontal DID), and at differences between the treatment and control group with respect to two additional groups further up the wage distribution (vertical DID). The two methods lead to qualitatively similar estimates, suggesting that our results are not sensitive to assumptions about how macroeconomic trends affect the treatment and control groups respectively. For adults, we have estimated the impacts of all the separate NMW upratings from , as well as estimating the average effect during (the pre-recessionary period) and (the recession and recovery). For youth, owing to relatively small sample sizes for this age group, we have only estimated the average effects during the pre-recessionary period and the (post-)recession, and we did not investigate the impact on job finding probabilities. We find little evidence that the NMW upratings affected employment retention in either the pre-recessionary period or during the (post-)recession. There is some evidence that the NMW had an impact in particular years, most notably it may have increased employment retention among men in However, these results depend on which model specification is used and so should be treated with caution. Our findings about the general lack of an employment impact before the recession are consistent with previous studies; and our evidence suggests that the NMW upratings had no employment effects during the recession either. In contrast, we find some evidence that the NMW upratings had an impact on hours worked. The effect is most evident among the youth group, where we find that the upratings reduced basic weekly hours by around 3-4 hours. However there is little evidence that this impact was greater during the recession than in the pre-recessionary period. For adults, we do not find a systematic effect of the NMW upratings on basic hours across the years, but there is some evidence of impacts (both positive and negative) in specific years. Of particular interest, we find some evidence that the 2010 uprating reduced both men s and women's hours by around 2-4 hours. We stress, however, that the sample sizes are lower for 2010 because of limited data availability, so this finding must be considered as provisional until further investigation is possible using the full 2011 data release. Our findings on hours are consistent with the limited body of previous evidence which suggested that there may be negative effects from the NMW. The effect of NMW upratings on weekly earnings will depend on both the magnitude of the uprating and the size of the hours impact, which offset each other if the hours impact is negative. Thus an uprating of 3% which led to a reduction of 3-4 hours (about 24
25 10% of full-time hours) would reduce full-time weekly earnings by about 7%. Smaller hours impacts would lead to smaller falls, or even increases, in weekly earnings. The magnitude of the hours impacts is typically estimated relatively imprecisely, so further research will be needed in this area. Finally we find that the NMW had no impact on the job finding probabilities of unemployed adults in any year. This finding is broadly consistent with the small amount of previous evidence on job entry (using a different method). Overall we find that the recession has not increased the sensitivity of employment and hours worked to the NMW upratings. Our results add to the accumulating body of evidence which suggests that the impact of the NMW on hours worked should be a focus of attention. Further investigation to obtain more precise estimates of any hours effect is warranted. 25
26 7 References Connolly, S. and M. Gregory (2002). The National Minimum Wage and Hours of Work: Implications for Low Paid Women. Oxford Bulletin of Economics and Statistics. 64, pp August. Dickens, R. and Draca, M. (2005) The Employment Effects of the October 2003 Increase in the National Minimum Wage, Report prepared for the Low Pay Commission, February. Dickens, R. and P. Dolton (2011). Using Wage Council Data to Identify the Effect of Recessions on the Impact of the Minimum Wage. Research Report for the Low Pay Commission. Dickens R. and A. Manning, (2004). Has the national minimum wage reduced UK wage inequality?, Journal Of The Royal Statistical Society Series A, Royal Statistical Society, vol. 167(4), pages Dickens, R., R. Riley and D. Wilkinson (2009). The Employment and Hours of Work Effects of the Changing National Minimum Wage. Research Report for the Low Pay Commission. Dolton, P. and C. Rosazza Bondibene (2011). An Evaluation of the International Experience of Minimum Wages in an Economic Downturn. Research Report for the Low Pay Commission. Dolton, P., C. Rosazza Bondibene and J. Wadsworth (2009). The Geography of the National Minimum Wage. Research Report for the Low Pay Commission. Dolton, P., C. Rosazza Bondibene and J. Wadsworth (2010). The UK National Minimum Wage in Retrospect. Fiscal Studies. 31(4), pp Galindo-Rueda, F. and S. Pereira (2004). The Impact of the National Minimum Wage on British Firms. Research Report for the Low Pay Commission. Gregg, Paul and Wadsworth, Jonathan (2010). Employment in the recession. Economic & Labour Market Review, 4(8): LPC (2010). National Minimum Wage. Low Pay Commission Report The Stationery Office. Martins, P. S. and Solon, G. and Thomas, J (2010) Measuring What Employers Really Do about Entry Wages over the Business Cycle, NBER Working Papers 15767, National Bureau of Economic Research, Inc. Neumark, D. and Adams, S. (2003) Do Living Wage Ordinances Reduce Urban Poverty? Journal of Human Resources, 2003, v38(3,summer), Office for National Statistics (2011). Social and Vital Statistics Division and Northern Ireland Statistics and Research Agency. Central Survey Unit, Quarterly Labour Force Survey, 2003q1-2010q4: Special Licence Access [computer file]. Colchester, Essex: UK Data Archive [distributor] 26
27 Pissarides, C. A. (2009). The Unemployment Volatility Puzzle: Is Wage Stickiness the Answer? Econometrica, 77(5): Stewart, M., (2002). Estimating the Impact of the Minimum Wage Using Geographical Wage Variation. Oxford Bulletin of Economics and Statistics. 64, pp Stewart, M., (2003). Modelling the Employment Effects of the Minimum Wage. Research Report for the Low Pay Commission. January. (University of Warwick.) Stewart, M. (2004a) The Impact of the Introduction of the UK Minimum Wage on the Employment Probabilities of Low Wage Workers, Journal of the European Economic Association, 2, Stewart M. (2004b) The Employment Effects of the National Minimum Wage, Economic Journal, March Vol. 114, no.494, pp.c110-c116 Stewart, M. and J. Swaffield (2008) The other margin: do minimum wages cause working hours adjustments for low-wage workers? Economica, 75, Swaffield Joanna K. (2009). Estimating the Impact of the 7th NMW Uprating on the Wage Growth of Low-Wage Workers in Britain. Report to the Low Pay Commission. 27

28 8 Figures Figure 1- Illustration of the horizontal DID approach 28
29 Figure 2 - Illustration of the vertical DID approach wage C3 C2 C1 T Employed? Employed? 2003q4 2004q1 2004q2 2004q3 2004q4 MW Uprating 29

30 Figure 3 - Illustration of the triple-did approach 30

31
THE EMPLOYMENT AND HOURS OF WORK EFFECTS OF THE CHANGING NATIONAL MINIMUM WAGE. Report prepared for the Low Pay Commission
 THE EMPLOYMENT AND HOURS OF WORK EFFECTS OF THE CHANGING NATIONAL MINIMUM WAGE Richard Dickens*, Rebecca Riley**, and David Wilkinson** *Centre for Economic Performance, London School of Economics and
A Re-examination of the Impact of the UK National Minimum Wage on Employment
 A Re-examination of the Impact of the UK National Minimum Wage on Employment Richard Dickens*, Rebecca Riley** and David Wilkinson** *University of Sussex **National Institute of Economic and Social Research
The Changing UK Labour Market for Young People: Trends Since Yi Zhang Low Pay Commission
 The Changing UK Labour Market for Young People: Trends Since 1992 Yi Zhang Low Pay Commission Outline Introduction to the LPC and why we are interested in the youth labour market Trends in the labour market
HOUSEHOLDS INDEBTEDNESS: A MICROECONOMIC ANALYSIS BASED ON THE RESULTS OF THE HOUSEHOLDS FINANCIAL AND CONSUMPTION SURVEY*
 HOUSEHOLDS INDEBTEDNESS: A MICROECONOMIC ANALYSIS BASED ON THE RESULTS OF THE HOUSEHOLDS FINANCIAL AND CONSUMPTION SURVEY* Sónia Costa** Luísa Farinha** 133 Abstract The analysis of the Portuguese households
4 managerial workers) face a risk well below the average. About half of all those below the minimum wage are either commerce insurance and finance wor
 face a risk well below the average. About half of all those below the minimum wage are either commerce insurance and finance wor") 4 managerial workers) face a risk well below the average. About half of all those below the minimum wage are either commerce insurance and finance workers, or service workers two categories holding less
4 managerial workers) face a risk well below the average. About half of all those below the minimum wage are either commerce insurance and finance workers, or service workers two categories holding less
NATIONAL MINIMUM WAGE. Final government evidence to the Low Pay Commission 2012 JANUARY 2013
 NATIONAL MINIMUM WAGE Final government evidence to the Low Pay Commission 2012 JANUARY 2013 MINISTERIAL FOREWORD The Coalition Government is fully committed to the National Minimum Wage. We believe that
The text reports the results of two experiments examining the influence of two war tax
 Supporting Information for Kriner et al. CMPS 2015 Page 1 The text reports the results of two experiments examining the influence of two war tax instruments on public support for war. The complete wording
Reemployment after Job Loss
 4 Reemployment after Job Loss One important observation in chapter 3 was the lower reemployment likelihood for high import-competing displaced workers relative to other displaced manufacturing workers.
Gender differences in low pay labour mobility and the national minimum wage
 ! Oxford University Press 2008 All rights reserved Oxford Economic Papers 61 (2009), i122 i146 i122 doi:10.1093/oep/gpn045 Gender differences in low pay labour mobility and the national minimum wage By
Monitoring the Performance of the South African Labour Market
 Monitoring the Performance of the South African Labour Market An overview of the South African labour market from 3 of 2010 to of 2011 September 2011 Contents Recent labour market trends... 2 A brief labour
The economic value of key intermediate qualifications: estimating the returns and lifetime productivity gains to GCSEs, A levels and apprenticeships
 The economic value of key intermediate qualifications: estimating the returns and lifetime productivity gains to GCSEs, A levels and apprenticeships Research report December 2014 Hugh Hayward, Emily Hunt
AUGUST THE DUNNING REPORT: DIMENSIONS OF CORE HOUSING NEED IN CANADA Second Edition
 AUGUST 2009 THE DUNNING REPORT: DIMENSIONS OF CORE HOUSING NEED IN Second Edition Table of Contents PAGE Background 2 Summary 3 Trends 1991 to 2006, and Beyond 6 The Dimensions of Core Housing Need 8
Incomes and inequality: the last decade and the next parliament
 Incomes and inequality: the last decade and the next parliament IFS Briefing Note BN202 Andrew Hood and Tom Waters Incomes and inequality: the last decade and the next parliament Andrew Hood and Tom Waters
Individual-level Wage Changes and Spillover Effects of Minimum Wage Increases * Mark B Stewart University of Warwick. October 2010.
 Individual-level Wage Changes and Spillover Effects of Minimum Wage Increases * Mark B Stewart University of Warwick October 2010 Abstract This paper investigates the spillover effects of UK minimum wage
Public-private sector pay differential in UK: A recent update
 Public-private sector pay differential in UK: A recent update by D H Blackaby P D Murphy N C O Leary A V Staneva No. 2013-01 Department of Economics Discussion Paper Series Public-private sector pay differential
Labour. Overview Latin America and the Caribbean EXECUT I V E S U M M A R Y
 2016 Labour Overview Latin America and the Caribbean EXECUT I V E S U M M A R Y ILO Regional Office for Latin America and the Caribbean 3 ILO / Latin America and the Caribbean Foreword FOREWORD This 2016
For Online Publication Additional results
 For Online Publication Additional results This appendix reports additional results that are briefly discussed but not reported in the published paper. We start by reporting results on the potential costs
THE PERSISTENCE OF UNEMPLOYMENT AMONG AUSTRALIAN MALES
 THE PERSISTENCE OF UNEMPLOYMENT AMONG AUSTRALIAN MALES Abstract The persistence of unemployment for Australian men is investigated using the Household Income and Labour Dynamics Australia panel data for
IJSE 41,5. Abstract. The current issue and full text archive of this journal is available at
 The current issue and full text archive of this journal is available at www.emeraldinsight.com/0306-8293.htm IJSE 41,5 362 Received 17 January 2013 Revised 8 July 2013 Accepted 16 July 2013 Does minimum
The Minimum Wage, Turnover, and the Shape of the Wage Distribution
 The Minimum Wage, Turnover, and the Shape of the Wage Distribution Pierre Brochu David A. Green Thomas Lemieux James Townsend January 6 2018 Introduction In recent years, the minimum policy has played
2. Employment, retirement and pensions
 2. Employment, retirement and pensions Rowena Crawford Institute for Fiscal Studies Gemma Tetlow Institute for Fiscal Studies The analysis in this chapter shows that: Employment between the ages of 55
Wage Gap Estimation with Proxies and Nonresponse
 Wage Gap Estimation with Proxies and Nonresponse Barry Hirsch Department of Economics Andrew Young School of Policy Studies Georgia State University, Atlanta Chris Bollinger Department of Economics University
THE NAIRU AND ITS EVOLUTION
 suggests that all signs point to continued stable growth. The final section describes the economic outlook and presents the Administration's economic forecast. THE NAIRU AND ITS EVOLUTION The nonaccelerating-inflation
The Effect of Unemployment on Household Composition and Doubling Up
 The Effect of Unemployment on Household Composition and Doubling Up Emily E. Wiemers WORKING PAPER 2014-05 DEPARTMENT OF ECONOMICS UNIVERSITY OF MASSACHUSETTS BOSTON The Effect of Unemployment on Household
Poverty and Income Inequality in Scotland: 2013/14 A National Statistics publication for Scotland
 Poverty and Income Inequality in Scotland: 2013/14 A National Statistics publication for Scotland EQUALITY, POVERTY AND SOCIAL SECURITY This publication presents annual estimates of the percentage and
What can wages and employment tell us about the UK s productivity puzzle? 1. June 2013
 What can wages and employment tell us about the UK s productivity puzzle? 1 Richard Blundell University College London and Institute for Fiscal Studies Claire Crawford Institute for Fiscal Studies Wenchao
The impact of interest rates and the housing market on the UK economy
 The impact of interest and the housing market on the UK economy....... The Chancellor has asked Professor David Miles to examine the UK market for longer-term fixed rate mortgages. This paper by Adrian
Monitoring the Performance of the South African Labour Market
 Monitoring the Performance of the South African Labour Market An overview of the South African labour market for the Year Ending 2012 6 June 2012 Contents Recent labour market trends... 2 A labour market
AN EXAMINATION OF THE LABOUR MARKET TRANSITIONS OF MINIMUM WAGE WORKERS IN IRELAND PAUL REDMOND, SEAMUS MCGUINNESS AND BERTRAND MAîTRE
 RESEARCH SERIES NUMBER 75 October 2018 AN EXAMINATION OF THE LABOUR MARKET TRANSITIONS OF MINIMUM WAGE WORKERS IN IRELAND PAUL REDMOND, SEAMUS MCGUINNESS AND BERTRAND MAîTRE EVIDENCE FOR POLICY AN EXAMINATION
Peterborough Sub-Regional Strategic Housing Market Assessment
 Peterborough Sub-Regional Strategic Housing Market Assessment July 2014 Prepared by GL Hearn Limited 20 Soho Square London W1D 3QW T +44 (0)20 7851 4900 F +44 (0)20 7851 4910 glhearn.com Appendices Contents
Working Paper No Accounting for the unemployment decrease in Australia. William Mitchell 1. April 2005
 Working Paper No. 05-04 Accounting for the unemployment decrease in Australia William Mitchell 1 April 2005 Centre of Full Employment and Equity The University of Newcastle, Callaghan NSW 2308, Australia
The Economic Impact of a 1.50/hour increase in the National Minimum Wage
 6654_MinimumWageReport_A4_Final_Layout 1 24/09/2014 11:49 Page 1 The Economic Impact of a 1.50/hour increase in the National Minimum Wage A report for Unite by Howard Reed (Director, Landman Economics)
Online Appendix: Revisiting the German Wage Structure
 Online Appendix: Revisiting the German Wage Structure Christian Dustmann Johannes Ludsteck Uta Schönberg This Version: July 2008 This appendix consists of three parts. Section 1 compares alternative methods
The Interaction of Workforce Development Programs and Unemployment Compensation by Individuals with Disabilities in Washington State
 External Papers and Reports Upjohn Research home page 2011 The Interaction of Workforce Development Programs and Unemployment Compensation by Individuals with Disabilities in Washington State Kevin Hollenbeck
Women s pay and employment update: a public/private sector comparison
 Women s pay and employment update: a public/private sector comparison Report for Women s Conference 01 Women s pay and employment update: a public/private sector comparison Women s employment has been
The Low Pay Commission and the National Minimum Wage
 The Low Pay Commission and the National Minimum Wage Presentation to NEDLAC Saturday 20 th June 2015 Richard Dickens Independent Member of UK Low Pay Commission Professor of Economics, University of Sussex
The Gender Earnings Gap: Evidence from the UK
 Fiscal Studies (1996) vol. 17, no. 2, pp. 1-36 The Gender Earnings Gap: Evidence from the UK SUSAN HARKNESS 1 I. INTRODUCTION Rising female labour-force participation has been one of the most striking
Using the British Household Panel Survey to explore changes in housing tenure in England
 Using the British Household Panel Survey to explore changes in housing tenure in England Tom Sefton Contents Data...1 Results...2 Tables...6 CASE/117 February 2007 Centre for Analysis of Exclusion London
CHAPTER 2. Hidden unemployment in Australia. William F. Mitchell
 CHAPTER 2 Hidden unemployment in Australia William F. Mitchell 2.1 Introduction From the viewpoint of Okun s upgrading hypothesis, a cyclical rise in labour force participation (indicating that the discouraged
An Analysis of Public and Private Sector Earnings in Ireland
 An Analysis of Public and Private Sector Earnings in Ireland 2008-2013 Prepared in collaboration with publicpolicy.ie by: Justin Doran, Nóirín McCarthy, Marie O Connor; School of Economics, University
Labor Force Participation in New England vs. the United States, : Why Was the Regional Decline More Moderate?
 No. 16-2 Labor Force Participation in New England vs. the United States, 2007 2015: Why Was the Regional Decline More Moderate? Mary A. Burke Abstract: This paper identifies the main forces that contributed
Monitoring the Performance of the South African Labour Market
 Monitoring the Performance of the South African Labour Market An overview of the South African labour market for the Year Ending 2016 14 July 2016 Contents Recent labour market trends... 2 A labour market
COMMUNITY ADVANTAGE PANEL SURVEY: DATA COLLECTION UPDATE AND ANALYSIS OF PANEL ATTRITION
 COMMUNITY ADVANTAGE PANEL SURVEY: DATA COLLECTION UPDATE AND ANALYSIS OF PANEL ATTRITION Technical Report: February 2013 By Sarah Riley Qing Feng Mark Lindblad Roberto Quercia Center for Community Capital
EPI & CEPR Issue Brief
 EPI & CEPR Issue Brief IB #205 ECONOMIC POLICY INSTITUTE & CENTER FOR ECONOMIC AND POLICY RESEARCH APRIL 14, 2005 FINDING THE BETTER FIT Receiving unemployment insurance increases likelihood of re-employment
A Single-Tier Pension: What Does It Really Mean? Appendix A. Additional tables and figures
 A Single-Tier Pension: What Does It Really Mean? Rowena Crawford, Soumaya Keynes and Gemma Tetlow Institute for Fiscal Studies Appendix A. Additional tables and figures Table A.1. Characteristics of those
Effect of Minimum Wage on Household and Education
 1 Effect of Minimum Wage on Household and Education 1. Research Question I am planning to investigate the potential effect of minimum wage policy on education, particularly through the perspective of household.
Review of the Automatic Enrolment Earnings Trigger and Qualifying Earnings Band for 2019/20: Supporting Analysis
 Review of the Automatic Enrolment Earnings Trigger and Qualifying Earnings Band for 2019/20: Supporting Analysis December 2018 Contents Background... 3 Annual Review... 4 Results of This Year s Review...
Changes to work and income around state pension age
 Changes to work and income around state pension age Analysis of the English Longitudinal Study of Ageing Authors: Jenny Chanfreau, Matt Barnes and Carl Cullinane Date: December 2013 Prepared for: Age UK
Appendix for Incidence, Salience and Spillovers: The Direct and Indirect Effects of Tax Credits on Wages
 Appendix for Incidence, Salience and Spillovers: The Direct and Indirect Effects of Tax Credits on Wages Table A.1. Parameters of Family Credit and WFTC ( per week) April 1999 (FC) October 1999 (WFTC)
Public Employees as Politicians: Evidence from Close Elections
 Public Employees as Politicians: Evidence from Close Elections Supporting information (For Online Publication Only) Ari Hyytinen University of Jyväskylä, School of Business and Economics (JSBE) Jaakko
Executive summary WORLD EMPLOYMENT SOCIAL OUTLOOK
 Executive summary WORLD EMPLOYMENT SOCIAL OUTLOOK TRENDS 2018 Global economic growth has rebounded and is expected to remain stable but low Global economic growth increased to 3.6 per cent in 2017, after
It is now commonly accepted that earnings inequality
 What Is Happening to Earnings Inequality in Canada in the 1990s? Garnett Picot Business and Labour Market Analysis Division Statistics Canada* It is now commonly accepted that earnings inequality that
3: Balance Equations
 3.1 Balance Equations Accounts with Constant Interest Rates 15 3: Balance Equations Investments typically consist of giving up something today in the hope of greater benefits in the future, resulting in
Additional Evidence and Replication Code for Analyzing the Effects of Minimum Wage Increases Enacted During the Great Recession
 ESSPRI Working Paper Series Paper #20173 Additional Evidence and Replication Code for Analyzing the Effects of Minimum Wage Increases Enacted During the Great Recession Economic Self-Sufficiency Policy
Monitoring the Performance of the South African Labour Market
 Monitoring the Performance of the South African Labour Market An overview of the South African labour market for the Year ending 2011 5 May 2012 Contents Recent labour market trends... 2 A labour market
Bargaining with Grandma: The Impact of the South African Pension on Household Decision Making
 ONLINE APPENDIX for Bargaining with Grandma: The Impact of the South African Pension on Household Decision Making By: Kate Ambler, IFPRI Appendix A: Comparison of NIDS Waves 1, 2, and 3 NIDS is a panel
COMMUNITY ADVANTAGE PANEL SURVEY: DATA COLLECTION UPDATE AND ANALYSIS OF PANEL ATTRITION
 COMMUNITY ADVANTAGE PANEL SURVEY: DATA COLLECTION UPDATE AND ANALYSIS OF PANEL ATTRITION Technical Report: February 2012 By Sarah Riley HongYu Ru Mark Lindblad Roberto Quercia Center for Community Capital
Household debt inequalities
 Article: Household debt inequalities Contact: Elaine Chamberlain Release date: 4 April 2016 Table of contents 1. Main points 2. Introduction 3. Household characteristics 4. Individual characteristics 5.
FIGURE I.1 / Per Capita Gross Domestic Product and Unemployment Rates. Year
 FIGURE I.1 / Per Capita Gross Domestic Product and Unemployment Rates 40,000 12 Real GDP per Capita (Chained 2000 Dollars) 35,000 30,000 25,000 20,000 15,000 10,000 5,000 Real GDP per Capita Unemployment
The Effects of Increasing the Early Retirement Age on Social Security Claims and Job Exits
 The Effects of Increasing the Early Retirement Age on Social Security Claims and Job Exits Day Manoli UCLA Andrea Weber University of Mannheim February 29, 2012 Abstract This paper presents empirical evidence
Modelling the Impact of an Increase in Low Pay in the Republic of Ireland
 NERI Working Paper Series Modelling the Impact of an Increase in Low Pay in the Republic of Ireland Niamh Holton Micheál L. Collins May 2016 NERI WP 2016/No 36 For more information on the NERI working
ESTIMATING THE IMPACT OF A MINIMUM WAGE ON THE LABOUR MARKET BEHAVIOUR OF 16 AND 17 YEAR OLDS
 ESTIMATING THE IMPACT OF A MINIMUM WAGE ON THE LABOUR MARKET BEHAVIOUR OF 16 AND 17 YEAR OLDS A report prepared by Warwick Institute for Employment Research for the Low Pay Commission February 2004 Andy
Minimum Wages: Possible Effects on the Distribution of Income
 Fiscal Studies (1996) vol. 17no. c4 pp. 31 48 Minimum Wages: Possible Effects on the Distribution of Income AMANDA GOSLING 1 I. INTRODUCTION Since the 1980s, there has been increased interest among unions
WELFARE REFORM AND THE BEHAVIOUR OF THE UNEMPLOYED. Sarah Brown and Karl Taylor Department of Economics University Of Sheffield InstEAD and IZA
 WELFARE REFORM AND THE BEHAVIOUR OF THE UNEMPLOYED Sarah Brown and Karl Taylor Department of Economics University Of Sheffield InstEAD and IZA Understanding Behaviour Change and the Role of Conditionality
4 Scottish labour market
 4 Scottish labour market Andrew Ross, Fraser of Allander Institute This section provides an overview of key labour market data in Scotland and contrasts these with both UK performance and changes over
Gender Differences in the Labor Market Effects of the Dollar
 Gender Differences in the Labor Market Effects of the Dollar Linda Goldberg and Joseph Tracy Federal Reserve Bank of New York and NBER April 2001 Abstract Although the dollar has been shown to influence
Unemployed Versus Not in the Labor Force: Is There a Difference?
 Unemployed Versus Not in the Labor Force: Is There a Difference? Bruce H. Dunson Metrica, Inc. Brice M. Stone Metrica, Inc. This paper uses economic measures of behavior to examine the validity of the
EstimatingFederalIncomeTaxBurdens. (PSID)FamiliesUsingtheNationalBureau of EconomicResearchTAXSIMModel
FamiliesUsingtheNationalBureau of EconomicResearchTAXSIMModel") ISSN1084-1695 Aging Studies Program Paper No. 12 EstimatingFederalIncomeTaxBurdens forpanelstudyofincomedynamics (PSID)FamiliesUsingtheNationalBureau of EconomicResearchTAXSIMModel Barbara A. Butrica and
ISSN1084-1695 Aging Studies Program Paper No. 12 EstimatingFederalIncomeTaxBurdens forpanelstudyofincomedynamics (PSID)FamiliesUsingtheNationalBureau of EconomicResearchTAXSIMModel Barbara A. Butrica and
Living standards during the recession
 Living standards during the recession IFS Briefing Note 117 James Browne 1. Introduction Living standards during the recession James Browne Institute for Fiscal Studies 1 We are used to our incomes rising
WOMEN'S CURRENT PENSION ARRANGEMENTS: INFORMATION FROM THE GENERAL HOUSEHOLD SURVEY. Sandra Hutton Julie Williams Steven Kennedy
 WOMEN'S CURRENT PENSON ARRANGEMENTS: NFORMATON FROM THE GENERAL HOUSEHOLD SURVEY Sandra Hutton Julie Williams Steven Kennedy Social Policy Research Unit The University of York CONTENTS Page LST OF TABLES
The Impact of a $15 Minimum Wage on Hunger in America
 The Impact of a $15 Minimum Wage on Hunger in America Appendix A: Theoretical Model SEPTEMBER 1, 2016 WILLIAM M. RODGERS III Since I only observe the outcome of whether the household nutritional level
REGULATORY IMPACT STATEMENT FOR MINIMUM WAGE REVIEW 2012
 REGULATORY IMPACT STATEMENT FOR MINIMUM WAGE REVIEW 2012 Ministry of Business, Innovation and Employment February 2013 1 Agency Disclosure Statement 1 This Regulatory Impact Statement has been prepared
The Persistent Effect of Temporary Affirmative Action: Online Appendix
 The Persistent Effect of Temporary Affirmative Action: Online Appendix Conrad Miller Contents A Extensions and Robustness Checks 2 A. Heterogeneity by Employer Size.............................. 2 A.2
Did the Social Assistance Take-up Rate Change After EI Reform for Job Separators?
 Did the Social Assistance Take-up Rate Change After EI for Job Separators? HRDC November 2001 Executive Summary Changes under EI reform, including changes to eligibility and length of entitlement, raise
Not so voluntary retirement decisions? Evidence from a pension reform
 Finnish Centre for Pensions Working Papers 9 Not so voluntary retirement decisions? Evidence from a pension reform Tuulia Hakola, Finnish Centre for Pensions Roope Uusitalo, Labour Institute for Economic
THE EFFECT OF DEMOGRAPHIC AND SOCIOECONOMIC FACTORS ON HOUSEHOLDS INDEBTEDNESS* Luísa Farinha** Percentage
 THE EFFECT OF DEMOGRAPHIC AND SOCIOECONOMIC FACTORS ON HOUSEHOLDS INDEBTEDNESS* Luísa Farinha** 1. INTRODUCTION * The views expressed in this article are those of the author and not necessarily those of
BEAUTIFUL SERBIA. Holger Bonin (IZA Bonn) and Ulf Rinne* (IZA Bonn) Draft Version February 17, 2006 ABSTRACT
 and Ulf Rinne* (IZA Bonn) Draft Version February 17, 2006 ABSTRACT") BEAUTIFUL SERBIA Holger Bonin (IZA Bonn) and Ulf Rinne* (IZA Bonn) Draft Version February 17, 2006 ABSTRACT This paper evaluates Beautiful Serbia, an active labor market program operating in Serbia and
BEAUTIFUL SERBIA Holger Bonin (IZA Bonn) and Ulf Rinne* (IZA Bonn) Draft Version February 17, 2006 ABSTRACT This paper evaluates Beautiful Serbia, an active labor market program operating in Serbia and
Explaining procyclical male female wage gaps B
 Economics Letters 88 (2005) 231 235 www.elsevier.com/locate/econbase Explaining procyclical male female wage gaps B Seonyoung Park, Donggyun ShinT Department of Economics, Hanyang University, Seoul 133-791,
Earning, learning, or concerning? Youth labour market outcomes and youth incomes before and after the recession
 Earning, learning, or concerning? Youth labour market outcomes and youth incomes before and after the recession Paper presented at New Zealand Association of Economists (NZAE) Conference, at Wellington,
The impact of tax and benefit reforms by sex: some simple analysis
 The impact of tax and benefit reforms by sex: some simple analysis IFS Briefing Note 118 James Browne The impact of tax and benefit reforms by sex: some simple analysis 1. Introduction 1 James Browne Institute
Monitoring the Performance
 Monitoring the Performance of the South African Labour Market An overview of the Sector from 2014 Quarter 1 to 2017 Quarter 1 Factsheet 19 November 2017 South Africa s Sector Government broadly defined
Labor Participation and Gender Inequality in Indonesia. Preliminary Draft DO NOT QUOTE
 Labor Participation and Gender Inequality in Indonesia Preliminary Draft DO NOT QUOTE I. Introduction Income disparities between males and females have been identified as one major issue in the process
Usage of Sickness Benefits
 Final Report EI Evaluation Strategic Evaluations Evaluation and Data Development Strategic Policy Human Resources Development Canada April 2003 SP-ML-019-04-03E (également disponible en français) Paper
COMMUNITY ADVANTAGE PANEL SURVEY: DATA COLLECTION UPDATE AND ANALYSIS OF PANEL ATTRITION
 COMMUNITY ADVANTAGE PANEL SURVEY: DATA COLLECTION UPDATE AND ANALYSIS OF PANEL ATTRITION Technical Report: March 2011 By Sarah Riley HongYu Ru Mark Lindblad Roberto Quercia Center for Community Capital
Employment and Hours Impacts of the National Minimum Wage and National Living Wage in Northern Ireland
 Employment and Hours Impacts of the National Minimum Wage and National Living Wage in Northern Ireland Duncan McVicar Queen s Management School Queen s University Belfast d.mcvicar@qub.ac.uk Andrew Park
Monitoring the Performance of the South African Labour Market
 Monitoring the Performance of the South African Labour Market An overview of the South African labour market from 1 of 2009 to of 2010 August 2010 Contents Recent labour market trends... 2 A brief labour
Labour Market Trends
 STUC SG Biannual June 2013 Employment in is increasing and unemployment is decreasing. is outperforming the on all headline labour market measures, employment, unemployment and inactivity. Recent increases
Analysis of Labour Force Survey Data for the Information Technology Occupations
 April 2006 Analysis of Labour Force Survey Data for the Information Technology Occupations 2000 2005 By: William G Wolfson, WGW Services Ltd. Contents Highlights... 2 Background... 4 1. Overview of Labour
Review questions for Multinomial Logit/Probit, Tobit, Heckit, Quantile Regressions
 1. I estimated a multinomial logit model of employment behavior using data from the 2006 Current Population Survey. The three possible outcomes for a person are employed (outcome=1), unemployed (outcome=2)
Evaluating the Introduction of a National Minimum Wage: Evidence from a New Survey of Firms in Ireland
 Evaluating the Introduction of a National Minimum Wage: Evidence from a New Survey of Firms in Ireland Donal O Neill Brian Nolan James Williams Abstract. In April 2000 the Irish government introduced a
Section 7C Finding the Equation of a Line
 Section 7C Finding the Equation of a Line When we discover a linear relationship between two variables, we often try to discover a formula that relates the two variables and allows us to use one variable
MONITORING POVERTY AND SOCIAL EXCLUSION 2013
 MONITORING POVERTY AND SOCIAL EXCLUSION 213 The latest annual report from the New Policy Institute brings together the most recent data to present a comprehensive picture of poverty in the UK. Key points
Appendix A. Additional Results
 Appendix A Additional Results for Intergenerational Transfers and the Prospects for Increasing Wealth Inequality Stephen L. Morgan Cornell University John C. Scott Cornell University Descriptive Results
The economic impact of increasing the National Minimum Wage and National Living Wage to 10 per hour
 The economic impact of increasing the National Minimum Wage and National Living Wage to 10 per hour A report for Unite by Howard Reed (Director, Landman Economics) June 2018 Acknowledgements This research
The Province of Prince Edward Island Employment Trends and Data Poverty Reduction Action Plan Backgrounder
 The Province of Prince Edward Island Employment Trends and Data Poverty Reduction Action Plan Backgrounder 5/17/2018 www.princeedwardisland.ca/poverty-reduction $000's Poverty Reduction Action Plan Backgrounder:
The Effect of the Minimum Wage on the Employment Rate in Canada, by Eliana Shumakova ( ) Major Paper presented to the
 Major Paper presented to the") The Effect of the Minimum Wage on the Employment Rate in Canada, 1979 2016 by Eliana Shumakova (8494088) Major Paper presented to the Department of Economics of the University of Ottawa in partial fulfillment
The Effect of the Minimum Wage on the Employment Rate in Canada, 1979 2016 by Eliana Shumakova (8494088) Major Paper presented to the Department of Economics of the University of Ottawa in partial fulfillment
Quarterly Labour Market Report. December 2016
 Quarterly Labour Market Report December 2016 MB13809 Dec 2016 Ministry of Business, Innovation and Employment (MBIE) Hikina Whakatutuki - Lifting to make successful MBIE develops and delivers policy, services,
SOME IMPORTANT CHANGES IN THE STRUCTURE OF IRISH SOCIETY. A REVIEW OF PAST DEVELOPMENTS AND A PERSPECTIVE ON THE FUTURE. J.J.Sexton.
 SOME IMPORTANT CHANGES IN THE STRUCTURE OF IRISH SOCIETY. A REVIEW OF PAST DEVELOPMENTS AND A PERSPECTIVE ON THE FUTURE J.J.Sexton February 2001 Working Paper No. 137 1 CONTENTS Introductory Note...3 I.
Data Warehouse Monitoring in the Public Employment Service: Austria Statements and Comments
 Data Warehouse Monitoring in the Public Employment Service: Austria Statements and Comments Stephen Lissenburgh Employment Research Policy Studies Institute This paper comments on Data Warehouse monitoring
UK Labour Market Flows
 UK Labour Market Flows 1. Abstract The Labour Force Survey (LFS) longitudinal datasets are becoming increasingly scrutinised by users who wish to know more about the underlying movement of the headline