Estimating Personal Consumption With and Without Savings in Wrongful Death Cases
|
|
|
- Emmeline Hardy
- 6 years ago
- Views:
Transcription
1 Journal of Forensic Economics 13(1), 2000, pp by the National Association of Forensic Economics Estimating Personal Consumption With and Without Savings in Wrongful Death Cases Martine T. Ajwa, Gerald D. Martin, and Ted Vavoulis * I. Introduction In wrongful death cases, forensic economists consider personal consumption costs of a decedent when determining economic damages. Examples of personal consumption costs used by only one person include food, apparel, health care, entertainment, and personal care products. These personal consumption costs are typically deducted from income because they would otherwise have been used exclusively by the decedent and their deduction should allow the family to maintain a comparable standard of living. Many forensic economists have, in the past, attempted to quantify personal consumption costs, but most have ignored a household s savings as a form of delayed consumption. However, it is logical to assume that a portion of the household s savings, whether consumed before or after retirement, would have been consumed exclusively by the decedent just as any other portion of a household s income. By ignoring savings as delayed consumption, the economist s deductions for a decedent s consumption will be too low. This study will present consumption tables which both include and exclude various forms of savings. Prior studies which have attempted to quantify personal consumption costs are numerous. A seminal study by Earl Cheit (1961) calculated the percentage of income consumed by the head of the family by family size. Since then, new data have become available that allow the calculation of consumption not only for the head of a family, but for each parent and child. These data are available through the Bureau of Labor Statistics Consumer Expenditure Surveys. Indeed, Nelson and Patton (1984) recognized that these Consumer Expenditure Surveys could be used to measure personal consumption as a function not only of family size, but also of income level. They found that income for adult males and females varied inversely with family size and with income level (Patton and Nelson, 1991; Lierman, Patton & Nelson, 1998). It is understandable that each member in a large family would consume a smaller portion of income than those in a small family. However, for higher income families, a portion of income appears to be set aside for savings. And if savings represents delayed consumption for these higher income families, then the figures that have been presented in previous studies understate consumption. II. Data The most recent consumer expenditure survey data made available by the Bureau of Labor Statistics are for The tables used in this study can be *Dr. Martine Ajwa and Ted Vavoulis are consulting economists with Vavoulis & Ajwa, Inc. in Fresno, California. Mr. Vavoulis also practices with Vavoulis & Associates in Pasadena, California. Dr. Gerald Martin is Professor Emeritus, California State University, and co-author with Mr. Vavoulis of Determining Economic Damages. 1
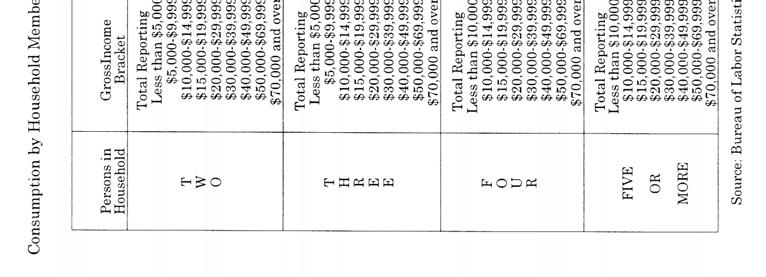
2 2 JOURNAL OF FORENSIC ECONOMICS easily downloaded from the internet at Their tables show the average expenditures in households of various sizes by before-tax income levels. We have ignored consumption for households of one person not only because we typically see lawsuits by those who lived with decedents but also because we would expect that person to consume all his income either as immediate consumption items or later as savings. Even excluding the one person households, there are 59,664 consumer units reporting in these tables. Similar to the Patton-Nelson studies, we have divided consumption across adult males and females. However, considering that the Consumer Expenditure Surveys also account for expenditures on children under age 18, we have added a third category of consumption attributable to children. This figure may not be exact as the average number of children in households of two persons is 0.1, in households of three persons is 0.8, in households of four persons is 1.7, and in households of five or more persons is 2.9. For simplicity, we have assumed that there are two adults in each household with the remaining number of persons represented by children. The Consumer Expenditure Survey lists the average expenditures by an "average" household meeting both household size and income bracket criteria. These expenditures are broken down into categories. We have aggregated male, female, and children s expenditures very similarly to Patton and Nelson (1991): 1. Food, health care, entertainment, personal care products and services, reading, education, and "miscellaneous" items are all divided equally among the household members. 2. Alcoholic beverages, tobacco products, life/personal insurance, cash contributions, and gifts to others are divided only among the adult household members. 3. One-half of "utilities" and "housekeeping supplies" were divided equally among the household members. The remaining household expenditures were considered indivisible. 4. The apparel and services category in the survey breaks down these items across males/females and age groups. Apparel for "Men, 16 and over" was attributed to the male in the household, "Women, 16 and over" to the female in the household, and "Boys, 2 to 15" and "Girls, 2 to 15" were attributed to the children. Therefore, as Patton and Nelson (1991) point out, these expenditures may be overstated for the adults. Footwear and other apparel products were divided equally among family members. 5. The value of transportation to each adult and child varied as did the number of vehicles in a household. For households with fewer than two vehicles, consumption for the male or female was represented by a reduction of expenditures to a household with one vehicle. The one vehicle was considered indivisible consumption. For households with two or more vehicles, consumption for the male and female was represented by a reduction of expenditures by one vehicle with the expenditures on the excess of two vehicles being attributed to the children. For example, in a three person household with 1.6 vehicles and $5,000 spent on transportation, the male or female would be attributed $1,875 (=$5,000/1.6 x 0.6) for the 0.6 vehicle with the remaining $3,125 being considered indivisible. However, in a three-person household with 2.7 vehicles and $8,000 spent on transportation, the male and the female would each be attrib-
3 Ajwa, Martin & Vavoulis 3 uted the value of one vehicle or $2,963 (=$8000/2.7) with the value of 0.7 vehicle being attributed to the children. 6. Unlike Patton and Nelson (1991), we are introducing savings as a delayed consumption item. Savings was defined in two different ways. One form of savings represented gross earnings less taxes, social security, pensions, and expenditures. It may be considered as savings immediately available for consumption. The expenditures deducted include all the categories listed above for male, female, children, and indivisible expenditures. The second form of savings also included pensions and social security and may be considered as savings available for consumption over a longer time horizon. 1 If either form of savings was a negative number, as was often the case for lower income households, it was considered zero savings. No attempt was made to consider "dissaving" or borrowing in this study. With the shorter-term savings, the amount was equally distributed among family members as expenditures. With the social security and pension savings, those figures were divided equally among the adult family members. Therefore, with any positive savings, the children s expenditures included only a portion of the shorter-term savings. By dividing the share of savings among household members this way, several assumptions are being made. First, the assumption for both shorter-term and longer-term savings is that none of the savings will be spent on indivisible consumption items such as housing. If indivisible consumption items are indeed a factor, the adult share may be overstated. The effect on children s share is more difficult to determine since some of the indivisible items may be returned to them in the form of gifts or bequests. Second, the assumption for shorter-term savings is that all household members will utilize the funds equally. This assumption was made due to the limitations of the data. The decision to allocate savings among household members is specific to the household (will the funds be spent entirely on a child s education so the adult share is zero or be used to supplement other retirement programs in which case the adult share is understated?) and cannot be quantified in this data. In addition, the decision to allocate savings among household members is specific to the life-cycle of the household. For example, a household with young children may be more likely to use savings as a down payment on a home (an overstatement of adult consumption) than an older couple who own their own home, whose children have savings for education and are now saving for retirement (an understatement of adult consumption). While it would be an interesting study to consider the age of the household members, the BLS data used do not allow the three-way consideration of the age of the household members with household size and income. Third, with the longer term savings, it is assumed that only the adult members of the household will utilize the funds and that no bequests or gifts to children are made. Therefore, children s consumption factors may be understated if there are indeed inter vivos gifts or bequests. 1Savings were divided into these two categories and presented in two separate tables to provide flexibility. If a loss of earnings support includes a loss of retirement income, the forensic economist may wish to utilize the table which includes social security and pension savings. However, if the loss of earnings support is not considered beyond retirement age, the table which excludes social security and pensions may be more appropriate. For those economists who do not wish to include savings at all (updated Nelson-Patton figures), a corresponding table is also provided.
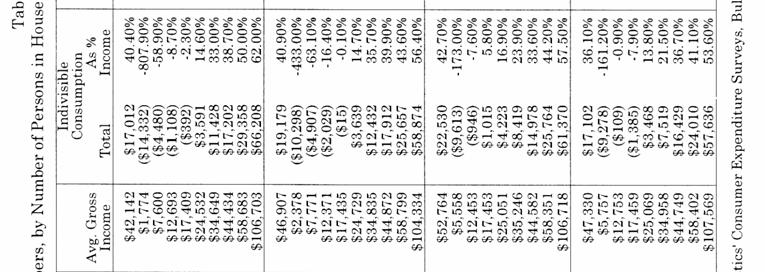
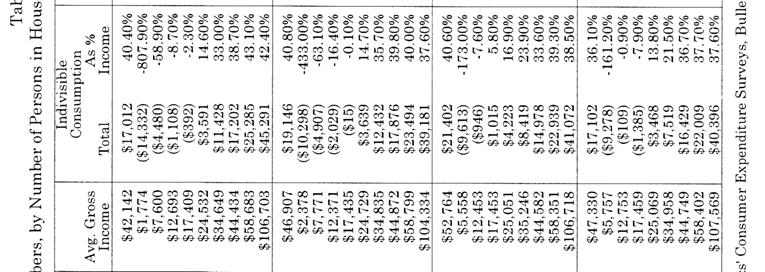
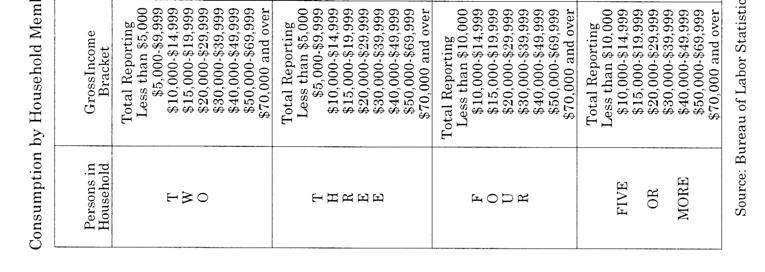
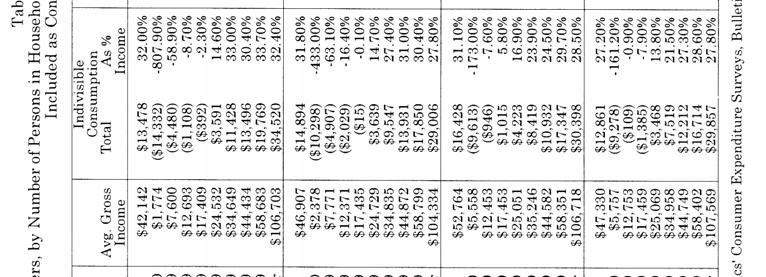
4 4 JOURNAL OF FORENSIC ECONOMICS III. Results and Discussion Tables 1 through 3 contain the consumption figures by the number of persons in the household and by income level. Table 1 excludes savings as a consumption item. Table 2 includes the shorter-term savings (savings available only for immediate consumption), and Table 3 contains short-term savings plus pensions and social security as consumption items. Average gross income was the average for households which fell into the household size and income bracket category. It is the same as reported in the Consumer Expenditure Survey. In all tables, indivisible consumption is represented only as the difference between average gross income and consumption of all household members. Theoretically, it includes taxes, most housing expenditures, the value of a vehicle in households with fewer than two vehicles, and savings where relevant. It should be noted that by calculating indivisible consumption in this manner, households with fewer than two vehicles have the value of the partial vehicle subtracted twice, resulting in a lower indivisible expenditure figure. It is also apparent from the tables that indivisible consumption is actually negative at low income levels. One possible reason for these results is that gross income as reported does not include such sources as public assistance, unreported cash earnings, borrowing, and gifts. The differences between male and female consumption are not great because the only item separating the expenditures of the two sexes is the expenditure on apparel. Children s consumption presents a figure which is the total for all children in the household. Therefore, in households with four members, a single child s consumption would be represented by taking one-half of the expenditures reported in the table. In households with five or more people, each child s consumption can be determined by dividing children s consumption by the number of children. Similar to the results found in the Nelson-Patton studies when savings are excluded as a consumption item, household members consumption falls as a percentage of income as income level increases. This relationship does not always hold when savings are included as a form of delayed consumption. Comparing the two highest income levels in Tables 2 and 3, in most cases the expenditures as a percentage of income actually increase as income increases. Comparing Tables 1 through 3, it can be noted that at the highest income levels (usually $40,000 or more), a household member s expenditures as a percentage of income increase as savings are introduced as an expenditure. Only the highest income levels are affected because savings is a positive number only for these levels of income. Regressions in log form were run on the data in Tables 1 through 3 and are presented in Table 4. 2 X represents the natural logarithm of income and Y represents the natural logarithm of consumption. Not only do these regression equations confirm that there is a strong negative relationship between income and consumption percentages, but also that these equations can be used by the forensic economist to determine a more specific percentage of income used for consumption by each family member. For example, the no savings equation for adult males in a three person household with an income level of $32,000 would indicate average consumption of 28.16%. 2Regression results are available upon request from the authors.


5 Ajwa, Martin & Vavoulis 5


6 6 JOURNAL OF FORENSIC ECONOMICS


7 Ajwa, Martin & Vavoulis 7
8 8 JOURNAL OF FORENSIC ECONOMICS Table 4 Log Regressions of Household Income on Family Member Consumption Percentage Family Member Household Size Equation R Squared No Savings With Savings With Savings and Social Security Adult Male Adult Female Children Adult Male Adult Female Children Adult Male Adult Female Children Note: t-statistics in parentheses 2 Y = X (16.7) (-11.0) 3 Y = X (21.7) (-14.0) 4 Y = X (13.8) (-9.0) 5 or more Y = X (11.0) (-7.0) 2 Y = X (16.3) (-10.7) 3 Y = X (19.9) (-12.9) 4 Y = X (12.9) (-8.4) 5 or more Y = X (11.1) (-7.0) 3 Y = X (12.6) (-8.4) 4 Y = X (13.0) (-8.0) 5 or more Y = X (12.8) (-7.8) 2 Y = X (11.6) (-7.4) 3 Y = X (13.7) (-8.5) 4 Y = X (9.9) (-6.1) 5 or more Y = X (9.2) (-5.6) 2 Y = X (11.6) (-7.3) 3 Y = X (13.2) (-8.3) 4 Y = X (9.5) (-5.8) 5 or more Y = X (9.2) (-5.6) 3 Y = X (8.5) (-5.3) 4 Y = X (7.7) (-4.2) 5 or more Y = X (8.0) (-4.5) 2 Y = X (10.0) (-6.1) 3 Y = X (11.3) (-6.7) 4 Y = X (7.5) (-4.2) 5 or more Y = X (7.1) (-3.8) 2 Y = X (9.9) (-6.1) 3 Y = X (11.1) (-6.5) 4 Y = X (7.2) (-4.0) 5 or more Y = X (7.1) (-3.8) 3 Y = X (8.5) (-5.3) 4 Y = X (7.7) (-4.2) 5 or more Y = X (8.0) (-4.5)
9 Ajwa, Martin & Vavoulis 9 Table 5 Comparison of Studies: Two Adults, One Child Study Author(s) Indivisible Husband Wife Child Harju & Adams 31.4% 27.7% 27.7% 14.2% Gilbert 45.6% 22.6% 22.6% 9.2% Patton & Nelson 37.8% 25.7% 25.7% 10.8% Ruggles 54.4% 14.7% 14.7% 16.2% Dulaney 26.0% 32.0% 32.0% 20.0% King & Smith 53.2% 21.7% 21.7% 3.4% Olson 30.0% 24.8% 24.8% 20.4% Cheit 40.0% 26.0% 26.0% 8.0% BLS Revised Equivalency Scales 19.6% 31.8% 31.8% 16.8% Martin & Vavoulis 38.0% 23.9% 23.9% 14.2% This Study: Table % 27.1% 27.6% 13.5% We have examined several other studies in an attempt to compare their overall results with those of this study. Overall results refers to the consumption percentages for the "total reporting" with no consideration given to the various levels of income. In Table 5, the comparison study values for a family consisting of two adult parents and one child are presented along with numbers from Table 3 of this study which includes savings and social security/pension contributions as consumption items. In the studies examined, there was not a uniform standard for presenting the results; therefore we found it necessary to make interpolations of the data to provide consistency in the comparison with this study. Any errors in the interpolation of the data are not the fault of the authors of the prior studies. We have chosen the studies by Ruggles, 1990; Olson, 1983; King and Smith, 1988; Gilbert, 1991; Patton and Nelson, 1991; Harju and Adams, 1990; and Dulaney, In addition, an average of sixteen studies, including those listed above, examined by Martin and Vavoulis, 1999, has also been included. The findings for the consumption by the husband and the wife are seen to fall within a narrower range than do the finding for indivisible consumption and the consumption by the child. The findings in this study fall within the range of results from the comparison studies. IV. Conclusion It is hoped that these tables will provide economists with a greater ability to determine a decedent s consumption patterns over a long period of time. Economic theory posits that a person s income and consumption patterns vary over a lifetime. In general, young people with little income and few household members tend to consume a greater portion of their incomes. As income rises and family members increase, parents tend to forego personal consumption items to benefit their children and attempt to save for retirement. As children leave the home, parents can consume and save more of their income. Finally, as parents retire and income drops, they begin to consume out of the previous savings. While there are data limitations that prevent a more comprehensive set of tables with consumption estimates according to a household s life-cycle in
10 10 JOURNAL OF FORENSIC ECONOMICS addition to household size and income level, we hope that these tables provide an important first step by considering the consumption of various forms of savings. By deducting expected consumption from savings when it is produced, economists may be more closely measuring a decedent s consumption pattern. Future studies may wish to consider measuring and including a household s "dissavings" which represents a constraint on future consumption. References Cheit, Earl, "Measuring Economic Loss Due to Death and Disability," In Injury and Recovery in the Course of Employment, 1961, Wiley & Sons. Department of Labor, Revised Equivalency Scales, Handbook of Labor Statistics, Bulletin 1865, Dulaney, Ronald A., "Estimating Decedents Consumption Expenditures in Wrongful Death Actions: Some Refinements," Journal of Legal Economics, 1991, 1(2), Gilbert, Roy F., "Estimating Personal Consumption of a Deceased Family Member," Journal of Forensic Economics, 1991, 4(2), Harju, Melvin W., and Clarence H. Adams, "Estimating Personal Expenditure Deductions in Multi-Income Families in Cases of Wrongful Death," Journal of Forensic Economics, 1990, 4(1), King, Elizabeth M., and James P. Smith, Computing Economic Loss in Cases of Wrongful Death, Santa Monica, CA: The RAND Corporation, Lierman, Walter K., Robert T. Patton, and David M. Nelson, "Patton-Nelson Personal Consumption Tables Updated," Journal of Forensic Economics, 1998, 11(1), 3-7. Martin, Gerald D. and Ted Vavoulis, Determining Economic Damages, Santa Ana, CA: James Publishing Group, Nelson, David M. and Robert T. Patton, "Estimating Personal Consumption in Wrongful Death and Survival Actions," Washington State Bar News, 1984, 38(6), Olson, Lawrence, Costs of Children, Lexington: Lexington Books, Patton, Robert T. and David M. Nelson, "Estimating Personal Consumption Costs in Wrongful Death Cases," Journal of Forensic Economics, 1991, 4(2), Ruggles, Patricia, Drawing the Line, Washington, DC: The Urban Institute Press, 1990.
Table 1 Annual Median Income of Households by Age, Selected Years 1995 to Median Income in 2008 Dollars 1
 Fact Sheet Income, Poverty, and Health Insurance Coverage of Older Americans, 2008 AARP Public Policy Institute Median household income and median family income in the United States declined significantly
Determining Economic Damages (July, 2010) Gerald D. Martin, Ph.D. James Publishing, Inc. Costa Mesa, CA
 Gerald D. Martin, Ph.D. James Publishing, Inc. Costa Mesa, CA") Accepted for publication in Determining Economic Damages (July, 2010) Gerald D. Martin, Ph.D. James Publishing, Inc. Costa Mesa, CA 1272 Supplemental Calculation of Lost Earnings Using the LPE Method Section
Accepted for publication in Determining Economic Damages (July, 2010) Gerald D. Martin, Ph.D. James Publishing, Inc. Costa Mesa, CA 1272 Supplemental Calculation of Lost Earnings Using the LPE Method Section
PRELIMINARY ECONOMIC ANALYSIS OF BABARA JONES
 PRELIMINARY ECONOMIC ANALYSIS OF BABARA JONES Prepared For Fran Smith, Esq. 45 Handy Drive Syracuse, New York 13202 Prepared by Jim Clembox Bridge Street Oswego, New York 13126 April 28, 2008 Preliminary
The Value of a Minor s Lost Social Security Benefits
 The Value of a Minor s Lost Social Security Benefits Matthew Marlin Professor of Economics Duquesne University Pittsburgh, PA 15282 Marlin@duq.edu 412 396 6250 And Antony Davies Associate Professor of
REVIEW OF THE ARIZONA CHILD SUPPORT SCHEDULE June 28, 1999
 REVIEW OF THE ARIZONA CHILD SUPPORT SCHEDULE June 28, 1999 Submitted to: Supreme Court State of Arizona Administrative Office of the Courts 1501 West Washington Phoenix, Arizona Submitted by: Policy Studies
Expenditures on Children by Families Annual Report
 Expenditures on Children by Families 1996 Annual Report UNITED STATES DEPARTMENT OF AGRICULTURE Miscellaneous Publication Number 1528-1996 Abstract Lino, Mark. 1997. Expenditures on Children by Families,
Proportion of income 1 Hispanics may be of any race.
 POLICY PAPER This report addresses how individuals from various racial and ethnic groups fare under the current Social Security system. It examines the relative importance of Social Security for these
Personality Traits and Economic Preparation for Retirement
 Personality Traits and Economic Preparation for Retirement Michael D. Hurd Susann Rohwedder RAND Angela Lee Duckworth University of Pennsylvania and David R. Weir University of Michigan 14 th Annual Joint
A Profile of the Working Poor, 2011
 Cornell University ILR School DigitalCommons@ILR Federal Publications Key Workplace Documents 4-2013 A Profile of the Working Poor, 2011 Bureau of Labor Statistics Follow this and additional works at:
Health Status, Health Insurance, and Health Services Utilization: 2001
 Health Status, Health Insurance, and Health Services Utilization: 2001 Household Economic Studies Issued February 2006 P70-106 This report presents health service utilization rates by economic and demographic
Worklife in a Markov Model with Full-time and Part-time Activity
 Journal of Forensic Economics 19(1), 2006, pp. 61-82 2007 by the National Association of Forensic Economics Worklife in a Markov Model with Full-time and Part-time Activity Kurt V. Krueger. Gary R. Skoog,
NBER WORKING PAPER SERIES THE GROWTH IN SOCIAL SECURITY BENEFITS AMONG THE RETIREMENT AGE POPULATION FROM INCREASES IN THE CAP ON COVERED EARNINGS
 NBER WORKING PAPER SERIES THE GROWTH IN SOCIAL SECURITY BENEFITS AMONG THE RETIREMENT AGE POPULATION FROM INCREASES IN THE CAP ON COVERED EARNINGS Alan L. Gustman Thomas Steinmeier Nahid Tabatabai Working
Changes in Hours Worked Since 1950
 Federal Reserve Bank of Minneapolis Quarterly Review Vol. 22, No. 1, Winter 1998, pp. 2 19 Changes in Hours Worked Since 1950 Ellen R. McGrattan Senior Economist Research Department Federal Reserve Bank
Volume Title: The Economic Consequences of Demographic Change in East Asia, NBER-EASE Volume 19
 This PDF is a selection from a published volume from the National Bureau of Economic Research Volume Title: The Economic Consequences of Demographic Change in East Asia, NBER-EASE Volume 19 Volume Author/Editor:
Social Security: Is a Key Foundation of Economic Security Working for Women?
 Committee on Finance United States Senate Hearing on Social Security: Is a Key Foundation of Economic Security Working for Women? Statement of Janet Barr, MAAA, ASA, EA on behalf of the American Academy
Issue Number 60 August A publication of the TIAA-CREF Institute
 18429AA 3/9/00 7:01 AM Page 1 Research Dialogues Issue Number August 1999 A publication of the TIAA-CREF Institute The Retirement Patterns and Annuitization Decisions of a Cohort of TIAA-CREF Participants
Saving for Retirement: Household Bargaining and Household Net Worth
 Saving for Retirement: Household Bargaining and Household Net Worth Shelly J. Lundberg University of Washington and Jennifer Ward-Batts University of Michigan Prepared for presentation at the Second Annual
Poverty in the United States in 2014: In Brief
 Joseph Dalaker Analyst in Social Policy September 30, 2015 Congressional Research Service 7-5700 www.crs.gov R44211 Contents Introduction... 1 How the Official Poverty Measure is Computed... 1 Historical
Comment on Gary V. Englehardt and Jonathan Gruber Social Security and the Evolution of Elderly Poverty
 Comment on Gary V. Englehardt and Jonathan Gruber Social Security and the Evolution of Elderly Poverty David Card Department of Economics, UC Berkeley June 2004 *Prepared for the Berkeley Symposium on
Ministry of Health, Labour and Welfare Statistics and Information Department
 Special Report on the Longitudinal Survey of Newborns in the 21st Century and the Longitudinal Survey of Adults in the 21st Century: Ten-Year Follow-up, 2001 2011 Ministry of Health, Labour and Welfare
Demographic and Economic Characteristics of Children in Families Receiving Social Security
 Each month, over 3 million children receive benefits from Social Security, accounting for one of every seven Social Security beneficiaries. This article examines the demographic characteristics and economic
manchester capital management
 THE SAM LETTER manchester capital management Welcome TO Manchester Capital s SAM: Stuff About Money! In this issue we re going to talk about Trusts. The goal of SAM is to educate. Since our firm s inception
THE SURVEY OF INCOME AND PROGRAM PARTICIPATION CHILDCARE EFFECTS ON SOCIAL SECURITY BENEFITS (91 ARC) No. 135
 No. 135") THE SURVEY OF INCOME AND PROGRAM PARTICIPATION CHILDCARE EFFECTS ON SOCIAL SECURITY BENEFITS (91 ARC) No. 135 H. M. lams Social Security Administration U. S. Department of Commerce BUREAU OF THE CENSUS
THE SURVEY OF INCOME AND PROGRAM PARTICIPATION CHILDCARE EFFECTS ON SOCIAL SECURITY BENEFITS (91 ARC) No. 135 H. M. lams Social Security Administration U. S. Department of Commerce BUREAU OF THE CENSUS
THE STATISTICS OF INCOME (SOI) DIVISION OF THE
 DIVISION OF THE") 104 TH ANNUAL CONFERENCE ON TAXATION A NEW LOOK AT THE RELATIONSHIP BETWEEN REALIZED INCOME AND WEALTH Barry Johnson, Brian Raub, and Joseph Newcomb, Statistics of Income, Internal Revenue Service THE
104 TH ANNUAL CONFERENCE ON TAXATION A NEW LOOK AT THE RELATIONSHIP BETWEEN REALIZED INCOME AND WEALTH Barry Johnson, Brian Raub, and Joseph Newcomb, Statistics of Income, Internal Revenue Service THE
The Local Government Pension Scheme (England and Wales) Trivial Commutation. Lump sums paid on or after 1 April 2008
 Trivial Commutation. Lump sums paid on or after 1 April 2008") The Local Government Pension Scheme (England and Wales) Trivial Commutation Lump sums paid on or after 1 April 2008 Date: 21 February 2008 Author: Ian Boonin Table of Contents 1 Introduction and Legislative
The Local Government Pension Scheme (England and Wales) Trivial Commutation Lump sums paid on or after 1 April 2008 Date: 21 February 2008 Author: Ian Boonin Table of Contents 1 Introduction and Legislative
Employment Status of the Civilian Noninstitutional Population by Educational Attainment, Age, Sex and Race
 Employment Status of the Civilian Noninstitutional Population by Educational Attainment, Age, Sex and Race David G. Tucek Value Economics, LLC 13024 Vinson Court St. Louis, MO 63043 David.Tucek@valueeconomics.com
Women in the Labor Force: A Databook
 Cornell University ILR School DigitalCommons@ILR Federal Publications Key Workplace Documents 12-2011 Women in the Labor Force: A Databook Bureau of Labor Statistics Follow this and additional works at:
Using Data for Couples to Project the Distributional Effects of Changes in Social Security Policy
 This article addresses the importance of using data for couples rather than individuals to estimate Social Security benefits. We show how individual data can underestimate actual Social Security benefits,
SOA 2009 Risks and Process of Retirement Survey
 SOA 2009 Risks and Process of Retirement Survey The Impact of Retirement Risks on Women WISER Symposium December 2, 2010 Cindy Levering, SOA Committee on Post-Retirement Needs and Risks Agenda Introduction,
The Economic Consequences of a Husband s Death: Evidence from the HRS and AHEAD
 The Economic Consequences of a Husband s Death: Evidence from the HRS and AHEAD David Weir Robert Willis Purvi Sevak University of Michigan Prepared for presentation at the Second Annual Joint Conference
How Much Should Americans Be Saving for Retirement?
 How Much Should Americans Be Saving for Retirement? by B. Douglas Bernheim Stanford University The National Bureau of Economic Research Lorenzo Forni The Bank of Italy Jagadeesh Gokhale The Federal Reserve
Program on Retirement Policy Number 1, February 2011
 URBAN INSTITUTE Retirement Security Data Brief Program on Retirement Policy Number 1, February 2011 Poverty among Older Americans, 2009 Philip Issa and Sheila R. Zedlewski About one in three Americans
SEX DISCRIMINATION PROBLEM
 SEX DISCRIMINATION PROBLEM 5. Displaying Relationships between Variables In this section we will use scatterplots to examine the relationship between the dependent variable (starting salary) and each of
Implications of the Tax Reform Act of 1976 for Farm Estate Planning
 Implications of the Tax Reform Act of 1976 for Farm Estate Planning Clint E. Roush, Harry P. Mapp and Cecil D. Maynard An intergeneration transfer simulation model is used to project estate transfer costs
Labor Participation and Gender Inequality in Indonesia. Preliminary Draft DO NOT QUOTE
 Labor Participation and Gender Inequality in Indonesia Preliminary Draft DO NOT QUOTE I. Introduction Income disparities between males and females have been identified as one major issue in the process
Consumer Expenditures in 2001
 Cornell University ILR School DigitalCommons@ILR Federal Publications Key Workplace Documents 4-2003 Consumer Expenditures in 2001 Bureau of Labor Statistics Follow this and additional works at: http://digitalcommons.ilr.cornell.edu/key_workplace
Tax Incidence Analysis First & Second Omnibus Tax Bills
 Tax Incidence Analysis Prepared by the Tax Research Division, Minnesota Department of Revenue June 18, 2014 2014 First & Second Omnibus Tax Bills Chapter 150 (H.F. 1777 as enacted on March 21, 2014) and
A Profile of the Working Poor, 2000
 Cornell University ILR School DigitalCommons@ILR Federal Publications Key Workplace Documents 3-2002 A Profile of the Working Poor, 2000 Stephanie Boraas Bureau of Labor Statistics Follow this and additional
The Minimum Wage Ain t What It Used to Be
 http://economix.blogs.nytimes.com/2013/12/09/the-minimum-wage-aint-what-it-used-to-be DECEMBER 9, 2013, 11:00 AM The Minimum Wage Ain t What It Used to Be By DAVID NEUMARK David Neumarkis professor of
WATER SCIENCE AND TECHNOLOGY BOARD
 Committee on the Long Run Macroeconomic Effects of the Aging U.S. Population Phase II WATER SCIENCE AND TECHNOLOGY BOARD Committee Membership Co-Chairs Ronald Lee Peter Orszag Other members Alan Auerbach
Determining the Value of Household Production as a Component of Economic Damages 1
 Determining the Value of Household Production as a Component of Economic Damages 1 By Stanley P. Stephenson 2 The forensic financial expert may be familiar with assessing lost profits, earnings capacity,
In 2012, according to the U.S. Census Bureau, about. A Profile of the Working Poor, Highlights CONTENTS U.S. BUREAU OF LABOR STATISTICS
 U.S. BUREAU OF LABOR STATISTICS M A R C H 2 0 1 4 R E P O R T 1 0 4 7 A Profile of the Working Poor, 2012 Highlights Following are additional highlights from the 2012 data: Full-time workers were considerably
Green Giving and Demand for Environmental Quality: Evidence from the Giving and Volunteering Surveys. Debra K. Israel* Indiana State University
 Green Giving and Demand for Environmental Quality: Evidence from the Giving and Volunteering Surveys Debra K. Israel* Indiana State University Working Paper * The author would like to thank Indiana State
Older Workers: Employment and Retirement Trends
 Cornell University ILR School DigitalCommons@ILR Federal Publications Key Workplace Documents September 2005 Older Workers: Employment and Retirement Trends Patrick Purcell Congressional Research Service
Published in The Earnings Analyst. Volume I, pp , 1998.
 Published in The Earnings Analyst. Volume I, pp. 81-89, 1998. Work-Life Expectancy for the Self-Employed Lawrence M. Spizman Professor of Economics Economics Department State University of New York at
Bargaining with Grandma: The Impact of the South African Pension on Household Decision Making
 ONLINE APPENDIX for Bargaining with Grandma: The Impact of the South African Pension on Household Decision Making By: Kate Ambler, IFPRI Appendix A: Comparison of NIDS Waves 1, 2, and 3 NIDS is a panel
OLD-AGE POVERTY: SINGLE WOMEN & WIDOWS & A LACK OF RETIREMENT SECURITY
 AUG 18 1 OLD-AGE POVERTY: SINGLE WOMEN & WIDOWS & A LACK OF RETIREMENT SECURITY by Teresa Ghilarducci, Bernard L. and Irene Schwartz Professor of Economics at The New School for Social Research and Director
Consumer Expenditures in 2000
 Cornell University ILR School DigitalCommons@ILR Federal Publications Key Workplace Documents 4-2002 Consumer Expenditures in 2000 Bureau of Labor Statistics Follow this and additional works at: http://digitalcommons.ilr.cornell.edu/key_workplace
Women in the Labor Force: A Databook
 Cornell University ILR School DigitalCommons@ILR Federal Publications Key Workplace Documents 12-2010 Women in the Labor Force: A Databook Bureau of Labor Statistics Follow this and additional works at:
Women in the Labor Force: A Databook
 Cornell University ILR School DigitalCommons@ILR Federal Publications Key Workplace Documents 2-2013 Women in the Labor Force: A Databook Bureau of Labor Statistics Follow this and additional works at:
New Jersey Public-Private Sector Wage Differentials: 1970 to William M. Rodgers III. Heldrich Center for Workforce Development
 New Jersey Public-Private Sector Wage Differentials: 1970 to 2004 1 William M. Rodgers III Heldrich Center for Workforce Development Bloustein School of Planning and Public Policy November 2006 EXECUTIVE
Cigarette smoking is the largest single health risk in the United States, accounting
 Smoking: Taxing Health and Social Security BRIAN S. ARMOUR AND M. MELINDA PITTS Armour is a health scientist at the Centers for Disease Control and Prevention (CDC) in Atlanta. Pitts is a research economist
ICI RESEARCH PERSPECTIVE
 ICI RESEARCH PERSPECTIVE 1401 H STREET, NW, SUITE 1200 WASHINGTON, DC 20005 202-326-5800 WWW.ICI.ORG JULY 2017 VOL. 23, NO. 5 WHAT S INSIDE 2 Introduction 4 Which Workers Would Be Expected to Participate
Expert Report of Robert Glenn, Ph.D. Professor of Economics University of Nita
 Expert Report of Robert Glenn, Ph.D. Professor of Economics University of Nita State of Nita Circuit Court Circuit Court of Darrow County Civil Division Jeffrey T. Potter, the Administrator of the Estate
Nordic Journal of Political Economy
 Nordic Journal of Political Economy Volume 39 204 Article 3 The welfare effects of the Finnish survivors pension scheme Niku Määttänen * * Niku Määttänen, The Research Institute of the Finnish Economy
A Profile of the Working Poor, 2009
 Cornell University ILR School DigitalCommons@ILR Federal Publications Key Workplace Documents 3-2011 A Profile of the Working Poor, 2009 Bureau of Labor Statistics Follow this and additional works at:
Do Estate and Inheritance Taxes Affect Entrepreneurship? March 7, 2018 Leonard E. Burman Robert McClelland Chenxi Lu
 Do Estate and Inheritance Taxes Affect Entrepreneurship? March 7, 2018 Leonard E. Burman Robert McClelland Chenxi Lu Overview We examine how changes to wealth transfer taxation affect the likelihood of
Statistical information can empower the jury in a wrongful termination case
 Determining economic damages from wrongful termination Statistical information can empower the jury in a wrongful termination case BY JOSEPH T. CROUSE The economic damages resulting from wrongful termination
The Distribution of Federal Taxes, Jeffrey Rohaly
 www.taxpolicycenter.org The Distribution of Federal Taxes, 2008 11 Jeffrey Rohaly Overall, the federal tax system is highly progressive. On average, households with higher incomes pay taxes that are a
Older Workers: Employment and Retirement Trends
 Cornell University ILR School DigitalCommons@ILR Federal Publications Key Workplace Documents 9-15-2008 Older Workers: Employment and Retirement Trends Patrick Purcell Congressional Research Service; Domestic
JOURNAL OF FORENSIC ECONOMICS
 JOURNAL OF FORENSIC ECONOMICS Personal Consumption Rates for Canada: Update of 2000 PCRs Using 2007-08 Surveys of Household Spending Data Cara L. Brown * Journal of Forensic Economics 23(2), 2012, pp.
Women have made the difference for family economic security
 Washington Center for Equitable Growth Women have made the difference for family economic security Today s women are working more and earning more, and significantly underpinning U.S. family incomes April
Planning the Disposition of Property Not Included in the Marital Deduction
 The Ohio State University Knowledge Bank kb.osu.edu Ohio State Law Journal (Moritz College of Law) Ohio State Law Journal: Volume 20, Issue 1 (1959) 1959 Planning the Disposition of Property Not Included
HOW DOES WOMEN WORKING AFFECT SOCIAL SECURITY REPLACEMENT RATES?
 June 2013, Number 13-10 RETIREMENT RESEARCH HOW DOES WOMEN WORKING AFFECT SOCIAL SECURITY REPLACEMENT RATES? By April Yanyuan Wu, Nadia S. Karamcheva, Alicia H. Munnell, and Patrick Purcell* Introduction
41% of Palauan women are engaged in paid employment
 Palau 2013/2014 HIES Gender profile Executive Summary 34% 18% 56% of Palauan households have a female household head is the average regular cash pay gap for Palauan women in professional jobs of internet
Testimony before the Equal Employment Opportunity Commission. Heather Boushey, Senior Economist, Center for American Progress Action Fund
 Testimony before the Equal Employment Opportunity Commission Heather Boushey, Senior Economist, Center for American Progress Action Fund April 22, 2009 Thank you Acting Chairman Ishimaru for inviting me
The Relationship Between Income and Health Insurance, p. 2 Retirement Annuity and Employment-Based Pension Income, p. 7
 E B R I Notes E M P L O Y E E B E N E F I T R E S E A R C H I N S T I T U T E February 2005, Vol. 26, No. 2 The Relationship Between Income and Health Insurance, p. 2 Retirement Annuity and Employment-Based
ARE PUBLIC SECTOR WORKERS MORE RISK AVERSE THAN PRIVATE SECTOR WORKERS? DON BELLANTE and ALBERT N. LINK*
 ARE PUBLIC SECTOR WORKERS MORE RISK AVERSE THAN PRIVATE SECTOR WORKERS? DON BELLANTE and ALBERT N. LINK* Available evidence suggests that stability of employment is greater in the public sector than in
Labor Economics Field Exam Spring 2014
 Labor Economics Field Exam Spring 2014 Instructions You have 4 hours to complete this exam. This is a closed book examination. No written materials are allowed. You can use a calculator. THE EXAM IS COMPOSED
THE IMPACT OF RAISING CHILDREN ON RETIREMENT SECURITY
 September 2017, Number 17-16 RETIREMENT RESEARCH THE IMPACT OF RAISING CHILDREN ON RETIREMENT SECURITY By Alicia H. Munnell, Wenliang Hou, and Geoffrey T. Sanzenbacher* Introduction Children are expensive;
Bequests and Retirement Wealth in the United States
 Bequests and Retirement Wealth in the United States Lutz Hendricks Arizona State University Department of Economics Preliminary, December 2, 2001 Abstract This paper documents a set of robust observations
The Role of Fertility in Business Cycle Volatility
 The Role of Fertility in Business Cycle Volatility Sarada Duke University Oana Tocoian Claremont McKenna College Oct 2013 - Preliminary, do not cite Abstract We investigate the two-directional relationship
The Cost of Living in Iowa 2018 Edition
 The Cost of Living in Iowa 2018 Edition Part 2: Many Iowa Households Struggle to Meet Basic Needs Peter S. Fisher and Natalie Veldhouse July 2018 The Iowa Policy Project 20 E. Market Street, Iowa City,
Women in the Labor Force: A Databook
 Cornell University ILR School DigitalCommons@ILR Federal Publications Key Workplace Documents 9-2007 Women in the Labor Force: A Databook Bureau of Labor Statistics Follow this and additional works at:
Lehigh Valley Planning Commission
 Lehigh Valley Planning Commission 961 Marcon Boulevard, Suite 310 Allentown, Pennsylvania 18109 Telephone: 610-264-4544 or 1-888-627-8808 E-mail: lvpc@lvpc.org POPULATION PROJECTIONS FOR LEHIGH AND COUNTIES:
Guidance on assumptions to use when undertaking a valuation in accordance with Section 179 of the Pensions Act 2004
 Contents Part 1 Part 2 Effective date of guidance Overview 2.1 Introduction 2.2 Purpose of this guidance 2.3 Legislative requirements 2.4 Legislation or authority for actuarial valuations Part 3 Financial
THE INFLUENCE OF GENDER AND RACE ON THE SOCIAL SECURITY EARLY RETIREMENT DECISION FOR SINGLE INDIVIDUALS
 Page 87 THE INFLUENCE OF GENDER AND RACE ON THE SOCIAL SECURITY EARLY RETIREMENT DECISION FOR SINGLE INDIVIDUALS Diane Scott Docking, Northern Illinois University Richard Fortin, New Mexico State University
WORKING P A P E R. Intervivos Giving Over the Lifecycle MICHAEL HURD, JAMES P. SMITH AND JULIE ZISSIMOPOULOS WR
 WORKING P A P E R Intervivos Giving Over the Lifecycle MICHAEL HURD, JAMES P. SMITH AND JULIE ZISSIMOPOULOS WR-524-1 October 2011 This paper series made possible by the NIA funded RAND Center for the Study
Report on Women and Pensions Helpline 18 October to 10 December 2004
 Report on Women and Pensions Helpline 18 October to 10 December 2004 Contents 2 Executive Summary 3 Introduction 4 Our Callers 5 State Pension Enquiries 6 Shortfall in National Insurance Contributions
The Lifetime Incidence Of Consumption Sales Taxes
 Economic Staff Paper Series Economics 12-1977 The Lifetime Incidence Of Consumption Sales Taxes Roy D. Adams Iowa State University David J. Walker Iowa State University Follow this and additional works
Gender Issues and Social Security Reform: Assessing the Role of Social Security and Personal Savings in Well-Being During Retirement
 Robert M. La Follette School of Public Affairs at the University of Wisconsin-Madison Working Paper Series La Follette School Working Paper No. 2006-002 http://www.lafollette.wisc.edu/publications/workingpapers
Early Estimates Indicate Rapid Increase in Health Insurance Coverage under the ACA: A Promising Start
 Early Estimates Indicate Rapid Increase in Health Insurance Coverage under the ACA: A Promising Start Sharon K. Long, Genevieve M. Kenney, Stephen Zuckerman, Douglas Wissoker, Dana Goin, Katherine Hempstead,
How Is the Economic Turmoil Affecting Older Americans?
 Urban Institute Fact Sheet on Retirement Policy How Is the Economic Turmoil Affecting Older Americans? Richard W. Johnson, Mauricio Soto, and Sheila R. Zedlewski October 2008 The slumping stock market,
A Profile of the Working Poor, 2001
 Cornell University ILR School DigitalCommons@ILR Federal Publications Key Workplace Documents 6-2003 A Profile of the Working Poor, 2001 Abraham Mosisa Bureau of Labor Statistics Follow this and additional
between Income and Life Expectancy
 National Insurance Institute of Israel The Association between Income and Life Expectancy The Israeli Case Abstract Team leaders Prof. Eytan Sheshinski Prof. Daniel Gottlieb Senior Fellow, Israel Democracy
Social Security and Medicare: A Survey of Benefits
 Social Security and Medicare: A Survey of Benefits #5485L COURSE MATERIAL TABLE OF CONTENTS Chapter 1: Introduction and Overview 1 I. Social Security: The Numbers Game 1 II. Social Security: A Snapshot
HOW WELL DOES THE CPI SERVE AS AN INDEX OF INFLATION FOR OLDER AGE GROUPS? Frank T. Denton Byron G. Spencer. IESOP Research Paper No. 16.
 HOW WELL DOES THE CPI SERVE AS AN INDEX OF INFLATION FOR OLDER AGE GROUPS? Frank T. Denton Byron G. Spencer IESOP Research Paper No. 16 June 1997 The Program for Research on the Independence and Economic
Pennsylvania Municipal Retirement System
 Pennsylvania Municipal Retirement System Experience Study Results and Recommendations For the period covering January 1, 2009 December 31, 2013 Produced by Cheiron July 2015 Table of Contents Section Page
Poverty in the United Way Service Area
 Poverty in the United Way Service Area Year 4 Update - 2014 The Institute for Urban Policy Research At The University of Texas at Dallas Poverty in the United Way Service Area Year 4 Update - 2014 Introduction
Healthy life expectancy: key points (new data this update)
") NOTE: This is an Archive Report of the Healthy Life Expectancy web pages on the ScotPHO website, as at 16 December 2014 Links within this report have been disabled to avoid users accessing out-of-date
NOTE: This is an Archive Report of the Healthy Life Expectancy web pages on the ScotPHO website, as at 16 December 2014 Links within this report have been disabled to avoid users accessing out-of-date
WILL WORKSHEET. 1. Husband s Name: Social Sec. No. Birthplace: Birth Date: 2. Wife s Name: Social Sec. No. Birthplace: Birth Date:
 WILL WORKSHEET I. PERSONAL AND FAMILY INFORMATION (Give full names including middle initial) Your Family: 1. Husband s Name: Social Sec. No. Birthplace: Birth Date: 2. Wife s Name: Social Sec. No. Birthplace:
Section 11 Probate Glossary
 Section 11 Probate Glossary 2012 Investors Empowerment Academy, LLC 119 Abatement A proportional diminution or reduction of the pecuniary legacies, when there are not sufficient funds to pay them in full.
Widening socioeconomic differences in mortality and the progressivity of public pensions and other programs
 Widening socioeconomic differences in mortality and the progressivity of public pensions and other programs Ronald Lee University of California at Berkeley Longevity 11 Conference, Lyon September 8, 2015
Average Earnings and Long-Term Mortality: Evidence from Administrative Data
 American Economic Review: Papers & Proceedings 2009, 99:2, 133 138 http://www.aeaweb.org/articles.php?doi=10.1257/aer.99.2.133 Average Earnings and Long-Term Mortality: Evidence from Administrative Data
Population Changes and the Economy
 Population Changes and the Economy Predicting the effect of the retirement of the baby boom generation on the economy is not a straightforward matter. J ANICE F. MADDEN SOME ECONOMIC forecasters have suggested
March Campaign ROI
 March 2015 Campaign ROI Convergent Team, Attached is your Campaign ROI Report. This report should not only help in raising the sights of the campaign in general, but can also be used to make specific solicitations
Imputation of Non-Response on Economic Variables in the Mexican Health and Aging Study (MHAS/ENASEM) 2001.
 2001.") Imputation of Non-Response on Economic Variables in the Mexican Health and Aging Study (MHAS/ENASEM) 2001. Project Report Draft: June 30, 2004 by Rebeca Wong Maryland Population Research Center University
Imputation of Non-Response on Economic Variables in the Mexican Health and Aging Study (MHAS/ENASEM) 2001. Project Report Draft: June 30, 2004 by Rebeca Wong Maryland Population Research Center University
Errors in Survey Reporting and Imputation and their Effects on Estimates of Food Stamp Program Participation
 Errors in Survey Reporting and Imputation and their Effects on Estimates of Food Stamp Program Participation ITSEW June 3, 2013 Bruce D. Meyer, University of Chicago and NBER Robert Goerge, Chapin Hall
Free Benefit. How it works. Children s Life Cover. What it does
 Free Benefit Children s Life Cover What it does Offered for free by Zurich to all lives insured of Preferred Choice as an added benefit, this cover will pay a single lump sum amount in the event of the
2013 Living Wage Study Notes
 2013 Living Wage Study Notes These notes reflect the sources from which the data used in the 2013 Living Wage Study was selected. Whenever possible, the most up-to-date publications with the most local