A Comparison of Wage Levels and Wage Inequality in the Public and Private Sectors, 1995 and 2000
|
|
|
- Randolph Simpson
- 6 years ago
- Views:
Transcription
1 A Comparison of Wage Levels and Wage Inequality in the Public and Private Sectors, 1995 and 2000 Ingrid Woolard 1 Senior Research Specialist Human Sciences Research Council and Senior Lecturer Department of Economics University of Port Elizabeth ecaidw@upe.ac.za Development Policy Research Unit February 2002 Working Paper 02/62 ISBN Senior Research Specialist, Human Sciences Research Council. The views expressed are those of the author and do not necessarily reflect those of the HSRC.
2 Abstract This paper sets out to investigate relative wages and wage dispersion for formal sector workers in the private and public sectors. The paper explicitly measures the size of the public sector wage premium and offers some reasons for its existence. It also attempts to document the changing pattern of wage differentials between public and private sector employees between 1995 and Three sources of differences in the public and private sector wage distributions are considered. These are: differences in the distributions of worker characteristics in the two sectors; differences in the returns to various worker characteristics in the two sectors; and differences in the distributions of unexplained wage residuals across sectors (Juhn, Murphy and Pierce, 1993). Acknowledgements This paper is the seventh in a series of research outputs related to a two-year project entitled Understanding Labour Demand Trends and Patterns in South Africa, housed within the Development Policy Research Unit. This research paper is funded by USAID and administered by the Joint Centre for Political and Economic Studies Inc. under Subcontract No. JCNAT from Nathan Associates Inc. Their generous financial assistance in this regard is acknowledged. I would like to thank Haroon Bhorat for extremely useful discussions during the writing of this paper. All errors and omissions are mine alone. The views expressed herein are those of the authors and not necessarily those of the DPRU or USAID. Development Policy Research Unit Tel: Fax: Information about our Working Papers and other published titles are available on our website at:
3 Table of Contents 1. INTRODUCTION THE LFS DATA PROFILE OF THE PUBLIC SECTOR WAGE DIFFERENCES IN PUBLIC VERSUS PRIVATE SECTOR EMPLOYMENT IN SOUTH AFRICA MULTIVARIATE COMPARISONS OF EARNINGS IN THE PUBLIC AND PRIVATE SECTORS THE EFFECTS OF GENDER, RACE, EDUCATION, OCCUPATION AND LOCATION PUBLIC SECTOR WAGE PREMIUM COMPARISON OF FINDINGS FOR 1995 AND WAGE DISPERSION CONCLUSION...18 REFERENCES...19 APPENDIX...1
4 Private Sectors, 1995 and Introduction The public service is the largest single employer in South Africa, employing almost 1,1 million people in With one in six formal sector workers employed by the State, this in itself makes this sector so large as to merit attention. Moreover, while the public service has much in common with other formal employers, it differs in its size, its skills profile and the state s special role in society. The government is required by the Constitution to lead by example and thus public sector employment should be scrutinised in terms of equity and efficiency objectives. Since the transition to democratic rule, there have been substantial changes in public sector employment. The number of people employed by national and provincial government has declined 2, pay scales have been simplified and the State has made great strides in improving representations. At the same time, the number of managers has been increasing (Thompson and Woolard, 2002) and wage increases at all levels have out-performed inflation, resulting in better pay for most government employees. This paper sets out to investigate relative wages and wage dispersion for formal sector workers in the private and public sectors. The paper explicitly measures the size of the public sector wage premium and offers some reasons for its existence. It also attempts to document the changing pattern of wage differentials between public and private sector employees between 1995 and There are three sources of differences in the public and private sector wage distributions, namely differences in the distributions of worker characteristics in the two sectors; differences in the returns to various worker characteristics in the two sectors; and differences in the distributions of unexplained wage residuals across sectors (Juhn, Murphy and Pierce, 1993). Each of these elements is considered. In the first part of the study, regression analysis is used to compare public and private sector wages so as to control factors such as age, education levels, location, race, and occupation. Both least squares and quantile regression estimates of the public sector premium are presented. In the second part of the paper, very simple inequality measures are employed to investigate whether the public sector exhibits less or more wage inequality than the private sector. Throughout the paper, only full-time formal-sector employees are considered. The primary source of data is the raw data from the February 2000 Labour Force Survey (LFS) conducted by Statistics South Africa. This is a particularly useful survey for the purposes of this paper because it explicitly distinguishes between public and private employment. However, a comparison over time was also required. For this reason the 1995 October Household Survey (OHS) was also analysed. The 1995 OHS provides detailed information about occupation and economic sector, but does not specify whether the worker s employer is the State or a private sector firm. Consequently, a public/private proxy was created, based on occupation, economic sector and (in a few difficult cases) working conditions. 3 This is an imperfect variable and inferior to the clean 2 In 1995 there were public sector employees. By 2001 this number had shrunk to (Public Service payroll information (PERSAL)). 1 3 My thanks to Keith Thompson (Department of Economics, University of Port Elizabeth) for doing this.
5 DPRU Working Paper 02/62 Ingrid Woolard split that is available for the 2000 LFS, but nevertheless the best available for the purposes of a comparison across time. The 2000 LFS and 1995 OHS data are also not directly comparable because the 1995 survey asked about net wages, while the 2000 survey asked about gross wages. Consequently, the wage cannot be compared. Neither can the degree of wage dispersion be directly compared, since net wages will always be less dispersed than gross wages (as a result of the progressive nature of the personal income tax system). The purpose of the comparison is simply to see whether there has been a shift in the differences between public and private sector wages and their dispersion. 2. The LFS Data The LFS is a newly introduced, twice-yearly rotating panel household survey, specifically designed to measure the dynamics of employment and unemployment in the country. The pilot round of LFS fieldwork took place in February 2000, based on a probability sample of dwelling units. This round was considered to be a pilot, because it represented the start of the rotating panel survey in South Africa and it had a relatively small sample size (Statistics South Africa, 2001: 2). Both the sampling methodology and the questionnaire design have changed, when compared with the previous measurements of labour market issues in the October household surveys (OHS). For the purpose at hand, the great merit of the LFS lies in the detailed information provided about the type of employer, which makes it possible to distinguish public sector employees. (In fact, it is possible to dissect this further into levels of government, but this is not done here.) The LFS questionnaire asked respondents to state their total salary, including overtime and bonuses, and before the deduction of tax. Questions about income are always problematic, with the biggest problem being under-reporting. While under-reporting is sometimes deliberate, it is often simply the case that respondents do not have a clear understanding of the meaning of terms such as gross or do not know what their total package is. Table 1 shows the distribution of wages reported by those who said they were employed by central or provincial government and compares this to the distribution derived from the payroll (PERSAL) data provided by the Department of Public Service Administration. (For the purposes of this comparison, those employed by local government are excluded since they are not paid via PERSAL). The annual PERSAL salaries were divided by 13 (not 12), since public servants receive a 13 th cheque which respondents were likely to ignore. 2
6 A Comparison of Wage Levels and Wage Inequality in the Public and Private Sectors, 1995 and 2000 Table 2.1 Monthly Wages, by Percentile for Provincial and Central Government Employees Percentile LFS February 2000 PERSAL 10 th R800 R th R1600 R th (median) R3000 R th R4500 R th R5300 R6800 This is a clear indication of consistent under-reporting. In particular, the lowest salary notch for a full-time (permanently appointed) public servant in 2000 was R24036 p.a., which equates to R1849 p.m., yet 29% of government employees in the LFS reported earning less than this! This strongly suggests that many respondents were reporting their take-home pay (after deductions such as tax, pension and even medical-aid) instead of gross earnings. There is no way of correcting for this under-reporting. There is, however, no reason to believe that the level or pattern of under-reporting was different among public as opposed to private sector employees. Consequently, while recognising the deficiencies of the data, this paper makes the assumption that a comparison between public and private sector employees remains valid, even if the wage-levels are biased. 3
7 DPRU Working Paper 02/62 Ingrid Woolard 3. Profile of the public sector Table 3.1 shows the breakdown of major occupational groups in the public sector. Table 3.1 Employment and Average Salary in Major Occupational Groups in the Public Sector, 1999 Occupation Number % of public sector Average salary (Rand p.a.) Educator % R Police, Correctional Services, Defence % R Administration % R Elementary occupations % R Nurses % R Skilled production workers % R Nursing assistants % R Professionals & high-level professionals (other than health and legal professionals) % R Medical doctors % R Health professionals other than doctors and nurses % R Legal personnel <1% R Senior management <1% R Total public service R Source: Adapted from Seidman-Makgetla, 2000:20 There are 30 departments at national level and more than 200 in the provinces. Some 80% of public servants work for SAPS, the SANDF, Correctional Services or the provincial health and education departments (Seidman-Makgetla, 2000:19). The average provincial education department has employees and the average health department SAPS and the SANDF have around employees each. At the other end of the spectrum, administrative and economic services departments are much smaller, with most having less than 500 employees. Table 3.2 shows the change in average remuneration per worker in the private and public sectors for the period Real wages have been increasing in both sectors, although not as rapidly in the public service as in the private sector. Table 3.2 shows that there was a 4
8 A Comparison of Wage Levels and Wage Inequality in the Public and Private Sectors, 1995 and 2000 substantial increase in public service salaries in 1995, but in subsequent years private sector increases outstripped those in the public sector. This table needs to be interpreted with caution. Public sector employment dropped dramatically over this period and many of the jobs that were shed were low-skill (and thus lowpaid) ones (Bhorat, 2001:6 and Seidman-Makgetla, 2000:20). The loss of low-income jobs will in itself push up average remuneration levels without there, necessarily being an increase in the individual salaries of those that remain. Table 3.2 Percentage change in Remuneration per worker, Public and Private Sectors, Percentage change in remuneration per worker At current prices At constant prices* Year Public sector Private sector Public sector Private sector Source: South African Reserve Bank Quarterly Bulletins, various years. * Deflated using the non-agricultural GDP deflator In order to show actual changes in wages for public servants who have retained their jobs and not changed salary scale, Table A1 in the Appendix shows the increase in salary levels by a notch between 1996 and The nominal increases range from 48% at the very bottom end to 32% at the top-end. While these increases are small in real terms, the larger increases at the lower-end of the salary spectrum, implies a narrowing of the wage-gap in the public service over this period. 4. Wage differences in public versus private sector employment in South Africa The mean public sector wage in the February 2000 LFS was R per annum. In comparison, the February 2000 LFS finds that the average (formal) private sector wage was only R per annum. As a first exploratory step, Table 1 compares private and public sector wages in relation to a number of variables considered singly. For the purposes of this exercise, medians are reported so as to compare the wages of average workers, rather than average wages, which might be skewed by large outliers. Beginning with education level, it is clear that the private sector heavily penalises those with little education, while the public sector pays roughly the same for all those with less than Grade 12. On the other hand, someone with a degree, especially a postgraduate one, is more highly rewarded in the private sector. It is thus immediately apparent that there is less wage dispersion in the public sector: the average graduate (without a postgraduate qualification) in the private sector 5
9 DPRU Working Paper 02/62 Ingrid Woolard is earning 10 times that of the average worker with no education, while in the public sector this ratio is only 3.5. Moving on to occupational classes, it is evident that it is only professionals that on average do worse in the public sector. All other occupational classes seem to experience a small premium if they work for the state. Not surprisingly, this premium is especially large for those in (low-paid) elementary occupations where minimum wages play an important role in determining wage levels. The last part of Table 1 shows what the average, formal sector worker person of a given race and gender is earning in the public and private sectors. It is apparent that the average African or Coloured person in the public sector is earning more than the average person (of the same race and gender) in the private sector. 6
10 A Comparison of Wage Levels and Wage Inequality in the Public and Private Sectors, 1995 and 2000 Table 1 Comparison of Median Monthly Wages in Public and Private Sectors Educational attainment No schooling Some primary schooling Completed primary Some secondary Completed secondary Diploma (without grade 12) Diploma (with grade 12) First degree Postgraduate qualification Occupational class Legislators, senior officials and managers Professionals Technicians Clerks Service workers, shop and market sales workers Skilled agricultural and fishery workers Craft & related trade workers (incl. mining) Plant and machine operators and assemblers Elementary occupations Race and gender African male African female Median monthly gross wages Private Sector Public Sector Coloured male Coloured female Indian male Indian female White male White female Source: author s calculations using LFS February 2000, Statistics South Africa It must be noted that these univariate comparisons may be completely misleading. It is only once we place all these variables in a multivariate context and allow them to compete, that we will be able to say whether, for example, a White female in the public sector is earning more than her private sector counterpart after controlling for education, experience, occupation, sector and location. This is done in the next section. 7
11 DPRU Working Paper 02/62 Ingrid Woolard 5. Multivariate comparisons of earnings in the public and private sectors A wage equation (or earnings function) was used to estimate the premium associated with public sector employment. The wage equation employed, relates the logarithm of monthly earnings to a set of individual characteristics and an indicator variable ( public ) for working in national, provincial or local government. The following basic earnings function was employed: ln (Earnings) = b 0 + b 1 (Edu) + b 2 (Exp) + b 3 (Exp 2 ) + b 4 (Race) + b 5 (Gender) + b 6 (Region) + b 7 (occupation) + b 8 (Public) where: Edu represents educational attainment. Following Kingdon and Knight (2001:22), Edu was included as a set of categorical variables, rather than simply as years of schooling. Exp is proxied using the standard technique, which is to take age less years of schooling less six. 4 Race represents a set of dummy variables describing the four official South African racial groups. Gender is a dummy variable. Region is a set of dummy variables that describe the nine different South African provinces and urban and rural locations. Occupation is a set of dummies for the (one digit) major occupation groupings. Public is a dummy variable for the type of employer (private/public). Education was allowed to affect wages through a set of seven categorical variables, with no education as the omitted category. The wage equation includes linear and quadratic powers of experience. (Following Poterba and Rueben (1994), cubic and quartic powers of experience were also tested but were not significant.) A set of control variables for nine broad occupational 4 This proxy for experience has been criticized on the grounds that individuals do not have continuous work histories outside of schooling. Such a critique is particularly relevant in a country with an unemployment rate as high as South Africa s, but the proxy is nevertheless used here in the absence of a better alternative. 8
12 A Comparison of Wage Levels and Wage Inequality in the Public and Private Sectors, 1995 and 2000 classifications, were also included, with elementary workers as the omitted category. The wage equation was estimated separately, for various groups so as to tease out whether the premium differs across groups. In addition, the wage equation was estimated separately for public and private sector employees, respectively. This serves two purposes. Firstly, it allows us to see whether the effects of (or returns on) different individual characteristics differ across the two sectors. Secondly, it allows us to predict average wages in each sector for hypothetical workers with fixed characteristics. Ordinary Least Squares (OLS) and quantile regressions were estimated. The results of the OLS are shown in Tables 2 and 3. In order to keep the paper of manageable length, the results of the quantile regressions are not presented in full, and the results are discussed only in the section on public sector premia. 9
13 DPRU Working Paper 02/62 Ingrid Woolard Table 5.1: OLS Regression of In (monthly gross wages) for Formal Sector Employees All Private sector Public sector African White Public sector Female Coloured Indian White Experience Experience Some primary Completed primary Some secondary Completed secondary Diploma Degree Trade union member Occupation Manager Professional Technician Clerk Operator Service worker Skilled agricultural Craft worker Location Western Cape Eastern Cape Northern Cape Free State KZN North-West Mpumalanga Northern Province Rural Constant Number of observations Adjusted R Source: author s calculations using LFS February 2000, Statistics South Africa Notes: Omitted categories are: African, male, no education, elementary worker, agricultural sector, Gauteng Bold coefficients are significant at the 5% level. 10
14 A Comparison of Wage Levels and Wage Inequality in the Public and Private Sectors, 1995 and 2000 Table 5.2: OLS Regression of ln (monthly gross wages) for Formal Sector Employees Male Female African male African female Public sector Coloured Indian White Experience Experience Some primary Completed primary Some secondary Completed secondary Diploma Degree Trade union member Occupation Manager Professional Technician Clerk Operator Service worker Skilled agricultural Craft worker Location Western Cape Eastern Cape Northern Cape Free State KZN North-West Mpumalanga Northern Province Rural Constant Number of observations Adjusted R Source: author s calculations using LFS February 2000, Statistics South Africa Notes: Omitted categories are: African, male, no education, elementary worker, agricultural sector, Gauteng Bold coefficients are significant at the 5% level. 11
15 DPRU Working Paper 02/62 Ingrid Woolard By using the coefficients from the private sector equation in Table 5.1, it is possible to predict the wage distribution of all employees as if they were employed in the private sector. In this way, it is possible to explore the differences in the distribution of worker attributes in the two sectors. Figure 5.2 shows that the predicted monthly wages in the public sector is right-shifted, relative to the analogous private sector wage distribution. This indicates that there are proportionately more workers with high human capital in the public than private sectors. Figure 5.2 Predicted Private Sector earnings of Public and Private Sector Employees Relative frequency ln monthly wage (R) private sector public sector 5.1 The Effects of Gender, Race, Education, Occupation and Location A few general points will be made about the regressions, before turning to the primary issue of analysing the public sector premium. Women earn less than their male counterparts (after controlling for other factors) and this effect is almost as large in the public sector as in the private sector. Whites and Indians earn more than Africans (after controlling for other factors) in both the public and private sectors, but the difference is much larger in the private sector. Interestingly, in the pubic service there is no positive wage discrimination for Coloureds (unlike in the private sector) and the racial premium for Indians and Whites is much smaller than in the private sector, although still significant. The much smaller racial effects in the public sector relative to the private sector should be pleasing to government. The education variables bear some scrutiny, as the univariate cross-tabulations above indicated that education made less of a difference to wages in the public sector than in the private sector. The omitted education variable is completed secondary education and thus all the educational coefficients need to be seen in relation to this. Public sector employees with no education are 12
16 A Comparison of Wage Levels and Wage Inequality in the Public and Private Sectors, 1995 and 2000 not as heavily penalised as those in the private sector. This is probably related to the higher minimum wages in the public sector relative to the private sector. Surprisingly, however, those with completed primary education do relatively worse than their private sector peers 5 and the effect of completed secondary education is approximately the same as no schooling. A diploma in the public sector is worth relatively more than in the private sector, but this is possibly an artifact of the different types of diplomas that have been lumped together. Most diplomates in the public sector are teachers, while those in the private sector may have less valuable skills. In contrast, a degree is worth more in the private sector than in the public sector. Trade union membership slightly enhances earnings in both the public and private sectors and by about the same amount. It should be noted that the indicator variable for trade union membership may be imperfect: the February 2000 LFS finds that 69% of public servants belong to trade unions, while Seidman-Makgetla (2000: 20) claims that between 80% and 90% of public servants are unionised. Pay levels for government workers do not appear to depend on occupational class or location (although residents of KwaZulu-Natal earn less than similar government workers in other parts of the country). This powerfully demonstrates the uniformity of public sector pay scales across occupation and region. 5.2 Public Sector Wage Premium Of greatest interest to us is that the regressions show that, after controlling for education, age, location and occupation, public sector employees earn more than their private-sector counterparts. The first equation in Table 5.1 ( All ) indicates that being employed in the public sector multiplies your earnings by e 0.164, which equates to a premium of about 18%. The regressions for African and White show that this public sector premium is quite substantial for Africans, but insignificant for White employees. The average African public servant is earning 32% more than his equally experienced, equally qualified counterpart in the private sector. Table 5.2 indicates that the premium for women (especially African women) is much larger than for men. On average, women in the public sector earn 21% more than they would in the private sector, with the public sector premium for African women standing at 36%. Estimating the public wage premium is complicated by the presence of different variances in the wage distribution of the public and private sectors. 6 Consequently, quantile regressions (using the same model specifications as above) were run at 0.10, 0.25, 0.50, 0.75 and 0.9. Bootstrapped errors were calculated but are not shown here. All reported results are significant at the 1% level. Results for Whites are not given, as the public sector premium was not significant at any quantile. The results are summarised in the figure below This is relative to those with completed secondary. In absolute terms, public sector employees with completed primary earn more than those with completed secondary in the private sector. 6 Consider, for example, the case where the mean and the median wages in the two sectors, conditional on worker attributes, are the same, but the private sector has greater wage dispersion. While comparisons of the mean or median conditional wage will show no public sector premium, comparisons of higher quantiles will show a public sector penalty, while lower quantiles will show a public sector premium (Poterba and Rueben, 1994).
17 DPRU Working Paper 02/62 Ingrid Woolard Quantile estimates of the public sector wage premium Quantile=0.1 Quantile=0.25 Quantile=0.5 Quantile=0.75 Quantile=0.9 All African Male Female African male African female The quantile regression results suggest that the size of the public sector premium is sensitive to the choice of quantile. The premium is largest in the middle of the distribution for all groups other than African females. The median regression (for all ) finds a public sector premium, which is about 10% higher than the OLS estimate. Another way of depicting the existence of a public sector premium is to compare the actual public sector earnings distribution with the distribution of predicted earnings for the same group of people, but based on the private-sector regression. In other words, we are comparing actual earnings with what people would have earned had they been employed in the private sector. The graph is simply a graphical device for showing what we already know: predicted earnings are leftshifted relative to actual earnings indicating the existence of a wage premium in the public sector. 14
18 A Comparison of Wage Levels and Wage Inequality in the Public and Private Sectors, 1995 and 2000 Figure 5.3 Actual and Predicted (private-sector based) Earnings of Public Servants Relative frequency ln monthly wage (R) actual predicted (based on private sector pay) 6. Comparison of findings for 1995 and 2000 Table 6.1 compares the overall earnings function from Table 5.1 to the same regression run on the 1995 OHS data. 15
19 DPRU Working Paper 02/62 Ingrid Woolard Table 6.1 Comparison of Earnings Functions, 1995 and Public sector Female Coloured Indian White Experience Experience No schooling Some primary Completed primary Some secondary Diploma Degree Trade union member Occupation Professional Technician Clerk Operator Service worker Skilled agricultural Craft worker Location Western Cape Eastern Cape Northern Cape Free State KZN North-West Mpumalanga Northern province Rural Constant Number of observations Adjusted R
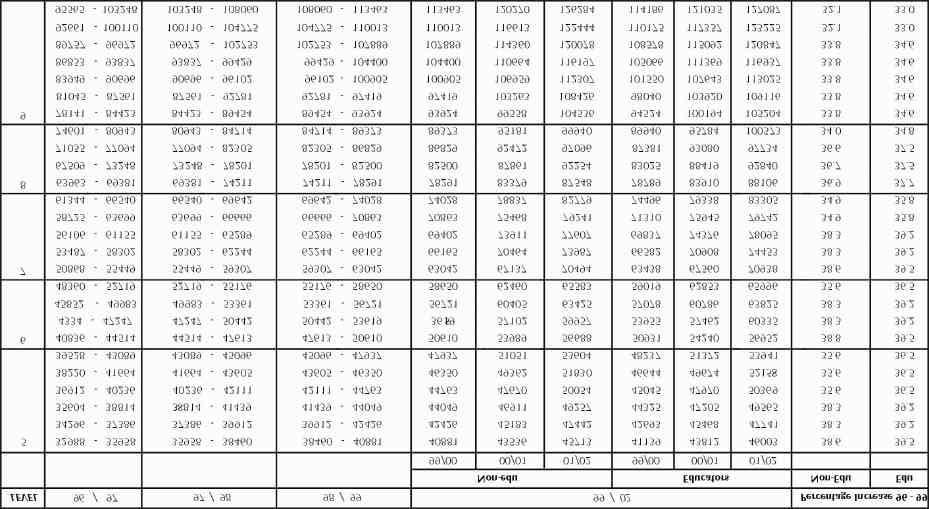
20 A Comparison of Wage Levels and Wage Inequality in the Public and Private Sectors, 1995 and 2000 Table 6.1 shows the identically specified earnings function on 1995 OHS and 2000 LFS data. The 1995 data has been inflated to 2000 price levels using the overall Consumer Price Index for the period. The OHS 1995 regression results for all the groups reported in Tables 5.1 and 5.2 can be found in Appendix A2. As discussed in Section 2, the two data-sets are not entirely comparable as the 1995 survey collected net wages while the 2000 data recorded gross earnings. Consequently, it is unsurprising that the constant for the 2000 regression is quite a bit higher than that for The 1995 regression shows that there was a small wage penalty to working in the public sector while in 2000 there was an advantage. This is hard to explain. It is possible that this is partly the result of an imperfect proxy for public and private sector employment in the 1995 data. As such, it would be a mistake to make too much of this result. There has, however, been considerable restructuring in the public sector since the transition to democratic rule. The South African government has actively sought to make public sector employment more attractive and to pay employees salaries, which are market-related. This realignment could conceivably have made sufficient impact to swing the coefficient on the public sector dummy variable from negative to positive. 7. Wage dispersion Table 7.1 employs the Gini coefficient as a measure of wage dispersion and compares it for the private and public sectors. Table 7.1 Gini Coefficients, Public and Private Wages, 1995 and Private Public All Private Public All Gini coefficient of wages Source: author s calculations using OHS 1995 and LFS February 2000, Statistics South Africa These results should be interpreted with caution: the values for the two years are not comparable, because the 1995 data is for net wages, while the 2000 data is for gross wages. It is to be expected that the progressive nature of the South African personal income tax system compresses the wage distribution, and thus inequality of net wages should always be less than inequality of gross wages. Results for both years are shown simply to demonstrate that both surveys found that wage inequality in the public sector is much lower than in the private sector. (The two surveys also suggest a very similar picture in terms of the size of the difference between the private and public sector Gini coefficients.) The divergence in measured wage dispersion is considerable, with a Gini coefficient in the private sector of 0.57 (0.51) compared with only 0.41 (0.34) in the public sector in 2000 (1995). Table 6 shows the distribution of wages in the private and public sectors. (Again, the caveats about the data raised in Section 2 should be borne in mind.) It is immediately evident that the lower wage dispersion in the public sector is the result of public sector wages having a much higher floor and a slightly lower ceiling. The ratio of wages at the 90 th percentile to wages at the 10 th percentile is 15 in the public sector, but only 7 in the public sector. 17
21 DPRU Working Paper 02/62 Ingrid Woolard Table 6 Distribution of Wages in the Public and Private Sectors, 2000 Wage at the 10 th percentile Wage at the 25 th percentile Median wage Wage at the 75 th percentile Wage at the 90 th percentile Wage at the 95 th percentile Private Public All Source: author s calculations using LFS February 2000, Statistics South Africa 8. Conclusion The South African Government is a major employer in South Africa. In recent years it has strived to restructure the public service in the interests of enhancing both equity and efficiency. This has seen the realignment of pay scales and a concerted effort to attract quality staff. While the size of the public service has been trimmed, the number of managers has increased and overall wages have been rising. This paper has demonstrated that average wages in the public sector are much higher than in the private sector, but this is the result of more than one factor. Firstly, there is considerable human capital in the public service. Teachers alone, account for more than 15% of all South Africans with a tertiary degree (Seidman-Makgeta, 2000: 20). Therefore, part of the higher salaries is accounted for simply by the fact that the State employs people who, because of their individual attributes, would ordinarily earn more than average. Secondly, this paper aims to demonstrate that a small wage premium exists to working in the public sector. On average, public servants earn 18% more than they would in the private sector. The State is intent on being a model employer and sets national norms and standards for the employment relationship. As such, working conditions in the public sector are often considerably better than in the private sector. Hand-in-hand with this goes the commitment to pay a living wage. As a result, the lowest paid government employees are earning considerably more than many of their private-sector counterparts. This paper has also demonstrated that public sector wages are far less dispersed than private sector wages, largely as a result of much higher wages at the lower end of the salary scales. 18
22 A Comparison of Wage Levels and Wage Inequality in the Public and Private Sectors, 1995 and 2000 References Bhorat, H Labour market challenges in the post-apartheid South Africa: A country profile. Processed. Report to the ILO. Juhn, C., Murphy, KM and Pierce, B Wage inequality and the rise in returns to skill. Journal of Political Economy volume 101. Kiefer, N.M Bayesian Estimation of the Earnings Function. Working Paper No. 74, Industrial Relations Section: Princeton University. Kingdon, G.G. and Knight, J Why high open unemployment and small informal sector in South Africa? Centre for the Study of African Economies, Department of Economics: University of Oxford. Mincer, J Schooling, Experience, and Earnings. New York: Columbia University Press for NBER. Poterba, J. and Rueben, K The distribution of public sector wage premia: new evidence using quantile regression methods. NBER Working Paper #4734. Seidman-Makgetla, N A new labour policy for the public service. Indicator SA, volume 17 no. 4. Thompson, K. and Woolard, I Achieving employment equity in the public service: a study of changes between 1995 and Unpublished mimeograph, University of Port Elizabeth. 19

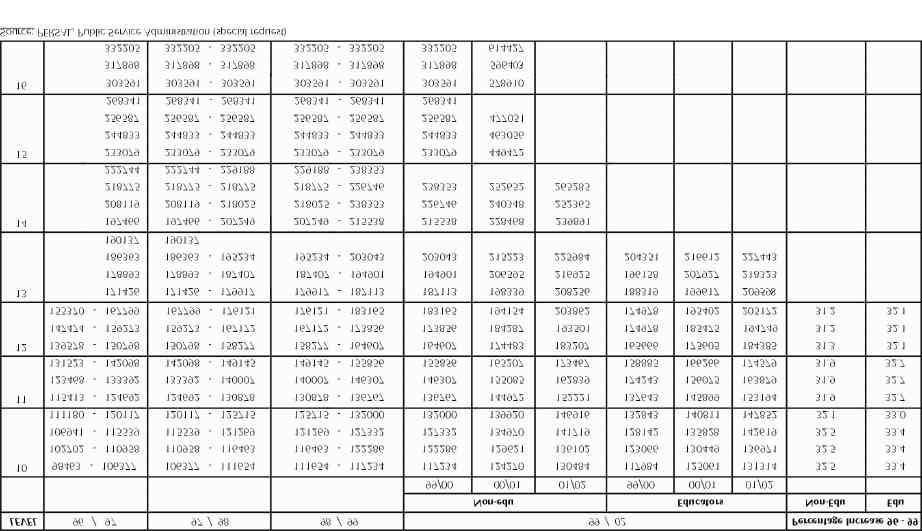
23 Appendix Table A1 Wage Increases by Notch
24
25
 for Formal Sector Employees, OHS")
26 Table A2 OLS Regression of ln (monthly net wages) for Formal Sector Employees, OHS 1995
Women in the South African Labour Market
 Women in the South African Labour Market 1995-2005 Carlene van der Westhuizen Sumayya Goga Morné Oosthuizen Carlene.VanDerWesthuizen@uct.ac.za Development Policy Research Unit DPRU Working Paper 07/118
IMPACT OF GOVERNMENT PROGRAMMES USING ADMINISTRATIVE DATA SETS SOCIAL ASSISTANCE GRANTS
 IMPACT OF GOVERNMENT PROGRAMMES USING ADMINISTRATIVE DATA SETS SOCIAL ASSISTANCE GRANTS Project 6.2 of the Ten Year Review Research Programme Second draft, 19 June 2003 Dr Ingrid Woolard 1 Introduction
Poverty: Analysis of the NIDS Wave 1 Dataset
 Poverty: Analysis of the NIDS Wave 1 Dataset Discussion Paper no. 13 Jonathan Argent Graduate Student, University of Cape Town jtargent@gmail.com Arden Finn Graduate student, University of Cape Town ardenfinn@gmail.com
Monitoring the Performance
 Monitoring the Performance of the South African Labour Market An overview of the Sector from 2014 Quarter 1 to 2017 Quarter 1 Factsheet 19 November 2017 South Africa s Sector Government broadly defined
Monitoring the Performance of the South African Labour Market
 Monitoring the Performance of the South African Labour Market An overview of the South African labour market from 3 of 2010 to of 2011 September 2011 Contents Recent labour market trends... 2 A brief labour
Table 1 sets out national accounts information from 1994 to 2001 and includes the consumer price index and the population for these years.
 WHAT HAPPENED TO THE DISTRIBUTION OF INCOME IN SOUTH AFRICA BETWEEN 1995 AND 2001? Charles Simkins University of the Witwatersrand 22 November 2004 He read each wound, each weakness clear; And struck his
Income and Non-Income Inequality in Post- Apartheid South Africa: What are the Drivers and Possible Policy Interventions?
 Income and Non-Income Inequality in Post- Apartheid South Africa: What are the Drivers and Possible Policy Interventions? Haroon Bhorat Carlene van der Westhuizen Toughedah Jacobs Haroon.Bhorat@uct.ac.za
Monitoring the Performance of the South African Labour Market
 Monitoring the Performance of the South African Labour Market An overview of the South African labour market for the Year ending 2011 5 May 2012 Contents Recent labour market trends... 2 A labour market
Labour. Labour market dynamics in South Africa, statistics STATS SA STATISTICS SOUTH AFRICA
 Labour statistics Labour market dynamics in South Africa, 2017 STATS SA STATISTICS SOUTH AFRICA Labour Market Dynamics in South Africa 2017 Report No. 02-11-02 (2017) Risenga Maluleke Statistician-General
Quarterly Labour Force Survey
 Statistical release Quarterly Labour Force Survey Quarter 4: Embargoed until: 14 February 2017 10:30 ENQUIRIES: FORTHCOMING ISSUE: EXPECTED RELEASE DATE User Information Services Quarter 1:2017 May 2017
Monitoring the Performance of the South African Labour Market
 Monitoring the Performance of the South African Labour Market An overview of the South African labour market for the Year Ending 2012 6 June 2012 Contents Recent labour market trends... 2 A labour market
CSO Research Paper. Econometric analysis of the public/private sector pay differential
 CSO Research Paper Econometric analysis of the public/private sector pay differential 2011 to 2014 2 Contents EXECUTIVE SUMMARY... 4 1 INTRODUCTION... 5 1.1 SPECIFICATIONS INCLUDED IN THE ANALYSIS... 6
Labour force survey. September Embargoed until: 29 March :30
 Statistical release P0210 Labour force survey September 2006 Embargoed until: 29 March 2007 12:30 Enquiries: Forthcoming issue: Expected release date User Information Services LFS March 2007 September
A STUDY OF THE LABOUR MARKET IN SOUTH AFRICA ABSTRACT
 European Journal of Research in Social Sciences Vol. 2 No. 4, 2014 A STUDY OF THE LABOUR MARKET IN SOUTH AFRICA Zeleke Worku Tshwane University of Technology Business School Pretoria, SOUTH AFRICA ABSTRACT
Monitoring the Performance of the South African Labour Market
 Monitoring the Performance of the South African Labour Market An overview of the South African labour market for the Year Ending 2016 14 July 2016 Contents Recent labour market trends... 2 A labour market
Monitoring the Performance of the South African Labour Market
 Monitoring the Performance of the South African Labour Market An overview of the South African labour market from 1 of 2009 to of 2010 August 2010 Contents Recent labour market trends... 2 A brief labour
Quarterly Labour Force Survey Q1:2018
 Quarterly Labour Force Survey Q1:2018 Faizel Mohammed Stats SA discouraged work seekers The labour market Q1:2018 37,7 million People of working age in South Africa (15 64 year olds) Labour force 22,4
The South African labour market: Stellenbosch Economic Working Papers: 05/08
 The South African labour market: 1995 2006 DEREK YU Stellenbosch Economic Working Papers: 05/08 KEYWORDS: SOUTH AFRICA, HOUSEHOLD SURVEY, LABOUR MARKET TRENDS JEL: J00 DEREK YU DEPARTMENT OF ECONOMICS
Monitoring the Performance of the South African Labour Market
 Monitoring the Performance of the South African Labour Market An overview of the South African labour market for the Year Ending 2012 8 October 2012 Contents Recent labour market trends... 2 A labour market
Estimating the Causal Effect of Enforcement on Minimum Wage Compliance: The Case of South Africa
 Estimating the Causal Effect of Enforcement on Minimum Wage Compliance: The Case of South Africa Haroon Bhorat* Development Policy Research Unit haroon.bhorat@uct.ac.za Ravi Kanbur Cornell University sk145@cornell.edu
Wage Trends in Post-Apartheid South Africa: Constructing an Earnings Series from Household Survey Data. Rulof Burger Derek Yu
 Wage Trends in Post-Apartheid South Africa: Constructing an Earnings Series from Household Survey Data Rulof Burger Derek Yu rulof@sun.ac.za Development Policy Research Unit DPRU Working Paper 07/117 ISBN:
Quarterly Labour Force Survey
 Statistical release P0211 Quarterly Labour Force Survey Quarter 3, Embargoed until: 01 November 11:30 Enquiries: Forthcoming issue: Expected release date User Information Services Quarter 4, February 2012
The Gender Earnings Gap: Evidence from the UK
 Fiscal Studies (1996) vol. 17, no. 2, pp. 1-36 The Gender Earnings Gap: Evidence from the UK SUSAN HARKNESS 1 I. INTRODUCTION Rising female labour-force participation has been one of the most striking
Quarterly Labour Force Survey
 Statistical release P0211 Quarterly Labour Force Survey Quarter 2, 2014 Embargoed until: 29 July 2014 13:00 Enquiries: Forthcoming issue: Expected release date User Information Services Quarter 3, 2014
Public-private sector pay differential in UK: A recent update
 Public-private sector pay differential in UK: A recent update by D H Blackaby P D Murphy N C O Leary A V Staneva No. 2013-01 Department of Economics Discussion Paper Series Public-private sector pay differential
Shifts in Non-Income Welfare in South Africa
 Shifts in Non-Income Welfare in South Africa 1993-2004 DPRU Policy Brief Series Development Policy Research unit School of Economics University of Cape Town Upper Campus June 2006 ISBN: 1-920055-30-4 Copyright
Understanding the Gender Earnings Gap in the Post-Apartheid South African Labour Market
 Understanding the Gender Earnings Gap in the Post-Apartheid South African Labour Market Sumayya Goga 201500851 Supervisor: Dorrit Posel Faculty of Management Studies University of KwaZulu Natal 2008 Submitted
Discussion paper 1 Comparative labour statistics Labour force survey: first round pilot February 2000
 Discussion paper 1 Comparative labour statistics Labour force survey: first round pilot February 2000 Statistics South Africa 27 March 2001 DISCUSSION PAPER 1: COMPARATIVE LABOUR STATISTICS LABOUR FORCE
Salary Survey. The Association of South African Quantity Surveyors (ASAQS) March 2017 (Published in October 2017) South African Construction Industry
 March 2017 (Published in October 2017) South African Construction Industry") The Association of South African Quantity Surveyors (ASAQS) Salary Survey March 2017 (Published in October 2017) South African Construction Industry Business Information Services www.industryinsight.co.za
The Association of South African Quantity Surveyors (ASAQS) Salary Survey March 2017 (Published in October 2017) South African Construction Industry Business Information Services www.industryinsight.co.za
Quarterly Labour Force Survey
 Statistical release Quarterly Labour Force Survey Quarter 1, 2014 Embargoed until: 05 May 2014 11:30 Enquiries: Forthcoming issue: Expected release date User Information Services Quarter 2, 2014 July 2014
What has happened to inequality and poverty in post-apartheid South Africa. Dr Max Price Vice Chancellor University of Cape Town
 What has happened to inequality and poverty in post-apartheid South Africa Dr Max Price Vice Chancellor University of Cape Town OUTLINE Examine trends post-apartheid (since 1994) Income inequality Overall,
New Jersey Public-Private Sector Wage Differentials: 1970 to William M. Rodgers III. Heldrich Center for Workforce Development
 New Jersey Public-Private Sector Wage Differentials: 1970 to 2004 1 William M. Rodgers III Heldrich Center for Workforce Development Bloustein School of Planning and Public Policy November 2006 EXECUTIVE
Trends in Medical Schemes Contributions, Membership and Benefits
 COUNCIL FOR MEDICAL SCHEMES Number 2 of 2008 Prepared by the Office of the Registrar of Medical Schemes Trends in Medical Schemes Contributions, Membership and Benefits 2002 2006 May 2008 COUNCIL FOR MEDICAL
Social protection and labor market outcomes in South Africa
 Social protection and labor market outcomes in South Africa Cally Ardington, University of Cape Town Till Bärnighausen, Harvard School of Public Health and Africa Centre for Health and Population Studies
Post subsidies in provincial Departments of Social Development. Report prepared by Debbie Budlender
 Post subsidies in provincial Departments of Social Development Report prepared by Debbie Budlender April 2017 1 About this study: The care work project was initiated in 2016 by the Shukumisa Campaign in
FIGURE I.1 / Per Capita Gross Domestic Product and Unemployment Rates. Year
 FIGURE I.1 / Per Capita Gross Domestic Product and Unemployment Rates 40,000 12 Real GDP per Capita (Chained 2000 Dollars) 35,000 30,000 25,000 20,000 15,000 10,000 5,000 Real GDP per Capita Unemployment
Discussion paper 1 Comparative labour statistics Labour force survey: first round pilot February 2000
 Discussion paper 1 Comparative labour statistics Labour force survey: first round pilot February 2000 Statistics South Africa 27 March 2001 DISCUSSION PAPER 1: COMPARATIVE LABOUR STATISTICS LABOUR FORCE
1. Introduction 2. DOMESTIC ECONOMIC DEVELOPMENTS. 2.1 Economic performance in South Africa ISBN: SECOND QUARTER 2013
 November 2013 ISBN: 978-1-920493-99-8 SECOND QUARTER 2013 1. Introduction The Quarterly Economic Update for the second quarter of 2013 (2Q2013) has been expanded and contains a range of new indicators.
Quarterly Labour Force Survey
 Statistical release Quarterly Labour Force Survey Quarter 1, Embargoed until: 08 May 11:30 Enquiries: Forthcoming issue: Expected release date User Information Services Quarter 2, July Tel: (012) 310 8600/4892/8390
Labour force survey February 2001
 Statistical release P0210 Labour force survey February 2001 Co-operation between Statistics South Africa (Stats SA), the citizens of the country, the private sector and government institutions is essential
SECTION- III RESULTS. Married Widowed Divorced Total
 SECTION- III RESULTS The results of this survey are based on the data of 18890 sample households enumerated during four quarters of the year from July, 2001 to June, 2002. In order to facilitate computation
Labour Market: Analysis of the NIDS Wave 1 Dataset
 Labour Market: Analysis of the NIDS Wave 1 Dataset Discussion Paper no. 12 Vimal Ranchod Southern African Labour & Development Research Unit vimal.ranchhod@gmail.com July 2009 1. Introduction The purpose
Estimating a poverty line: An application to free basic municipal services in South Africa
 Estimating a poverty line: An application to free basic municipal services in South Africa Development Policy Research Unit Haroon Bhorat Development Policy Research Unit haroon.bhorat@uct.ac.za Morne
4 Emfuleni population and labour force
 Chapter 4 University of Pretoria etd Slabbert, T J C (2004) 4 Emfuleni population and labour force Current status and trends 4.1 Introduction In this chapter, Emfuleni is analysed in terms of its demographics
TRADE UNION MEMBERSHIP Statistical Bulletin
 TRADE UNION MEMBERSHIP 2016 Statistical Bulletin May 2017 Contents Introduction 3 Key findings 5 1. Long Term and Recent Trends 6 2. Private and Public Sectors 13 3. Personal and job characteristics 16
economic growth QUARTERLY DATA SERIES
 ISSUE 8 December 2016 PROVINCIAL economic growth QUARTERLY DATA SERIES introduction The Quarterly Economic Review is a statistical release compiled by the Eastern Cape Socio Economic Consultative Council
Southern Africa Labour and Development Research Unit
 Southern Africa Labour and Development Research Unit A National Minimum Wage in the Context of the South African Labour Market by Arden Finn Working Paper Series Number 153 About the Author(s) and Acknowledgments
INCOME DISTRIBUTION AND INEQUALITY IN LUXEMBOURG AND THE NEIGHBOURING COUNTRIES,
 INCOME DISTRIBUTION AND INEQUALITY IN LUXEMBOURG AND THE NEIGHBOURING COUNTRIES, 1995-2013 by Conchita d Ambrosio and Marta Barazzetta, University of Luxembourg * The opinions expressed and arguments employed
Introduction. Where to for the South African labour market? Some big issues. Miriam Altman and Imraan Valodia
 Introduction Where to for the South African labour market? Some big issues The labour market landscape has changed dramatically over the first decade of democratic governance in South Africa. Of course,
The economic value and impacts of informal care in New Zealand. For Carers NZ and the NZ Carers Alliance
 The economic value and impacts of informal care in New Zealand For Carers NZ and the NZ Carers Alliance June 2014 Authorship This report has been prepared by Dave Grimmond. Email: davidg@infometrics.co.nz
DOES IT PAY TO GO PUBLIC? PUBLIC/PRIVATE WAGE DIFFERENCES
 DOES IT PAY TO GO PUBLIC? PUBLIC/PRIVATE WAGE DIFFERENCES AMONG RECENT GRADUATES IN IRELAND Philip J. O Connell and Helen Russell 1. Introduction A recent report from the Central Statistics Office (2006),
ECONOMIC GROWTH PROVINCIAL INTRODUCTION QUARTERLY DATA SERIES
 ISSUE 7 OCTOBER 2016 PROVINCIAL QUARTERLY DATA SERIES ECONOMIC GROWTH INTRODUCTION The Quarterly Economic Review is a statistical release compiled by the Eastern Cape Socio Economic Consultative Council
Labour force survey September 2003
 Statistical release Labour force survey September 2003 Co-operation between Statistics South Africa (Stats SA), the citizens of the country, the private sector and government institutions is essential
Wage Gap Estimation with Proxies and Nonresponse
 Wage Gap Estimation with Proxies and Nonresponse Barry Hirsch Department of Economics Andrew Young School of Policy Studies Georgia State University, Atlanta Chris Bollinger Department of Economics University
ADDRESSING PUBLIC PRIVATE SECTOR INEQUALITIES PROFESSOR EMERITUS YOSUF VERIAVA
 ADDRESSING PUBLIC PRIVATE SECTOR INEQUALITIES PROFESSOR EMERITUS YOSUF VERIAVA HEALTH INEQUALITY AND INEQUITY Disparity: Is there a difference in the health status rates between population groups? Inequality:
Charles H. Dyson School of Applied Economics and Management Cornell University, Ithaca, New York USA
 WP 2011-05 January 2011 Working Paper Charles H. Dyson School of Applied Economics and Management Cornell University, Ithaca, New York 14853-7801 USA THE DETERMINANTS OF MINIMUM WAGE VIOLATION IN SOUTH
Exploring the rise of self-employment in the modern economy
 Exploring the rise of self-employment in the modern economy A guide to demographics and other trends in the UK s self-employed workforce in 2017 1 About IPSE IPSE is the largest association of independent
Union Advantage for Black Workers
 February 2014 Union Advantage for Black Workers By Janelle Jones and John Schmitt* Center for Economic and Policy Research 1611 Connecticut Ave. NW Suite 400 Washington, DC 20009 tel: 202-293-5380 fax:
CONSTRUCTION MONITOR Employment Q3 2017
 CONSTRUCTION MONITOR Employment Q3 2017 CIDB CONSTRUCTION MONITOR - EMPLOYMENT; OCTOBER 2017 CIDB CONSTRUCTION MONITOR - EMPLOYMENT; OCTOBER 2017 1. Introduction 1 2. Employment in the Construction Industry;
The 5 th South African Employment report
 The 5 th South African Employment report The effect of education and skills and self employment on employment. The 5 th South African Employment Report Bragging a little SAER Salary and employment trends.
Who cares about regional data?
 Who cares about regional data? Development happens somewhere - in a spatial locality. Aggregations hide [important] variety in the data Within South Africa: KwaZulu-Natal is not like the Western Cape Within
Civil Service Statistics 2009: A focus on gross annual earnings
 Economic & Labour Market Review Vol 4 No 4 April 10 ARTICLE David Matthews and Andrew Taylor Civil Service Statistics 09: A focus on gross annual earnings SUMMARY This article presents a summary of annual
An overview of the South African macroeconomic. environment
 An overview of the South African macroeconomic environment 1 Study instruction Study Study guide: study unit 1 Study unit outcomes Once you have worked through this study unit, you should be able to give
LABOUR MARKET PROVINCIAL 51.6 % 48.4 % Unemployed Discouraged work-seekers % 71.8 % QUARTERLY DATA SERIES
 QUARTERLY DATA SERIES ISSUE 7 November 2016 PROVINCIAL LABOUR MARKET introduction introduction The Eastern Cape Quarterly Review of Labour Markets is a statistical release compiled by the Eastern Cape
The Gender Pay Gap in Belgium Report 2014
 The Gender Pay Gap in Belgium Report 2014 Table of contents The report 2014... 5 1. Average pay differences... 6 1.1 Pay Gap based on hourly and annual earnings... 6 1.2 Pay gap by status... 6 1.2.1 Pay
It is now commonly accepted that earnings inequality
 What Is Happening to Earnings Inequality in Canada in the 1990s? Garnett Picot Business and Labour Market Analysis Division Statistics Canada* It is now commonly accepted that earnings inequality that
EstimatingFederalIncomeTaxBurdens. (PSID)FamiliesUsingtheNationalBureau of EconomicResearchTAXSIMModel
FamiliesUsingtheNationalBureau of EconomicResearchTAXSIMModel") ISSN1084-1695 Aging Studies Program Paper No. 12 EstimatingFederalIncomeTaxBurdens forpanelstudyofincomedynamics (PSID)FamiliesUsingtheNationalBureau of EconomicResearchTAXSIMModel Barbara A. Butrica and
ISSN1084-1695 Aging Studies Program Paper No. 12 EstimatingFederalIncomeTaxBurdens forpanelstudyofincomedynamics (PSID)FamiliesUsingtheNationalBureau of EconomicResearchTAXSIMModel Barbara A. Butrica and
Evaluation of the gender wage gap in Austria
 Evaluation of the gender wage gap in Austria René Böheim 1,2 Marian Fink 2 Silvia Rocha-Akis 2 Christine Zulehner 3,2 1 Vienna University of Economics and Business, JKU Linz 2 Austrian Institute of Economic
Does Growth make us Happier? A New Look at the Easterlin Paradox
 Does Growth make us Happier? A New Look at the Easterlin Paradox Felix FitzRoy School of Economics and Finance University of St Andrews St Andrews, KY16 8QX, UK Michael Nolan* Centre for Economic Policy
Employment Outlook for. Public Administration and Safety
 Employment Outlook for Contents INTRODUCTION... 3 EMPLOYMENT GROWTH... 4 EMPLOYMENT PROSPECTS... 5 VACANCY TRENDS... 8 WORKFORCE AGEING... 11 EMPLOYMENT BY GENDER AND FULL-TIME/PART-TIME... 13 HOURS WORKED...
Total reward: pay and pension contributions in the private and public sectors
 Economic & Labour Market Review Vol 4 No 9 September 21 ARTICLE Sarah Levy, Hazel Mitchell, Guled Guled and Jessica Coleman Total reward: pay and pension contributions in the private and public sectors
Have Labour Market Outcomes Affected Household Structure in South Africa? A Preliminary Descriptive Analysis of Households.
 Have Labour Market Outcomes Affected Household Structure in South Africa? A Preliminary Descriptive Analysis of Households Farah Pirouz Have Labour Market Outcomes Affected Household Structure in South
HOUSEHOLDS INDEBTEDNESS: A MICROECONOMIC ANALYSIS BASED ON THE RESULTS OF THE HOUSEHOLDS FINANCIAL AND CONSUMPTION SURVEY*
 HOUSEHOLDS INDEBTEDNESS: A MICROECONOMIC ANALYSIS BASED ON THE RESULTS OF THE HOUSEHOLDS FINANCIAL AND CONSUMPTION SURVEY* Sónia Costa** Luísa Farinha** 133 Abstract The analysis of the Portuguese households
METROPOLITAN POLICE SERVICE: ETHNICITY PAY GAP ANALYSIS Executive Summary
 Executive Summary METROPOLITAN POLICE SERVICE: ETHNICITY PAY GAP ANALYSIS 2017 1. This is our first formal report examining how pay systems, people processes and management decisions impact on average
Downloads from this web forum are for private, non-commercial use only. Consult the copyright and media usage guidelines on
 Econ 3x3 www.econ3x3.org A web forum for accessible policy-relevant research and expert commentaries on unemployment and employment, income distribution and inclusive growth in South Africa Downloads from
Patterns of Pay: results of the Annual Survey of Hours and Earnings
 Patterns of Pay: results of the Annual Survey of Hours and Earnings 1997-2007 By Hywel Daniels, Employment, Earnings and Innovation Division, Office for National Statistics Key points In April 2007 median
South African Baseline Study on Financial Literacy
 Regional Dissemination Conference on Building Financial Capability South African Baseline Study on Financial Literacy Lyndwill Clarke Head: Consumer Education 30-31 January 2013 Nairobi, Kenya Outline
THE CAYMAN ISLANDS LABOUR FORCE SURVEY REPORT SPRING 2017
 THE CAYMAN ISLANDS LABOUR FORCE SURVEY REPORT SPRING 2017 Published AUGUST 2017 Economics and Statistics Office i CONTENTS SUMMARY TABLE 1: KEY LABOUR FORCE INDICATORS BY STATUS... 1 SUMMARY TABLE 2: KEY
TRAINING COURSE ON SOCIAL PROTECTION & FORMALIZATION TRINIDAD AND TOBAGO MARCH 15, 2017 INTRODUCTION
 TRAINING COURSE ON SOCIAL PROTECTION & FORMALIZATION TRINIDAD AND TOBAGO MARCH 15, 2017 INTRODUCTION INTRODUCTION Design of the NIS Assistance from the ILO in the 1960 s Social Security Minimum Standards
The Performance of Large Private Australian Enterprises* Simon Feeny and Mark Rogers
 The Performance of Large Private Australian Enterprises* Simon Feeny and Mark Rogers Melbourne Institute of Applied Economic and Social Research The University of Melbourne Melbourne Institute Working
CONVERGENCES IN MEN S AND WOMEN S LIFE PATTERNS: LIFETIME WORK, LIFETIME EARNINGS, AND HUMAN CAPITAL INVESTMENT $
 CONVERGENCES IN MEN S AND WOMEN S LIFE PATTERNS: LIFETIME WORK, LIFETIME EARNINGS, AND HUMAN CAPITAL INVESTMENT $ Joyce Jacobsen a, Melanie Khamis b and Mutlu Yuksel c a Wesleyan University b Wesleyan
Wage Structure Survey 2010 Final results
 24 October 2012 Update 3 December 2012 Wage Structure Survey 2010 Final results Main results The average annual gross wage is 22,790.20 euros per worker in 2010. País Vasco, with 26,593.70 euros per worker
The changing face of public sector employment
 Economic & Labour Market Review Vol 4 No 7 July 2010 ARTICLE David Matthews The changing face of public sector employment 1999 2009 SUMMARY This article presents an analysis of public sector employment
Young People in South Africa
 Young People in South Africa 19 June 2015 Risenga Maluleke DDG: Statistical Collections and Outreach Statistics South Africa Outline of Presentation Stats SA Macro Trends in Economy South African Income
Downloads from this web forum are for private, non commercial use only. Consult the copyright and media usage guidelines on
 Econ 3x3 www.econ3x3.org A web forum for accessible policy relevant research and expert commentaries on unemployment and employment, income distribution and inclusive growth in South Africa Downloads from
Civil Service Statistics 2008: a focus on gross annual earnings
 FEATURE David Matthews and Andrew Taylor Civil Service Statistics 2008: a focus on gross annual earnings SUMMARY This article presents a summary of annual Civil Service statistics for the year ending 31
Organisation de Coopération et de Développement Économiques Organisation for Economic Co-operation and Development
 Unclassified ECO/WKP(2013)14 Organisation de Coopération et de Développement Économiques Organisation for Economic Co-operation and Development 19-Feb-2013 English - Or. English ECONOMICS DEPARTMENT ECO/WKP(2013)14
Online Appendix from Bönke, Corneo and Lüthen Lifetime Earnings Inequality in Germany
 Online Appendix from Bönke, Corneo and Lüthen Lifetime Earnings Inequality in Germany Contents Appendix I: Data... 2 I.1 Earnings concept... 2 I.2 Imputation of top-coded earnings... 5 I.3 Correction of
THE GENDER WAGE GAP IN THE PUBLIC AND PRIVATE SECTORS IN CANADA
 THE GENDER WAGE GAP IN THE PUBLIC AND PRIVATE SECTORS IN CANADA A Thesis Submitted to the College of Graduate Studies and Research In Partial Fulfillment of the Requirements For the Degree of Master of
BUDGET SOUTH AFRICAN BUDGET: THE MACRO PICTURE. Key messages
 BUDGET CHILDREN AND THE SOUTH AFRICAN BUDGET: THE MACRO PICTURE UNICEF/Pirozzi Key messages The nearly 2 million children in South Africa account for more than a third of the country s population. South
Fourth ASISA Insurance Gap Study (performed by True South Actuaries & Consultants)
") Fourth ASISA Insurance Gap Study (performed by True South Actuaries & Consultants) October 2016 Agenda (A trillion has 12 zeros) Agenda (A trillion has 12 zeros) within the SA population landscape 55 million
Fourth ASISA Insurance Gap Study (performed by True South Actuaries & Consultants) October 2016 Agenda (A trillion has 12 zeros) Agenda (A trillion has 12 zeros) within the SA population landscape 55 million
SUMMARY OF THE CHILDREN S BILL COSTING
 Centre for Actuarial Research (CARe) SUMMARY OF THE CHILDREN S BILL COSTING Written by Debbie Budlender Children s Institute and Centre for Actuarial Research, University of Cape Town November 2006 Why
2000 HOUSING AND POPULATION CENSUS
 Ministry of Finance and Economic Development CENTRAL STATISTICS OFFICE 2000 HOUSING AND POPULATION CENSUS REPUBLIC OF MAURITIUS ANALYSIS REPORT VOLUME VIII - ECONOMIC ACTIVITY CHARACTERISTICS June 2005
Gender Differences in the Labor Market Effects of the Dollar
 Gender Differences in the Labor Market Effects of the Dollar Linda Goldberg and Joseph Tracy Federal Reserve Bank of New York and NBER April 2001 Abstract Although the dollar has been shown to influence
Minimum Wage as a Poverty Reducing Measure
 Illinois State University ISU ReD: Research and edata Master's Theses - Economics Economics 5-2007 Minimum Wage as a Poverty Reducing Measure Kevin Souza Illinois State University Follow this and additional
David Newhouse Daniel Suryadarma
 David Newhouse Daniel Suryadarma Outline of presentation 1. Motivation Vocational education expansion 2. Data 3. Determinants of choice of type 4. Effects of high school type Entire sample Cohort vs. age
Wage Determinants Analysis by Quantile Regression Tree
 Communications of the Korean Statistical Society 2012, Vol. 19, No. 2, 293 301 DOI: http://dx.doi.org/10.5351/ckss.2012.19.2.293 Wage Determinants Analysis by Quantile Regression Tree Youngjae Chang 1,a
LABOUR MARKET PROVINCIAL 54.3 % 45.7 % Unemployed Discouraged work-seekers % 71.4 % QUARTERLY DATA SERIES
 QUARTERLY DATA SERIES ISSUE 6 October 2016 PROVINCIAL LABOUR MARKET introduction introduction The Eastern Cape Quarterly Review of Labour Markets is a statistical release compiled by the Eastern Cape Socio
Comparison of OLS and LAD regression techniques for estimating beta
 Comparison of OLS and LAD regression techniques for estimating beta 26 June 2013 Contents 1. Preparation of this report... 1 2. Executive summary... 2 3. Issue and evaluation approach... 4 4. Data... 6
Unemployment in Limpopo Province in South Africa: Searching for Factors
 Kamla-Raj 2012 J Soc Sci, 31(2): 177-185 (2012) Unemployment in Limpopo Province in South Africa: Searching for Factors K. A. Kyei * and K. B. Gyekye ** Department of Statistics, University of Venda, Private