Young People in South Africa
|
|
|
- Jennifer Hill
- 6 years ago
- Views:
Transcription
1 Young People in South Africa 19 June 2015 Risenga Maluleke DDG: Statistical Collections and Outreach Statistics South Africa
2 Outline of Presentation Stats SA Macro Trends in Economy South African Income Distribution Education Employment


3 Put use at the centre S Statistics are numerical facts for statecraft Use T Transparency is a pre-audit to ensure predictability T R A Accountability is taking responsibility and accepting consequences Results allow parties to read the same facts Transformation is action in unison to drive change for the better


4 Invest in learning and growth Businesses processes Statistical products In space Outcome: Evidence for decisions What is our path Strategy map Increased use of statistical information as evidence in: Planning Policy development Monitoring & Evaluation Decisionmaking Finance Manufacturing Mining Employment Trade Population Utilities Agriculture Transport Construction Education Service Delivery Dwelling Frame Statistical production Stakeholder management Governance & Administration Organisation Technology & Infrastructure People
5 Macro Trends in SA Economy
6 Q1_2008 Q2_2008 Q3_2008 Q4_2008 Q1_2009 Q2_2009 Q3_2009 Q4_2009 Q1_2010 Q2_2010 Q3_2010 Q4_2010 Q1_2011 Q2_2011 Q3_2011 Q4_2011 Q1_2012 Q2_2012 Q3_2012 Q4_2012 Q1_2013 Q2_2013 Q3_2013 Q4_2013 Q1_2014 Q2_2014 Q3_2014 Q4_ The Economy is Rebounding but at a pace that is not only too slow but too low to keep up with current and future demands especially economic redress. Mining (the blue graph) especially is volatile with deeper downward strokes Total Value Added at 2010 prices in Primary Sector, 2010=100 Total Value Added at 2010 prices in Secondary Sector, 2010=100 Total Value Added at 2010 prices in Tertiary Sector, 2010=100 Total Value Added at 2010 prices, 2010=100
7 Q1_2008 Q2_2008 Q3_2008 Q4_2008 Q1_2009 Q2_2009 Q3_2009 Q4_2009 Q1_2010 Q2_2010 Q3_2010 Q4_2010 Q1_2011 Q2_2011 Q3_2011 Q4_2011 Q1_2012 Q2_2012 Q3_2012 Q4_2012 Q1_2013 Q2_2013 Q3_2013 Q4_2013 Q1_2014 Q2_2014 Q3_2014 Q4_ Employability is Making Steady Comeback to almost 15 million employed currently from 2010 where almost a million jobs were lost between then and But youth unemployment remains 75% of total unemployment shown in subsequent slides Employment in Primary Sector, 2010=100 Employment in Secondary Sector, 2010=100 Employment in Tertiary Sector, 2010=100 Total Employment, 2010=100
8 Q1_2008 Q2_2008 Q3_2008 Q4_2008 Q1_2009 Q2_2009 Q3_2009 Q4_2009 Q1_2010 Q2_2010 Q3_2010 Q4_2010 Q1_2011 Q2_2011 Q3_2011 Q4_2011 Q1_2012 Q2_2012 Q3_2012 Q4_2012 Q1_2013 Q2_2013 Q3_2013 Q4_2013 Q1_2014 Q2_2014 Q3_2014 Q4_ Employee Remuneration is Resilient and on an upward trend across all sectors, yet restive industrial and labour relations persist Employee Compensation in Primary Sector at 2010 prices, 2010=100 Employee Compensation in Secondary Sector at 2010 prices, 2010=100 Employee Compensation in Tertiary Sector at 2010 prices, 2010=100 Total Employee Compensation at 2010 prices, 2010=100
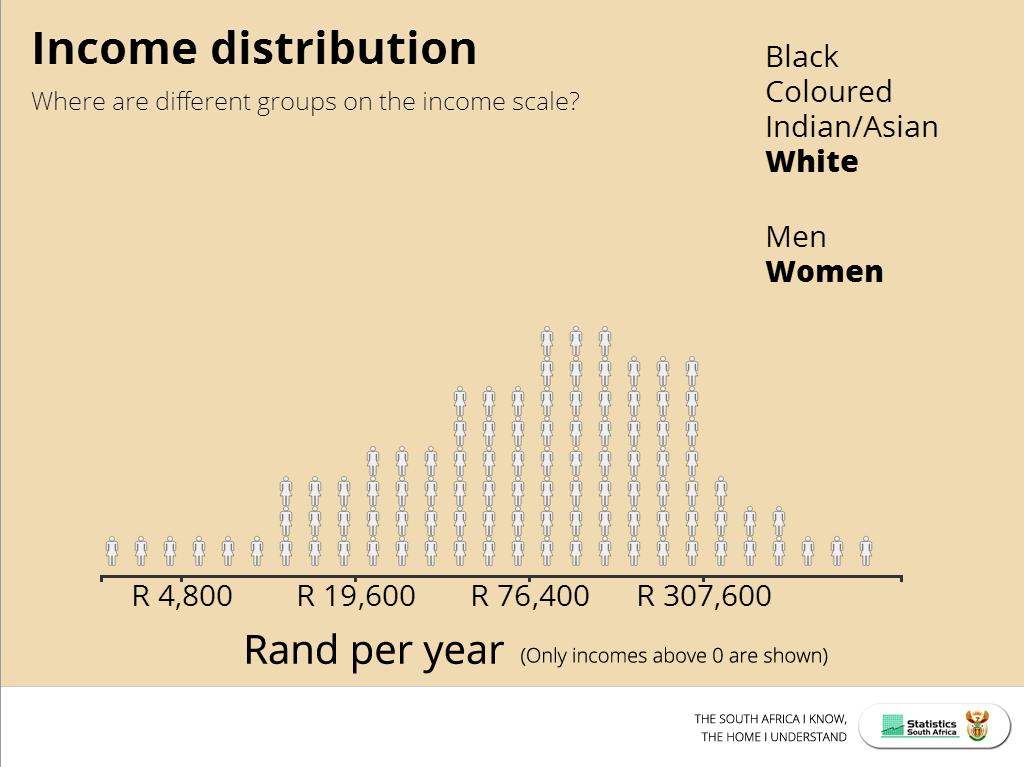
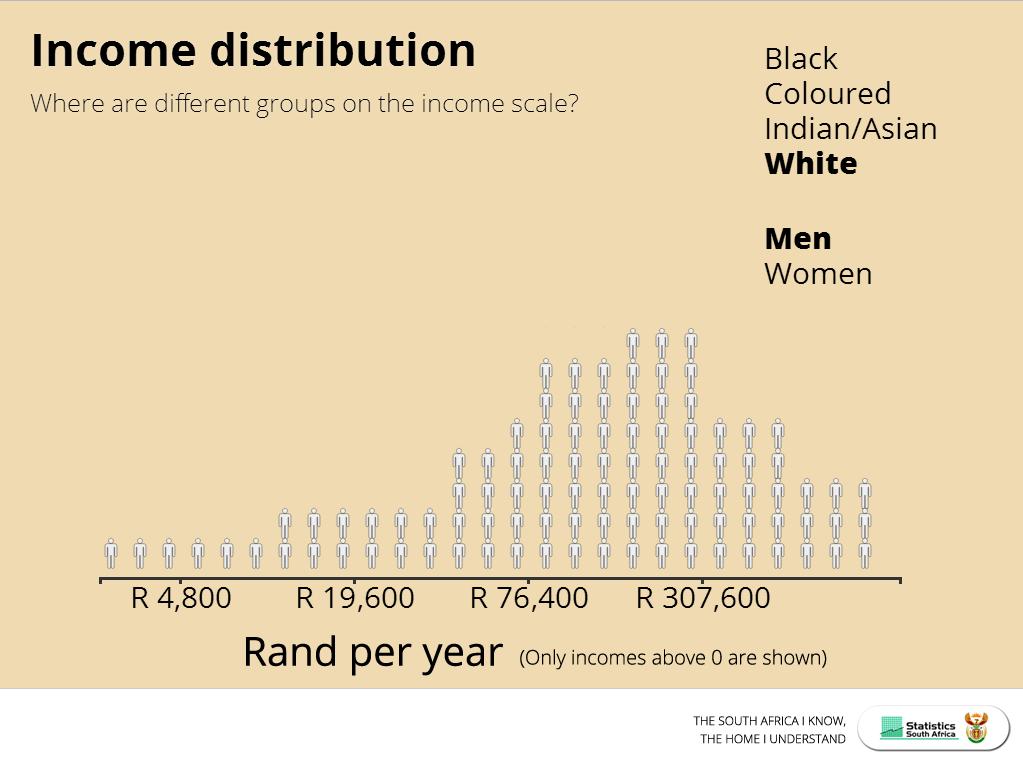
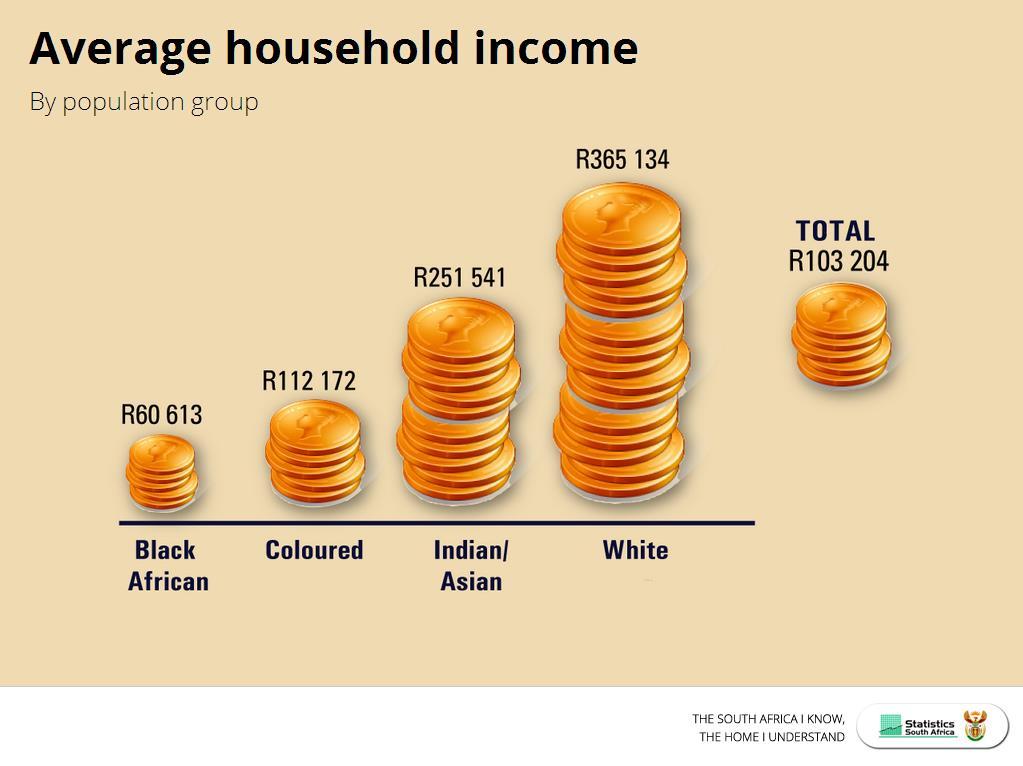
9 SA Income Distribution
10
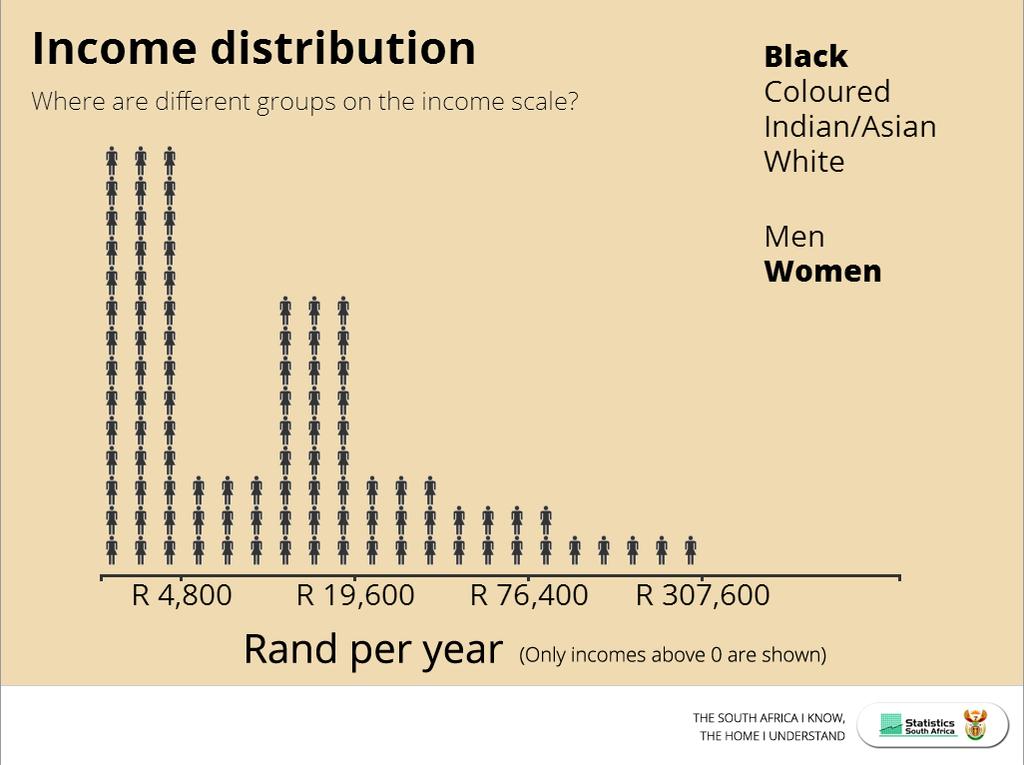
11
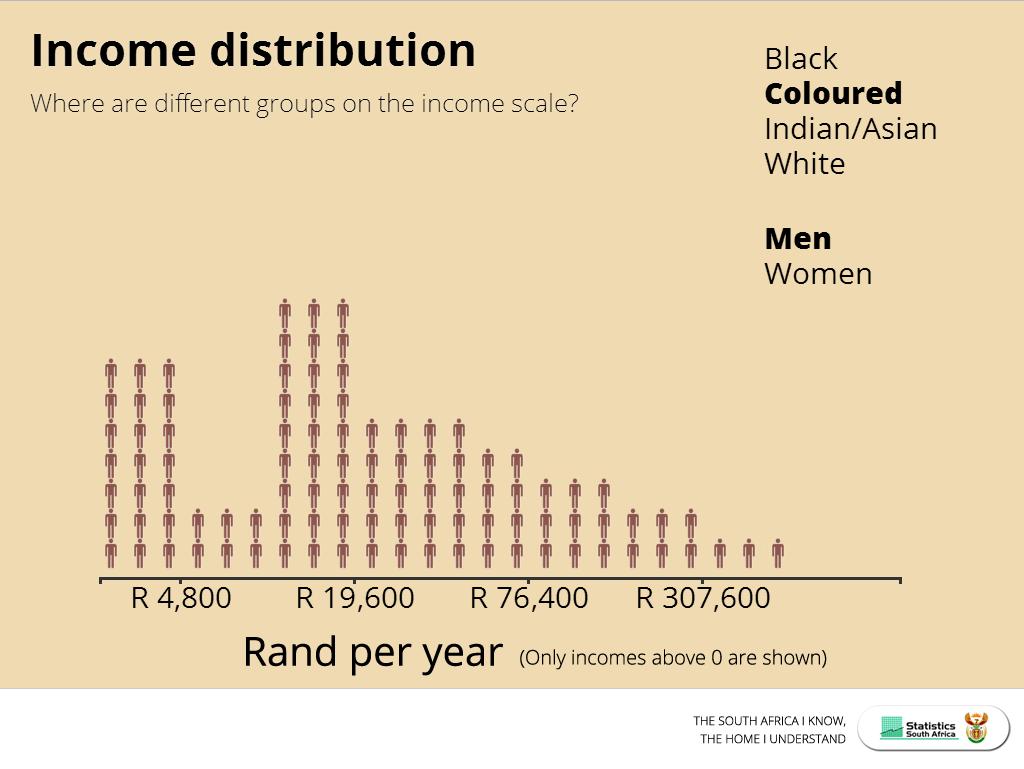
12
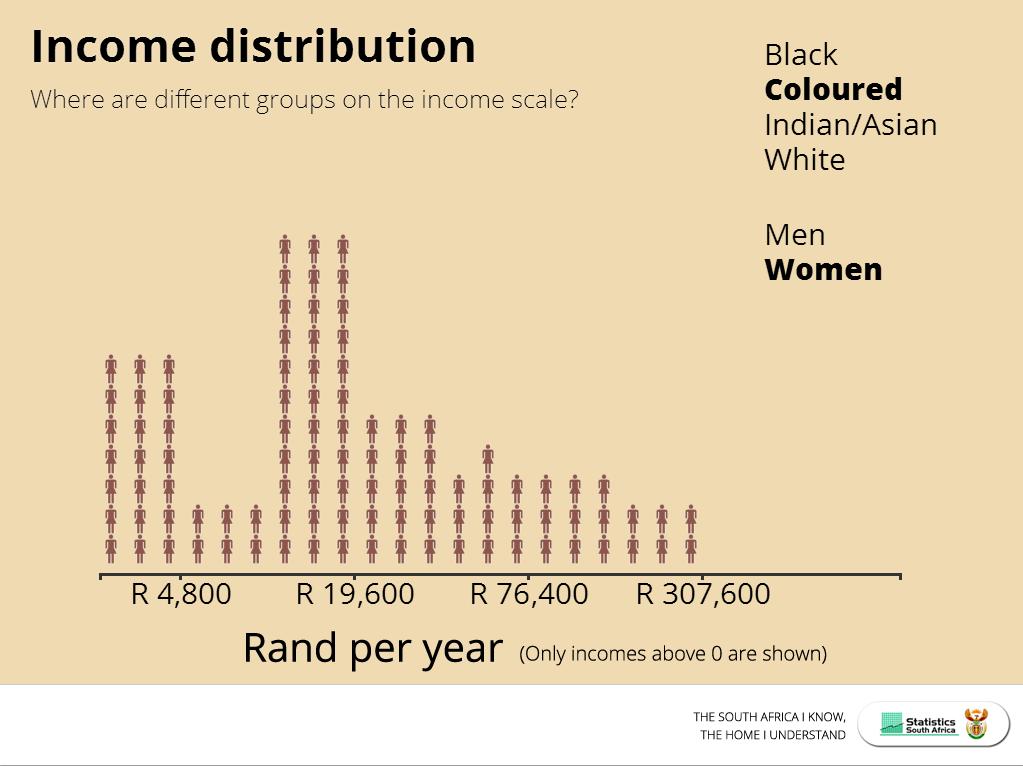
13
14
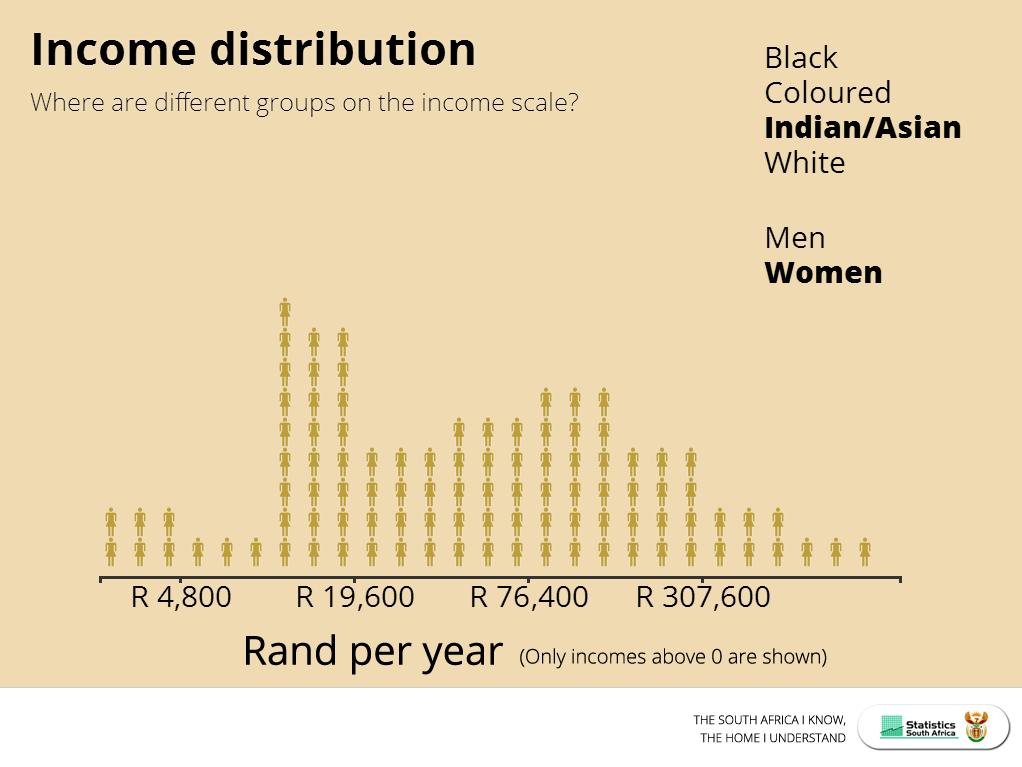
15
16
17
18
19 Education


20 Reasons provided why 7-18 years olds are not attending school, % of Females stated family commitments against less 1% for Males

21 Percentage of persons aged 18 to 29 attending university by population group 2,8% 3,4% 12,7% 15,6% 2002 Black African Coloured Indian / Asian White 3,4% 3,0% 13,1% 23,3% 2014 The percentage of Blacks and Coloureds at tertiary between 2002 and 2014 hardly changed
22 No income Education level zero income, age & level of education 80% 70% 60% No schooling 50% 40% 30% 20% 10% Age Grade 11 Grade 12 Diploma Bachelors degree
23 Employment Trends in terms of age Adults and Youth

24 What is the labour market? Total population All ages ILO hierarchy Employed first then unemployed and the remainder is NEA. 3 mutually exclusive groups. Cannot be in two groups at the same time Labour market yrs Working age yrs 1.Employed Not employed 2. Unemployed 3. Not economically active (including discouraged job-seekers) THE SOUTH AFRICA I KNOW, THE HOME I UNDERSTAND


25 Working age population by Q1:2015 Youth 19,7 million ( yrs) 35,8 million people of working age in South Africa (15 64 yrs) Adults 16,1 million (35-64 yrs) 9,9 million Labour force 6,3 million Employed Youth unemployment almost twice as large as adult unemployment 11,1 million Labour force 9,2 million Employed 3,6 million Unemployed 9,8 million Not economically active 2,4 million Discouraged 1,5 million Youth 866 thousand Adults 1,9 million Unemployed 5,0 million Not economically active 25
26 Employment Annual change in employment among youth and adults Thousand Youth Adults Job losses of 221 thousand among youth Job gains of 1,2 million among adults Youth employment (brown bars) show volatile movements Compared to adult employment (blue line graph)
27 Black African Coloured Indian White Percentage of workers in each age group who are skilled (managers, professionals, technicians) The There percentage were much of workers weaker in skilled occupations gains in the increased black African in all age and all race group groups, for all except ages for black Africans aged, which decreased as shown by the blue on % 10% 20% 30% 40% 50% 60% 70% 80%


28 Skills development challenges in South Africa Low-skilled Total Semi-skilled Total Skilled Total 43,0 34,1 52,6 42,9 47,6 40,2 39,8 31,5 37,8 30,9 57,6 35,5 41,9 48,0 36,0 37,8 40,0 40,2 43,8 47,2 44,7 53,8 33,2 54,5 15,1 17,9 11,3 19,3 12,3 19,6 16,4 21,4 17,5 15,2 9,3 10,0 African Change 0,0 10,0 20,0 30,0 40,0 50,0 60,0 70,0-8,9-9,7-7,4-8,3-6,9-22,1 6,0 1,8 0,2 3,4 9,1 21,3 2,9 8,0 7,3 5,0-2,3 0,7 Low-skilled Total Semi-skilled Total Skilled Total % 34,9 29,3 46,3 32,1 36,5 32,6 31,4 27,6 32,2 23,0 41,0 41,2 53,5 48,2 47,7 41,3 51,8 41,8 55,4 47,5 54,0 55,3 52,4 50,1 11,6 22,5 6,0 26,6 11,7 25,5 13,3 24,9 13,8 21,7 6,6 8,8 Coloured Change 0,0 10,0 20,0 30,0 40,0 50,0 60,0 70,0-5,6-14,3-3,9-3,7-9,2 0,2-5,2-6,3-9,9-7,9 1,3-2,4 10,9 20,6 13,9 11,6 7,9 2,2 Low-skilled Total Semi-skilled Total Skilled Total % 6,7 6,6 7,0 1,4 8,6 11,6 7,0 4,7 5,3 5,4 7,1 11,2 68,0 42,7 67,3 42,4 59,4 37,2 66,8 43,7 68,6 40,3 75,8 61,3 25,2 50,7 25,7 56,2 31,9 51,2 26,1 51,7 26,2 54,4 17,1 27,5 Indian Change 0,0 10,0 20,0 30,0 40,0 50,0 60,0 70,0-0,1-5,6 3,0-2,3 0,1 4,0-25,4-24,9-22,2-23,2-28,3-14,5 25,5 30,6 19,3 25,5 28,2 10,4 Low-skilled Total Semi-skilled Total Skilled Total % 2,9 2,7 4,3 2,3 3,5 3,1 2,0 2,3 2,6 1,5 3,3 6,7 54,9 35,8 53,6 32,5 46,7 34,8 50,4 29,8 56,8 34,7 72,2 64,5 42,2 61,5 42,1 65,2 49,9 62,0 47,7 67,9 40,6 63,8 24,5 28,8 White Change 0,0 10,0 20,0 30,0 40,0 50,0 60,0 70,0-0,1-2,0-0,3 0,3-1,1 3,4-19,1-21,1-11,9-20,6-22,1-7,7 19,3 23,1 12,2 20,3 23,2 4,3
29 Ndza Khensa!
Quarterly Labour Force Survey Q1:2018
 Quarterly Labour Force Survey Q1:2018 Faizel Mohammed Stats SA discouraged work seekers The labour market Q1:2018 37,7 million People of working age in South Africa (15 64 year olds) Labour force 22,4
Monitoring the Performance of the South African Labour Market
 Monitoring the Performance of the South African Labour Market An overview of the South African labour market for the Year Ending 2012 8 October 2012 Contents Recent labour market trends... 2 A labour market
Monitoring the Performance of the South African Labour Market
 Monitoring the Performance of the South African Labour Market An overview of the South African labour market from 1 of 2009 to of 2010 August 2010 Contents Recent labour market trends... 2 A brief labour
Monitoring the Performance of the South African Labour Market
 Monitoring the Performance of the South African Labour Market An overview of the South African labour market for the Year ending 2011 5 May 2012 Contents Recent labour market trends... 2 A labour market
Quarterly Labour Force Survey Q3:2017
 Quarterly Labour Force Survey Q3:2017 Dr Pali Lehohla Statistician-General #StatsSA South African Labour Market: Current state vs NDP target South African Labour Market: Current state vs NDP target Unemployment
Labour. Labour market dynamics in South Africa, statistics STATS SA STATISTICS SOUTH AFRICA
 Labour statistics Labour market dynamics in South Africa, 2017 STATS SA STATISTICS SOUTH AFRICA Labour Market Dynamics in South Africa 2017 Report No. 02-11-02 (2017) Risenga Maluleke Statistician-General
Monitoring the Performance
 Monitoring the Performance of the South African Labour Market An overview of the Sector from 2014 Quarter 1 to 2017 Quarter 1 Factsheet 19 November 2017 South Africa s Sector Government broadly defined
Monitoring the Performance of the South African Labour Market
 Monitoring the Performance of the South African Labour Market An overview of the South African labour market from 3 of 2010 to of 2011 September 2011 Contents Recent labour market trends... 2 A brief labour
Monitoring the Performance of the South African Labour Market
 Monitoring the Performance of the South African Labour Market An overview of the South African labour market for the Year Ending 2012 6 June 2012 Contents Recent labour market trends... 2 A labour market
Monitoring the Performance of the South African Labour Market
 Monitoring the Performance of the South African Labour Market An overview of the South African labour market for the Year Ending 2016 14 July 2016 Contents Recent labour market trends... 2 A labour market
Labour force survey. September Embargoed until: 29 March :30
 Statistical release P0210 Labour force survey September 2006 Embargoed until: 29 March 2007 12:30 Enquiries: Forthcoming issue: Expected release date User Information Services LFS March 2007 September
Discussion paper 1 Comparative labour statistics Labour force survey: first round pilot February 2000
 Discussion paper 1 Comparative labour statistics Labour force survey: first round pilot February 2000 Statistics South Africa 27 March 2001 DISCUSSION PAPER 1: COMPARATIVE LABOUR STATISTICS LABOUR FORCE
Quarterly Labour Force Survey
 Statistical release Quarterly Labour Force Survey Quarter 4: Embargoed until: 14 February 2017 10:30 ENQUIRIES: FORTHCOMING ISSUE: EXPECTED RELEASE DATE User Information Services Quarter 1:2017 May 2017
The 5 th South African Employment report
 The 5 th South African Employment report The effect of education and skills and self employment on employment. The 5 th South African Employment Report Bragging a little SAER Salary and employment trends.
Discussion paper 1 Comparative labour statistics Labour force survey: first round pilot February 2000
 Discussion paper 1 Comparative labour statistics Labour force survey: first round pilot February 2000 Statistics South Africa 27 March 2001 DISCUSSION PAPER 1: COMPARATIVE LABOUR STATISTICS LABOUR FORCE
Quarterly Labour Force Survey
 Statistical release P0211 Quarterly Labour Force Survey Quarter 2, 2014 Embargoed until: 29 July 2014 13:00 Enquiries: Forthcoming issue: Expected release date User Information Services Quarter 3, 2014
Commission District 4 Census Data Aggregation
 Commission District 4 Census Data Aggregation 2011-2015 American Community Survey Data, U.S. Census Bureau Table 1 (page 2) Table 2 (page 2) Table 3 (page 3) Table 4 (page 4) Table 5 (page 4) Table 6 (page
Dennis Essers. Institute of Development Management and Policy (IOB) University of Antwerp
 University of Antwerp") South African labour market transitions during the global financial and economic crisis: Micro-level evidence from the NIDS panel and matched QLFS cross-sections Dennis Essers Institute of Development
South African labour market transitions during the global financial and economic crisis: Micro-level evidence from the NIDS panel and matched QLFS cross-sections Dennis Essers Institute of Development
Executive summary WORLD EMPLOYMENT SOCIAL OUTLOOK
 Executive summary WORLD EMPLOYMENT SOCIAL OUTLOOK TRENDS 2018 Global economic growth has rebounded and is expected to remain stable but low Global economic growth increased to 3.6 per cent in 2017, after
Northwest Census Data Aggregation
 Northwest Census Data Aggregation 2011-2015 American Community Survey Data, U.S. Census Bureau Table 1 (page 2) Table 2 (page 2) Table 3 (page 3) Table 4 (page 4) Table 5 (page 4) Table 6 (page 5) Table
Riverview Census Data Aggregation
 Riverview Census Data Aggregation 2011-2015 American Community Survey Data, U.S. Census Bureau Table 1 (page 2) Table 2 (page 2) Table 3 (page 3) Table 4 (page 4) Table 5 (page 4) Table 6 (page 5) Table
Zipe Code Census Data Aggregation
 Zipe Code 66101 Census Data Aggregation 2011-2015 American Community Survey Data, U.S. Census Bureau Table 1 (page 2) Table 2 (page 2) Table 3 (page 3) Table 4 (page 4) Table 5 (page 4) Table 6 (page 5)
Zipe Code Census Data Aggregation
 Zipe Code 66103 Census Data Aggregation 2011-2015 American Community Survey Data, U.S. Census Bureau Table 1 (page 2) Table 2 (page 2) Table 3 (page 3) Table 4 (page 4) Table 5 (page 4) Table 6 (page 5)
newstats 2016 NWT Annual Labour Force Activity NWT Bureau of Statistics Overview
 newstats NWT Bureau of Statistics Released: March 27, 2017 2016 NWT Annual Labour Force Activity Overview The Labour Force Survey is a source of monthly estimates of employment and unemployment. On a yearly
Preliminary Report of the Labour Force Survey 2014
 Background The Department of Economic Planning and Development (JPKE), Prime Minister s Office, in collaboration with the International Labour Organisation (ILO) conducted the Labour Force Survey (LFS)
Average persons in household. Top three industries Post-secondary education (25 64 years) 7.1% Unemployment rate
 7.1% Unemployment rate") Demographic snapshot The Town of Oakville City of Burl ington City of Mis sissauga Town of Milton Population 198,042 Median age Average persons in household 41 2.8 years old $149,945 Average household
Demographic snapshot The Town of Oakville City of Burl ington City of Mis sissauga Town of Milton Population 198,042 Median age Average persons in household 41 2.8 years old $149,945 Average household
SERBIA. SWTS country brief. December Main findings of the ILO SWTS
 SERBIA SWTS country brief December 2016 The ILO Work4Youth project worked with the Statistical Office of the Republic of Serbia to implement the School-towork transition survey (SWTS) in 2015 (March April).The
LEBANON. SWTS country brief. December Main findings of the ILO SWTS
 LEBANON SWTS country brief December 2016 The ILO Work4Youth project worked with the Consultation and Research Institute of Lebanon to implement the School-to-work transition survey (SWTS) from November
YOUTH EMPOWERMENT ORGANISATION APPLICATION FOR STUDY FUND: 2018
 -1- YOUTH EMPOWERMENT ORGANISATION APPLICATION FOR STUDY FUND: 2018 PART 1 APPLICATION DETAILS STUDY FUND Student Number (If available) University intended to study (Attach proof of admission letter) Discipline/Qualification,
City of Edmonton Population Change by Age,
 Population Change by Age, 1996-2001 2001 Edmonton Demographic Profile The City of Edmonton s 2001population increased by 49,800 since the 1996 census. Migration figures are not available at the municipal
Women in the South African Labour Market
 Women in the South African Labour Market 1995-2005 Carlene van der Westhuizen Sumayya Goga Morné Oosthuizen Carlene.VanDerWesthuizen@uct.ac.za Development Policy Research Unit DPRU Working Paper 07/118
Labour force survey February 2001
 Statistical release P0210 Labour force survey February 2001 Co-operation between Statistics South Africa (Stats SA), the citizens of the country, the private sector and government institutions is essential
RESULTS OF THE KOSOVO 2015 LABOUR FORCE SURVEY JUNE Public Disclosure Authorized. Public Disclosure Authorized. Public Disclosure Authorized
 Public Disclosure Authorized Public Disclosure Authorized Public Disclosure Authorized Public Disclosure Authorized RESULTS OF THE KOSOVO 2015 LABOUR FORCE SURVEY JUNE 2016 Kosovo Agency of Statistics
LABOUR MARKET PROVINCIAL 51.6 % 48.4 % Unemployed Discouraged work-seekers % 71.8 % QUARTERLY DATA SERIES
 QUARTERLY DATA SERIES ISSUE 7 November 2016 PROVINCIAL LABOUR MARKET introduction introduction The Eastern Cape Quarterly Review of Labour Markets is a statistical release compiled by the Eastern Cape
MONTENEGRO. SWTS country brief. December Main findings of the ILO SWTS
 MONTENEGRO SWTS country brief December 2016 The ILO Work4Youth project worked with the Statistical Office of Montenegro to implement the School-to-work transition survey (SWTS) in 2015 (September October).
Minnesota Energy Industry
 Energy Industry Jobs Q3 2000 Q3 2001 Q3 2002 Q3 2003 Q3 2004 Q3 2005 Q3 2006 Q3 2007 Q3 2008 Q3 2009 Q3 2010 Q3 2011 Q3 Q3 Q3 Q3 Q3 2016 Minnesota Energy Consortium April 13, 2017 Cameron Macht DEED Labor
REPUBLIC OF MOLDOVA. SWTS country brief. December Main findings of the ILO SWTS
 REPUBLIC OF MOLDOVA SWTS country brief December 2016 The ILO Work4Youth project worked with the National Bureau of Statistics of Moldova to implement two rounds of the School-to-work transition survey
Quarterly Labour Force Survey
 Statistical release P0211 Quarterly Labour Force Survey Quarter 3, Embargoed until: 01 November 11:30 Enquiries: Forthcoming issue: Expected release date User Information Services Quarter 4, February 2012
Quarterly Labour Force Survey
 Statistical release Quarterly Labour Force Survey Quarter 1, Embargoed until: 08 May 11:30 Enquiries: Forthcoming issue: Expected release date User Information Services Quarter 2, July Tel: (012) 310 8600/4892/8390
Economic Overview City of Tyler, TX. January 8, 2018
 Economic Overview City of Tyler, TX January 8, 2018 DEMOGRAPHIC PROFILE...3 EMPLOYMENT TRENDS...5 WAGE TRENDS...5 COST OF LIVING INDEX...6 INDUSTRY SNAPSHOT...7 OCCUPATION SNAPSHOT...9 INDUSTRY CLUSTERS...
Labour force survey September 2003
 Statistical release Labour force survey September 2003 Co-operation between Statistics South Africa (Stats SA), the citizens of the country, the private sector and government institutions is essential
Economic Overview York County, South Carolina. February 14, 2018
 Economic Overview York County, February 14, 2018 DEMOGRAPHIC PROFILE... 3 EMPLOYMENT TRENDS... 5 UNEMPLOYMENT RATE... 5 WAGE TRENDS... 6 COST OF LIVING INDEX... 6 INDUSTRY SNAPSHOT... 7 OCCUPATION SNAPSHOT...
LABOUR FORCE SURVEY 2017 MAIN RESULTS
 LABOUR FORCE SURVEY 2017 MAIN RESULTS In 2017 the number of economically active population aged 15-64 was 3 277.5 thousand and represented 71.3% of population in the same age group. The activity rate (15-64
Labour force, Employment and Unemployment First quarter 2018
 Introduction Labour force, Employment and Unemployment First quarter 2018 1. This issue of Economic and Social Indicators (ESI) presents a set of estimates of labour force, employment and unemployment
2018:IIIQ Nevada Unemployment Rate Demographics Report*
 2018:IIIQ Nevada Unemployment Rate Demographics Report* Department of Employment, Training & Rehabilitation Research and Analysis Bureau Dr. Tiffany Tyler-Garner, Director Dennis Perea, Deputy Director
UNEMPLOYMENT RATES IMPROVING IN THE DISTRICT By Caitlin Biegler
 An Affiliate of the Center on Budget and Policy Priorities 820 First Street NE, Suite 460 Washington, DC 20002 (202) 408-1080 Fax (202) 408-8173 www.dcfpi.org UNEMPLOYMENT RATES IMPROVING IN THE DISTRICT
SWARTLAND SPATIAL DEVELOPMENT FRAMEWORK ADDENDUM F
 SWARTLAND SPATIAL DEVELOPMENT FRAMEWORK ADDENDUM F DEMOGRAPHIC PROFILE 2011 Census APRIL 2014 By CK Rumboll and Partners 1 1. Introduction Swartland Municipality is located on the north western boundary
Labour force, Employment and Unemployment First quarter 2017
 Introduction Labour force, Employment and Unemployment First quarter 2017 1. This issue of Economic and Social Indicators (ESI) presents a set of estimates of labour force, employment and unemployment
October household survey 1999
 Statistical release P0317 October household survey Co-operation between Statistics South Africa (Stats SA), the citizens of the country, the private sector and government institutions is essential for
What does your Community look like and how is it changing?
 What does your Community look like and how is it changing? Trends in the State population related to health and health determinants and where you can find this data to support your local work Who is Likely
JORDAN. SWTS country brief. December Main findings of the ILO SWTS
 JORDAN SWTS country brief December 2016 The ILO Work4Youth project worked with the Department of Statistics of Jordan to implement two rounds of the School-to-work transition survey (SWTS) in 2012 13 (December
Quarterly Labour Force Survey
 Statistical release Quarterly Labour Force Survey Quarter 1, 2014 Embargoed until: 05 May 2014 11:30 Enquiries: Forthcoming issue: Expected release date User Information Services Quarter 2, 2014 July 2014
Rifle city Demographic and Economic Profile
 Rifle city Demographic and Economic Profile Community Quick Facts Population (2014) 9,289 Population Change 2010 to 2014 156 Place Median HH Income (ACS 10-14) $52,539 State Median HH Income (ACS 10-14)
MAIN LABOUR FORCE SURVEY RESULTS FOR THE FOURTH QUARTER OF 2013
 MAIN LABOUR FORCE SURVEY RESULTS FOR THE FOURTH QUARTER OF Main labour market data for the fourth of The activity rate of population aged 15-64 was 68.6%, by 0.7 percentage point higher in comparison with
LAND FOR SALE Blair Road, Mint Hill, NC PROPERTY OVERVIEW. Large parcel with I-485 access via Blair Road exit in the path of. growth.
 LAND FOR SALE 10395 Blair Road, Mint Hill, NC 28227 OFFERING SUMMARY SALE PRICE: $1,000,000 PROPERTY OVERVIEW Large parcel with I485 access via Blair Road exit in the path of growth. LOT SIZE: 9.28 Acres
ECONOMIC OVERVIEW DuPage County, Illinois
 ECONOMIC OVERVIEW DuPage County, Illinois DEMOGRAPHIC PROFILE... 3 EMPLOYMENT TRENDS... 5 UNEMPLOYMENT RATE... 5 WAGE TRENDS... 6 COST OF LIVING INDEX... 7 INDUSTRY SNAPSHOT... 8 OCCUPATION SNAPSHOT...
Annual Financial Results. For the year ended 31 December 2013
 Annual Financial Results For the year ended 31 December 2013 1 Strategic 2 Operations 3 Financial highlights 4 _ Financial analysis 5 Prospects 6 Questions 1 Strategic SA Consumer spending vs disposable
Quarterly Labour Force Survey
 Statistical release Quarterly Labour Force Survey Quarter 3, Embargoed until: 28 October 11:30 Enquiries: Forthcoming issue: Expected release date User Information Services Quarter 4 February 2009 Tel
REGISTRAR S DIVISION EMPLOYMENT EQUITY PLAN AND REPORT
 REGISTRAR S DIVISION EMPLOYMENT EQUITY PLAN AND REPORT 2010-2014 OCTOBER-SEPTEMBER SECTION A: INTRODUCTION AND INSTRUCTIONS The University of KwaZulu-Natal is a public institution with a mission of becoming
THE SUSTAINABLE DEVELOPMENT GOALS AND SOCIAL PROTECTION
 THE SUSTAINABLE DEVELOPMENT GOALS AND SOCIAL PROTECTION Ms Nelisiwe Vilakazi Acting Director General- Ministry of Social Development REPUBLIC OF SOUTH AFRICA Global Practitioners Learning Event Oaxaca,
Economic Overview. Lawrence, KS MSA
 Economic Overview Lawrence, KS MSA March 5, 2019 DEMOGRAPHIC PROFILE... 3 EMPLOYMENT TRENDS... 5 UNEMPLOYMENT RATE... 5 WAGE TRENDS... 6 COST OF LIVING INDEX... 7 INDUSTRY SNAPSHOT... 8 OCCUPATION SNAPSHOT...
MAIN LABOUR FORCE SURVEY RESULTS FOR THE FOURTH QUARTER OF 2014
 MAIN LABOUR FORCE SURVEY RESULTS FOR THE FOURTH QUARTER OF 2014 Main labour market data for the fourth quarter of 2014 The activity rate for population aged 15-64 was 68.8%, by 0.2 percentage point higher
Economics. Unemployment. Labor Force Statistics. In this chapter, look for the answers to these questions: N. Gregory Mankiw
 C H A P T E R 28 Unemployment P R I N C I P L E S O F Economics N. Gregory Mankiw Premium PowerPoint Slides by Ron Cronovich 2009 South-Western, a part of Cengage Learning, all rights reserved In this
Youth unemployment, churn and stalled careers: The UK youth labour market in the 2008/9 recession
 Youth unemployment, churn and stalled careers: The UK youth labour market in the 2008/9 recession Dr Neil Lee Department of Geography & Environment / Centre for the Analysis of Social Exclusion LSE n.d.lee@lse.ac.uk
In South Africa, there is a high priority for regular,
 Applied Development Research Solutions KEY QUESTIONS SKILLS PLANNING SERIES OCTOBER 2016 If the economy follows a low, moderate or high growth path over the next 10 years, what will be the likely impact
Downloads from this web forum are for private, non-commercial use only. Consult the copyright and media usage guidelines on
 Econ 3x3 www.econ3x3.org A web forum for accessible policy-relevant research and expert commentaries on unemployment and employment, income distribution and inclusive growth in South Africa Downloads from
Labor Force Statistics. Unemployment. In this chapter, look for the answers to these questions:
 15 Unemployment P R I N C I P L E S O F MACROECONOMICS FOURTH EDITION N. GREGORY MANKIW Premium PowerPoint Slides by Ron Cronovich 2008 update 2008 South-Western, a part of Cengage Learning, all rights
ANNIVERSARY EDITION. Latin America and the Caribbean EXECUTIVE SUMMARY. Regional Office for Latin America and the Caribbean YEARS
 ANNIVERSARY EDITION Latin America and the Caribbean EXECUTIVE SUMMARY Regional Office for Latin America and the Caribbean YEARS Latin America and the Caribbean YEARS Regional Office for Latin America
4 Emfuleni population and labour force
 Chapter 4 University of Pretoria etd Slabbert, T J C (2004) 4 Emfuleni population and labour force Current status and trends 4.1 Introduction In this chapter, Emfuleni is analysed in terms of its demographics
PROPOSED SHOPPING CENTER
 PROPOSED SHOPPING CENTER Southeast Corner I-95 & Highway 192 Melbourne, Florida In a 5 Mile Radius 80,862 Population 32,408 Households $61K Avg HH Income SOONER INVESTMENT Commercial & Investment Real
Tyler Area Economic Overview
 Tyler Area Economic Overview Demographic Profile. 2 Unemployment Rate. 4 Wage Trends. 4 Cost of Living Index...... 5 Industry Clusters. 5 Occupation Snapshot. 6 Education Levels 7 Gross Domestic Product
LABOUR MARKET PROVINCIAL 54.3 % 45.7 % Unemployed Discouraged work-seekers % 71.4 % QUARTERLY DATA SERIES
 QUARTERLY DATA SERIES ISSUE 6 October 2016 PROVINCIAL LABOUR MARKET introduction introduction The Eastern Cape Quarterly Review of Labour Markets is a statistical release compiled by the Eastern Cape Socio
Labour Market: Analysis of the NIDS Wave 1 Dataset
 Labour Market: Analysis of the NIDS Wave 1 Dataset Discussion Paper no. 12 Vimal Ranchod Southern African Labour & Development Research Unit vimal.ranchhod@gmail.com July 2009 1. Introduction The purpose
Who cares about regional data?
 Who cares about regional data? Development happens somewhere - in a spatial locality. Aggregations hide [important] variety in the data Within South Africa: KwaZulu-Natal is not like the Western Cape Within
The South African labour market: Stellenbosch Economic Working Papers: 05/08
 The South African labour market: 1995 2006 DEREK YU Stellenbosch Economic Working Papers: 05/08 KEYWORDS: SOUTH AFRICA, HOUSEHOLD SURVEY, LABOUR MARKET TRENDS JEL: J00 DEREK YU DEPARTMENT OF ECONOMICS
IND (1) * = Mandatory Field (must not be left blank) SICAP IRIS: INDIVIDUAL BENEFICIARY TEMPLATE: V7 ( ) 1.
 * = Mandatory Field (must not be left blank) SICAP IRIS: INDIVIDUAL BENEFICIARY TEMPLATE: V7 ( ) 1.") IND (1) 1. PERSONAL DETAILS File Status: Dormant Open Closed PI Ref: Lot*: (if your PI has more than one Lot insert Lot name for the individual) First Name*: 2. REGISTRATION / CONSENT Date of Registration
IND (1) 1. PERSONAL DETAILS File Status: Dormant Open Closed PI Ref: Lot*: (if your PI has more than one Lot insert Lot name for the individual) First Name*: 2. REGISTRATION / CONSENT Date of Registration
Alberta Labour Force Profiles
 Alberta Labour Force Profiles 2011 Highlights For the purpose of this profile, youth are defined as persons aged 15 to 24 years. 1. Alberta Population Statistics Among the provinces, Alberta had the third
MALAWI. SWTS country brief October Main findings of the ILO SWTS
 MALAWI SWTS country brief October 2015 The ILO Work4Youth project worked with the National Statistical Office of Malawi to implement two rounds of the School-to-work transition survey (SWTS) in 2012 (August
MAIN LABOUR FORCE SURVEY RESULTS FOR THE FIRST QUARTER OF 2017
 MAN LABOUR FORCE SURVEY RESULTS FOR THE FRST QUARTER OF 2017 Main labour market indicators for the first quarter of 2017 The activity rate for population aged 15-64 was 69.2%, by 0.9 percentage points
Department of Employment Overview of the
 Slide 1 Department of Employment Overview of the Ballarat region labour market June 13 2014 Department of Employment Overview of the Ballarat region Labour Market June 13 2014 (surveyed November 2013)
ZAMBIA. SWTS country brief January Main findings of the ILO SWTS
 ZAMBIA SWTS country brief January 2017 The ILO Work4Youth project worked with IPSOS Zambia to implement two rounds of the School-to-work transition survey (SWTS) in late 2012 and 2014. The results of the
INSIGHT PAPER. Analysis of GASTAT Labour Force Survey Q TA KA MOL A D VISORY U N IT 2018
 INSIGHT PAPER Analysis of GASTAT Labour Force Survey Q1 2018 TA KA MOL A D VISORY U N IT 2018 2018 INSIGHT PAPER Analysis of GASTAT Labour Force Survey Q1 2018 February 2017 INSIGHT PAPER Fiscal and Economic
In 2012, according to the U.S. Census Bureau, about. A Profile of the Working Poor, Highlights CONTENTS U.S. BUREAU OF LABOR STATISTICS
 U.S. BUREAU OF LABOR STATISTICS M A R C H 2 0 1 4 R E P O R T 1 0 4 7 A Profile of the Working Poor, 2012 Highlights Following are additional highlights from the 2012 data: Full-time workers were considerably
The Case 0f Sri Lanka
 The Case 0f Sri Lanka Ganga Tilakaratna Research Fellow Institute of Policy Studies of Sri Lanka Youth Bulge in Sri Lanka Outline Youth Employment and Unemployment : Current Status Youth Employment: Key
Economic Overview Monterey County, California. July 22, 2016
 Economic Overview Monterey July 22, 2016 DEMOGRAPHIC PROFILE... 3 EMPLOYMENT TRENDS... 5 UNEMPLOYMENT RATE... 5 WAGE TRENDS... 6 COST OF LIVING INDEX... 6 INDUSTRY SNAPSHOT... 7 OCCUPATION SNAPSHOT...
2018 BURSARY APPLICATION
 2018 BURSARY APPLICATION General Guidelines The completed application form must be submitted on or before 20 October 2017. In order for your application to be processed, please ensure that you complete
DEMOGRAPHIC PROFILE...3 EMPLOYMENT TRENDS...5 UNEMPLOYMENT RATE...5 WAGE TRENDS...6 COST OF LIVING INDEX...6 INDUSTRY SNAPSHOT...7
 March 14, 2017 DEMOGRAPHIC PROFILE...3 EMPLOYMENT TRENDS...5 UNEMPLOYMENT RATE...5 WAGE TRENDS...6 COST OF LIVING INDEX...6 INDUSTRY SNAPSHOT...7 OCCUPATION SNAPSHOT...9 INDUSTRY CLUSTERS... 12 EDUCATION
Economic Overview Loudoun County, Virginia. October 23, 2017
 Economic Overview October 23, 2017 DEMOGRAPHIC PROFILE... 3 EMPLOYMENT TRENDS... 5 UNEMPLOYMENT RATE... 5 WAGE TRENDS... 6 COST OF LIVING INDEX... 6 INDUSTRY SNAPSHOT... 7 OCCUPATION SNAPSHOT... 9 INDUSTRY
Economic Overview Long Island
 Report created on August 29, 2017 Economic Overview Long Island Contact: Lisa.Montiel@suny.edu DEMOGRAPHIC PROFILE... 3 EMPLOYMENT TRENDS... 5 UNEMPLOYMENT RATE... 5 WAGE TRENDS... 6 COST OF LIVING INDEX...
October 28, Economic Overview Yellowstone County, Montana
 October 28, 2016 Economic Overview Yellowstone DEMOGRAPHIC PROFILE...3 EMPLOYMENT TRENDS...5 UNEMPLOYMENT RATE...5 WAGE TRENDS...6 COST OF LIVING INDEX...6 INDUSTRY SNAPSHOT...7 OCCUPATION SNAPSHOT...9
Stockport (Local Authority)
") Population Brinnington & Central (Ward) All Usual Residents (Count) 14999 Area (Hectares) (Count) 527 Females (Count) 7316 Females (Percentage) 48.8 Males (Count) 7683 Males (Percentage) 51.2 Dataset:
Population Brinnington & Central (Ward) All Usual Residents (Count) 14999 Area (Hectares) (Count) 527 Females (Count) 7316 Females (Percentage) 48.8 Males (Count) 7683 Males (Percentage) 51.2 Dataset:
Economic Overview Western New York
 Report created on August 29, 2017 Economic Overview Western New Contact: Lisa.Montiel@suny.edu DEMOGRAPHIC PROFILE... 3 EMPLOYMENT TRENDS... 5 UNEMPLOYMENT RATE... 5 WAGE TRENDS... 6 COST OF LIVING INDEX...
Town Profiles: Demographic, Economic, and Housing Statistics for De Smet City and Wall Town, SOuth Dakota
 South Dakota State University Open PRAIRIE: Open Public Research Access Institutional Repository and Information Exchange Census Data Center News Releases SDSU Census Data Center 12-7-2017 Town Profiles:
Economic Overview Fairfax / Falls Church. October 23, 2017
 Economic Overview Fairfax / Falls Church October 23, 2017 DEMOGRAPHIC PROFILE... 3 EMPLOYMENT TRENDS... 5 UNEMPLOYMENT RATE... 5 WAGE TRENDS... 6 COST OF LIVING INDEX... 6 INDUSTRY SNAPSHOT... 7 OCCUPATION
Facts about Women and Men in Great Britain EQUAL OPPORTUNITIES COMMISSION
 Facts about and in Great Britain 2001 EQUAL OPPORTUNITIES COMMISSION and in Great Britain... Education and Training In their last year of compulsory education, 55 per cent of girls and 44 per cent of boys
What has happened to inequality and poverty in post-apartheid South Africa. Dr Max Price Vice Chancellor University of Cape Town
 What has happened to inequality and poverty in post-apartheid South Africa Dr Max Price Vice Chancellor University of Cape Town OUTLINE Examine trends post-apartheid (since 1994) Income inequality Overall,
Economic Overview Capital District
 August 29, 2017 Economic Overview Capital District Contact: Lisa.Montiel@suny.edu DEMOGRAPHIC PROFILE... 3 EMPLOYMENT TRENDS... 5 UNEMPLOYMENT RATE... 5 WAGE TRENDS... 6 COST OF LIVING INDEX... 6 INDUSTRY
MAIN LABOUR FORCE SURVEY RESULTS FOR THE THIRD QUARTER OF 2018
 MAIN LABOUR FORCE SURVEY RESULTS FOR THE THIRD QUARTER OF 2018 Main labour market indicators for the third quarter of 2018 The activity rate for population aged 15-64 was 72.5%, by 0.3 percentage points
Labour force survey March 2003
 Statistical release P0210 Labour force survey March 2003 Co-operation between Statistics South Africa (Stats SA), the citizens of the country, the private sector and government institutions is essential
Downloads from this web forum are for private, non-commercial use only. Consult the copyright and media usage guidelines on
 Econ 3x3 www.econ3x3.org A web forum for accessible policy-relevant research and expert commentaries on unemployment and employment, income distribution and inclusive growth in South Africa Downloads from