The Role of Economic, Fiscal, and Financial Shocks in the Evolution of Public Sector Pension Funding
|
|
|
- Abigayle Harmon
- 6 years ago
- Views:
Transcription
1 No The Role of Economic, Fiscal, and Financial Shocks in the Evolution of Public Sector Pension Funding Robert K. Triest and Bo Zhao Abstract: Many studies have documented the pervasive underfunding of public sector pension plans in the United States in recent years. The deterioration of the funded status of public pension plans coincided with severe fiscal crises that state and local governments experienced in the 2000s. This development has led to a suspicion that state and local governments have decreased employer pension contributions as a backdoor means of running fiscal deficits. In this paper, the authors investigate the extent to which this phenomenon has occurred. They estimate panel data regressions using the Boston College Center for Retirement Research s Public Plans Database, which provides data for 2001 through The authors find that contrary to popular belief, plan sponsors do not reduce their contributions in response to negative fiscal or economic shocks. In contrast, plan sponsors contributions to their pension plans increase in response to growth in their unfunded liabilities. The authors document that the public pension underfunding crisis during the 2000s developed largely as a consequence of portfolio returns that fell short of expectations. Public pension plans assets portfolios have a relatively high share of equities and other risky assets, leaving the plans funded status vulnerable to asset price fluctuations. Although plan sponsors increased their contributions in response to the growth of unfunded liabilities, they did not do so by enough to fully counteract the effect of the subpar portfolio returns. This finding holds across the spectrum of plans ranked in terms of funded status in JEL Classifications: H75, H72, G11 Robert K. Triest is a vice president in the research department at the Federal Reserve Bank of Boston. His address is robert.triest@bos.frb.org. Bo Zhao is a senior economist in the New England Public Policy Center, housed in the research department at the Federal Reserve Bank of Boston. His address is bo.zhao@bos.frb.org. The authors thank Don Boyd, Suritha Bagchi, Yolanda Kodrzycki, Anil Kumar, Greg Mennis, Travis St. Clair, and participants at several conferences for helpful comments and suggestions. David Coyne and Jingyi Huang provided expert research assistance. This paper presents preliminary analysis and results intended to stimulate discussion and critical comment. The views expressed herein are those of the authors and do not indicate concurrence by the Federal Reserve Bank of Boston, or by the principals of the Board of Governors, or the Federal Reserve System. This paper, which may be revised, is available on the web site of the Federal Reserve Bank of Boston at This version: December 27, 2013
2 I. Introduction The funding of U.S. state and local public sector pension plans has become a controversial and contentious public policy issue in recent years. Numerous studies have documented the deteriorating condition of public sector pension funding during the first decade of the twenty-first century, prompting a concern that unfunded pension liabilities could cause widespread fiscal stress for the state and local governments that sponsor these plans. Some of these concerns seem to have been borne out in recent municipal bankruptcies, where unfunded pension liabilities played a role similar to that of municipal bond debt by adding a fixed component to government expenditures that became difficult for struggling municipal governments to finance as tax bases deteriorated in the aftermath of the Great Recession. State constitutions generally mandate that operating budgets be balanced, with debt issued only to finance capital projects. However, underfunded public pensions are somewhat analogous to the debt that accumulates from operating deficits. Pensions are a form of deferred employee compensation, and a failure to fully fund pension liabilities as these obligations accrue is equivalent to not fully covering the labor cost component of the operating budget with current year revenue. Thus, the unfunded component of pension liabilities is a form of implicit debt. The emergence of a growing volume of implicit state and local pension debt suggests the possibility that state and local governments may have been running implicit operating deficits by underfunding the pension plans that they sponsored. Underfunding of public pensions could be used strategically as a means of circumventing restrictions on the issuance of explicit government debt to finance operating deficits. However, the existence of substantial unfunded pension liabilities does not necessarily indicate that policymakers have been deliberately using pension underfunding as a backdoor means of running operating deficits. A key difference between explicit bond debt and implicit debt from underfunded pensions is that bond debt results from an explicit decision to issue debt, while pension debt may arise from either deliberate underfunding or from asset returns that ex post were less favorable than those assumed at the time that the liabilities first accrued. Hence, the deterioration in public pension finances could be caused by a factor other than strategic underfunding of pension plans. In this paper, we explore the extent to which public pension underfunding is a consequence of plan sponsors strategically decreasing pension contributions in response to negative economic and fiscal shocks. Using panel data on state-administered public sector pension plans, we estimate regressions that relate contributions made by plan sponsors to changes in economic, financial, and fiscal conditions. Our estimates indicate that plan sponsors do not decrease contributions relative to payroll in response to adverse economic and fiscal shocks. In contrast, plan sponsors respond to increases in unfunded liabilities, which may be the result of negative asset price shocks, by increasing contributions relative to payroll. 1
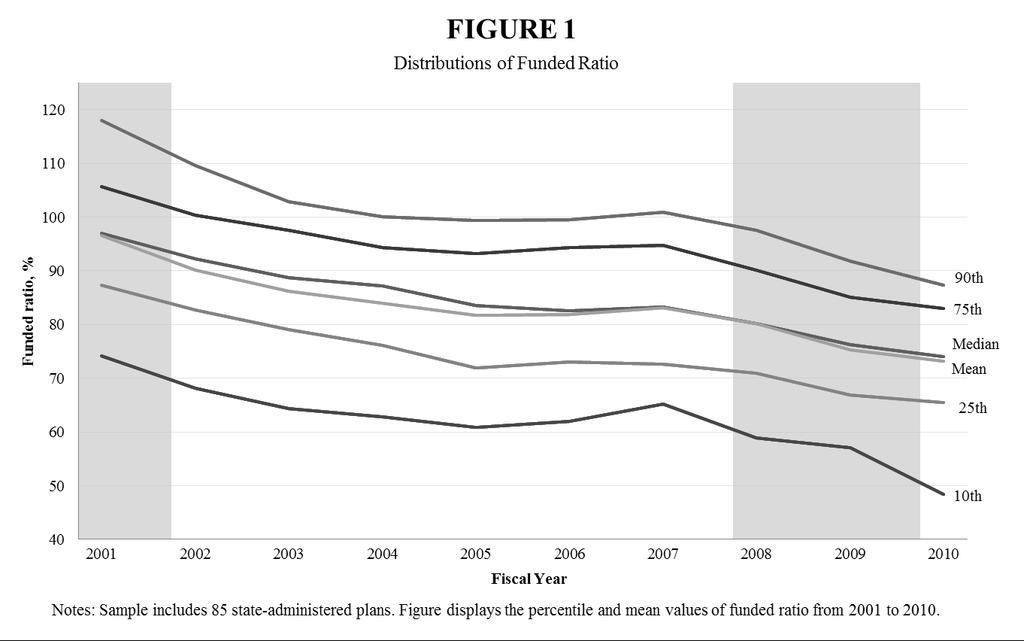
3 If plan sponsors did not deliberately use pension funding as a backdoor means of running deficits, then what did drive the development of the public pension funding crisis that arose during the last decade? The funded status of public pension plans deteriorated across nearly the entire distribution of plans between 2001 and Although some plans ended the decade much better funded than others, even these better-funded plans tended to have a funded ratio that decreased substantially over time. The main common factor shared by public pension plans during this time period is realized investment returns that were well below the rates of return assumed in the plans actuarial calculations. Our empirical results suggest that the public pensions funding crisis evolved largely as a consequence of these plans suffering a series of below-expected portfolio returns and other adverse shocks. Plan sponsors increased their contributions in response to the deteriorating funded status of their plans, but did not do so to the extent that was necessary to restore full funding. State and local government pension plans may take on too much risk or make overly optimistic assumptions regarding asset returns, but the sponsors do not appear to use pension underfunding as a backdoor means of running cyclical budget deficits. The rest of this paper is organized as follows. Section II provides a brief primer on the institutional structure of state and local public plans in the United States. Our empirical setup and specification of the econometric models that we estimate are discussed in section III. Section IV describes the dataset we use for the estimation, and is followed by presentation of results from regressions of plan contributions on measures of shocks and funded status in section V. Section VI examines changes in the distribution of plan funding between 2001 and Section VII concludes with a discussion of policy implications. II. Public Sector Pensions in the United States Unlike private sector pensions, state and local public sector pensions are still predominantly definedbenefit plans, with retiree benefits generally determined by final average salary and years of creditable service. In order to provide readers with sufficient background to place our empirical work in broader context, in this section we provide a very brief overview of the institutional features of state and local pensions that are most pertinent to our analysis. Comprehensive overviews of public sector pensions in the United States are provided by Munnell (2012) and by Clark, Craig, and Sabelhaus (2011). The Funded Ratio and Discount Rate A key concept in analyzing public pension plans is the funded ratio, the ratio of the value of a plan s assets to the present value of its liabilities (future benefit payments). Figure 1 displays the distribution of the funded ratio for 85 state-administered pension plans between 2001 and The median plan was close to fully funded in 2001, and then began a slow steady deterioration in its funded ratio. The overall distribution of public plan funded ratios has followed a similar downward trend, although the least well- 2
4 funded plans appear to have deteriorated more than those at other points in the distribution. The key question that this paper addresses is whether the decrease in the funded ratios of public pension plans is due to sponsors making a strategic choice to decrease plan contributions, resulting in a consequent decrease in funded ratios. State and local public sector pension plans are funded through a combination of employer and employee contributions, with a goal of fully funding the plans future pension obligations as these accrue. Although new standards are now being implemented, during our sample period plans followed the accounting rules laid out in Governmental Accounting Standards Board (GASB) Statements 25 and 27. The GASB standards specify that the expected rate of return on plan assets be used as the discount rate in computing the present value of the benefits expected to be paid to retirees in future years. This practice has been widely criticized by economists as being fundamentally inconsistent with a basic tenet of financial economics, which holds that the discount rate should be based on the riskiness of the liabilities (or, alternatively, the liabilities could be converted into certainty-equivalents discounted using a risk-free rate of return). Economists generally view the expected rate of return on assets as irrelevant to the choice of the rate used to discount liabilities. Brown and Wilcox (2009) argue that because pension plan benefits are protected by constitutional provisions in a majority of states, and by contract law and court decisions in many other states, these promised public pension benefits should generally be regarded as risk free, and so should be discounted using a risk-free rate. 1 They note that the ideal candidate for the discount rate would be the return on a risk-free bond that is not tax-preferred and that does not trade at a premium reflecting extraordinary liquidity or flight-to-quality effects. In practice, the choice of the discount rate makes a huge difference in the estimated magnitude of public pension plan underfunding. For example, Munnell et al. (2011) report that their estimate of aggregate public pension plan liabilities is $3.5 trillion using an 8 percent discount rate, which is the rate most commonly used by public pension plans, but $5.2 trillion using a 5 percent discount rate, which they argue is a reasonable estimate of a safe rate of return. As a result, public pension plans appear to be much less well funded when the risk-free rate is used for discounting liabilities: Munnell et al. s (2011) estimate of the aggregate public pension plan funded ratio is 77 percent using an 8 percent discount rate, but only 51 percent using a 5 percent discount rate. The discount rate issue is pertinent to our analysis because any differences between the assumed discount rate and the realized return on a plan s portfolio play a key role in the evolution of its funded ratio. Plans that appear to be fully funded using an 8 percent discount rate will have a funded status that decreases rapidly over time if realized portfolio returns are less than 8 percent and contributions and 1 Also see Novy-Marx and Rauh (2009). 3
5 benefit policies remain unchanged. 2 Plans that base their funding on realizing a rate of return than would be expected to accrue from risky assets are at a high risk of becoming underfunded. In section VI we evaluate the extent to which realized portfolio returns that are lower than those assumed ex ante can account for the deterioration of public pension plans funded ratios. Normal Cost, UAAL, and the ARC A few additional key terms are useful in understanding the evolution of pension finances. Contributions to pension plans fund both the normal cost of benefits attributed to the current year and, if the plan is underfunded, an additional amount to work towards reducing the unfunded actuarial accrued liability (UAAL). The UAAL of a plan is the difference between the present value of the plan s liabilities and the value of the plan s assets. The present value of the plan s liabilities depends critically on actuarial assumptions and the choice of the discount rate. The value of a plan s assets is more straightforward, with the main wrinkle being whether current market prices for assets should be used in the actuarial valuation, or if instead a moving average should be used to smooth over market fluctuations. The annual required contribution (ARC) is the sum of the normal cost and the UAAL amortized over a fixed period of time (most typically, 30 years). Contributions are generally made by both employers and employees, but the institutional setting of the contribution rate determination varies widely over individual plans. III. Econometric Specification To empirically test the hypothesis that public pension plan sponsors reduce their contributions in response to adverse economic and fiscal shocks, we estimate regressions of employer pension contributions on a set of control variables that include measures of economic and fiscal shocks. Our general specification takes the form: Y it = ρy it 1 + β 1 X it + β 2 Z it +β 3 C it + P i + T t + ε it, where Y it is the plan sponsors contribution as percentage of the payroll for plan i in year t, X it and Z it are measures of economic and fiscal shocks, respectively, C it is a vector of other control variables such as the funded status for the previous year, P i is a plan fixed effect, T t is a year fixed effect, and ε it is a stochastic term capturing other influences on plan contributions. The main coefficients of interest are β 1 and β 2, which reflect the impact of economic and fiscal shocks on the contributions made by plan sponsors. Our choice of employer contributions relative to payroll as a dependent variable is motivated by our intent to use a measure of contributions that is likely to be highly correlated with the decision variable 2 Figure 1 displays the distribution of funded ratios based on the discount rates chosen by plans. 4
6 used by plan sponsors in setting their contributions and that is also unlikely to be mechanically linked to financial and fiscal shocks. We considered an alternative measure, employer contributions divided by the plan s ARC, but rejected that because it is unlikely to be the decision variable used by government plan sponsors in making contribution decisions and is also, to some extent, mechanically tied to financial shocks through the effect of asset prices on funded ratios and ARCs. A negative shock to asset prices would decrease the value of a plan s portfolio, thus increasing the plan s unfunded liabilities and its ARC. If the plan sponsor makes no change to the percentage of payroll that it contributes to the plan, then its contribution relative to the ARC would decrease. In this sense, there is a negative mechanical relationship between negative asset price shocks and employer contributions relative to the ARC. Previous work has generally modeled a different measure of pension funding or contributions, and also conditioned on different measures of fiscal shocks and economic conditions. Chaney, Copley, and Stone (2002) find that fiscally strained states tend to have less well-funded pension plans. Coggburn and Kearney (2010) estimate that a higher ratio of interest payments on a state s debt relative to revenue is associated with higher unfunded state pension liabilities per capita. Munnell, Aubry, and Quinby (2011) and Munnell (2012) estimate that higher state debt-to-gsp ratios are associated with a reduced likelihood of plan sponsors making their full ARC payment. St. Clair (2013) examines the effects of fiscal institutions on the percent of the ARC that states contribute. IV. Data Our primary data source is the Public Plans Database (PPD) produced by the Center for Retirement Research at Boston College. The PPD includes information on 126 state and local defined-benefit plans, including the largest plans in each state. Among these plans, 107 are state-administered and constitute more than 90 percent of all state government pension assets and 90 percent of state and local employees in the United States. 3 In comparison, the PPD contains only 19 locally administered plans, which cover over 20 percent of all local government pension assets and members. The data span the 2001 through 2010 time period, encompassing an era that includes a major financial crisis, two recessions, and the associated periods of state fiscal stress. The PPD provides detailed data on the finance, governance, and plan design of public pension plans. In particular, it contains each plan s actuarial valuation information, including actuarial assets and actuarial liabilities. 4 In 2010, the mean funded ratio among the PPD s 126 pension plans was The GAO (2007) reports that 90 percent of state and local employees in the United States are covered by stateadministered pension plans. 4 We use the value of actuarial assets and actuarial liabilities of each pension plan calculated with the entry age normal method. About a quarter of the pension plans in the PPD also estimate their actuarial assets and actuarial liabilities based on alternative methods including projected unit credit, aggregate cost, and entry age frozen. 5
7 percent, nearly the same as the aggregate funded ratio of the 233 state and local pension plans surveyed by the Pew Center on the States for the same year (Pew Center on the States 2012), indicating that the PPD is representative of the wider group of public pension plans. Pension plans for some local government employees, such as teachers, police, and firefighters, sometimes receive contributions from both the local direct employer and from the state government. Because this practice varies over states, to make employer contributions comparable between pension plans we sum the contributions to each plan by the local employer and by the state government, and then divide by covered payroll. We use the individual state s unemployment rate as a proxy for economic shocks, as it changes substantially over the business cycle. Following Poterba (1994), we measure unexpected fiscal shocks using data from the National Association of State Budget Officers (NASBO). Each year, NASBO s Fiscal Survey of States publishes each state s actual revenues and outlays, midyear spending cuts, and enacted revenue changes for the past fiscal year, as well as forecast revenues and outlays for the current fiscal year. 5 We define an unexpected fiscal shock as the difference between the contemporaneous expenditure shock and the revenue shock, where the expenditure shock is defined as actual outlays minus midyear spending changes minus forecast outlays. The revenue shock is defined as actual revenues minus enacted revenue changes minus forecast revenues. 6 We scale this measure of the unexpected fiscal shock by dividing it by total state expenditures. Because plan sponsors may respond asymmetrically to negative and positive fiscal shocks, in the regression analysis we include separate variables for unexpected budget deficits and unexpected budget surpluses. Out of the PPD s 126 plans, we use 85 state-administered pension plans for the main regression analysis. We omit the 19 locally administered plans for three reasons. First, the comparability between locally administered plans and state-administered plans is questionable, as these two types of plans are funded and operated differently and are governed by different laws and statutes (Hess and Squire 2010). Second, both measures of economic and fiscal shocks are defined at the state level. Third, locally administered plans in the PPD are far less nationally representative than state-administered plans in the PPD. In order to estimate using a strongly balanced panel of plan data, we also exclude 22 stateadministered plans that have missing or problematic information for at least one year. Most of these plans have missing UAAL information in some years or combine figures for retirees health insurance plans together with data for their pension plans. The rest of the omitted plans have member agencies or localities that change from year to year, making data for these plans incomparable over time. 5 Pennsylvania did not report forecasted state revenues and outlays for fiscal year Poterba (1994) shows that without correcting for mid-year spending cuts or tax changes within the fiscal year, the measure of unexpected fiscal shock would be biased. 6
8 The remaining 85 plans are broadly representative of state-administered pension plans in the United States. These plans cover more than 70 percent of all state government pension assets and members, and their states comprise 93 percent of the U.S. population in To investigate the effect of our sample selection rules, we also construct an alternative larger sample by (1) including locally administered pension plans and (2) only dropping the plan-year observations, not the entire plans, that are missing UAAL information, have inconsistent member agencies or localities over time, or include retirees health insurance plans. Pairwise t-tests of the hypothesis that the means of the variables used in our regression analysis are the same for the two samples fail to reject the null hypothesis of equal means at the 5 percent significance level for all but one variable, the plan sponsors contributions as a percentage of covered payroll. The mean of sponsors contributions is smaller in our primary sample than it is in the full sample. The summary statistics of the variables used in the regression analysis are displayed in Table 1. Note that there is substantial variation in plan sponsors contributions and UAAL. There is also a wide range in state unemployment rates and our measures of unexpected state budget deficits and surpluses, which should enhance the precision with which we can estimate the impact of economic and fiscal shocks. V. Econometric Results We use several variants of our general econometric specification to estimate the impact of economic and fiscal shocks on plan sponsors contributions. If the hypothesis that plan sponsors reduce their contributions in response to adverse economic and fiscal shocks is true, then the coefficients on the unemployment rate and the unexpected state budget deficit would be negative, while the coefficient on the unexpected state budget surplus would be positive. As we discuss in detail below, our estimates strongly reject this hypothesis and indicate that plan sponsors do not react to adverse economic or fiscal shocks with reduced contributions to their pension plans. Moreover, our results show that plan sponsors increase their contributions in response to growth in the plans unfunded liabilities. Our regression estimates are displayed in Table 2. In all specifications the dependent variable is the plan sponsors contributions as a proportion of payroll. The table s columns pertain to different variants of our general econometric specification, starting with simple OLS in the first column and becoming more sophisticated in columns further to the right. We first describe the specifications pertaining to each column, and then discuss the coefficient estimates. The coefficient estimates from an OLS regression excluding fixed effects for the plan and year are shown in column 1 to provide a baseline for comparison with the more sophisticated estimators. As a 7 The 85 pension plans should cover more than 70 percent of all state government pension assets and members in 2010, because (1) their market assets and members are about 78 and 81 percent of the total market assets and members of the 107 state-administered plans in the PPD in 2010, and (2) the 107 plans represent more than 90 percent of all state government pension assets and members. 7
9 check on the influence of outliers, column 2 shows estimates from a robust regression estimator that iteratively downweights observations with large residuals. 8 The estimates shown in column 3 are from a specification identical to that shown in column 1, but these include plan and year fixed effects. The plan fixed effects control for time-invariant plan characteristics, such as the individual plan s governance structure, while the year fixed effects control for time varying factors that are common across plans, such as national economic and financial conditions. The fixed effects estimator attenuates problems with omitted variable bias that may be present in the OLS estimates. This attenuation comes at a cost, however, as the coefficient estimators in this specification are driven only by within-plan and within-year variances and covariances. The specification in column 4 is identical to the one in column 3 (plan and year fixed effects) except that we drop the outlier observations. Specifically, we exclude plan-year observations that have a standardized residual from the column 3 estimation that is 3 or greater in absolute value; 13 plan-year observations are dropped. Estimates from a specification that includes a one-year lag of the dependent variable in addition to plan and year fixed effects are reported in column 5. The lagged dependent variable specification allows for persistent, but not time-invariant, plan-specific effects that would not be captured by the plan fixed effects. We use the Blundell-Bond (1998) estimator to address the problem of inconsistency of the standard fixed effects estimator of regressions with a lagged dependent variable. 9 The coefficient on the state unemployment rate is positive in all five specifications, indicating that plan sponsors increase, rather than decrease, their contributions as the state s economy deteriorates. The magnitude and significance of the unemployment rate coefficients varies over the specifications, but overall this result provides strong evidence against the hypothesis that plan sponsors decrease their contributions in the face of adverse economic conditions. 10 The estimated coefficient on the unexpected budget deficit is also positive across all five specifications, indicating that plan sponsors on average increase, rather than decrease, their contributions when their states are hit with unexpected fiscal difficulties. Although the unexpected budget deficit coefficient is not statistically significant in the OLS specifications, it is significant in the three specifications that include plan and year fixed effects. 8 Stata s rreg command was used for estimation of the specification shown in column 2. We also estimated a median regression as an alternative way to reduce the influence of outliers. The results of the median regression are generally closer to the OLS estimates than are the robust regression estimates shown in column 2 of Table 2. 9 As a robustness check, we also estimated this specification with the Arellano-Bond (1991) estimator. This produced results similar to the Blundell-Bond (1998) estimates reported in column As a robustness check, we also tried using the Federal Reserve Bank of Philadelphia s state coincident index in place of the state unemployment rate. This index combines four indicators to summarize each state s current economic activities: nonfarm payroll employment, average hours worked in manufacturing, the unemployment rate, and wage and salary disbursements. Estimates using the coincident index were qualitatively similar to those using the unemployment rate in the panel data specifications. 8
10 The estimated coefficient on the unexpected budget surplus is positive, which is consistent with the hypothesis that states will provide more funding to their pension plans if they experience unexpected fiscal windfalls. This finding also indicates that plan sponsors respond asymmetrically to unexpected positive and negative fiscal shocks. The unexpected surplus coefficient is of smaller magnitude than the unexpected deficit coefficient in the three specifications incorporating plan and year fixed effects, and is statistically significant only in the panel data specification that excludes outliers. 11 We find that plan sponsors do consider their plan s funded status in deciding on their contributions. In the regressions we include a one-year lag of the UAAL divided by payroll as an indicator of the plan s funded status. The estimated coefficient on this variable is positive and highly significant in all five specifications, implying that plan sponsors increase their contributions in response to a deterioration in funded status. Although this effect remains highly statistically significant when plan and year fixed effects are included in the regressions, the point estimates of the coefficients are relatively small, ranging between and This result implies that a plan sponsor s contribution as a percentage of payroll increases 0.4 to 0.8 percentage points when the UAAL as a percentage of payroll increases by 100 percentage points. The small magnitude of the increase in plan sponsors contributions is clearly far from sufficient to fully offset a sudden increase in the UAAL. The regression results are qualitatively robust across the five specifications, and strongly refute the hypothesis that sponsors of state-administered public pension plans opportunistically decrease their contributions in the face of deteriorating economic and fiscal conditions. Plan sponsors, on average, do not reduce contributions as a backdoor means of running operating deficits. Additional specification checks, summarized below, confirm the robustness of this finding. Because payroll is the denominator of the dependent variable, one could argue that the results might be driven by payroll reductions during economic recessions and fiscal crises rather than by changes in plan sponsors contributions. To test this hypothesis, we turn off the payroll-adjustment channel by replacing current payroll with payroll averaged over the 10-year sample period in the denominator of the dependent variable. The results from this experiment, shown in Appendix Table 1, are similar to our earlier results reported in Table 2, thus suggesting that payroll reductions due to economic downturns are not driving the results. One might also be concerned that the results are influenced by our sample selection criteria. To address this, we re-ran the regressions using the full sample. The coefficient estimates from this exercise, 11 As a robustness check, we experimented with interacting the unemployment rate with the unexpected state budget deficit to examine whether states contribute less when they face both economic and fiscal shocks. While the coefficient on this interaction term is negative, it is not close to being statistically significant. Including this interaction term also does not affect the sign of the other estimated coefficients. 9
11 shown in Appendix Table 2, generally have the same sign as the main results reported in Table 2, although these are less often statistically significant. There are several reasons why plan sponsors may refrain from reducing contributions in response to adverse economic and fiscal shocks. First, some plan sponsors face institutional constraints in changing their contributions. Plan sponsors contributions are set by state statute, often as a fixed percentage of payroll, for about 30 percent of the pension plans in the PPD. For these plans, legislative action would be needed to change contributions in response to changing economic or fiscal conditions. Second, some state and local governments create and pre-fund special reserves to help stabilize plan sponsors contributions. For example, Los Angeles County paid its employer contributions during the 2000s using a combination of cash payments and transfers from the County Contribution Credit Reserve Account. Transfers from the reserve accounted for more than 37 percent of employer contributions in 2002 and 2003 when California was facing difficult economic and fiscal conditions following the dot-com bust; the share of employer contributions funded by the reserve subsequently fell to 25 percent in 2004 when the state s economic and fiscal situation improved. Third, some state and local governments increase their borrowing to help fund pension plans when they are short of revenues. For example, the State of Illinois issued $10 billion and $3.5 billion in general obligation bonds in 2003 and 2009, respectively, partly for the purpose of making the state s required contributions to the retirement systems. In addition, political economy factors may play a role in preventing cuts to plan sponsors contributions. In states with powerful public employee unions, state and local governments may face political pressure to robustly fund public pension plans even during difficult periods. At least two factors may underlie the small magnitude of plan sponsors increase in contributions when the UAAL increases. The same institutional constraints that make it difficult for plan sponsors to opportunistically reduce employer contributions during fiscal crises also make it difficult for sponsors to increase contributions when funded ratios deteriorate. The other factor is that negative shocks to funded status often coincide with deteriorating fiscal and economic conditions. Using revenue to increase pension funding may be especially costly at such times, and plan sponsors instead may gradually increase contributions as fiscal conditions improve. VI. The Evolution of the Distribution of Public Plans Funded Status If plan sponsors did not reduce contributions as a backdoor means of running fiscal deficits, then what did cause the deterioration in public pension funding during the 2000s? To answer this question, we provide a descriptive analysis of the evolution of pension plans funded status and four factors that affect the plans funded status portfolio composition, plan sponsor contributions, employee contributions, and plan benefits. To examine whether plans with different funded status behaved differently, we make comparisons by quartiles of plans ranked by their funded ratio in We find that financial shocks 10
12 played a major role in the pension underfunding crisis during the 2000s, and this finding holds across the spectrum of plans funded status. Evolution of Public Pension Plans Funded Status Table 3 shows that most public pension plans were not well-funded in The average 2010 funded ratio in each of the three lowest quartiles of plans is below 80 percent, a figure which many pension experts consider to be a lower bound for a relatively healthy pension system (GAO 2007, Pew Center on the States 2010). Even the top quartile s average funded ratio is less than 100 percent in There is also a wide range in funded status across pension plans. The bottom quartile s average funded ratio is 37 percentage points lower than the top quartile s average funded ratio in Pension plans current funded status is strongly correlated with their past funded status. Although pension plans, on average, were well-funded at the beginning of the decade, the bottom quartile of plans as ranked by their 2010 funded ratio was already in relatively bad shape by that time. The bottom quartile had the lowest average 2001 funded ratio among the four quartiles, and was already below the 80 percent benchmark. 12 On the other hand, the top quartile of plans had the highest average 2001 funded ratio among all four quartiles, and was over 100 percent funded. The product-moment correlation between the 2001 funded ratio and the 2010 funded ratio across all 85 plans is 0.59 and highly statistically significant. The Kendall rank correlation coefficient, which is less sensitive to extreme values than is the standard correlation coefficient, is equal to All four quartiles experienced a large decrease in funded ratios from 2001 to 2010, with the average decrease for each quartile ranging from approximately 20 percentage points to nearly 30 percentage points. The less well-funded plans tended to experience a somewhat larger drop than did the better-funded plans, although the correlations between the change in the funded ratio and the 2010 funded ratio are rather small (around 0.2). This across-the-board drop in the funded ratio suggests that some aggregate factor which we argue is largely subpar investment returns during the 2000s played a critical role in the pension underfunding crisis. Portfolio Investment The decline in public pension plans funded ratios is largely attributable to financial shocks that hit during the 2000s. Asset prices dropped substantially both during the dot-com bust and during the 12 In contrast, the top three quartiles were on average nearly or above fully funded in Another way to show the persistence in pension plans funded status is to examine their transitions between funded ratio quartiles from 2001 to Appendix Table 3 indicates that 46 percent of pension plans stayed in the same funded ratio quartile between 2001 and 2010, and 80 percent of plans either stayed in the same quartile or moved to an adjoining quartile. Therefore, there is relatively little reshuffling in the ranking of plans funded status during this time period. 11
13 financial crisis that precipitated the Great Recession. The average annual investment return during our sample period is less than 5 percent in all four quartiles of plans ranked by their 2010 funded ratio. 14 However, most plans set their expected annual investment return, which they use as the discount rate in computing the present value of their future pension benefit liabilities, at approximately 8 percent. As a consequence, annual pension portfolio returns fell short of actuarial expectations by 3 to 4 percentage points. A plan s funded ratio drops by approximately 1 percentage point for every percentage point by which the actual portfolio returns fall short of expected returns, so this annual shortfall has a very large effect when compounded over a decade. Public pension plans are very vulnerable to financial shocks because their asset portfolios include a relatively high share of risky assets. 15 On average, public pension plans invest about 56 percent of their asset portfolios in equities. Another 15 percent, on average, is invested in other non-bond assets, including real estate, hedge funds, private equities, cash and short-term assets. The average portfolio share of non-bond assets across the 85 plans in our sample increased from 68 percent in 2001 to 73 percent in Risky investments appeal to public pension plans because of their high expected rate of return. Public pension plans benefitted from a rapid appreciation of equities and other risky assets during the 1980s and 1990s, which resulted in most plans being nearly or above fully funded levels at the beginning of the 2000s. 16 Moreover, as mentioned above, under GASB accounting rules plans discount future liabilities by the expected return on their assets. Investment in risky assets reduces the accounting measure of future liabilities by increasing the discount rate used in present value calculations, and generally leads to lower ARC amounts. Some researchers maintain that the GASB accounting rules have had a causal impact on risk- taking in public pension plan portfolios (Andonov, Bauer, and Cremers 2013). Both the quartile comparison and the correlation measures show that the less well-funded plans tend to have suffered a larger gap between actual and expected investment returns during the 2000s than did the better-funded plans. This is due to a combination of their lower actual investment returns and higher assumed discount rates. Among the two factors, lower investment returns are more important because the assumed discount rates are concentrated around 8 percent, and therefore there is a relatively small difference in discount rates across plans. For example, the gap between the actual annual investment return and the assumed discount rate for the bottom-quartile plans is on average 0.75 percentage points 14 While most plans smooth their asset valuations over several years, they do not report a smoothed-out annual rate of return. 15 U.S. public pension plans have a greater exposure to risky investments than do U.S. private pension plans. We find that the 85 plans in our sample invested an average of 73 percent of their portfolios in non-bond assets in In comparison, private pension plans allocated 62.1 percent of their assets to risky assets in the same year (Andonov, Bauer, and Cremers 2013). 16 For example, the S & P 500 increased almost 13 times from January 1980 to December
14 higher than that for the top-quartile plans. Through decomposition, we find that as much as 0.55 percentage points of the gap are attributable to the lower investment return of the bottom-quartile plans, while their higher discount rate explains the remaining 0.2 percentage points. One might suspect that the less well-funded plans experienced lower investment returns because these plans invested larger shares of their portfolios in risky assets and therefore suffered greater losses from financial shocks. However, we find that this is not the case. Portfolio composition is fairly similar across the spectrum of pension plans. There is no economically or statistically significant correlation between the plans funded status and their shares of equities and other risky assets. The less well-funded plans had lower portfolio returns most likely because they suffered from lowerquality investment management and smaller economies of scale. To measure the quality of investment management, we use a proxy variable for whether a pension plan has a separate investment council, which usually consists of financial experts and professionals. It is reasonable to expect that plans with a separate investment council are more likely to receive higher-quality investment management than plans without such a council. We find that less than 14 percent of the bottom-quartile plans have their portfolios managed by financial professionals, compared with more than half of the top-quartile plans having a separate investment council. Moreover, the less well-funded plans tend to have a smaller portfolio and therefore enjoy smaller economies of scale than do the better-funded plans. For example, the bottomquartile plans average actuarial assets are less than one-third of the top-quartile plans average actuarial assets. Plan Sponsors Contributions Contrary to popular belief, public pension plan sponsors on average increased their contributions during the 2000s, despite the decade s economic recessions and fiscal crises. Even the bottom-quartile plans did not reduce plan sponsors contributions. The average annual increase in plan sponsors contributions ranged from 0.2 to 0.7 percent of payroll across the funded ratio quartiles. However, most plans did not increase their contributions by enough to make their full ARC, which grew rapidly as a result of the subpar investment returns. On average, plan sponsors contributions fell short of their ARC by 0.7 to 1.4 percent of payroll among the three lowest quartiles of plans. 17 This finding is consistent with the small coefficients on lagged UAAL that we estimate in our regression analysis. One might suspect that the sponsors contributions to the less well-funded plans grew more slowly or were smaller than the sponsors contributions to the better-funded plans. However, our evidence indicates that the opposite is true. First, plan sponsors contributions to the less well-funded plans tended to grow 17 These quartile means are calculated, excluding three outliers (Washington State Public Employees Retirement System Plan 1, Washington Teachers Retirement System Plan 1, and West Virginia Teachers Retirement System). We identify these outliers through a scatterplot diagnosis. 13
15 faster than plan sponsors contributions to the better-funded plans. For example, across the four quartiles the bottom-quartile plans have the highest average annual increase in the ratio of the plan sponsors contributions to payroll, equaling 2.5 times the top-quartile plans average annual change in the contribution ratio. Second, sponsors of the less well-funded plans made larger contributions than did sponsors of the better-funded plans. Plan sponsors paid contributions to the bottom-quartile plans that, relative to payroll, averaged more than twice that paid to the top-quartile plans. However, sponsors contributions to the less well-funded plans did less well in keeping pace with their rapidly increasing ARC payments than did contributions to the better-funded plans. Therefore, the less well-funded plans tended to experience a larger gap between plan sponsors contributions and ARCs than did the better-funded plans. For example, sponsors contributions to the bottom-quartile plans fell short of their ARCs by, on average, 1.4 percent of payroll. In contrast, contributions by sponsors of the topquartile plans exceeded their ARC by 0.4 percent of payroll during the same time period. Employee Contributions In general, employee contributions to public pension plans grew gradually during the 2000s. The average annual change in employee contributions is positive across all quartiles of plans. However, employee contributions grew at a much slower pace than did plan sponsors contributions. For example, for the bottom-quartile plans the average annual change in employee contributions is only about 10 percent of the average annual change in the plan sponsors contributions. This is likely because it is usually more difficult for state and local governments to increase employee contributions than it is to increase employer contributions. Public employee unions often strongly oppose higher employee contributions. Even when unions make concessions, the agreed upon increases in employee contributions tend to be relatively small. We investigate whether the less well-funded plans suffered from lower or more slowly growing employee contributions than did the better-funded plans, and find that neither is true. First, during the sample period the less well-funded plans tended to require their employees to contribute more than did the better-funded plans. The bottom-quartile plans average employee contribution (relative to payroll) is about 1.5 times the top-quartile plans average employee contribution (relative to payroll). Second, there is no systematic difference in the change in employee contributions across the spectrum of pension plans. Plan Benefits There is a popular perception that the less well-funded plans offer more generous retirement benefits to their members than do the better-funded plans. To examine whether this perception is valid, we separately examine retirement benefits promised to current employees and the retirement benefits paid to current retirees. We use a ratio of employer normal cost to payroll as a proxy for the retirement benefits 14
16 promised to current employees. Employer normal cost represents the present value of projected lifetime benefits to be paid to active employees that is allocated to the current year and paid by the employer. We find no evidence that the less well-funded plans offer more generous pension benefits to current employees. There is essentially no correlation between an employer s normal costs and the plans funded status. However, some evidence suggests that the less well-funded plans indeed promised more generous benefits in the past; as a result, these plans had to make larger benefits payments to current retirees during the sample period. The per retiree retirement benefits payment is negatively correlated with the plans funded status, although the Kendall rank correlation coefficient is significant only at the 10 percent level. In addition, the average retirement benefits payment per retiree in each of the two lowest quartiles is higher than that in each of the two highest quartiles. VII. Policy Discussion and Conclusion The statistical evidence that we present in this paper strongly refutes the view that public pension plan sponsors use reductions in pension funding as a backdoor means of running operational deficits in order to buffer the effects of economic and fiscal shocks. Instead, three key factors were largely responsible for the deterioration of public pension funding during the first decade of the twenty-first century: (1) the large degree of risk taken on by public plans in their asset portfolio choices, (2) the underperformance of returns on plans asset portfolios relative to assumed rates of return, and (3) the inability or unwillingness of plan sponsors to increase their contributions sufficiently to quickly close funding gaps as these increased. Public pension plans took on risk (and also, to some extent, may have had overly optimistic ex ante expectations of portfolio returns) and their bets did not play out as expected. These plans increased their contributions (relative to payroll) in response to falling funded ratios, but did not do so aggressively enough to restore funded ratios to their previous levels. Although public pension plans vary in how well funded they are, this general pattern appears to apply across the entire distribution of plans. Rather than providing a backdoor means of deficit finance to smooth over cyclical fluctuations in revenue and expenditures, public sector defined-benefit pension plans instead tend to amplify cyclical fluctuations in fiscal conditions. Negative shocks to funding that accompany cyclical downturns lead to increased contributions by plan sponsors. While these increased contributions are necessary to move plans toward a more sustainable funding path, these increases occur in an environment where both government and taxpayer finances are likely to be stressed, and the opportunity cost of the increased pension contributions may be unusually high. Although there may be valid long-term rationales for plans taking on greater risk in their portfolio choices on behalf of taxpayers (Bohn 2011), the negative consequences of the potential need to increase contributions when the opportunity cost of contributions is high should be taken into account. 15
17 Institutional and political constraints of the sort discussed in section V appear sufficient to prevent plan sponsors from strategically using public pension plans to circumvent balanced budget requirements. Institutional and political constraints appear to be less effective in preventing plans from suffering a marked decrease in funding over an extended period of below-expected portfolio returns. Although sponsors of public pension plans did not reduce contributions to smooth over cyclical fluctuations in fiscal conditions, they also did not take active steps to increase contributions by as much as the increase in their ARCs. A better understanding of the optimal degree of risk in public pension portfolios, and the optimal response to strings of subnormal investment returns, is needed in order to devise improved mechanisms for plan governance, management, and risk sharing that will prevent future funding crises. 16
18 References Andonov, Aleksandar, Rob Bauer, and Martijin Cremers Pension Fund Asset Allocation and Liability Discount Rates: Camouflage and Reckless Risk Taking by U.S. Public Plans? Working Paper. Available at SSRN: or Arellano, Manuel, and Stephen Bond Some Tests of Specification for Panel Data: Monte Carlo Evidence and an Application to Employment Equations. Review of Economic Studies 58(2): Blundell, Richard, and Stephen Bond Initial Conditions and Moment Restrictions in Dynamic Panel Data Models. Journal of Econometrics 87(1): Bohn, Henning Should Public Retirement Plans Be Fully Funded? Journal of Pension Economics and Finance 10(2): Brown, Jeffrey R., and David W. Wilcox Discounting State and Local Pension Liabilities. American Economic Review 99(2): Chaney, Barbara A., Paul A. Copley, and Mary S. Stone The Effect of Fiscal Stress and Balanced Budget Requirements on the Funding and Measurement of State Pension Obligations. Journal of Accounting and Public Policy 21(4): Clark, Robert L., Lee A. Craig, and John Sabelhaus, State and Local Retirement Plans in the United States. Cheltenham, UK: Edward Elgar. Coggburn, Jerrell D., and Richard C. Kearney Trouble Keeping Promises? An Analysis of Underfunding in State Retiree Benefits. Public Administration Review 70(1): Government Accountability Office State and Local Government Retiree Benefits: Current Status of Benefit Structures, Protections, and Fiscal Outlook for Funding Future Costs. GAO Washington, DC: Government Accountability Office. Hess, Federick M., and Juliet P. Squire But the Pension Fund Was Just SITTING There : The Politics of Teacher Retirement Plans. Education Finance and Policy 5(4): Munnell, Alicia H., Jean-Pierre Aubry, and Laura Quinby Public Pension Funding in Practice. Journal of Pension Economics and Finance 10(02): Munnell, Alicia H., Jean-Pierre Aubry, Josh Hurwitz, Madeline Medenica, and Laura Quinby The Funding of State and Local Pensions in State and Local Pension Plan Brief 17. Chestnut Hill, MA: Center for Retirement Research at Boston College. Munnell, Alicia H., State and Local Pensions: What Now? Washington, DC: Brookings Institution Press. Novy-Marx, Robert, and Joshua D. Rauh The Liabilities and Risks of State-Sponsored Pension Plans. Journal of Economic Perspectives 23(4): Pew Center on the States The Trillion Dollar Gap: Underfunded State Retirement Systems and the Roads to Reform. Washington, DC: Pew Charitable Trusts. Available at 17
19 irement_systems_and_the_roads_to_reform.pdf. Pew Center on the States The Widening Gap Update, Washington, DC: Pew Charitable Trusts. Available at Poterba, James M State Responses to Fiscal Crises: The Effects of Budgetary Institutions and Politics. Journal of Political Economy 102(2): St. Clair, Travis The Impact of Budget Stabilization Funds on State Pension Contributions. Public Budgeting & Finance 33(3):
20 TABLE 1 SUMMARY STATISTICS Number of Observations=850 (unless otherwise indicated) Mean Standard deviation Minimum Maximum Plan Sponsors' Contribution/Payroll UAAL/Payroll Unemployment Rate Unexpected State Budget Deficit/State Total Expenditure Unexpected State Budget Surplus/State Total Expenditure Sources: Pension-related data are from the Boston College Center for Retirement Research's Public Plans Database. Data for unexpected state budget deficit and surplus are from the National Association of State Budget Officers' Fiscal Survey of States. Data for state total expenditures and unemployment rates are from the Census Bureau and the Bureau of Labor Statistics, respectively. Notes: All variables are in percentages. Sample includes 85 state-administered plans with UAAL information available for every year between 2001 and UAAL is calculated based on the "entry age normal" method. Plan sponsors' contribution is the sum of the employer contribution, state contribution, and other employer contribution. Unexpected state budget deficit = max(expenditure shock revenue shock, 0), where expenditure shock = actual outlays midyear spending changes forecast outlays, and revenue shock = actual revenues enacted revenue changes forecast revenues. Unexpected state budget surplus = max(revenue shock expenditure shock, 0). When calculating the summary statistics of unexpected state budget deficit and surplus, we exclude two 2004 observations from Pennsylvania because the state did not report forecast state revenues and expenditures for that year. 19
21 Dependent Variable: Plan Sponsors' Contribution/Payroll TABLE 2 REGRESSION RESULTS (1) (2) (3) (4) (5) OLS Robust Regression Static Panel Data Model Static Panel Data Model Dynamic Panel Data Model (excluding 13 outlier observations) Unemployment Rate 0.514*** ** 0.996* (0.177) (0.074) (0.355) (0.123) (0.536) Unexpected State Budget Deficit/State Total Expenditure ** 0.189*** 0.398** (0.167) (0.069) (0.148) (0.051) (0.182) Unexpected State Budget Surplus/State Total Expenditure ** (0.124) (0.051) (0.114) (0.040) (0.130) UAAL/Payroll, One-Year Lag 0.015*** 0.040*** 0.008*** 0.004*** 0.006*** (0.001) (0.001) (0.002) (0.001) (0.001) Plan Sponsors' Contribution/Payroll, One-Year Lag 0.297*** (0.027) Constant 6.513*** 6.183*** 5.103* 6.110*** (1.097) (0.455) (2.946) (1.021) (4.907) Plan Fixed Effects No No Yes Yes Yes Year Fixed Effects No No Yes Yes Yes Adjusted R-Squared F Statistic Wald Chi-Square Number of Observations Notes: Standard errors are in parentheses. * implies significance at 10 percent; ** implies significance at 5 percent; *** implies significance at 1 percent. Coefficients for the dynamic panel data model are generated using the Blundell-Bond estimator. Because Pennsylvania did not report forecast state revenues and expenditures in 2004, we dropped two observations from Pennsylvania for that year. 20
22 TABLE 3 COMPARISON BY QUARTILE OF FUNDED RATIO IN 2010 Funded Ratio in 2010 Correlation with Funded Ratio in 2010 Bottom Quartile Second Quartile Third Quartile Top Quartile Product-moment Kendall Rank Funded Status: Funded Ratio in *** 1.00*** Funded Ratio in *** 0.42*** Change in Funded Ratio from 2001 to ** 0.20*** Investment: Annual Investment Return ** 0.14* Assumed Discount Rate ** 0.18** Annual Investment Return-Assumed Discount Rate *** 0.20*** Investment in Equities/Total Portfolio Investment in Bonds/Total Portfolio Investment in all Other Types of Assets/Total Portfolio Plan has a Separate Investment Council *** 0.25** Actuarial Assets (in billions of 2010 dollars) ** 0.15** Plan Sponsors' Contribution: Annual Change in Plan Sponsors' Contribution/Payroll *** 0.31*** Plan Sponsors' Contribution/Payroll *** 0.35*** (Plan Sponsors' Contribution-ARC)/Payroll: Including 3 Outliers *** (Plan Sponsors' Contribution-ARC)/Payroll: Excluding 3 Outliers *** 0.26*** Employee Contribution: Annual Change in Employee Contribution/Payroll Employee Contribution/Payroll *** 0.21*** Plan Benefits: Plan Sponsors' Normal Cost/Payroll Retirement Benefits Payment per Retiree (in thousands of 2010 dollars) * Notes: The first four columns show mean values of the listed variables in each quartile grouped by plans' funded ratio in All values are in percentages, except actuarial assets. The last two columns show the standard product-moment correlation coefficients and the Kendall rank correlation coefficients (tau b) between the 10-year average of these listed variables and plans' funded ratio in 2010 across the 85 pension plans. * implies significance at 10 percent; ** implies significance at 5 percent; *** implies significance at 1 percent. 21
23 22
The Evolution of Public Sector Pension Funding
 The Evolution of Public Sector Pension Funding Robert K. Triest (based on joint work with Bo Zhao) Robert.Triest@bos.frb.org Federal Reserve Bank of Boston Public Pension Funding Forum April 22, 2014 The
Pension Simulation Project Rockefeller Institute of Government
 PENSION SIMULATION PROJECT Investment Return Volatility and the Pennsylvania Public School Employees Retirement System August 2017 Yimeng Yin and Donald J. Boyd Jim Malatras Page 1 www.rockinst.org @rockefellerinst
VRS Stress Test and Sensitivity Analysis
 VRS Stress Test and Sensitivity Analysis Report to the General Assembly of Virginia December 2018 Virginia Retirement System TABLE OF CONTENTS Contents Stress Test Mandate 1 Executive Summary 2 Introduction
Saving, wealth and consumption
 By Melissa Davey of the Bank s Structural Economic Analysis Division. The UK household saving ratio has recently fallen to its lowest level since 19. A key influence has been the large increase in the
PENSION SIMULATION PROJECT Investment Return Volatility and the Michigan State Employees Retirement System
 PENSION SIMULATION PROJECT Investment Return Volatility and the Michigan State Employees Retirement System Jim Malatras March 2017 Yimeng Yin and Donald J. Boyd Investment Return Volatility and the Michigan
U.S. Public Pension Plan Contribution Analysis
 U.S. Public Pension Plan Contribution Analysis Aging and Retirement Lisa Schilling, FSA, EA, FCA, MAAA and Patrick Wiese, ASA February 2019 Introduction and Executive Summary The Society of Actuaries (SOA)
Status of Local Pension Funding Fiscal Year 2012: An Evaluation of Ten Local Government Employee Pension Funds in Cook County
 Status of Local Pension Funding Fiscal Year 2012: An Evaluation of Ten Local Government Employee Pension Funds in Cook County October 2, 2014 ACKNOWLEDGEMENTS The Civic Federation would like to thank the
WILL PUBLIC SECTOR RETIREE HEALTH BENEFIT PLANS SURVIVE? ECONOMIC AND POLICY IMPLICATIONS OF UNFUNDED LIABILITIES
 WILL PUBLIC SECTOR RETIREE HEALTH BENEFIT PLANS SURVIVE? ECONOMIC AND POLICY IMPLICATIONS OF UNFUNDED LIABILITIES Robert L. Clark Professor Department of Economics Box 7229 North Carolina State University
Status of Local Pension Funding Fiscal Year 2008: An Evaluation of Ten Local Government Employee Pension Funds in Cook County
 Status of Local Pension Funding Fiscal Year 2008: An Evaluation of Ten Local Government Employee Pension Funds in Cook County March 8, 2010 ACKNOWLEDGEMENTS The Civic Federation would like to thank the
HOW PUBLIC PENSION PLAN DEMOGRAPHIC CHARACTERISTICS AFFECT FUNDING
 PENSION SIMULATION PROJECT HOW PUBLIC PENSION PLAN DEMOGRAPHIC CHARACTERISTICS AFFECT FUNDING ANDCONTRIBUTION RISK The Nelson A. Rockefeller Institute of Government, the public policy research arm of the
Current Economic Conditions and Selected Forecasts
 Order Code RL30329 Current Economic Conditions and Selected Forecasts Updated May 20, 2008 Gail E. Makinen Economic Policy Consultant Government and Finance Division Current Economic Conditions and Selected
Public Pension Crisis and Investment Risk Taking: Underfunding, Fiscal Constraints, Public Accounting, and Policy Implications
 Upjohn Institute Policy Papers Upjohn Research home page 2012 Public Pension Crisis and Investment Risk Taking: Underfunding, Fiscal Constraints, Public Accounting, and Policy Implications Nancy Mohan
CENTER FOR MUNICIPAL FINANCE. From High to Low: Understanding How the Pennsylvania Public School Employees Retirement System Became Underfunded
 CENTER FOR MUNICIPAL FINANCE From High to Low: Understanding How the Pennsylvania Public School Employees Retirement System Became Underfunded From High to Low: Understanding How the Pennsylvania Public
Charles I Plosser: Strengthening our monetary policy framework through commitment, credibility, and communication
 Charles I Plosser: Strengthening our monetary policy framework through commitment, credibility, and communication Speech by Mr Charles I Plosser, President and Chief Executive Officer of the Federal Reserve
Strengthening Our Monetary Policy Framework Through Commitment, Credibility, and Communication
 Strengthening Our Monetary Policy Framework Through Commitment, Credibility, and Communication Global Interdependence Center's 2011 Global Citizen Award Luncheon November 8, 2011 Union League Club, Philadelphia,
The State Pensions Funding Gap: Challenges Persist New reporting standards may offer more guidance to policymakers
 A brief from July 2015 The State Pensions Funding Gap: Challenges Persist New reporting standards may offer more guidance to policymakers Getty Images/Joel Sartore Overview The nation s state-run retirement
REPORT OF THE BLUE RIBBON PANEL ON PUBLIC PENSION PLAN FUNDING
 REPORT OF THE BLUE RIBBON PANEL ON PUBLIC PENSION PLAN FUNDING AN INDEPENDENT PANEL COMMISSIONED BY THE SOCIETY OF ACTUARIES FEBRUARY 2014 2014 2014 Society of of Actuaries, Schaumburg, Illinois Illinois
IMPERIAL COUNTY EMPLOYEES RETIREMENT SYSTEM. Review of Economic Actuarial Assumptions for the June 30, 2014 Actuarial Valuation
 IMPERIAL COUNTY EMPLOYEES RETIREMENT SYSTEM Review of Economic Actuarial Assumptions for the June 30, 2014 Actuarial Valuation 100 Montgomery Street, Suite 500 San Francisco, CA 94104 COPYRIGHT 2014 ALL
October 3, Background on PICA
 Testimony of Fran Burns, Executive Director, Pennsylvania Intergovernmental Cooperation Authority, before the Pennsylvania Public Employee Retirement Commission October 3, 2012 Good afternoon, Chairperson
Teacher Pension Workshop: Connecting Evidence-Based Research to Pension Reform
 Working Paper Teacher Pension Workshop: Connecting Evidence-Based Research to Pension Reform Investment Risk and Its Potential Consequences for Teacher Retirement Systems and School Districts Don Boyd
Characteristics of the euro area business cycle in the 1990s
 Characteristics of the euro area business cycle in the 1990s As part of its monetary policy strategy, the ECB regularly monitors the development of a wide range of indicators and assesses their implications
Risk-Adjusted Futures and Intermeeting Moves
 issn 1936-5330 Risk-Adjusted Futures and Intermeeting Moves Brent Bundick Federal Reserve Bank of Kansas City First Version: October 2007 This Version: June 2008 RWP 07-08 Abstract Piazzesi and Swanson
How Did State & Local Pension Plans Become Underfunded?
 The Academy Capitol Forum: Meet the Experts How Did State & Local Pension Plans Become Underfunded? Jean-Pierre Aubry Assistant Director of State and Local Research The Center for Retirement Research at
Report to Board of Administration
 Report to Board of Administration Agenda of: JULY 11, 2017 From: Thomas Moutes, General Manager ITEM: III-A SUBJECT: ECONOMIC ASSUMPTIONS REVIEW AND POSSIBLE BOARD ACTION Recommendations: That the Board
Implications of Fiscal Austerity for U.S. Monetary Policy
 Implications of Fiscal Austerity for U.S. Monetary Policy Eric S. Rosengren President & Chief Executive Officer Federal Reserve Bank of Boston The Global Interdependence Center Central Banking Conference
The U.S. Economy: An Optimistic Outlook, But With Some Important Risks
 EMBARGOED UNTIL 8:10 A.M. Eastern Time on Friday, April 13, 2018 OR UPON DELIVERY The U.S. Economy: An Optimistic Outlook, But With Some Important Risks Eric S. Rosengren President & Chief Executive Officer
The Return Expectations of Institutional Investors
 The Return Expectations of Institutional Investors Aleksandar Andonov Erasmus University Joshua Rauh Stanford GSB, Hoover Institution & NBER January 2018 Motivation Considerable attention has been devoted
Lessons Learned From The Pension Crises
 Lessons Learned From The Pension Crises February 2, 2012 Gene Kalwarski FSA, MAAA, EA Topics Defined Benefit Pension Plan Crisis What Lessons Have We Learned? What Can Be Done? 1 Defined Benefit Pension
Retiree Pensions and Health Benefits: State and Local Governments Face New Budget Challenges
 2006 Rockefeller Institute Reports on State and Local Government Finances Retiree Pensions and Health Benefits: State and Local Governments Face New Budget Challenges Donald Boyd Rockefeller Institute
INCREASING THE RATE OF CAPITAL FORMATION (Investment Policy Report)
") policies can increase our supply of goods and services, improve our efficiency in using the Nation's human resources, and help people lead more satisfying lives. INCREASING THE RATE OF CAPITAL FORMATION
policies can increase our supply of goods and services, improve our efficiency in using the Nation's human resources, and help people lead more satisfying lives. INCREASING THE RATE OF CAPITAL FORMATION
The Pension Funding Crisis: Critical Issues and Potential for Progress
 The Pension Funding Crisis: Critical Issues and Potential for Progress Economic Perspectives on State and Local Taxes New England Public Policy Center, Federal Reserve Bank of Boston Lincoln Institute
Invitation to Comment: Plain-Language Supplement
 March 31, 2009 Invitation to Comment: Plain-Language Supplement Pension Accounting and Financial Reporting This plain-language supplement to an Invitation to Comment is issued for public comment. Written
Public Pension Woes Make Differentiated Muni Investing Key
 February 2015 Public Pension Woes Make Differentiated Muni Investing Key EXECUTIVE SUMMARY Mark Stockwell Senior Analyst Tax Sensitive Strategies As public pension funding gaps and municipal fiscal challenges
Online Appendix to. The Value of Crowdsourced Earnings Forecasts
 Online Appendix to The Value of Crowdsourced Earnings Forecasts This online appendix tabulates and discusses the results of robustness checks and supplementary analyses mentioned in the paper. A1. Estimating
TEACHERS RETIREMENT BOARD. REGULAR MEETING Item Number: 7 CONSENT: ATTACHMENT(S): 1. DATE OF MEETING: November 8, 2018 / 60 mins
: 1. DATE OF MEETING: November 8, 2018 / 60 mins") TEACHERS RETIREMENT BOARD REGULAR MEETING Item Number: 7 SUBJECT: Review of CalSTRS Funding Levels and Risks CONSENT: ATTACHMENT(S): 1 ACTION: INFORMATION: X DATE OF MEETING: / 60 mins PRESENTER(S): Rick
TEACHERS RETIREMENT BOARD REGULAR MEETING Item Number: 7 SUBJECT: Review of CalSTRS Funding Levels and Risks CONSENT: ATTACHMENT(S): 1 ACTION: INFORMATION: X DATE OF MEETING: / 60 mins PRESENTER(S): Rick
Summary of Findings for FY 2013 January 2015
 Summary of Findings for FY 2013 January 2015 About the Public Fund Survey The Public Fund Survey is an online compendium of key characteristics of most of the nation s largest public retirement systems.
IMPACT OF PUBLIC SECTOR ASSUMED RETURNS ON INVESTMENT CHOICES
 RETIREMENT RESEARCH State and Local Pension Plans Number 63, January 2019 IMPACT OF PUBLIC SECTOR ASSUMED RETURNS ON INVESTMENT CHOICES By Jean-Pierre Aubry and Caroline V. Crawford* Introduction State
Implications of Low Inflation Rates for Monetary Policy
 Implications of Low Inflation Rates for Monetary Policy Eric S. Rosengren President & Chief Executive Officer Federal Reserve Bank of Boston Washington and Lee University s H. Parker Willis Lecture in
An Analysis of the Effect of State Aid Transfers on Local Government Expenditures
 An Analysis of the Effect of State Aid Transfers on Local Government Expenditures John Perrin Advisor: Dr. Dwight Denison Martin School of Public Policy and Administration Spring 2017 Table of Contents
How Big A Burden Are State and Local OPEB Benefits?
 How Big A Burden Are State and Local OPEB Benefits? By Alicia H. Munnell, Jean-Pierre Aubry, and Caroline V. Crawford Reprinted with permission from the Center for State & Local Government Excellence INTRODUCTION
Estimating Key Economic Variables: The Policy Implications
 EMBARGOED UNTIL 11:45 A.M. Eastern Time on Saturday, October 7, 2017 OR UPON DELIVERY Estimating Key Economic Variables: The Policy Implications Eric S. Rosengren President & Chief Executive Officer Federal
Consumption Inequality in Canada, Sam Norris and Krishna Pendakur
 Consumption Inequality in Canada, 1997-2009 Sam Norris and Krishna Pendakur Inequality has rightly been hailed as one of the major public policy challenges of the twenty-first century. In all member countries
Macroeconomic Risk Management in Nigeria: Dealing with External Shocks
 -Macroeconomic Risk Management in Nigeria: Dealing with External Shocks Page 1 of 6 THE WORLD BANK GRO UP AV.., 23098 Findings reports on ongoing operational, economic and sector work carried out by the
Two New Indexes Offer a Broad View of Economic Activity in the New York New Jersey Region
 C URRENT IN ECONOMICS FEDERAL RESERVE BANK OF NEW YORK Second I SSUES AND FINANCE district highlights Volume 5 Number 14 October 1999 Two New Indexes Offer a Broad View of Economic Activity in the New
UNIVERSITY OF CALIFORNIA Economics 134 DEPARTMENT OF ECONOMICS Spring 2018 Professor David Romer LECTURE 9
 UNIVERSITY OF CALIFORNIA Economics 134 DEPARTMENT OF ECONOMICS Spring 2018 Professor David Romer LECTURE 9 THE CONDUCT OF POSTWAR MONETARY POLICY FEBRUARY 14, 2018 I. OVERVIEW A. Where we have been B.
ORANGE COUNTY EMPLOYEES RETIREMENT SYSTEM. Review of Economic Actuarial Assumptions for the December 31, 2012 Actuarial Valuation
 ORANGE COUNTY EMPLOYEES RETIREMENT SYSTEM Review of Economic Actuarial Assumptions for the December 31, 2012 Actuarial Valuation 100 Montgomery Street, Suite 500 San Francisco, CA 94104 COPYRIGHT 2012
THE IMPACT OF PUBLIC PENSIONS ON STATE AND LOCAL BUDGETS
 State and Local Pension Plans Number 13, October 2010 THE IMPACT OF PUBLIC PENSIONS ON STATE AND LOCAL BUDGETS By Alicia H. Munnell, Jean-Pierre Aubry, and Laura Quinby* Introduction State and local pensions
TEACHERS' RETIREMENT BOARD REGULAR MEETING. SUBJECT: SCR 105 Report on System Funding ITEM NUMBER: 6 CONSENT: ATTACHMENT(S): 1
: 1") TEACHERS' RETIREMENT BOARD REGULAR MEETING SUBJECT: SCR 105 Report on System Funding ITEM NUMBER: 6 CONSENT: ATTACHMENT(S): 1 ACTION: MEETING DATE: February 8, 2013 / 2 hrs. INFORMATION: X PRESENTER: Ed
TEACHERS' RETIREMENT BOARD REGULAR MEETING SUBJECT: SCR 105 Report on System Funding ITEM NUMBER: 6 CONSENT: ATTACHMENT(S): 1 ACTION: MEETING DATE: February 8, 2013 / 2 hrs. INFORMATION: X PRESENTER: Ed
Report Documentation Page Form Approved OMB No Public reporting burden for the collection of information is estimated to average 1 hour per re
 Testimony The Budget and Economic Outlook: 214 to 224 Douglas W. Elmendorf Director Before the Committee on the Budget U.S. House of Representatives February 5, 214 This document is embargoed until it
U.S. State Employee Pension Systems: An Investigation into the Causes of Unfunded Liabilities
 University of Kentucky UKnowledge MPA/MPP Capstone Projects Martin School of Public Policy and Administration 2011 U.S. State Employee Pension Systems: An Investigation into the Causes of Unfunded Liabilities
Socio-economic Series Changes in Household Net Worth in Canada:
 research highlight October 2010 Socio-economic Series 10-018 Changes in Household Net Worth in Canada: 1990-2009 introduction For many households, buying a home is the largest single purchase they will
Projected Results % $3,882,000 TBD % $4,538,000 TBD
 California Public Employees Retirement System Actuarial Office P.O. Box 942701 Sacramento, CA 94229-2701 TTY: (916) 795-3240 (888) 225-7377 phone (916) 795-2744 fax www.calpers.ca.gov July 2017 (CalPERS
Getting Mexico to Grow With NAFTA: The World Bank's Analysis. October 13, 2004
 cepr CENTER FOR ECONOMIC AND POLICY RESEARCH Issue Brief Getting Mexico to Grow With NAFTA: The World Bank's Analysis Mark Weisbrot, David Rosnick, and Dean Baker 1 October 13, 2004 CENTER FOR ECONOMIC
International Journal of Business and Economic Development Vol. 4 Number 1 March 2016
 A sluggish U.S. economy is no surprise: Declining the rate of growth of profits and other indicators in the last three quarters of 2015 predicted a slowdown in the US economy in the coming months Bob Namvar
Striking it Richer: The Evolution of Top Incomes in the United States (Updated with 2009 and 2010 estimates)
") Striking it Richer: The Evolution of Top Incomes in the United States (Updated with 2009 and 2010 estimates) Emmanuel Saez March 2, 2012 What s new for recent years? Great Recession 2007-2009 During the
Striking it Richer: The Evolution of Top Incomes in the United States (Updated with 2009 and 2010 estimates) Emmanuel Saez March 2, 2012 What s new for recent years? Great Recession 2007-2009 During the
CENTER FOR MUNICIPAL FINANCE. From High to Low: Understanding How the Education Retirement Board of New Mexico Became Underfunded
 CENTER FOR MUNICIPAL FINANCE From High to Low: Understanding How the Education Retirement Board of New Mexico Became Underfunded From High to Low: Understanding How the Education Retirement Board of New
CRS Report for Congress
 Order Code RL33519 CRS Report for Congress Received through the CRS Web Why Is Household Income Falling While GDP Is Rising? July 7, 2006 Marc Labonte Specialist in Macroeconomics Government and Finance
Antonio Fazio: Overview of global economic and financial developments in first half 2004
 Antonio Fazio: Overview of global economic and financial developments in first half 2004 Address by Mr Antonio Fazio, Governor of the Bank of Italy, to the ACRI (Association of Italian Savings Banks),
ICI RESEARCH PERSPECTIVE
 ICI RESEARCH PERSPECTIVE 1401 H STREET, NW, SUITE 1200 WASHINGTON, DC 20005 202-326-5800 WWW.ICI.ORG APRIL 2018 VOL. 24, NO. 3 WHAT S INSIDE 2 Mutual Fund Expense Ratios Have Declined Substantially over
SAN DIEGO COUNTY EMPLOYEES RETIREMENT ASSOCIATION. Review of Economic Actuarial Assumptions for the June 30, 2013 Actuarial Valuation
 SAN DIEGO COUNTY EMPLOYEES RETIREMENT ASSOCIATION Review of Economic Actuarial Assumptions for the June 30, 2013 Actuarial Valuation 100 Montgomery Street, Suite 500 San Francisco, CA 94104 COPYRIGHT 2013
The Trustees Report for the Old-Age, Survivors, and Disability
 American Academy of Actuaries MARCH 2009 May 2009 Looming Financial Challenges Social Security will face financial challenges sooner than was expected. New actuarial projections show income from taxes
Monetary Policy Report: Using Rules for Benchmarking
 Monetary Policy Report: Using Rules for Benchmarking Michael Dotsey Executive Vice President and Director of Research Keith Sill Senior Vice President and Director, Real Time Data Research Center Federal
Experience Study 1. How does MERS ensure plans are sustainable? 2. Why does MERS conduct an Experience Study every 5 years?
 Experience Study 1. How does MERS ensure plans are sustainable? 2. Why does MERS conduct an Experience Study every 5 years? MERS Funding Policy 3. What s the difference between rolling and fixed amortization?
Projected Results % $3,056,000 TBD % $3,453,000 TBD
 California Public Employees Retirement System Actuarial Office P.O. Box 942701 Sacramento, CA 94229-2701 TTY: (916) 795-3240 (888) 225-7377 phone (916) 795-2744 fax www.calpers.ca.gov July 2017 (CalPERS
Global Business Cycles
 Global Business Cycles M. Ayhan Kose, Prakash Loungani, and Marco E. Terrones April 29 The 29 forecasts of economic activity, if realized, would qualify this year as the most severe global recession during
Part I. Prepared Remarks to the Jacksonville Pension Reform Task Force David Draine 10/29/2013
 Prepared Remarks to the Jacksonville Pension Reform Task Force David Draine 10/29/2013 Part I Good morning. It is my pleasure to present once again to the Jacksonville Task Force on Pension Reform. I would
STRESS TESTING GUIDELINE
 c DRAFT STRESS TESTING GUIDELINE November 2011 TABLE OF CONTENTS Preamble... 2 Introduction... 3 Coming into effect and updating... 6 1. Stress testing... 7 A. Concept... 7 B. Approaches underlying stress
Real Estate Ownership by Non-Real Estate Firms: The Impact on Firm Returns
 Real Estate Ownership by Non-Real Estate Firms: The Impact on Firm Returns Yongheng Deng and Joseph Gyourko 1 Zell/Lurie Real Estate Center at Wharton University of Pennsylvania Prepared for the Corporate
BANK OF FINLAND ARTICLES ON THE ECONOMY
 BANK OF FINLAND ARTICLES ON THE ECONOMY Table of Contents Finland struggling to defend its market share on rapidly expanding markets 3 Finland struggling to defend its market share on rapidly expanding
In fiscal year 2016, for the first time since 2009, the
 Summary In fiscal year 216, for the first time since 29, the federal budget deficit increased in relation to the nation s economic output. The Congressional Budget Office projects that over the next decade,
Crestmont Research. Rowing vs. The Roller Coaster By Ed Easterling January 26, 2007 All Rights Reserved
 Crestmont Research Rowing vs. The Roller Coaster By Ed Easterling January 26, 2007 All Rights Reserved Why are so many of the most knowledgeable institutions and individuals shifting away from investment
The American Retirement Security Crisis: An introduction. Lauren Damme Next Social Contract Initiative, New America Foundation
 The American Retirement Security Crisis: An introduction Lauren Damme Next Social Contract Initiative, New America Foundation The three legs of retirement security are under strain Americans primarily
Employer Contribution Rate % % (projected)
") California Public Employees Retirement System Actuarial Office P.O. Box 942701 Sacramento, CA 94229-2701 TTY: (916) 795-3240 (888) 225-7377 phone (916) 795-2744 fax www.calpers.ca.gov October 2015 SAFETY
California Public Employees Retirement System Actuarial Office P.O. Box 942701 Sacramento, CA 94229-2701 TTY: (916) 795-3240 (888) 225-7377 phone (916) 795-2744 fax www.calpers.ca.gov October 2015 SAFETY
An Assessment of the Operational and Financial Health of Rate-of-Return Telecommunications Companies in more than 700 Study Areas:
 An Assessment of the Operational and Financial Health of Rate-of-Return Telecommunications Companies in more than 700 Study Areas: 2007-2012 Harold Furchtgott-Roth Kathleen Wallman December 2014 Executive
San Francisco Community College District Actuarial Study of Retiree Health Liabilities As of October 1, 2009
 San Francisco Community College District Actuarial Study of Retiree Health Liabilities As of October 1, 2009 Prepared by: Total Compensation Systems, Inc. Date: October 23, 2009 Table of Contents PART
Online Appendix to Bond Return Predictability: Economic Value and Links to the Macroeconomy. Pairwise Tests of Equality of Forecasting Performance
 Online Appendix to Bond Return Predictability: Economic Value and Links to the Macroeconomy This online appendix is divided into four sections. In section A we perform pairwise tests aiming at disentangling
Projected Results % $12,964,000 TBD % $14,311,000 TBD
 California Public Employees Retirement System Actuarial Office P.O. Box 942701 Sacramento, CA 94229-2701 TTY: (916) 795-3240 (888) 225-7377 phone (916) 795-2744 fax www.calpers.ca.gov July 2017 (CalPERS
State Budgets in 2015 and 2016: Most States Show Continued Growth, Some Face Significant Challenges
 State Budgets in 2015 and 2016: Most States Show Continued Growth, Some Face Significant Challenges By Brian Sigritz Overall, state fiscal conditions showed modest improvements in fiscal year 2015. Revenue
SENSITIVITY OF THE INDEX OF ECONOMIC WELL-BEING TO DIFFERENT MEASURES OF POVERTY: LICO VS LIM
 August 2015 151 Slater Street, Suite 710 Ottawa, Ontario K1P 5H3 Tel: 613-233-8891 Fax: 613-233-8250 csls@csls.ca CENTRE FOR THE STUDY OF LIVING STANDARDS SENSITIVITY OF THE INDEX OF ECONOMIC WELL-BEING
Ex-post Assessment of Crisis Prediction Ability of Business Cycle Indicators
 30 th CIRET Conference, New York, October 2010 Session: Real-time monitoring and forecasting Ex-post Assessment of Crisis Prediction Ability of Business Cycle Indicators Jacek Fundowicz, Bohdan Wyznikiewicz
Getting a grip on GASB and pension funding
 Getting a grip on GASB and pension funding Today s presenters Beth Kellar President/CEO Center for State and Local Government Excellence Rich Harris Finance and Compliance Officer Denver Employees Retirement
The current study builds on previous research to estimate the regional gap in
 Summary 1 The current study builds on previous research to estimate the regional gap in state funding assistance between municipalities in South NJ compared to similar municipalities in Central and North
THE U.S. ECONOMY IN 1986
 of women in the labor force. Over the past decade, women have accounted for 62 percent of total labor force growth. Increasing labor force participation of women has not led to large increases in unemployment
Actuarial Note Transmittal
 Actuarial Note Transmittal Independent Fiscal Office House Bill 778, Printer s Number 854 May 9, 2017 The Independent Fiscal Office (IFO) submits an actuarial note for House Bill 778, Printer s Number
The Federal Budget: Sources of the Movement from Surplus to Deficit
 Order Code RS22550 Updated November 8, 2007 Summary The Federal Budget: Sources of the Movement from Surplus to Deficit Marc Labonte Specialist in Macroeconomics Government and Finance Division The federal
STATE AND LOCAL PENSION COSTS: PRE- CRISIS, POST-CRISIS, AND POST-REFORM
 RETIREMENT RESEARCH State and Local Pension Plans Number 30, February 013 STATE AND LOCAL PENSION COSTS: PRE- CRISIS, POST-CRISIS, AND POST-REFORM By Alicia H. Munnell, Jean-Pierre Aubry, Anek Belbase,
Rising public debt-to-gdp can harm economic growth
 Rising public debt-to-gdp can harm economic growth by Alexander Chudik, Kamiar Mohaddes, M. Hashem Pesaran, and Mehdi Raissi Abstract: The debt-growth relationship is complex, varying across countries
Defining the problem: the difference between current deficit and long-term deficits
 KEY POINTS FOR FEDERAL DEFICIT DISCUSSIONS Overview: Unless our budget policies are changed, the imbalance between spending and revenues will eventually become unsustainable rapidly rising debt will threaten
Notes Unless otherwise indicated, the years referred to in describing budget numbers are fiscal years, which run from October 1 to September 30 and ar
 Budgetary and Economic Outcomes Under Paths for Federal Revenues and Noninterest Spending Specified by Chairman Price, March 2016 March 2016 CONGRESS OF THE UNITED STATES Notes Unless otherwise indicated,
WikiLeaks Document Release
 WikiLeaks Document Release February 2, 2009 Congressional Research Service Report RS22550 The Federal Budget: Sources of the Movement from Surplus to Deficit Marc Labonte, Government and Finance Division
Economic Perspectives
 Economic Perspectives What might slower economic growth in Scotland mean for Scotland s income tax revenues? David Eiser Fraser of Allander Institute Abstract Income tax revenues now account for over 40%
Summary of Actuarial Results Valuation Methodology and Assumptions Calculation of Net OPEB Obligation... 16
 TABLE OF CONTENTS SECTION I - MANAGEMENT SUMMARY PAGE Introduction... 1 Summary of Actuarial Results... 2 Change from Prior Valuation... 3 Valuation Methodology and Assumptions... 5 Data... 12 Funding...
GASB 45: Reporting the True Cost of Other Post-Employment Benefits
 A RESEARCH SERIES FROM THE OFFICE OF THE NEW YORK STATE COMPTROLLER Thomas P. DiNapoli State Comptroller DIVISION OF LOCAL GOVERNMENT AND SCHOOL ACCOUNTABILITY LOCAL GOVERNMENT ISSUES IN FOCUS GASB 45:
Cash holdings determinants in the Portuguese economy 1
 17 Cash holdings determinants in the Portuguese economy 1 Luísa Farinha Pedro Prego 2 Abstract The analysis of liquidity management decisions by firms has recently been used as a tool to investigate the
State of Connecticut
 U.S. Public Finance State Rating Report State of Connecticut General Obligation Bonds General Obligation Bonds (2015 Series F) General Obligation Bonds (Green Bonds, 2015 Series G) Analytical Contacts:
A pril 15. It causes much anxiety, with
 Peter S. Yoo is an economist at the Federal Reserve Bank of St. Louis. Richard D. Taylor provided research assistance. The Tax Man Cometh: Consumer Spending and Tax Payments Peter S. Yoo A pril 15. It
Creditor countries and debtor countries: some asymmetries in the dynamics of external wealth accumulation
 ECONOMIC BULLETIN 3/218 ANALYTICAL ARTICLES Creditor countries and debtor countries: some asymmetries in the dynamics of external wealth accumulation Ángel Estrada and Francesca Viani 6 September 218 Following
A Boomtown at Risk: Austin s Mounting Public Pension Debt
 A Boomtown at Risk: Austin s Mounting Public Pension Debt Josh McGee and Paulina S. Diaz Aguirre November 2016 About the Authors Josh McGee is the vice president of public accountability at the Laura and
Private Equity Performance: What Do We Know?
 Preliminary Private Equity Performance: What Do We Know? by Robert Harris*, Tim Jenkinson** and Steven N. Kaplan*** This Draft: September 9, 2011 Abstract We present time series evidence on the performance
Examining the Rural-Urban Income Gap. The Center for. Rural Pennsylvania. A Legislative Agency of the Pennsylvania General Assembly
 Examining the Rural-Urban Income Gap The Center for Rural Pennsylvania A Legislative Agency of the Pennsylvania General Assembly Examining the Rural-Urban Income Gap A report by C.A. Christofides, Ph.D.,