Fiscal Year Ended June 30, 2016 Rancho Cucamonga, CA
|
|
|
- Meghan Allen
- 6 years ago
- Views:
Transcription


1 Fiscal Year Ended June 30, 2016 Rancho Cucamonga, CA
2 Comprehensive Annual Financial Report Fiscal Year Ending June 30, 2016 CUCAMONGA VALLEY WATER DISTRICT Ashford Street Rancho Cucamonga, CA General Manager/CEO Martin E. Zvirbulis, PE Assistant General Manager/ Assistant General Manager Assistant General Manager/ Chief Financial Officer Chief Operating Officer Carrie Corder, CPA Jo Lynne Russo-Pereyra John Bosler, PE Prepared by Finance Division: Finance Manager Accounting Supervisor Senior Accountant Chad Brantley, CPA Agnes Boros, CPA Jennifer Fillinger, CPA
3 Cucamonga Valley Water District Comprehensive Annual Financial Report Fiscal Year Ending June 30, 2016 Introductory Section Letter of Transmittal Board of Directors and Executive Staff Organization Chart Statement of Mission, Vision, Culture, and Values Table of Contents Government Finance Officers Association Certificate of Achievement in Financial Reporting July 1, 2015 District Boundary Page No. i-vi vii viii ix x xi Financial Section Independent Auditors Report 1 Management s Discussion and Analysis 3-9 Basic Financial Statements: Statement of Net Position 10 Statement of Revenues, Expenses and Changes in Net Position 11 Statement of Cash Flows Notes to the Basic Financial Statements Required Supplementary Information: Net Pension Liability and Related Ratios (CalPERS) 52 Net Pension Liability and Related Ratios, Retirement Enhancement Plan (PARS) 54 Net Pension Liability and Related Ratios Excess Benefit Pension Plan 56 Funding Progress for Other Post-Employment Benefits Plan 58 Statistical Section Financial Trends: Changes in Net Position and Net Position by Component Operating Revenue by Source 62 Operating Expenses by Activity 63 Revenue Capacity: Water Production in Acre Feet 64 Water Rate History 65 Water Service Accounts 66 Principal Water Customers 67 Debt Capacity: Ratio of Outstanding Debt 68 Debt Coverage 69 Demographic Information: Demographic and Economic Statistics 70 Principal Employers 71 Operating Indicators: Personnel Trends 72 Other Operating and Capacity Indicators 73
4 Introductory Section
5
6 10440 Ashford Street Rancho Cucamonga, CA (909) Fax (909) Martin E. Zvirbulis Secretary / General Manager/CEO November 3, 2016 Members of the Board of Directors Cucamonga Valley Water District Introduction State law requires that every general-purpose government publish within six months of the close of each fiscal year a complete set of audited financial statements. This report is published to fulfill that requirement for the fiscal year ended June 30, Management assumes full responsibility for the completeness and reliability of the information contained in this report, based upon a comprehensive framework of internal control that it has established for this purpose. Because the cost of internal control should not exceed anticipated benefits, the objective is to provide reasonable, rather than absolute, assurance that the financial statements are free of any material misstatements. Lance, Soll & Lungard, LLP has issued an unmodified ( clean ) opinion on the District s financial statements for the year ended June 30, The independent auditor s report is located at the front of the financial section of this report. Management s discussion and analysis (MD&A) immediately follows the independent auditor s report and provides a narrative introduction, overview, and analysis of the basic financial statements. MD&A complements this letter of transmittal and should be read in conjunction with it. Profile of the District The Cucamonga Valley Water District (the District or CVWD ) is an independent special district that operates under the authority of Division 12 of the California Water Code. The District was incorporated on March 25, 1955, and is governed by a five-member, elected Board of Directors. The District provides water, wastewater, and recycled water services to a population of approximately 190,000 within its 47 square mile service area, which is located in the western area of San Bernardino County, California. The District encompasses the majority of the community of Rancho Cucamonga and portions of the cities of Fontana, Ontario, Upland, and some of the unincorporated areas of San Bernardino County. Residential customers make up approximately 89% of the District s customer base and consume approximately 57% of the water produced annually by the District. The District currently has a total of 29 groundwater wells, of which 21 are in service with a maximum production capacity of approximately 37,292 gallons per minute (or an annual production equivalent of 60,152 acre-feet). In addition, the District has surface and subsurface water rights in four local canyon watersheds with an annual production in 2016 of 1,146 acre-feet. Lastly, untreated imported water from the Sacramento-San Joaquin River Delta through the State Water Project makes up the third source of water available to the District. In 2016, the District purchased 9,682 acre-feet of imported water. The following chart illustrates the water production sources. i
7 Service Beyond Expectation Water Production FYE 2016 Imported Water 24.84% Spring Water 0.40% Local Surface Water 2.54% Groundwater Production 72.22% Uncertainty due to the drought may impact the Metropolitan Water District of Southern California (MWD or Metropolitan) service area and main supply sources, as well as the court order decisions affecting State Water Project operations has raised the possibility that Metropolitan may not have access to the supplies necessary to meet total demands at some point in the future and may have to allocate shortages in supplies to the member agencies. As a result, the District has secured local groundwater resources from other purveyors in the Chino Basin for future use and has increased its use of recycled water. Fiscal Management The District Board of Directors annually adopts an operating and capital budget prior to the new fiscal year. The budget authorizes and provides the basis for reporting and control of financial operations and accountability for the District s enterprise functions, including the Water Utility Fund, Sewer Utility Fund, and Recycled Water Utility Fund. The budget and reporting treatment applied to each fund is consistent with the accrual basis of accounting and the financial statement basis. Each year the District adopts a balanced budget. Local Economy The District office is located in the City of Rancho Cucamonga in San Bernardino County. Rancho Cucamonga is considered a premiere city in the Inland Empire area of California. The District population is projected to increase to approximately 215,100 in 2035, when the District is expected to be fully built out. The community is located 37 miles east of downtown Los Angeles. The following chart highlights the growth of the City of Rancho Cucamonga, the County of San Bernardino, and the State of California. ii Letter of Transmittal
8 Service Beyond Expectation 10 Year Population Growth Rate Rancho Cucamonga vs County & State 2% Rancho Cucamonga San Bernardino County State of California 1% 0% The economics of the communities served by the District are heavily influenced by a multitude of factors. Historically, the construction industry has led the job growth in the Inland Empire. Since the economic downturn, construction industry job growth has improved; however, it has still not fully recovered. On the other hand, growth in logistics has led to job creation in the land-rich Inland Empire. In addition, the health care and manufacturing industries have also demonstrated job growth in the Inland Empire. The Inland Empire consists of 52 cities within the counties of Riverside and San Bernardino. As far as the number of customers served by the District the top two cities are Rancho Cucamonga and Fontana. In 2016, the California Department of Finance released population data that indicates that the City of Fontana is second largest in the region followed by the City of Rancho Cucamonga as third. The San Bernardino Assessor s office reported that the City of Rancho Cucamonga has the second highest assessed valuation in the region followed by Fontana as the fifth highest. Clearly, these two cities served by CVWD are strong contributors to the economic engine of the Inland Empire. According to the State of California Employment Development Department, in 2006 the unemployment rate in Rancho Cucamonga was at a ten-year low of 3.1%. However, unemployment rates increased to a high of 9.4% in Unemployment has since fallen to a rate of 4.8% in June of 2016, which is lower than the region as well as the State of California. California s water supply continues to be a concern due to drought conditions and projected population increases. This concern has increased interest in recycled water for groundwater replenishment purposes. The District has expanded and will continue to expand its conservation efforts and the use of local sources such as groundwater and canyon water. Such expansions will decrease the District s dependence on imported water and increase water source reliability. The District will also continue to work with local and regional water suppliers in planning and constructing other water delivery systems throughout its service area. Letter of Transmittal iii
9 Service Beyond Expectation During the past five fiscal years, the District s customer base has grown slowly at around 0.34% per year. Water production increased each year from 2011 through 2014 but fell significantly in 2015 and further still in Improvements in economic conditions and less rainfall in 2013 and 2014 contributed to the increased demand for water in those years causing annual usage per customer to rise as high as 1.09 acre-feet. However, in 2015 water production per customer fell to 0.97 acre-feet and to 0.78 acre-feet for This decrease in water usage is consistent with the statewide drought messaging that began in August 2014 and culminated with the Governor s executive order on April 1, During the fiscal years 2011 through 2014, water sales revenues increased by approximately 9.3% per year on average, then fell by 9.0% in 2015, and increased by 2.8% in The increase in 2016 was caused by customer conservation that was slightly less than the conservation target set by the California State Water Resources Control Board (SWRCB). From 2011 to 2015 water rates increased about 5% per year. In FY2016, the District entered Drought Stage 6 in order to comply with the conservation target set by the SWRCB. Drought Stage 6 caused a 58% increase in water rates. For FY2017 the SWRCB has allowed water purveyors to self-certify their supply of water in order to set their own needed level of conservation. CVWD is able to certify a 3-year water supply that does not require any mandatory conservation. For this reason, staff are budgeting a reduction in rates of 27% to Drought Stage 1 prices. Meter charge revenue has increased by approximately 6.8% per year on average and water service revenue has increased 1.8% per year on average. The District s policy direction ensures that all revenues from user charges generated from District customers must support all District operations including capital project funding. The District does not receive property tax subsidies. Water, recycled water, and sewer rates are user charges imposed on customers for services and are the primary component of the District s revenue. Water and recycled water rates are composed of a fixed meter charge and a commodity (usage) charge. Sewer rates are billed based on a unit of measure called an equivalent dwelling unit (EDU), which is equal to the average amount of wastewater flow from a single-family household. The District bills each residential customer a fixed charge for each EDU. The following chart illustrates the average bi-monthly utility bill. $160 Average Residential Bi-Monthly Bill by Year $140 Sewer Services Water Commodity* Service Charge $120 $100 $80 $60 $40 $20 $0 FYE 2007 $97.42 iv Letter of Transmittal FYE 2008 $ FYE 2009 $ FYE 2010 $ FYE 2011 $ FYE 2012 $ FYE 2013 $ FYE 2014 $ FYE 2015 $ FYE 2016** $ * Based on water service supplied by a 3/4" water meter and using 42 hcf per billing period (1 hcf = gallons) ** FYE 2016 CVWD was in Drought Stage 6 with a goal of 35% conservation (average usage at 27 hcf).
10 Service Beyond Expectation Long-term Financial Planning The District s financial plan includes the establishment of reserve funds in accordance with the District s Reserve and Benchmark Policy. Reserve funds are set to ensure the continued orderly operation of the District s water, recycled water and sewer systems, the provision of services to customers at established levels, and the continued stability of the District s rate structure. The District has committed to the following funds and objectives in the Reserve Policy; as of June 30, The District will strive to adopt balanced budgets in all operating funds. 2. Capital Reserves are established to provide funds for capital facility and equipment replacement. 3. Liquidity Reserves are established to safeguard the financial flexibility and stability of the District and to maintain stable customer charges and rates. 4. Restricted Reserves are maintained to comply with restrictions imposed by outside sources such as creditors, grantors, contributors, laws, or regulations. Debt Administration The District has earned and maintained for 2016 a debt rating of AA+ on the Certificates of Participation and AA on the Revenue Bonds from Standard and Poor s. The District s outstanding debt as of June 30, 2016 consists of three Certificate of Participation Issuances (C.O.P. s) and three Revenue Bonds, as follows: Year of Issuance Use of Proceeds 2009 C.O.P.'s Provided funds for construction of the Frontier Project, well and reservoir acquisition, and other improvements to District facilities Clean Renewable Provided funding related to renewable energy Energy Bonds installations in the District's Frontier Project building 2011 C.O.P. s Provided funds to defease the 2000 C.O.P. s and the 2001 C.O.P.'s Revenue Bonds Provided funds for construction of improvements to water treatment plants and other District facilities Revenue Bonds Provided funds for construction of improvements to water treatment plants and other District facilities. Also used to payoff 2003 C.O.P Revenue Bonds Provided funds to payoff 2006 C.O.P. and a portion of the 2009 C.O.P. Relevant Financial Policies Internal Control Structure District management is responsible for the establishment and maintenance of the internal control structure that ensures that the assets of the District are protected from loss, theft, or misuse. The internal control structure also ensures that adequate accounting data are compiled to allow for the preparation of financial statements in conformity with generally accepted accounting principles. The District s internal control structure is designed to provide reasonable assurance that these objectives are met. The concept of reasonable assurance recognizes that (1) the cost of a control should not exceed the benefits likely to be derived and (2) the valuation of costs and benefits requires estimates and judgments by management. Letter of Transmittal v
11 Service Beyond Expectation Major Initiatives The activities of the Board and staff at the District are driven by our mission statement, To Provide High-Quality, Safe, and Reliable Drinking Water and Wastewater Services, While Practicing Good Stewardship of Natural and Financial Resources. In addition to our mission, major District initiatives are guided by our Strategic Vision. The Strategic Vision was developed nearly eight years ago and is continually re-tooled to ensure it is reflective of our changing environment, opportunities and trends within our industry. In 2012, the District refined its focus and direction to identify what areas are of great importance to our organization, customers and stakeholders. The primary areas of focus include Service, Water and People. Service relates to the identification of the needs of our customers and stakeholders that meets and exceeds their expectations. Water is the essential service that our organization provides and our ability to provide it consistently and at a reasonable price is imperative. The District has upgraded the treatment processes at the Lloyd Michael Water Treatment Plant (LMWTP), which will ensure our ability to meet changing regulatory requirements while continuing to provide high quality water to our customers. People are identified as the customers that we serve and the dedicated staff that provides the services to support our mission. Externally, key areas of focus include communication, education and outreach. Internally, succession planning, training and improving communication with employees is essential to our continued success. It is apparent that programs that develop effective leadership skills and encourage high performance and personal accountability are essential to prepare the next generation of leaders in our organization and industry. Award for Excellence in Financial Reporting The Government Finance Officers Association (GFOA) awarded a Certificate of Achievement for Excellence in Financial Reporting to the Cucamonga Valley Water District for its comprehensive annual financial report (CAFR) for the fiscal year ended June 30, This was the fourteenth consecutive year that the District has received this prestigious award. In order to be awarded a Certificate of Achievement, the District published an easily readable and efficiently organized CAFR. This report satisfied both generally accepted accounting principles (GAAP) and applicable legal requirements. GFOA financial reporting guidelines and standards exceed the minimum disclosure requirements of state law, and provide for maximum disclosure to the public. A Certificate of Achievement is valid for a period of one year only. We believe that our current CAFR continues to meet the Certificate of Achievement Program s requirements and we are submitting it to the GFOA to determine its eligibility for another certificate. Acknowledgements Preparation of this report was accomplished by the combined efforts of District staff. We appreciate the dedicated efforts and professionalism that these staff members contribute to the service of the District s customers. The contributions made by Chad Brantley, Finance Manager, Agnes Boros, Accounting Supervisor, and Jennifer Fillinger, Senior Accountant, deserve special recognition. We would also like to thank and recognize the members of the Board of Directors and especially the Finance Committee members for their continued support in planning and implementation of the Cucamonga Valley Water District s fiscal policies. Respectfully submitted, Martin Zvirbulis General Manager/CEO Carrie Corder Assistant General Manager / CFO vi Letter of Transmittal


12 Cucamonga Valley Water District Service Beyond Expectation Board of Directors and Executive Staff James V. Curatalo, President Luis Cetina, Vice President Oscar Gonzalez, Director Randall James Reed, Director Kathleen Tiegs, Director Martin Zvirbulis General Manager/CEO Jo Lynne Russo-Pereyra Assistant General Manager John Bosler Assistant General Manager / COO Carrie Corder Assistant General Manager / CFO Board of Directors and Executive Staff vii
13 Service Beyond Expectation viii Organizational Chart

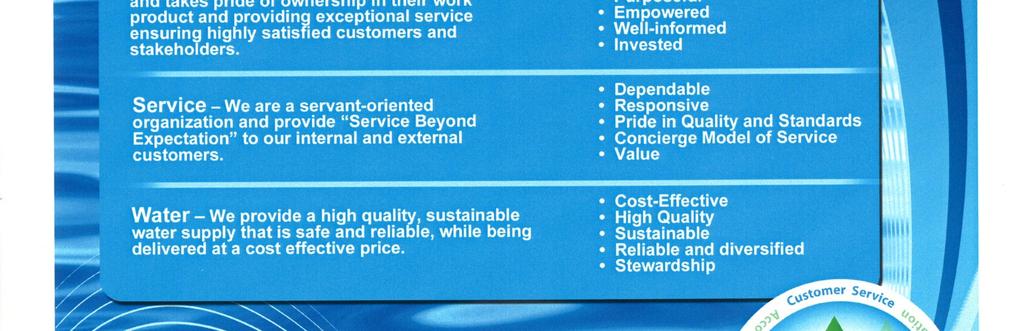
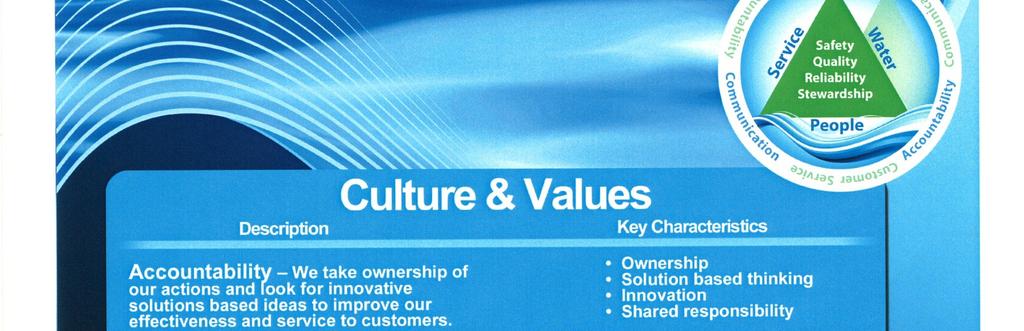

14 Service Beyond Expectation CVWD Mission, Vision, Culture & Values ix
15 Service Beyond Expectation x Certificate of Achievement in Financial Reporting - July 1, 2015


16 Service Beyond Expectation District Boundary xi
17 < Page Intentionally Left Blank >
18 Financial Section
19 Board of Directors Cucamonga Valley Water District Rancho Cucamonga, California Report on the Financial Statements INDEPENDENT AUDITORS REPORT We have audited the accompanying financial statements Cucamonga Valley Water District (the District) as of and for the year ended June 30, 2016, and the related notes to the financial statements, which collectively comprise the District s basic financial statements as listed in the table of contents. Management s Responsibility for the Financial Statements Management is responsible for the preparation and fair presentation of these financial statements in accordance with accounting principles generally accepted in the United States of America; this includes the design, implementation, and maintenance of internal control relevant to the preparation and fair presentation of financial statements that are free from material misstatement, whether due to fraud or error. Auditor s Responsibility Our responsibility is to express opinions on these financial statements based on our audit. We conducted our audit in accordance with auditing standards generally accepted in the United States of America and the standards applicable to financial audits contained in Government Auditing Standards, issued by the Comptroller General of the United States; and the State Controller s Minimum Audit Requirements for California Special Districts. Those standards require that we plan and perform the audit to obtain reasonable assurance about whether the financial statements are free from material misstatement. An audit involves performing procedures to obtain audit evidence about the amounts and disclosures in the financial statements. The procedures selected depend on the auditor s judgment, including the assessment of the risks of material misstatement of the financial statements, whether due to fraud or error. In making those risk assessments, the auditor considers internal control relevant to the entity s preparation and fair presentation of the financial statements in order to design audit procedures that are appropriate in the circumstances, but not for the purpose of expressing an opinion on the effectiveness of the entity s internal control. Accordingly, we express no such opinion. An audit also includes evaluating the appropriateness of accounting policies used and the reasonableness of significant accounting estimates made by management, as well as evaluating the overall presentation of the financial statements. We believe that the audit evidence we have obtained is sufficient and appropriate to provide a basis for our audit opinions. An Association of Independent Accounting Firms 203 N. Brea Blvd., Suite 203 Brea, CA Phone:
 as of June 30, 2016, and the respective changes in financial position and cash flows thereof for the year then")
20 To the Board of Directors Cucamonga Valley Water District Rancho Cucamonga, California Opinions In our opinion, the financial statements referred to above present fairly, in all material respects, the respective financial position of the Cucamonga Valley Water District (the District) as of June 30, 2016, and the respective changes in financial position and cash flows thereof for the year then ended in accordance with accounting principles generally accepted in the United States of America. Other Matters Required Supplementary Information Accounting principles generally accepted in the United States of America require that the management s discussion and analysis, schedule of changes in net pension liability and related ratios, and schedule of plan contributions, be presented to supplement the basic financial statements. Such information, although not a part of the basic financial statements, is required by the Governmental Accounting Standards Board, who considers it to be an essential part of financial reporting for placing the basic financial statements in an appropriate operational, economic, or historical context. We have applied certain limited procedures to the required supplementary information in accordance with auditing standards generally accepted in the United States of America, which consisted of inquiries of management about the methods of preparing the information and comparing the information for consistency with management s responses to our inquiries, the basic financial statements, and other knowledge we obtained during our audit of the basic financial statements. We do not express an opinion or provide any assurance on the information because the limited procedures do not provide us with sufficient evidence to express an opinion or provide any assurance. Other Information Our audit was conducted for the purpose of forming opinions on the financial statements that collectively comprise the District s basic financial statements. The introductory section and statistical section are presented for purposes of additional analysis and are not a required part of the basic financial statements. The introductory and statistical sections have not been subjected to the auditing procedures applied in the audit of the basic financial statements and, accordingly, we do not express an opinion or provide any assurance on them. Other Reporting Required by Government Auditing Standards In accordance with Government Auditing Standards, we have also issued our report dated October 27, 2016 on our consideration of the District s internal control over financial reporting and on our tests of its compliance with certain provisions of laws, regulations, contracts, and grant agreements and other matters. The purpose of that report is to describe the scope of our testing of internal control over financial reporting and compliance and the results of that testing, and not to provide an opinion on internal control over financial reporting or on compliance. That report is an integral part of an audit performed in accordance with Government Auditing Standards in considering the District s internal control over financial reporting and compliance. Brea, California October 27, 2016
21 Management s Discussion and Analysis For the Year Ended June 30, 2016 This section of the District s annual financial report presents our analysis of the District s financial performance during the fiscal year that ended on June 30, Please read it in conjunction with the basic financial statements, which follow this section. Financial Highlights The District s net position increased by $15,585 thousand or 5.29 percent. During the year the District s revenues increased 1.02 percent to $84,704 thousand, while expenses decreased 4.51 percent to $72,129. Capital contributions to the District amounted to $3,010 thousand. Overview of the Financial Statements The discussion and analysis are intended to serve as an introduction to the District s basic financial statements. The District s basic financial statements comprise two components: Financial Statements and Notes to the Financial Statements. This report also contains other supplementary information in addition to the basic financial statements themselves. Required Financial Statements The financial statements of the District report information about the District using accounting methods similar to those used by private sector companies. These statements offer short-term and long-term financial information about its activities. The Statement of Net Position (page 10) includes all of the District s investments in resources (assets) and the obligations to creditors (liabilities). It also provides the basis for evaluating the capital structure of the District and assessing the liquidity and financial flexibility of the District. All of the current year s revenues and expenses are accounted for in the Statement of Revenues, Expenses and Changes in Net Position (page 11). This statement measures the success of the District s operations over the past year and can be used to determine whether the District has successfully recovered all its costs through its user fees and other charges, profitability, and credit worthiness. The final required financial statement is the Statement of Cash Flows (pages 12 and 13). The primary purpose of this statement is to provide information about the District s cash receipts and cash payments during the reporting period. The statement reports cash receipts, cash payments, and net changes in cash resulting from operations, investing, and financing activities and provides answers to such questions as where did cash come from, what was cash used for, and what was the change in cash balance during the reporting period. Financial Analysis of the District Our analysis of the District begins on page 10 of the financial statements. One of the most important questions to ask about the District s finances is Whether the District, as a whole, is better off or worse off as a result of the year s activities? The Statement of Net Position, and the Statement of Revenues, Expenses and Changes in Net Position report information about the District s activities in a way that will help answer this question. Measuring the change in the District s net position - the difference between assets and liabilities - is one way to measure financial health. Over time, increases or decreases in the District s net position are one indicator of whether its financial health is improving or deteriorating. However, one will need to consider other nonfinancial factors such as changes in economic conditions, population growth, zoning, and new or changed government legislation. Management s Discussion and Analysis 3
22 Management s Discussion and Analysis, continued For the Year Ended June 30, 2016 Condensed Statement of Net Position To begin our analysis, a summary of the District s Statements of Net Position are presented in Table A-1. TABLE A-1 Condensed Statements of Net Position (In thousands of dollars) Fiscal Fiscal Total Year Year Dollar Percent Change Change (1) Current and Noncurrent Assets $ 149,894 $ 133,909 $ 15, % Capital Assets 417, ,431 7, % Total Assets 567, ,340 23, % Deferred outflows of resources 9,298 5,795 3, % Long-term Liabilities 220, , % Other Liabilites 40,081 30,868 9, % Total Liabilities 261, ,226 9, % Deferred inflows of resources 5,470 3,450 2,020 N/A Net investment in Capital Assets 230, ,737 10, % Unrestricted 79,768 74,722 (1) 5, % Total Net Position $ 310,044 $ 294,459 $ 15, % Note (1) Beginning Net Position and assets have been restated due to prior period adjustments, see Note 20 to the basic financial statements. As can be seen from the table above, net position increased $15,585 thousand to $310,044 thousand in fiscal year 2016, up from $294,459 thousand in fiscal year The increase in Current and Noncurrent Assets can be primarily attributed to an increase in cash and cash equivalents and investments which is due to funds being held for future capital improvement projects. Capital Assets increased due to the investment of Revenue Bond proceeds and reserve funds in capital improvement projects. Short term liabilities increased due primarily to increases in both Accounts Payable for capital improvement projects in process at fiscal year-end and the Intergovernmental Payable (Note 8). 4 Management s Discussion and Analysis
23 Management s Discussion and Analysis, continued For the Year Ended June 30, 2016 Statement of Revenues, Expenses and Changes in Net Position TABLE A-2 Condensed Statements of Revenues, Expenses and Changes in Net Position (In thousands of dollars) Fiscal Fiscal Total Year Year Dollar Percent Change Change Operating Revenues: (1) Water Sales $ 47,914 $ 45,901 $ 2, % Meter Charges 14,596 13,236 (1) 1, % Water Services 1,267 1, % Sewer Services 17,422 16,101 (1) 1, % Nonoperating Revenues: Investment income 1, % Rent and lease revenue % Gain on disposal of assets - 84 (84) (100.00)% Other nonoperating revenue 1,498 6,124 (4,626) (75.54)% Total Revenues 84,704 83, % Operating Expenses: Source of supply 11,287 17,671 (6,384) (36.13)% Pumping operations 6,485 6,933 (448) (6.46)% Water treatment 4,381 3,270 1, % Transmission and distribution 3,284 3,399 (115) (3.38)% Collection and transmission 14,243 13, % Customer accounts 2,266 2, % General and administrative 11,134 10, % Depreciation and amortization 11,361 10,337 1, % Nonoperating Expenses: Interest expense 6,052 6,815 (763) (11.20)% Amortization of deferred bond costs and refunding % Loss on disposal of assets % Other nonoperating expenses 1, % Total Expenses 72,129 75,532 (3,403) (4.51)% Net Income/(Loss) Before Capital Contributions 12,575 8,318 4, % Capital Contributions 3,010 2, % Changes in Net Position 15,585 10,945 4, % Beginning Net Position 294,459 (1) 283,514 (1) 10, % Ending Net Position $ 310,044 $ 294,459 $ 15, % Note (1) Amounts restated due to prior period adjustments Management s Discussion and Analysis 5
24 Management s Discussion and Analysis, continued For the Year Ended June 30, 2016 While the Statement of Net Position shows the change in financial position, the Statement of Revenues, Expenses and Changes in Net Position provides answers as to the nature and source of these changes. As can be seen in Table A-2 on page 5, net income before capital contributions of $12,575 thousand and capital contributions of $3,010 thousand were the sources of the increase in Net Position of $15,585 thousand in fiscal year A closer examination of the source of changes in net position reveals that the District s revenues increased by $854 thousand to $84,704 thousand in fiscal year 2016 from $83,850 thousand in fiscal year 2015 due primarily to increases in operating revenues. In particular, water sales increased $2,013 thousand due to the implementation of Drought Rates in order to meet the State Government mandated water conservation program that remained in effect through June 30, Meter charges increased $1,360 thousand due to a slight increase in customer connections and a rate increase. Non-operating revenue decreased $4,626 thousand due to a one-time grant received in the prior year. The decrease in operating expenses is due primarily to a decrease in the amount of imported water purchased driven by lower water consumption. The prior period adjustment, decreasing beginning Net Position by $7,046 thousand, is due to a correction of an error in estimating unbilled revenue at the end of prior fiscal year (see Note 20 to Basic Financial Statements). Operating Revenues Water Sales TABLE A-2a Water Sales (In thousands of dollars) Fiscal Fiscal Total Year Year Dollar Percent Change Change Customer Type: (1) Domestic $ 31,654 $ 28,564 $ 3, % Irrigation and Landscape 11,650 11,323 (1) % Other Water Agencies - 2,893 (2,893) (100.00)% Industrial 4,195 2,170 (1) 2, % Construction (1) (501) (79.15)% Canyon Source Water (35) (11.01)% Total Water Sales $ 47,914 $ 45,901 $ 2, % Note (1) Amounts restated due to prior period adjustments. Domestic water sales for the fiscal year 2016 increased $3,090 thousand due to the net result of increasing water rates to Drought Stage 6 and the decreasing water consumption due to the State Government mandated water conservation in effect throughout the fiscal year. Water consumption by industrial customers did not decrease at the same rate as domestic, irrigation and landscape customers. Sales to other water agencies decreased $2,893 thousand since there were no sales to San Gabriel Valley Water Company. Construction water sales decreased $501 due to a reduction in the use of water for building activity in the service area. 6 Management s Discussion and Analysis
25 Management s Discussion and Analysis, continued For the Year Ended June 30, 2016 Capital Asset Administration At June 30, 2016, the District had invested $417,344 thousand in a broad range of infrastructure as shown in Table A-3. TABLE A-3 Capital Assets (In thousands of dollars) Fiscal Fiscal Total Year Year Dollar Percent Change Change Non-Depreciable Assets: Land $ 6,876 $ 4,565 $ 2, % Water Rights 92,908 92, % Construction in Progress 8,434 59,545 (51,111) (85.84)% Total Non-Depreciable Assets 108, ,018 (48,800) (31.08)% Depreciable Assets: Intangibles % Source of Supply 24,579 24, % Pumping Plant 21,618 18,134 3, % Transmission and Distribution 202, ,343 9, % Treatment plant 110,576 59,121 51, % General Water 47,832 47, % Wastewater Reclamation 5,753 5, % Pumping Station % Collection and Transmission 69,036 67,827 1, % General Sewer 9,444 9, % General Frontier Project % Total Depreciable Assets 491, ,297 67, % Less: Accumulated Depreciation (182,519) (171,884) (10,635) (6.19)% Net Depreciable Assets 309, ,413 56, % Total Capital Assets, Net $ 417,344 $ 409,431 $ 7, % The following is a summary of some of the major improvements to the system during fiscal year This year s major capital asset additions include (in thousands of dollars): Various water treatment facilities $ 51,455 Various water distribution mains 10,017 Pumps and pumping equipment 3,484 Land purchase 2,312 Buildings and equipment 1,383 Various sewer collection and transmission mains 1,210 Wells 350 Recycled water distribution mains and connections 182 Various developer water and sewer infrastructure 136 Management s Discussion and Analysis 7
26 Management s Discussion and Analysis, continued For the Year Ended June 30, 2016 In table A-4, the District s fiscal year 2017 Capital Budget is $34,138 thousand for capital projects, principally for upgrading the automated meter reading network, meter replacements, groundwater treatment, pumps and pumping equipment, new water and sewer mains, and reservoir improvements. The District believes these projects can be financed from available resources provided by projected cash flows and proceeds from debt issuances. More information about the District s Capital Assets is presented in Note 5 of the Notes to Basic Financial Statements. Debt Administration TABLE A-4 Fiscal Year 2017 Capital Budget (In thousands of dollars) Depreciable Assets: Source of Supply $ 590 Pumping Plant 3,818 Reservoirs 3,023 Transmission and Distribution 4,741 Treatment plant 6,321 General Water 9,538 Recycled Water Distribution 300 Sewer Collection and Transmission 5,573 General Sewer 234 Total Depreciable Assets 34,138 Less: Accumulated Depreciation (8,150) Total Fiscal Year 2017 Capital Budget, Net $ 25,988 During the year, the District s long-term debt increased $1,152 thousand which can be attributed the normal debt principal repayments and the defeasance of the 2006 and partial defeasance of the 2009 Certificates of Participation through the issuance of the 2016 Revenue Bonds. Additional information on long term debt is presented in Note 7 to Basic Financial Statements. TABLE A-5 Long-Term Debt (In thousands of dollars) Fiscal Fiscal Year Year Dollar Change Net Certificates of Participation $ 119,533 $ 146,875 $ (27,342) Net Revenue Bonds 73,202 53,505 19,697 Leases Payable 10,533 3,457 7,076 Loan Payable (35) Compensated Absences 1,845 1, Net OPEB Obligation 3,510 3, Net CalPERS Pension Plan Obligation 17,999 15,885 2,114 Net PARS Pension Plan Obligation (598) Net Excess Benefit Plan Obligation 1,265 1,520 (255) Total Long-term debt $ 228,371 $ 227,219 $ 1,152 8 Management s Discussion and Analysis
27 Management s Discussion and Analysis, continued For the Year Ended June 30, 2016 Economic Factors and Next Year s Budget and Rates The District s Board of Directors and management considered many factors when setting the fiscal year 2016 budget, user fees, and charges. These indicators were taken into consideration when adopting the District s budget for year TABLE A-6 Fiscal Year 2016 Actual vs. Fiscal Year 2017 Budget (In thousands of dollars) Actual Budget Total Fiscal Year Fiscal Year Dollar Percent Change Change Operating Revenues $ 81,199 $ 82,784 $ 1, % Nonoperating Revenues 3,505 2,219 (1,286) (36.69)% Total Revenues 84,704 85, % Depreciation Expense 11,361 8,150 (3,211) (28.26)% Other Operating Expenses 53,080 59,524 6, % Nonoperating Expenses 7,688 15,220 7, % Total Expenses 72,129 82,894 10, % Net Income/(Loss) Before Capital Contributions 12,575 2,109 (10,466) (83.23)% Capital Contributions 3,010 2,499 (511) (16.98)% Changes in Net Position 15,585 4,608 (10,977) (70.43)% Beginning Net Position 294,459 (1) 310,044 15, % Total Net Position $ 310,044 $ 314,652 $ 4, % Note (1) Beginning Net Position restated due to prior period adjustments Contacting the District s Assistant General Manager / CFO This financial report is designed to provide our customers and creditors with a general overview of the District finances and to demonstrate the District s accountability for the money it receives. If you have questions about this report or need additional financial information, please contact Carrie Corder, Assistant General Manager/CFO, at (909) Management s Discussion and Analysis 9
28 Statement of Net Position June 30, 2016 Recycled Water Sewer Water Frontier Utility Utility Utility Project Fund Fund Fund Foundation Totals CURRENT ASSETS: Cash and cash equivalents (note 2) $ 20,320,600 $ 7,409,309 $ - $ 27,614 $ 27,757,523 Investments (note 2) 28,078,037 31,409, ,487,365 Customer receivables, net 11,902,197 1,651, ,643-13,722,413 Accounts receivable 459, ,436-4,375 1,220,650 Due from other funds (note 6) 550, ,312 Accrued interest 171,704 54, ,365 Prepaid expense and deposit 636,731 90, ,169 Inventories 726, ,876 TOTAL CURRENT ASSETS 62,846,296 41,371, ,577 31, ,419,673 NONCURRENT ASSETS: Restricted Cash and cash equivalents (note 2 & 3) 12,416,949 11,594, ,011,766 Water in storage (note 4) 20,141, ,141,287 Prepaid bond insurance 581, ,238 Net pension asset (note 15) 604, ,741 14, ,999 Capital assets (note 5): Non-depreciable capital assets 108,085, ,790 2, ,218,086 Depreciable capital assets, net 262,020,779 42,188,920 4,907,140 9, ,126,144 TOTAL NONCURRENT ASSETS 403,849,990 54,034,268 4,924,957 9, ,818,520 TOTAL ASSETS 466,696,286 95,406,079 5,094,534 41, ,238,193 DEFERRED OUTFLOWS OF RESOURCES: Pension plans deferred outflows 4,491, ,912 95,578-5,514,522 Deferred charge on refunding 3,783, ,783,323 TOTAL DEFERRED OUTFLOWS OF RESOURCES 8,274, ,912 95,578-9,297,845 LIABILITIES: Current: Accounts payable 7,621,512 3,597,433 91,530 18,567 11,329,042 Interest payable 2,801, ,801,412 Accrued expense payable 2,292,777 47,737 4,418-2,344,932 Unearned revenue 321, ,280 Customer deposits 2,324, ,324,781 Due to other funds (note 6) , ,312 Intergovernmental payable (note 8) - 11,594, ,594,817 Water Held for Inland Empire Utilities Agency (note 9) 1,384, ,384,074 Lease payable (note 7) 1,546, ,546,326 Compensated absences payable (note 7) 780, ,720 20, ,130 Certificates of participation (note 7) 3,519, ,519,286 Revenue bonds (note 7) 1,385, ,385,000 Loans Payable (note 7) ,435-34,435 Total current liabilities 23,976,490 15,384, ,063 18,567 40,080,827 Noncurrent: Net other post-employment benefits obligation (notes 7 & 17) 2,818, ,935 51,373-3,510,119 Net pension liability (notes 7) 15,642,255 3,377, ,028-19,263,273 Lease payable (note 7) 8,987, ,987,030 Compensated absences payable (note 7) 742, ,736 19, ,529 Certificates of participation, net (note 7) 116,013, ,013,584 Revenue bonds, net (note 7) 71,817, ,817,601 Loans Payable (note 7) , ,973 Total noncurrent liabilities 216,021,688 4,155, , ,941,109 TOTAL LIABILITIES 239,998,178 19,540,368 1,464,823 18, ,021,936 DEFERRED INFLOWS OF RESOURCES: Pension plans deferred inflows(notes 7) 4,443, ,775 74,907-5,469,998 TOTAL DEFERRED INFLOWS OF RESOURCES 4,443, ,775 74,907-5,469,998 NET POSITION: Net investment in capital assets (note 10) 183,037,586 42,318,710 4,910,074 9, ,275,675 Unrestricted (note 11) 47,491,561 33,523,138 (1,259,692) 13,422 79,768,429 TOTAL NET POSITION $ 230,529,147 $ 75,841,848 $ 3,650,382 $ 22,727 $ 310,044,104 See accompanying independent auditors report and notes to the basic financial statements 10 Statement of Net Position
29 Statement of Revenues, Expenses and Changes in Net Position For the Year Ended June 30, 2016 Recycled Water Sewer Water Frontier Utility Utility Utility Project Fund Fund Fund Foundation Totals OPERATING REVENUES: Water Sales $ 47,111,498 $ - $ 802,804 $ - $ 47,914,302 Meter Charges 14,482, ,147-14,595,971 Water Services 1,266, ,266,664 Sewer Services - 17,421, ,421,827 TOTAL OPERATING REVENUES 62,860,632 17,421, ,305-81,198,764 OPERATING EXPENSES: Source of supply 10,910, ,033-11,286,663 Pumping operations 6,485, ,485,127 Water treatment 4,380, ,380,765 Transmission and distribution 3,284, ,284,484 Collection and transmission - 14,240, ,240,864 Customer accounts 1,960, ,009 3,610-2,266,296 General and administrative 9,139,955 1,626, ,672 99,418 11,134,118 Depreciation and amortization 9,543,513 1,692, ,044 11,217 11,361,306 TOTAL OPERATING EXPENSES 45,705,121 17,861, , ,635 64,439,623 NET OPERATING INCOME (LOSS) 17,155,511 (439,651) 153,916 (110,635) 16,759,141 NONOPERATING REVENUES (EXPENSES): Investment income 1,185, , ,569,781 Taxes and assessments Rent and lease revenue 437, ,184 Interest expense (6,052,051) - (384) - (6,052,435) Amortization of deferred charge on refunding (225,345) (225,345) Gain (loss) on disposal of assets (5,256) (897) - - (6,153) Other nonoperating revenues 1,348,844 19,873 28, ,358 1,498,448 Other nonoperating expenses (1,165,889) (236,543) (2,875) - (1,405,307) TOTAL NONOPERATING REVENUES (EXPENSES) (4,477,336) 167,072 25, ,358 (4,183,792) NET INCOME (LOSS) BEFORE CAPITAL CONTRIBUTIONS 12,678,175 (272,579) 179,030 (9,277) 12,575,349 CAPITAL CONTRIBUTIONS (note 12) 2,654, , ,009,934 CHANGE IN NET POSITION 15,332,324 83, ,030 (9,277) 15,585,283 NET POSITION - BEGINNING 222,245,565 75,766,293 3,460,598 32, ,504,460 PRIOR PERIOD ADJUSTMENT (NOTE 20) (7,048,742) (7,651) 10,754 - (7,045,639) NET POSITION - ENDING $ 230,529,147 $ 75,841,848 $ 3,650,382 $ 22,727 $ 310,044,104 See accompanying independent auditors report and notes to the basic financial statements Statement of Revenues, Expenses and Changes in Net Position 11
30 Statement of Cash Flows For the Year Ended June 30, 2016 Recycled Water Sewer Water Frontier Utility Utility Utility Project Fund Fund Fund Foundation Totals CASH FLOWS FROM OPERATING ACTIVITIES: Receipts from customers $ 66,498,723 $ 17,385,389 $ 922,792 $ - $ 84,806,904 Receipts from others 9, ,358 Payment to suppliers (27,297,908) (14,411,630) (460,262) (84,281) (42,254,081) Payment to employees (7,729,657) (1,601,577) (153,852) - (9,485,086) NET CASH PROVIDED (USED) BY OPERATING ACTIVITIES 31,480,516 1,372, ,678 (84,281) 33,077,095 CASH FLOWS FROM NONCAPITAL FINANCING ACTIVITIES: Due to (due from) other funds 142,571 - (142,571) - - Other noncapital financing activities 1,348,844 19,873 28,373 39,233 1,436,323 Taxes and assessments NET CASH PROVIDED (USED) BY NONCAPITAL FINANCING ACTIVITIES 1,491,450 19,873 (114,198) 39,233 1,436,358 CASH FLOWS FROM CAPITAL AND RELATED FINANCING ACTIVITIES: Proceeds from debt issuance 19,783, ,783,186 Principal payments - Certificates of Participation (28,111,335) (28,111,335) Principal payments - lease payable (1,139,607) (1,139,607) Principal payments - loan payable - - (34,409) - (34,409) Interest expense (8,537,031) - (384) - (8,537,415) Capital fees collected for/(paid to) Inland Empire Utilities Agency - 4,439, ,439,726 Additions to utility plant (16,141,140) (523,340) (156,812) - (16,821,292) Other capital and related financing activities (1,009,075) (236,543) (2,875) - (1,248,493) Cash contributions received in aid of construction 2,604, , ,874,434 NET CASH PROVIDED (USED) BY CAPITAL AND RELATED FINANCING ACTIVITIES (24,334,853) 3,950,128 (194,480) - (20,579,205) CASH FLOWS FROM INVESTING ACTIVITIES: Investment income 1,659, , ,201,696 Purchases of investments (22,882,636) (7,627,545) - - (30,510,181) Proceeds from sales and maturities of investments 18,009,819 2,580, ,589,992 Rent and lease revenue 437, ,184 NET CASH PROVIDED (USED) BY INVESTING ACTIVITIES (2,776,009) (4,505,300) - - (7,281,309) NET INCREASE/(DECREASE) IN CASH AND CASH EQUIVALENTS 5,861, ,883 - (45,048) 6,652,939 CASH AND CASH EQUIVALENTS - BEGINNING OF YEAR 26,876,445 18,167,243-72,662 45,116,350 CASH AND CASH EQUIVALENTS - END OF YEAR $ 32,737,549 $ 19,004,126 $ - $ 27,614 $ 51,769,289 RECONCILIATION OF CASH AND CASH EQUIVALENTS TO THE STATEMENT OF NET POSITION: Cash and cash equivalents $ 20,320,600 $ 7,409,309 $ - $ 27,614 $ 27,757,523 Cash and cash equivalents - restricted 12,416,949 11,594, ,011,766 TOTAL CASH AND CASH EQUIVALENTS $ 32,737,549 $ 19,004,126 $ - $ 27,614 $ 51,769,289 (continued on next page) See accompanying independent auditors report and notes to the basic financial statements 12 Statement of Cash Flows
31 Statement of Cash Flows, continued For the Year Ended June 30, 2016 Recycled Water Sewer Water Frontier Utility Utility Utility Project Fund Fund Fund Foundation Totals RECONCILIATION OF OPERATING INCOME (LOSS) TO NET CASH PROVIDED (USED) BY OPERATING ACTIVITIES: Operating income (Loss) $ 10,106,769 $ (447,302) $ 164,670 $ (110,635) $ 9,713,502 Depreciation and amortization 9,543,513 1,692, ,044 11,217 11,361,306 Changes in assets and liabilities: (Increase) Decrease in customer receivables, net 3,191,875 (91,600) (4,267) - 3,096,008 (Increase) Decrease in accounts receivable 6,794,472 62, ,857,285 (Increase) Decrease in prepaid expense and deposits 27,996 3, ,474 (Increase) Decrease in inventories 1,421, ,421,941 (Increase) Decrease in water in storage (2,559,367) (2,559,367) Increase (Decrease) in accounts payable 2,644, ,436 15,141 15,137 2,966,689 Increase (Decrease) in accrued expense payable (370,285) (120,701) (4,245) - (495,231) Increase (Decrease) in deferred revenue 9, ,358 Increase (Decrease) in deposits payable 700, ,486 Increase (Decrease) in compensated absences payable 65,173 (14,167) 16,820-67,826 Increase (Decrease) in net other post-employment benefits obligation 328,922 82,060 15, ,502 Increase (Decrease) in net pension plans obligations plan obligation (425,312) (86,651) (9,721) - (521,684) NET CASH PROVIDED (USED) BY OPERATING ACTIVITIES $ 31,480,516 $ 1,372,182 $ 308,678 $ (84,281) $ 33,077,095 NONCASH INVESTING, CAPITAL AND FINANCING ACTIVITIES: Contributions in aid of construction $ 50,000 $ 85,500 $ - $ - $ 135,500 Changes in fair value of investments 513, , ,205 Amortization of deferred bond costs and refunding (225,345) (225,345) NET NONCASH CAPITAL AND RELATED FINANCING ACTIVITIES $ 338,559 $ 256,801 $ - $ - $ 595,360 See accompanying independent auditors report and notes to the basic financial statements Statement of Cash Flows 13
32 Notes to the Basic Financial Statements June 30, 2016 (1) Reporting Entity and Summary of Significant Accounting Policies A. Organization and Operations of the Reporting Entity The reporting entity Cucamonga Valley Water District ( District ) includes the accounts of the District, the Cucamonga Public Facilities Corporation, the Cucamonga Valley Water District Financing Authority and Frontier Project Foundation. The District was incorporated as Cucamonga County Water District in March of 1955, under the provisions of the County Water District Law, Division 12 of the California Water Code. In fiscal year , the name of the District was changed to Cucamonga Valley Water District. The District s 47 square mile service area lies in western San Bernardino County and includes the City of Rancho Cucamonga, portions of the cities of Fontana, Upland, Ontario and some unincorporated areas. During , the Cucamonga Public Facilities Corporation ( Corporation ) was formed to issue Certificates of Participation (C.O.P. s). The Corporation transfers C.O.P. proceeds to the District in exchange for notes receivable bearing the same terms as the C.O.P. s. The District s five (5) member Board of Directors is appointed as the Cucamonga Public Facilities Corporation s governing board. In the combined financial statements, interfund transactions between the Corporation and District have been eliminated. Amounts eliminated include $119,532,870 in interfund receivable/payable on the statement of net position, $3,906,249 in interest expense and $13,269 in investment income on the statement of revenues, expenses and changes in net position, and $7,587,523 in interest expense on the statement of cash flows. Separate financial statements are not available. During 2012, the Cucamonga Valley Water District Financing Authority ( Financing Authority ) was formed to issue Revenue Bonds. The Financing Authority transfers Revenue Bond proceeds to the District in exchange for notes receivable bearing the same terms as the Revenue Bonds. The District s five (5) member Board of Directors is appointed as the Financing Authority s governing board. In the combined financial statements, interfund transactions between the Financing Authority and District have been eliminated. Amounts eliminated include $73,202,601 in interfund receivable/payable on the statement of net position, $2,145,802 in interest expense and $14,296 in investment income on the statement of revenues, expenses and changes in net position, and $949,508 in interest expense on the statement of cash flows. Separate financial statements are available by the District. The Frontier Project Foundation ( Foundation ) is a nonprofit public benefit corporation formed for the purposes of (i) creating an interactive indoor and outdoor educational center to demonstrate current and future building design methods and techniques that promote resource conservation, (ii) aiding, promoting and advancing the principles of sustainable design in California living and working environments, (iii) educating residents and business owners of the surrounding communities on how to incorporate sustainable design standards in their residence and businesses, (iv) engaging in other activities in furtherance of the purposes for which the Foundation was formed, and (v) receiving, investing and utilizing funds and property acquired through solicitation of contributions, donations, grants, gifts, bequests and the like for the purposes for which the Foundation was formed. The Foundation is governed by a Board of Directors, which consists of the District s Board of Directors and up to four additional members appointed by the District s Board of Directors. Currently, the District s Board of Directors has chosen not to fill any of the four open positions. Separate financial statements are available by the District. 14 Notes to the Basic Financial Statements
33 Notes to the Basic Financial Statements June 30, 2016 (1) Reporting Entity and Summary of Significant Accounting Policies, continued A. Organization and Operation of the Reporting Entity, continued The criteria used in determining the scope of the reporting entity is based on the provisions of GASB Statement No. 14 and the amendments of GASB Statement No. 61. The District is the primary government unit. Component units are those entities which are financially accountable to the primary government, either because the District appoints a voting majority of the component unit s board, or because the component unit will provide a financial benefit or impose a financial burden on the District. The District has accounted for the Corporation, the Financing Authority, and Foundation as blended component units. Despite being legally separate, these entities are so intertwined with the District that they are in substance, part of the District s operations. Accordingly, the balances and transactions of the Corporation and the Financing Authority are reported within the Water Utility Fund of the District, while the Foundation is accounted for in its own fund. Separate financial statements are not issued for the Corporation. The separate financial statements of the Financing Authority or the Foundation may be obtained from the District s office. B. Basis of Accounting and Measurement Focus The District reports its activities as a set of proprietary funds. This means that the District utilizes the economic resources measurement focus which emphasizes limitations on the use of net position. This is similar to a private-sector business. Revenues and expenses are recognized on the accrual basis of accounting. Revenues are recognized in the accounting period in which they are earned and expenses are recognized in the period incurred, regardless of when the related cash flow takes place. Operating revenues, such as charges for services (water sales, sewer services and water services) result from exchange transactions associated with the principal activity of the District. Exchange transactions are those in which each party receives and gives up essentially equal values. Nonoperating revenues, such as property taxes and investment income, result from nonexchange transactions or ancillary activities in which the District gives (receives) value without directly receiving (giving) equal value in exchange. When both restricted and unrestricted resources are available for use, the District uses restricted resources and then unrestricted resources. The funds of the District are described below: Water Utility Fund This fund is used to account for the operations of the District s water system and related revenues. Sewer Utility Fund This fund is used to account for the operations of the District s wastewater system and related revenues. Recycled Water Utility Fund This fund is used to account for the operations of the District s recycled water system and related revenues. Frontier Project Foundation This fund is used to account for the activities related to the Frontier Project Foundation. C. Financial Reporting The District s basic financial statements are presented in conformance with the provisions of Governmental Accounting Standards Board (GASB) Statement No. 34, Basic Financial Statements and Management s Discussion and Analysis for State and Local Governments (GASB No. 34). This statement established revised financial reporting requirements for state and local governments throughout the United States for the purpose of enhancing the understandability and usefulness of financial reports. Notes to the Basic Financial Statements 15
34 Notes to the Basic Financial Statements, continued June 30, 2016 (1) Reporting Entity and Summary of Significant Accounting Policies, continued C. Financial Reporting, continued GASB No. 34 and its related GASB pronouncements provide for a revised view of financial information and restructure the format of financial information provided prior to its adoption. A statement of net position replaces the balance sheet and reports assets, liabilities, and the difference between them as net position, not equity. A statement of revenues, expenses and changes in net position replaces both the income statement and the statement of changes in retained earnings and contributed capital. GASB No. 34 also requires that the statement of cash flows be prepared using the direct method. Under the direct method, cash flows from operating activities are presented by major categories. The District adopted GASB Statement No. 62, Codification of Accounting and Financial Reporting for Guidance Contained in Pre-November 30, 1989 FASB and AICPA Pronouncements, which established accounting and financial reporting standards for financial statements of state and local governments. D. Operating and Nonoperating Revenues and Expenses The District distinguishes operating revenues and expenses from nonoperating items. Operating revenues and expenses generally result from providing services in connection with the distribution and transmission of potable and recycled water to users, and the operation and maintenance of the sewer network within the District. All revenues and expenses not meeting this definition are reported as nonoperating revenues and expenses. E. Assets, Liabilities and Net Position 1. Use of Estimates The preparation of the basic financial statements in conformity with generally accepted accounting principles (GAAP) in the United States of America requires management to make estimates and assumptions that affect the amounts reported in the financial statements and accompanying notes. Actual results could differ from those estimates. 2. Cash and Cash Equivalents For the purpose of the statement of cash flows, cash equivalents are defined as short-term, highly liquid investments that are both readily convertible to known amounts of cash or so near to their maturity that they present insignificant risk of changes in value because of changes in interest rates, and have an original maturity date of 3 months or less. 3. Investments and Investment Policy In accordance with GASB Statement No. 31, Accounting and Financial Reporting for Certain Investments and for External Investment Pools, highly liquid market investments with maturities of one year or less at time of purchase are stated at amortized cost. All other investments are stated at fair value. Market value is used as fair value for those securities for which market quotations are readily available. The District participates in an investment pool managed by the State of California titled Local Agency Investment Fund (LAIF), which has invested a portion of the pool funds in Structured Notes and Asset- Backed Securities. LAIF s investments are subject to credit risk with the full faith and credit of the State of California collateralizing these investments. In addition, these Structured Notes and Asset-Backed Securities are subject to market risk as to change in interest rates. 16 Notes to the Basic Financial Statements
35 Notes to the Basic Financial Statements, continued June 30, 2016 (1) Reporting Entity and Summary of Significant Accounting Policies, continued E. Assets, Liabilities and Net Position, continued 4. Customer Receivables The District extends credit to customers in the normal course of operations. When management deems customer accounts uncollectible, the District uses the allowance method for the reservation and write-off of those accounts. 5. Inventory Materials and supplies inventory consists primarily of water meters, pipe and pipefittings for construction and repair to the District s water transmission and distribution system. Inventory is valued at cost using a weighted average method. Inventory items are charged to expense at the time that individual items are withdrawn from inventory or consumed. 6. Prepaid Expense and Deposit Certain payments to vendors reflect costs or deposits applicable to future accounting periods and are recorded as prepaid items in the basic financial statements. 7. Capital Assets Capital assets acquired and/or constructed are capitalized at historical cost (or estimated historical cost) and updated for additions and retirements during the year. Donated assets are recorded at their fair market value as of the date received. The District maintains a capitalization threshold of $5,000. Upon retirement or other disposition of capital assets, the cost and related accumulated depreciation are removed from the respective balances and any gains or losses are recognized. The cost of normal maintenance and repairs that do not add to the value of the assets or materially extend asset lives are not capitalized. Depreciation is computed using the straight-line method over the following useful lives: Intangible Plant 40 years Source of Supply Plant 50 years Pumping Plant 10 to 20 years Treatment Plant 40 years Collection, Transmission and Distribution Plant 50 years General Plant 5 to 50 years 8. Deferred Outflows/Inflows of Resources In addition to assets, the statement of financial position will sometimes report a separate section for deferred outflows of resources. This separate financial statement element, deferred outflows of resources, represents a consumption of net position that applies to a future period(s) and so will not be recognized as an outflow of resources (expense/ expenditure) until then. The District only has two items that qualify for reporting in this category on the Statement of Net Position. The first item is the pension plan deferred outflows, which are the difference between expected and actual experience, the net difference between projected and actual earnings on pension plan investments and the employer contributions for the current fiscal year. The second item is a deferred charge on refunding which results from the difference in the net carrying value of refunded debt and its reacquisition price. This amount is deferred and amortized over the shorter of the life of the refunded or refunding debt. Notes to the Basic Financial Statements 17
36 Notes to the Basic Financial Statements, continued June 30, 2016 (1) Reporting Entity and Summary of Significant Accounting Policies, continued E. Assets, Liabilities and Net Position, continued 8. Deferred Outflows/Inflows of Resources, continued In addition to liabilities, the statement of financial position will sometimes report a separate section for deferred inflows of resources. This separate financial statement element, deferred inflows of resources, represents an acquisition of net position that applies to a future period(s) and so will not be recognized as an inflow of resources (revenue) until that time. These amounts are deferred and recognized as inflow of resources in the period that the amounts become available. The District has one item that qualifies for reporting in this category on the Statement of Net Position. Pension plan deferred inflows result from the change in assumptions, the difference between expected and actual experience and the difference between projected and actual earnings on the assets invested in the pension plan. 9. Compensated Absences The District's policy is to permit employees to accumulate a maximum of 200 hours of vacation and an unlimited amount of sick leave. Accumulated vacation time is accrued for the District's obligation to the employees for the amount owed up to the maximum of 200 hours. Sick leave is accrued at 50% of the earned balance in keeping with the District s policy of 50% pay out upon retirement or death of the employee. Upon retirement, the remaining 50% sick leave balance is reported to CalPERS for application to the employee s service credit. 10. Long-Term Debt Long-term debt and other financial obligations are reported as liabilities in the appropriate funds. Bond premiums and discounts are deferred and amortized over the life of the bonds using the straight-line method. Bonds payable are reported net of the applicable bond premium or discount. Issuance costs, whether or not withheld from the actual debt proceeds received, are reported as expenditures. 11. Net Pension Liability For the purpose of measuring the net pension liability, deferred outflows of resources and deferred inflows of resources related to pensions, and pension expense, information about the fiduciary net position of the Plan and additions to/deductions from the Plan s fiduciary net position have been determined on the same basis as they are reported by the CalPERS Financial Office. For this purpose, benefit payments (including refunds of employee contributions) are recognized when currently due and payable in accordance with the benefit terms. Investments are reported at fair value. GASB 68 requires that the reported results must pertain to liability and asset information within certain defined timeframes. For this report, the following timeframes are used. Valuation Date (VD) June 30, 2014 Measurement Date (MD) June 30, 2015 Measurement Period (MP) July 1, 2014 to June 30, Restricted Assets and Amounts Payable from Restricted Assets Amounts shown as restricted assets have been restricted by bond indentures or are to be used for specified purposes based on contract provisions, such as bonded debt service. Certain liabilities which are currently payable have been classified as current liabilities payable from restricted assets since assets have been restricted for their payment. 18 Notes to the Basic Financial Statements
37 Notes to the Basic Financial Statements, continued June 30, 2016 (1) Reporting Entity and Summary of Significant Accounting Policies, continued E. Assets, Liabilities and Net Position, continued 13. Net Position The financial statements utilize a net position presentation. Net position is categorized as follows: Net Investment in Capital Assets This component of net position consists of capital assets, net of accumulated depreciation and reduced by any debt outstanding against the acquisition, construction or improvement of those assets. Restricted Net Position This component of net position consists of constraints placed on net position use through external constraints imposed by creditors, grantors, contributors, or laws or regulations of other governments or constraints imposed by law through constitutional provisions or enabling legislation. Unrestricted Net Position This component of net position consists of net position that does not meet the definition of restricted or net investment in capital assets 14. Net Position Flow Assumption Sometimes the District will fund outlays for a particular purpose from both restricted (e.g., restricted bond or grant proceeds) and unrestricted resources. In order to calculate the amounts to report as restricted net position and unrestricted net position in the District financial statements, a flow assumption must be made about the order in which the resources are considered to be applied. It is the District s policy to consider restricted net position to have been depleted before unrestricted net position is applied. 15. Water Sales Water sales are billed on a bi-monthly cyclical basis. Estimated unbilled water revenue through June 30 has been accrued at year-end. 16. Capital Contributions Contributions in aid of construction represent cash and utility plant additions contributed to the District by property owners or developers desiring services that require capital expenditures or capacity commitment. In accordance with Governmental Accounting Standards Board Statement No. 33, the capital contributions are recorded on the Statement of Revenues, Expenses and Changes in Net Position. The following special charges levied by the District against newly-connecting customers are being accounted for as contributions in aid of construction: 17. Budgetary Policies Water Development Fees: Range from $9,116 to $729,246 based on meter size. Sewer Development Fees: Range from $1,239 to $99,140 based on meter size. The District adopts an annual non-appropriated budget for planning, control, and evaluation purposes. Budgetary control and evaluation are affected by comparisons of actual revenues and expenses with planned revenues and expenses for the period. Encumbrance accounting is not used to account for commitments related to unperformed contracts for construction and services. Notes to the Basic Financial Statements 19
38 Notes to the Basic Financial Statements, continued June 30, 2016 (1) Reporting Entity and Summary of Significant Accounting Policies, continued E. Assets, Liabilities and Net Position, continued 18. Effect of New Accounting Standards During the fiscal year ended June 30, 2016 the District implemented the following Governmental Accounting Standards Board (GASB) standards: GASB Statement No. 72 Fair Value Measurement and Application This Statement addresses accounting and financial reporting issues related to fair value measurements. The definition of fair value is the price that would be received to sell an asset or paid to transfer a liability in an orderly transaction between market participants at the measurement date. This Statement provides guidance for determining a fair value measurement for financial reporting purposes. This Statement also provides guidance for applying fair value to certain investments and disclosures related to all fair values measurements. The requirements of this Statement are effective for financial statement reporting periods beginning after June 15, The GASB has issued pronouncements prior to June 30, 2016 that have effective dates that may impact future financial presentations; however, the impact of the implementation of each of the statements below to the District s financial statements has not been addressed at this time. GASB Statement No. 73 Accounting and Financial Reporting for Pensions and Related Assets That Are Not within the Scope of GASB Statement 68, and Amendments to Certain Provisions of GASB Statements 67 and 68. The objective of this Statement is to improve the usefulness of information about pensions included in the general purpose external financial reports of state and local governments for making decisions and assessing accountability. This Statement results from a comprehensive review of the effectiveness of existing standards of accounting and financial reporting for all postemployment benefits with regard to providing decision-useful information, supporting assessments of accountability and interperiod equity, and creating additional transparency. The provisions in Statement 73 are effective for fiscal years beginning after June 15, 2015 except those provisions that address employers and governmental nonemployer contributing entities for pensions that are not within the scope of Statement 68, which are effective for fiscal years beginning after June 15, (2) Cash and Investments Cash and investments are reported in the accompanying statement of net position as follows: Unrestricted: Cash and cash equivalents $ 27,757,523 Investments 59,487,365 Restricted: Cash and cash equivalents with fiscal agent 24,011,766 Total cash and investments $ 111,256, Notes to the Basic Financial Statements
39 Notes to the Basic Financial Statements, continued June 30, 2016 (2) Cash and Investments, continued Cash and investments at June 30, 2016 consisted of the following: Cash on hand $ 4,100 Deposits with financial institutions 4,313,092 Investments 106,939,462 $ 111,256,654 Investments Authorized by the California Government Code and the District s Investment Policy The table below identifies the investment types that are authorized by the District in accordance with the California Government Code (or the District s investment policy, where more restrictive). The table also identifies certain provisions of the California Government Code (or the District s investment policy, where more restrictive) that address interest rate risk, credit risk, and concentration of credit risk. Maximum Maximum Maximum Percentage Investment Authorized Investment Type Maturity of Portfolio* in One Issuer United States (U.S.) Treasury Obligations 5 years 100% None U.S. Agency Securities 5 years 100% None Banker's Acceptances 180 days 20% 30% Negotiable Certificates of Deposits 5 years 30% None Time Certificates of Deposits 1 year 30% None Commercial Paper 270 days 40% 10% Medium-Term Corporate Notes 5 years 30% None Local Agency Investment Fund (LAIF) N/A 100% $40,000,000 Repurchase Agreements 90 days 10% None Money Market Funds N/A 20% None State and Local Agencies Notes or Bonds 5 years 30% None Supranational 5 years 30% None * - Excluding amounts held by bond trustee that are not subject to California Government Code restrictions. Investments Authorized by Debt Agreements Investments of debt proceeds held by bond trustee are governed by provisions of the debt agreements, rather than the general provisions of the California Government Code or the District s investment policy. Investments authorized for funds held by bond trustee include, U.S. Treasury Obligations, U.S. Government Sponsored Enterprise Securities, the California Local Agency Investment Fund, Guaranteed Investment Contracts, Commercial Paper, Local Agency Bonds, Banker s Acceptance and Money Market Mutual Funds. There were no limitations on the maximum amount that can be invested in one issuer, maximum percentage allowed or the maximum maturity of an investment, except for the maturity of Banker s Acceptance which are limited to one year. Notes to the Basic Financial Statements 21
40 Notes to the Basic Financial Statements, continued June 30, 2016 (2) Cash and Investments, continued Custodial Credit Risk Custodial credit risk for deposits is the risk that, in the event of the failure of a depository financial institution, a government will not be able to recover its deposits or will not be able to recover collateral securities that are in the possession of an outside party. The custodial credit risk for investments is the risk that, in the event of the failure of the counterparty (e.g., broker-dealer) to a transaction, a government will not be able to recover the value of its investment or collateral securities that are in the possession of another party. With respect to investments, custodial credit risk generally applies only to direct investments in marketable securities. Custodial credit risk does not apply to a local government s indirect investment in securities through the use of mutual funds or government investment pools (such as LAIF). The California Government Code and the District s investment policy do not contain legal or policy requirements that would limit the exposure to custodial credit risk for deposits or investments, other than the following provision for deposits: The California Government Code requires that a financial institution secure deposits made by state or local governmental units by pledging securities in an undivided collateral pool held by a depository regulated under state law (unless so waived by the governmental unit). The market value of the pledged securities in the collateral pool must equal at least 110% of the total amount deposited by the public agencies. California law also allows financial institutions to secure District deposits by pledging first trust deed mortgage notes having a value of 150% of the secured public deposits. The District had deposits with a bank balance of $5,471,619 as of June 30, Of the bank balance, up to $250,000 is federally insured and the remaining balance is collateralized in accordance with the Code; however, the collateralized securities are not held in the District s name. The District CFO may waive the collateral requirement for deposits that are fully insured up to $250,000 by the FDIC. Investment in State Investment Pool The District is a voluntary participant in the Local Agency Investment Fund (LAIF) that is regulated by the California Government Code under the oversight of the Treasurer of the State of California. The fair value of the District s investment in this pool is reported in the accompanying financial statements at amounts based upon the District s pro-rata share of the fair value provided by LAIF for the entire LAIF portfolio (in relation to the amortized cost of that portfolio). The balance available for withdrawal is based on the accounting records maintained by LAIF, which are recorded on an amortized cost basis. LAIF is not rated by a nationally recognized statistical rating organization, but, as stated previously, it is regulated by the California Government Code, and is therefore exempt from rating requirements. Interest Rate Risk Interest rate risk is the risk that changes in market interest rates will adversely affect the fair value of an investment. Generally, the longer the maturity of an investment, the greater the sensitivity of its fair value will be to changes in market interest rates. One of the ways that the District manages its exposure to interest rate risk is by purchasing a combination of shorter term and longer term investments and by timing cash flows from maturities so that a portion of the portfolio matures or comes close to maturity evenly over time as necessary to provide requirements for cash flow and liquidity needed for operations. The District categorizes its fair value measurements within the fair value hierarchy established by generally accepted accounting principles. The hierarchy is based on the valuation inputs used to measure the fair value of the asset. Level 1 inputs are quoted prices in active markets for identical assets; Level 2 inputs are significant other observable inputs; Level 3 inputs are significant unobservable inputs. 22 Notes to the Basic Financial Statements
41 Notes to the Basic Financial Statements, continued June 30, 2016 (2) Cash and Investments, continued Information about the sensitivity of the fair values of the District s investments to market interest rate fluctuations and their fair value measurement levels are provided by the following table that shows the distribution of the District s investments by maturity date: Remaining Maturity (in Months) 12 Months Level Investment Type or Less Months Months Total U.S. Agency Securities: Federal National Mortgage Association $ - $ 2,007,920 $ 4,096,598 $ 6,104,518 $ 6,104,518 $ - $ - Federal Home Loan Mortgage Corporation , , , Federal Agricultural Mortgage Corporation - 2,007,860-2,007,860 2,007, U.S. Treasuries - 957,343 25,089,783 26,047,126 26,047, Municipal Bonds - 953, , ,257 - Medium-term Corporate Notes 1,010,677 5,584,223 7,561,763 14,156,663-14,156,663 - Negotiable Certificates of Deposit 3,447,662 5,000,000-8,447,662-8,447,662 - Supranational Obligations - - 1,153,945 1,153,945-1,153,945 - Local Agency Investment Fund (LAIF) 35,295, ,295,400-35,295,400 - Money Market Funds 25, ,523-25,523 - Cash with fiscal agent: Local Agency Investment Fund (LAIF) 4,738, ,738,204-4,738,204 - Money Market Funds 7,418, ,418,491-7,418,491 - $ 51,935,957 $ 16,510,603 $ 38,492,902 $ 106,939,462 $ 34,750,317 $ 72,189,145 $ - Securities classified in Level 1 of the fair value hierarchy are valued using prices quoted in active markets for those securities. Municipal bonds, corporate notes and CD s, supranational obligations, local agency investments and money market funds classified in Level 2 of the fair value hierarchy are valued using a matrix pricing model. Matrix pricing is used to value securities based on the securities relationship to benchmark quoted prices. Credit Risk Generally, credit risk is the risk that an issuer of an investment will not fulfill its obligation to the holder of the investment. This is measured by the assignment of a rating by a nationally recognized statistical rating organization. Presented below is the minimum rating required by (where applicable) the California Government Code, the District s investment policy, or debt agreements, and the actual rating as of year-end for each investment type. Minimum Investment Type Legal Rating Rating 6/30/2016 U.S. Agency Securities: Federal National Mortgage Association AA+ AA+ $ 6,104,518 Federal Home Loan Mortgage Corporation AA+ AA+ 590,813 Federal Agricultural Mortgage Corporation AA+ AA+ 2,007,860 U.S. Treasuries AA+ AA+ 26,047,126 Municipal Bonds A A 953,257 Medium-term Corporate Notes A AAA 250,997 AA+ 2,447,260 AA- 4,292,630 AA 76,226 A+ 929,295 A 3,392,842 A- 1,965,000 BBB+ 802,413 Negotiable Certificates of Deposit N/A N/A 8,447,662 Supranational Obligations A AAA 1,153,945 Local Agency Investment Fund (LAIF) N/A N/A 35,295,400 Money Market Funds A AAA 25,523 Cash with fiscal agent: Local Agency Investment Fund (LAIF) N/A N/A 4,738,204 Money Market Funds A AAA 7,418,491 $ 106,939,462 Notes to the Basic Financial Statements 23
42 Notes to the Basic Financial Statements, continued June 30, 2016 (2) Cash and Investments, continued Concentration of Credit Risk The investment policy of the District contains no limitations on the amount that can be invested in any one issuer beyond that stipulated by the California Government Code. Investments in any one issuer (other than for U.S. Treasury securities, mutual funds, and external investment pools) that represent 5% or more of total District s investments are as follows: Reported Percent of Issuer Investment Type Amount Investments Federal National Mortgage Association U.S. Agency Securities $ 6,104, % (3) Restricted Assets Restricted assets were provided by, and are to be used for, the following: Funding Source Use Amount Sewer Facility Fees Construction of Sewer Treatment Facility (Note 8) $ 11,594,817 Debt service reserves Funds held in reserve for outstanding debt 2,119,872 Debt Proceeds Construction of specific assets outlined in issues 10,297,077 $ 24,011,766 (4) Water in Storage The District is entitled to water in the Chino Basin. To accommodate future growth, the District has purchased additional water from other purveyors within the Basin, which is stored in the Basin. The water is intended for use in future years. As of June 30, 2016, the District s unsold water purchases amounted to $20,141, Notes to the Basic Financial Statements
43 Notes to the Basic Financial Statements, continued June 30, 2016 (5) Capital Assets Changes in capital assets for the year were as follows: Balance Additions/ Retirements/ Balance July 1, 2015 Transfers Transfers June 30, 2016 Non-Depreciable Assets: Water: Land $ 4,564,556 $ 2,311,531 $ - $ 6,876,087 Water rights 92,907, ,907,569 Construction in progress 58,524,636 15,759,820 (65,982,750) 8,301,706 Sewer: Construction in progress 992, ,863 (1,045,887) 129,790 Recycled Water: Construction in progress 27, ,811 (181,514) 2,934 Total non-depreciable assets 157,017,212 18,411,025 (67,210,151) 108,218,086 Depreciable assets: Water: Intangibles 170, ,295 Source of supply 24,228, ,495-24,579,185 Pumping plant 18,133,894 3,484,342-21,618,236 Transmission and distribution 192,342,734 10,016,577 (60,468) 202,298,843 Treatment plant 59,121,106 51,454, ,575,789 Office buildings and equipment 47,220,066 1,120,419 (508,036) 47,832,449 Sewer: Intangibles 127, ,819 Pumping station 104, ,726 Collection and transmission 67,826,656 1,209,580-69,036,236 Office buildings and equipment 9,345, ,284 (163,533) 9,444,050 Recycled Water: Waste water reclamation 5,565, ,515-5,747,503 General recycled water 5, ,000 Frontier Project Foundation: Office equipment 105, ,274 Total depreciable assets 424,297,547 68,079,895 (732,037) 491,645,405 Less: accumulated depreciation Water: Intangibles (114,061) (4,944) - (119,005) Source of supply (6,804,880) (486,116) - (7,290,996) Pumping plant (8,945,894) (672,966) - (9,618,860) Transmission and distribution (70,897,156) (4,241,821) 60,468 (75,078,509) Treatment plant (31,385,500) (2,517,650) - (33,903,150) General water (17,926,261) (1,620,017) 502,780 (19,043,498) Sewer: Intangibles (64,703) (3,195) - (67,898) Pumping station (55,822) (4,383) - (60,205) Collection and transmission (30,513,844) (1,319,689) - (31,833,533) General sewer (4,359,646) (365,264) 162,635 (4,562,275) Recycled Water: Waste water reclamation (726,319) (114,044) - (840,363) General recycled water (5,000) - - (5,000) Frontier Project Foundation: General Frontier Project (84,752) (11,217) - (95,969) Total accumulated depreciation (171,883,838) (11,361,306) 725,883 (182,519,261) Total depreciable assets, net 252,413,709 56,718,589 (6,154) 309,126,144 Total capital assets, net $ 409,430,921 $ 75,129,614 $ (67,216,305) $ 417,344,230 Capital asset additions include $2,323,977 in capitalized interest. The total amount of interest incurred for the year ended June 30, 2016 was $6,052,435. Notes to the Basic Financial Statements 25
44 Notes to the Basic Financial Statements, continued June 30, 2016 (6) Interfund Receivables, Payables, and Transfers The composition of interfund balances as of June 30, 2016, is as follows: Due to/from other funds: Receivable Fund Payable Fund Amount Water Utility Fund Recycled Water Utility Fund $ 550,312 (7) Long-term Liabilities Changes in long-term liabilities for the year ended June 30, 2016, are as follows: Balance Balance Current July 1, 2015 Additions Retirements June 30, 2016 Portion Certificates of participation $ 138,714,285 $ - $ (26,599,286) $ 112,114,999 $ 3,519,286 Deferred bond premium 8,160,527 - (742,656) 7,417,871 - Net certificates of participation 146,874,812 - (27,341,942) 119,532,870 3,519,286 Revenue Bonds 48,605,000 19,940,000 (1,340,000) 67,205,000 1,385,000 Deferred bond premium 4,900,530 1,343,351 (246,280) 5,997,601 - Net Revenue Bonds 53,505,530 21,283,351 (1,586,280) 73,202,601 1,385,000 CalPERS Pension Plan Obligation (Note 14) 15,884,848 2,113,745-17,998,593 - PARS Pension Plan Obligation (Note 15) 597,810 - (597,810) - - Excess Benefit Plan Obligation (Note 16) 1,520,054 - (255,374) 1,264,680 - Net Pension Liability 18,002,712 2,113,745 (853,184) 19,263,273 - Leases payable 3,456,963 8,216,000 (1,139,607) 10,533,356 1,546,326 Loan Payable 518,817 - (34,409) 484,408 34,435 Compensated absences 1,776,833 1,012,956 (945,130) 1,844, ,130 Net OPEB Obligation (note 17) 3,083,617 1,414,502 (988,000) 3,510,119 - $ 227,219,284 $ 34,040,554 $ (32,888,552) $ 228,371,286 $ 7,430,177 Certificates of participation principal balances for the year ended June 30, 2016 are as follows: 2009 Certificates of Participation $ 9,185, Certificates of Participation 102,725, Clean Renewable Energy Bonds 204,999 $ 112,114,999 Revenue Bond principal balances for the year ended June 30, 2016 are as follows: 2012 Revenue Bonds $ 35,755, Revenue Bonds 11,510, Revenue Bonds 19,940,000 $ 67,205, Notes to the Basic Financial Statements
45 Notes to the Basic Financial Statements, continued June 30, 2016 (7) Long-term Liabilities, continued Leases Payable principal balances for the year ended June 30, 2016 are as follows: 2009 Certificates of Participation 2007 Fixed Network Meter Replacement $ 1,159, Fixed Network Meter Replacement 1,528, Fixed Network Meter Replacement 7,845,144 $ 10,533,356 In April 2009, the Cucamonga Public Facilities Corporation issued Certificates of Participation in the amount of $27,960,000. The proceeds were used to fund the acquisition and construction of certain capital improvements and equipment, to provide for a reserve fund, and to pay for the costs of issuance. The 2009 Certificates of Participation are scheduled to mature annually on September 1, 2010 to September 1, 2020 in amounts ranging from $1,420,000 to $2,005,000. Interest is payable semiannually on March 1 and September 1 of each year with interest rates ranging from 2% to 5.625%. Debt service requirements on the 2009 Certificates of Participation are as follows: 2011 Certificates of Participation Year Principal Interest Total 2017 $ 1,685,000 $ 614,675 $ 2,299, ,755, ,488 2,296, ,825, ,375 2,281, ,915, ,500 2,170, ,005,000 50,125 2,055,125 $ 9,185,000 $ 1,918,163 $ 11,103,163 In August 2011, the Cucamonga Public Facilities Corporation issued Certificates of Participation in the amount of $109,475,000. The proceeds of the Certificates were used to defease the 2000 Certificates of Participation outstanding in the amount of $84,860,000 and to defease the 2001 Certificates of Participation outstanding in the amount of $33,315,000. The deferred amount on the refunding (the difference between the reacquisition price (funds required to refund the old debt) and the net carrying amount of the old debt) was $3,477,217. At June 30, 2016 the remaining unamortized deferred amount of $2,762,045 on the refunding is shown as a deferred outflow of resources. The advance refunding resulted in an economic gain of $10,690,420 (difference between the present value of the annual debt service payments between old and new debt) and a decrease in debt service payments of $14,234,377. The 2011 Certificates are scheduled to mature annually on September 1, 2016 to September 1, 2036 in amounts ranging from $1,655,000 to $8,315,000. Interest is payable semi-annually on March 1 and September 1 of each year ranging from 0.25% to 5.375%. Notes to the Basic Financial Statements 27
46 Notes to the Basic Financial Statements, continued June 30, 2016 (7) Long-term Liabilities, continued Debt service requirements on the 2011 Certificates of Participation are as follows: 2009 Clean Renewable Energy Bonds Year Principal Interest Total 2017 $ 1,805,000 $ 5,085,988 $ 6,890, ,880,000 5,012,287 6,892, ,945,000 4,935,788 6,880, ,015,000 4,861,662 6,876, ,085,000 4,790,163 6,875, ,130,000 21,919,869 43,049, ,860,000 14,450,625 50,310, ,005,000 4,780,568 40,785,568 $ 102,725,000 $ 65,836,950 $ 168,561,950 In April 2009, the Cucamonga Public Finance Corporation issued Certificates of Participation in the amount $410,000 under the provisions of the American Recovery and Reinvestment Act ( Act ). Under the Act, public agencies may issue Clean Renewable Energy Bonds ( CREBs ), which are interest-free loans for projects that promote clean renewable energy. In return for their investments, investors are allowed a tax credit under this provision. Since the investor is making money in the form of a tax credit, no imputed interest will be calculated. The proceeds were used to fund renewable energy initiatives related to the construction of the Frontier Project building. The 2009 Clean Renewable Energy Bonds are scheduled to mature annually on September 1, 2016 through September 1, 2022 in the amount of $29,286. Debt service requirements on the 2009 Clean Renewable Energy Bonds are as follows: 2012 Revenue Bonds Year Principal 2017 $ 29, , , , , ,571 $ 204,999 In October 2012, the Cucamonga Valley Water District Financing Authority issued Revenue Bonds in the amount of $37,885,000. The proceeds were used to fund the acquisition and construction of certain capital improvements and equipment, and to pay for the costs of issuance. 28 Notes to the Basic Financial Statements
47 Notes to the Basic Financial Statements, continued June 30, 2016 (7) Long-term Liabilities, continued The 2012 Revenue Bonds are scheduled to mature annually on September 1, 2016 to September 1, 2042 in amounts ranging from $690,000 to $2,215,000. Interest is payable semiannually on March 1 and September 1 of each year with interest rates ranging from 2.5% to 4%. Debt service requirements on the 2012 Certificates of Participation are as follows: 2014 Revenue Bonds Year Principal Interest Total 2017 $ 760,000 $ 1,510,387 $ 2,270, ,000 1,479,288 2,274, ,000 1,446,888 2,271, ,000 1,413,188 2,273, ,000 1,378,087 2,273, ,055,000 6,311,837 11,366, ,010,000 5,350,137 11,360, ,135,000 4,227,938 11,362, ,095,000 2,263,875 11,358, ,325, ,875 4,543,875 $ 35,755,000 $ 25,600,500 $ 61,355,500 In October 2012, the Cucamonga Valley Water District Financing Authority issued Revenue Bonds in the amount of $12,150,000. The proceeds were used to fund the acquisition and construction of certain capital improvements and equipment, to refund the outstanding 2003 Certificates of Participation, and to pay for the costs of issuance. The 2014 Revenue Bonds are scheduled to mature annually on September 1, 2016 to September 1, 2029 in amounts ranging from $605,000 to $1,575,000. Interest is payable semiannually on March 1 and September 1 of each year with interest rates ranging from 2.5% to 5%. Debt service requirements on the 2014 Certificates of Participation are as follows: Year Principal Interest Total 2017 $ 625,000 $ 494,838 $ 1,119, , ,238 1,124, , ,263 1,114, , ,188 1,118, , ,288 1,114, ,675,000 1,236,065 5,911, ,435, ,695 3,699,695 $ 11,510,000 $ 3,691,575 $ 15,201,575 Notes to the Basic Financial Statements 29
48 Notes to the Basic Financial Statements, continued June 30, 2016 (7) Long-term Liabilities, continued 2016 Revenue Bonds In February 2016, the Cucamonga Valley Water District Financing Authority issued Revenue Bonds in the amount of $19,940,000. The proceeds were used to pay off the outstanding Cucamonga Valley Water District 2006 Certificates of Participation, a portion of the 2009 Certificates of Participation, and to pay costs incurred in connection with the issuance of the bonds. The 2016 Revenue Bonds are scheduled to mature annually on September 1, 2017 to September 1, 2036 in amounts ranging from $395,000 to $9,250,000. Interest is payable semiannually on March 1 and September 1 of each year with interest rates ranging from 3% to 5%. The advance refunding resulted in an economic gain (difference between the present values of the old and new debt service payments) of $ 4,122,694 and a reduction of cash flow payments of approximately $ 4,967,314. Debt service requirements on the 2016 Certificates of Participation are as follows: Year Principal Interest Total 2017 $ - $ 788,131 $ 788, , ,763 1,147, , ,162 1,171, , ,363 1,173, , ,137 1,182, ,905,000 2,447,188 7,352, ,198,812 2,198, ,015,000 1,910,063 5,925, ,250, ,531 9,394, Fixed Network Meter Replacement Capital Lease Payable $ 19,940,000 $ 10,393,150 $ 30,333,150 The District entered into an agreement dated December 17, 2007 with LaSalle Bank National Bank Association to finance the purchase of certain equipment related to the District s fixed network retrofit and meter exchange program in the amount of $5,720,765. The lease purchase agreement required semi-annual payments on June 17 and December 17 of each year of $354,268 at an interest rate of 4.26%. On December 17, 2010, the District refinanced the lease with Chase Equipment Finance. The total amount refinanced was $4,292,371. The lease refinance agreement requires quarterly payments of $170,608 at an interest rate of 2.98%. Debt service requirements on the 2007 fixed network meter replacement capital lease payable are as follows: Year Principal Interest Total 2017 $ 655,156 $ 27,275 $ 682, ,290 7, ,823 $ 1,159,446 $ 34,808 $ 1,194, Notes to the Basic Financial Statements
49 Notes to the Basic Financial Statements, continued June 30, 2016 (7) Long-term Liabilities, continued 2010 Fixed Network Meter Replacement Capital Lease Payable The District entered into an agreement dated October 1, 2010 with Chase Equipment Finance to finance the purchase of certain equipment related to the District s fixed network retrofit and meter exchange program in the amount of $2,200,000. The lease purchase agreement requires quarterly payments of $47,659 at an interest rate of 3.59%. Debt service requirements on the 2010 fixed network meter replacement capital lease payable are as follows: Year Principal Interest Total 2017 $ 137,591 $ 53,044 $ 190, ,597 48, , ,786 42, , ,163 37, , ,736 31, , ,893 68, , Fixed Network Meter Replacement Capital Lease Payable $ 1,528,766 $ 282,267 $ 1,811,033 The District entered into an agreement dated November 13, 2015 with Chase Equipment Finance to finance the purchase of certain equipment related to the District s fixed network retrofit and meter exchange program in the amount of $8,216,000. As of June 30, 2016, equipment in the amount of $1,720,850 had been purchased. The lease purchase agreement requires quarterly payments of $228,483 at an interest rate of 2.12%. Church Street Lateral Loan Payable Year Principal Interest Total 2017 $ 753,579 $ 160,352 $ 913, , , , , , , , , , ,087 93, , ,912, ,956 4,112,692 $ 7,845,144 $ 837,207 $ 8,682,351 The District entered into an agreement dated November 24, 2009 with Inland Empire Utilities Agency (IEUA) for the construction of a recycled water pipeline. A portion of the pipeline was for the purpose of IEUA s Regional Recycled Water system and a portion was for the purpose of the District s recycled water connections. The entire project is to be funded by a State of California Revolving Fund (SRF) loan, obtained by IEUA, which offers low interest rates for the purpose of constructing infrastructure. The District paid for the construction costs and was subsequently reimbursed by IEUA in the amount of $2,441,548. IEUA obtained two grants for the project. The amounts of the grants were $344,760 and $615,822. The grants were received from the California State Water Resources Control Board and the United States Bureau of Reclamation respectively. Notes to the Basic Financial Statements 31
50 Notes to the Basic Financial Statements, continued June 30, 2016 (7) Long-term Liabilities, continued The District s portion of the grants was $461,939. The District s portion of the pipeline amounted to $690,648, which is payable by the District in annual installments of $34,532 including interest at.074%. Debt service requirements on the Church Street Lateral loan payable are as follows: (8) Intergovernmental Payable Year Principal 2017 $ 34, , , , , , ,915 $ 484,408 The District, along with other agencies in the area, has an agreement with the Inland Empire Utilities Agency (IEUA) to share in construction costs of regional sewer treatment facilities. Construction costs are paid by tax increments each year by IEUA. If these tax increments do not cover the construction costs, the various agencies involved will be billed their allocated percentage. The District collects sewer facilities fees that by this agreement must be paid to IEUA when billed. The District is allowed to earn interest on any sewer facilities fees collected until remitted to IEUA. The District s liability for collected but unremitted sewer facilities fees at June 30, 2016 is $11,594,817. (9) Water Held for Inland Empire Utilities Agency The District entered into an agreement dated March 1, 2016 with the Inland Empire Utilities Agency (IEUA) in which IEUA will pay for the purchase and delivery of Metropolitan Water District imported water to the District. The District in return will account for an equivalent volume of Chino Basin groundwater to IEUA within the District s existing Excess Carryover Storage Account. The District s liability for this water held for IEUA at June 30, 2016 is $1,384,074. (10) Net Investment in Capital Assets Investment in capital assets, net of related debt, at June 30, 2016, consisted of the following: Non-depreciable capital assets $ 108,218,086 Depreciable capital assets, net 309,126,144 Lease payable - current portion (1,546,326) Certificates of participation - current portion (3,519,286) Revenue bonds - current portion (1,385,000) Lease payable - non-current portion (8,987,030) Certificates of participation - non-current portion (116,013,584) Revenue bonds - non-current portion (71,817,601) Revenue bonds - unspent portion with trustee 12,416,949 Deferred charge - refunding of cerificates of participation 3,783,323 $ 230,275, Notes to the Basic Financial Statements
51 Notes to the Basic Financial Statements, continued June 30, 2016 (11) Designation of Unrestricted Net Position The District has adopted a Reserve Policy to establish designations of unrestricted net position. The designations established at June 30, 2016 are as follows: Fund Reserve Types Water Sewer Recycled Water Designated Bond Proceeds $ 12,416,949 N/A N/A Development Fees 7,401,058 1,450,219 72,079 Capital Facility & Equipment Replacement 21,828,610 17,698,000 - Emergency 7,402,000 (1) 846,000 (1) 98,000 (1) Administrative 1,648,000 82,000 - Local Water Resource Development 2,000,000 N/A N/A Liquidity Operating 18,404,363 (2) 7,868,000 (2) 411,000 (2) Rate Stabilization 10,310,722 (3) N/A N/A Water Banking 3,720,000 (4) N/A N/A Note (1) Emergency Reserve: The funding target is a minimum of 1% and a maximum of 2% of the capital assets in the fund. Note (2) Operating Reserve: The funding target is a minimum of 20% and a maximum of 50% of the budgeted total operating expenses in the fund. Note (3) Rate Stabilization Reserve: The funding target is a minimum of $2,200,000 and a maximum of 25% of the Water Fund operating income. Note (4) Water Banking Reserve: The funding target is a minimum of $2,500,000 and a maximum equal to the cost of purchasing 5,000 acre feet of Metropolitan Water District Tier 2 imported water. (12) Capital Contributions Capital contributions for the fiscal year ending June 30, 2016 were as follows: (13) Deferred Compensation Savings Plan Developer fees $ 2,874,434 Developer donated assets 135,500 Total Contributed Capital $ 3,009,934 For the benefit of its employees, the District participates in three 457 Deferred Compensation Programs (Programs). The purpose of these Programs is to provide deferred compensation for public employees that elect to participate in the Program. Generally, eligible employees may defer receipt of a portion of their salary until termination, retirement, death or unforeseeable emergency. Until the funds are paid or otherwise made available to the employee, the employee is not obligated to report the deferred salary for income tax purposes. Federal law requires deferred compensation assets to be held in trust for the exclusive benefit of the participants. Accordingly, the District is in compliance with this legislation. Therefore, these assets are not the legal property of the District, and are not subject to claims of the District s general creditors. Market value of all plan assets held in trust by the District s three deferred compensation plans at June 30, 2016 amounted to $4,550,934. The District has implemented GASB Statement No. 32, Accounting and Financial Reporting for Internal Revenue Code Section 457 Deferred Compensation Plans. Since the District has little administrative involvement and does not perform the investing function for this plan, the assets and related liabilities are not shown on the statement of net position. Notes to the Basic Financial Statements 33
52 Notes to the Basic Financial Statements, continued June 30, 2016 (14) Defined Benefit Pension Plan Plan Description The District contributes to the California Public Employees Retirement System (CalPERS), an agent multipleemployer public employee defined benefit pension plan. CalPERS provides retirement and disability benefits, annual cost-of-living adjustments, and death benefits to plan members and beneficiaries. CalPERS acts as a common investment and administrative agent for participating public agencies within the State of California. Benefit provisions and all other requirements are established by state statute and the District. Copies of PERS annual financial report may be obtained from their executive Office at 400 P Street, Sacramento, CA, Benefits Provided Employees are eligible for benefits under the plan in one of three tiers. Employees hired before January 10, 2011 are in Tier 1, employees hired after January 11, 2011 are in Tier 2, and employees hired after January 1, 2013 are in Tier 3. The benefit formula for employees in Tier 1 is 2.5% at 55, the benefit formula for employees in Tier 2 is 2.0% at 60, and the benefit formula for employees in Tier 3 is 2.0% at 62. The final average compensation period is 12 months for employees in Tier 1, and 36 months for employees in Tiers 2 and 3. Beneficiaries in all tiers are current receiving a 2% cost of living adjustment (COLA). Employees Covered Table: Inactive employees or beneficiaries current receiving benefits: 370 Inactive employees entitled to but not yet receiving benefits: 143 Active employees 118 Total: 631 Contribution Description Section 20814(c) of the California Public Employees Retirement Law (PERL) requires that the employer contribution rates for all public employers be determined on an annual basis by the actuary and shall be effective on the July 1 following notice of a change in the rate. The total plan contributions are determined through CalPERS annual actuarial valuation process. The actuarially determined rate is the estimated amount necessary to finance the costs of benefits earned by employees during the year, with an additional amount to finance any unfunded accrued liability. The employer is required to contribute the difference between the actuarially determined rate and the contribution rate of employees. For the measurement period ended June 30, 2015 (the measurement date), the average active employee contribution rate is 8% for Tier 1 employees and 7% for Tier 2 and 3 employees. Tier 1 employees pay 3% of the 8% required contribution and Tier 2 employees pay 3% of their 7% required contribution. The District makes the remaining portion of the contributions required of District Tier 1 and 2 employees on their behalf and for their account. Tier 3 employees must pay the full 7% share. The employer s contribution rate is % of annual payroll. Employer contribution rates may change if plan contracts are amended. It is the responsibility of the employer to make necessary accounting adjustments to reflect the impact due to any Employer Paid Member Contributions or situations where members are paying a portion of the employer contribution. Actuarial Methods and Assumptions Used to Determine Total Pension Liability For the measurement period ended June 30, 2015 (the measurement date), the total pension liability was determined by rolling forward the June 30, 2014 total pension liability. The June 30, 2014 and the June 30, 2015 total pension liabilities were based on the following actuarial methods and assumptions: 34 Notes to the Basic Financial Statements
53 Notes to the Basic Financial Statements, continued June 30, 2016 (14) Defined Benefit Pension Plan, continued Actuarial Cost Method Actuarial Assumptions Discount Rate 7.65% Inflation 2.75% Salary Increases Investment Rate of Return Mortality Rate Table (1) Post Retirement Benefit Increase Entry Age Normal in accordance with the requirements of GASB Statement No. 68 Varies by Entry Age and Service 7.65% Net of Pension Plan Investment and Administrative Expenses; includes Inflation Derived using CalPERS Membership Data for all Funds Contract COLA up to 2.75% until Purchasing Power Protection Allowance Floor on Purchasing Power applies, 2.75% thereafter (1) The mortality table used was developed based on CalPERS specific data. The table includes 20 years of mortality improvements using Society of Actuaries Scale BB. For more details on this table, please refer to the 2014 experience study report. All other actuarial assumptions used in the June 30, 2014 valuation were based on the results of an actuarial experience study for the period from 1997 to 2011, including updates to salary increase, mortality and retirement rates. The Experience Study report can be obtained at CalPERS website under Forms and Publications. Change of Assumptions GASB 68, paragraph 68 states that the long long-term expected rate of return should be determined net of pension plan investment expense but without reduction for pension administrative expense. The discount rate of 7.50 percent used for the June 30, 2014 measurement date was net of administrative expenses. The discount rate of 7.65 percent used for June 30, 2015 measurement date is without reduction of pension plan administrative expense. Discount Rate The discount rate used to measure the total pension liability was 7.65 percent. To determine whether the municipal bond rate should be used in the calculation of a discount rate for each plan, CalPERS stress tested plans that would most likely result in a discount rate that would be different from the actuarially assumed discount rate. Based on the testing, none of the tested plans run out of assets. Therefore, the current 7.65 percent discount rate is adequate and the use of the municipal bond rate calculation is not necessary. The longterm expected discount rate of 7.65 percent is applied to all plans in the Public Employees Retirement Fund. The stress test results are presented in a detailed report called GASB Crossover Testing Report that can be obtained at CalPERS website under the GASB 68 section. According to Paragraph 30 of Statement 68, the long-term discount rate should be determined without reduction for pension plan administrative expense. The discount rate was changed from 7.50 percent (net of administrative expenses) to 7.65 percent. Notes to the Basic Financial Statements 35
54 Notes to the Basic Financial Statements, continued June 30, 2016 (14) Defined Benefit Pension Plan, continued The long-term expected rate of return on pension plan investments was determined using a building-block method in which best-estimate ranges of expected future real rates of return (expected returns, net of pension plan investment expense and inflation) are developed for each major asset class. In determining the long-term expected rate of return, staff took into account both short-term and long-term market return expectations as well as the expected pension fund cash flows. Such cash flows were developed assuming that both members and employers will make their required contributions on time and as scheduled in all future years. Using historical returns of all the funds asset classes, expected compound (geometric) returns were calculated over the short-term (first 10 years) and the long-term (11-60 years) using a building-block approach. Using the expected nominal returns for both short-term and long-term, the present value of benefits was calculated for each fund. The expected rate of return was set by calculating the single equivalent expected return that arrived at the same present value of benefits for cash flows as the one calculated using both short-term and long-term returns. The expected rate of return was then set equivalent to the single equivalent rate calculated above and rounded down to the nearest one quarter of one percent. The table below reflects long-term expected real rate of return by asset class. The rate of return was calculated using the capital market assumptions applied to determine the discount rate and asset allocation. These geometric rates of return are net of administrative expenses. Asset Class New Strategic Allocation Real Return Years 1-10 (1) Real Return Years 11+ (2) Global Equity 51.00% 5.25% 5.71% Global Fixed Income 19.00% 0.99% 2.43% Inflation Sensitive 6.00% 0.45% 3.36% Private Equity 10.00% 6.83% 6.95% Real Estate 10.00% 4.50% 5.13% Infrastructure and Forestland 2.00% 4.50% 5.09% Liquidity 2.00% -0.55% -1.05% (1) An expected inflation of 2.5% used for this period (2) An expected inflation of3.0% used for this period Pension Plan Fiduciary Net Position The plan fiduciary net position disclosed in the GASB 68 accounting valuation report may differ from the plan assets reported in the funding actuarial valuation report due to several reasons. First, for the accounting valuations, CalPERS must keep items such as deficiency reserves, fiduciary self-insurance and OPEB expense included as assets. These amounts are excluded for rate setting purposes in the funding actuarial valuation. In addition, differences may result from early Comprehensive Annual Financial Report closing and final reconciled reserves. 36 Notes to the Basic Financial Statements
55 Notes to the Basic Financial Statements, continued June 30, 2016 (14) Defined Benefit Pension Plan, continued Changes in the Net Pension Liability The following table shows the changes in net pension liability recognized over the measurement period. Total Pension Liability (a) Increase (Decrease) Plan Fiduciary Net Position (b) Net Pension Liability/(Assets) (c)=(a)-(b) Balance at: 6/30/2014 (Valuation Date) (1) $ 66,724,360 $ 50,839,512 $ 15,884,848 Changes Recognized for the Measurement Period: Service Cost 1,489,827 1,489,827 Interest on the Total Pension Liability 5,013,228 5,013,228 Changes of Benefit Terms - Changes of Assumptions (1,378,724) (1,378,724) Difference between Expected and Actual Experience 623, ,559 Contribution from the Employer 1,653,572 (1,653,572) Contributions from Employees 899,150 (899,150) Net Investment Income (2) 1,140,016 (1,140,016) Benefit Payments including Refunds of Employee Contributions (2,363,439) (2,363,439) - Administrative Expense (58,593) 58,593 Net Changes During ,384,451 1,270,706 2,113,745 Balance at: 6/30/2015 (Measurement Date) (1) $ 70,108,811 $ 52,110,218 $ 17,998,593 (1) The fiduciary net position includes receivables for employee service buybacks, deficiency reserves, fiduciary self-insurance and OPEB expense. This may differ from the plan assets reported in the funding actuarial valuation report (2) Net of administrative expenses. Sensitivity of the Net Pension Liability to Changes in the Discount Rate The following presents the net pension liability of the Plan as of the measurement date, calculated using the discount rate of 7.65 percent, as well as what the net pension liability would be if it were calculated using a discount rate that is 1 percentage-point lower (6.65 percent) or 1 percentage-point higher (8.65 percent) than the current rate: Discount Rate - 1% (6.65%) Current Discount Rate (7.65%) Discount Rate +1% (8.65%) Plan's Net Pension Liability/(Assets) $ 28,692,065 $ 17,998,593 $ 9,289,628 Subsequent Events There were no subsequent events that would materially affect the results presented in this disclosure. Notes to the Basic Financial Statements 37
56 Notes to the Basic Financial Statements, continued June 30, 2016 (14) Defined Benefit Pension Plan, continued Recognition of Gains and Losses Under GASB 68, gains and losses related to changes in total pension liability and fiduciary net position are recognized in pension expense systematically over time. The first amortized amounts are recognized in pension expense for the year the gain or loss occurs. The remaining amounts are categorized as deferred outflows and deferred inflows of resources related to pensions and are to be recognized in future pension expense. The amortization period differs depending on the source of the gain or loss: Difference between projected and actual earnings All other amounts 5 year straight-line amortization Straight-line amortization over the average expected remaining service lives of all members that are provided with benefits (active, inactive, and retired) as of the beginning of the measurement period The expected average remaining service lifetime (EARSL) is calculated by dividing the total future service years by the total number of plan participants (active, inactive, and retired). The EARSL for the Plan for the measurement period is 5.0 years, which was obtained by dividing the total service years of 1,267 (the sum of remaining service lifetimes of the active employees) by 253 (the total number of participants: active, inactive, and retired). Note that inactive employees and retirees have remaining service lifetimes equal to 0. Also note that total future service is based on the members probability of decrementing due to an event other than receiving a cash refund. Pension Expense and Deferred Outflows and Deferred Inflows of Resources Related to Pensions As of the end of the measurement period (June 30, 2015), the net pension liability/(asset) is $17,998,593. For the measurement period ending June 30, 2015 (the measurement date), the District incurred a pension expense/(income) of $1,900,821 for the Plan. As of June 30, 2016, the District has deferred outflows and inflows of resources related to pensions as follows: DeferredOutflows of Resources Deferred Inflows of Resources Change in Assumptions $ - $ (1,102,979) Difference between Expected and Actual Experience 498,847 - Net Difference between Projected and Actual Earnings on Pension Plan Investments 2,200,727 (2,587,568) Contributions subsequent to the Mesaurement Date 2,314,320 - Total $ 5,013,894 $ (3,690,547) The amounts above are net of outflows and inflows recognized in the measurement period expense. 38 Notes to the Basic Financial Statements
57 Notes to the Basic Financial Statements, continued June 30, 2016 (14) Defined Benefit Pension Plan, continued $2,314,320 will be recognized as reduction to the Net Pension Liability in the following measurement period, the remaining amounts reported as deferred outflows and deferred inflows of resources related to pensions will be recognized in future pension expense as follows: Measurement Period ended June 30: (15) Retirement Enhancement Plan Plan Description Deferred Outflows/(Inflows) of Resources $ 2016 (463,374) 2017 (463,374) 2018 (463,373) , Thereafter - Effective July 1, 2003, the District established the PARS Retirement Enhancement Plan (the "Plan"), a defined benefit retirement plan, to provide a supplemental retirement benefit to the employee s pension benefit from CALPERS. The Plan is currently funded through PARS, a multiple agency trust. Benefit provisions and all other requirements are established by state statute and the District. Copies of the PARS audited GAAP basis annual financial report may be obtained by writing to PO Box 12919, Newport Beach, CA Eligibility and Benefit An employee is eligible to receive the Plan's benefit at retirement if employed by the District at July 1, 2003, is at least age 50 and has at least 20 years of service or 5 years of service on or after July 1, Employees hired on or after January 1, 2011 are not eligible for the Plan. The monthly retirement benefit is equal to the difference between 1) and 2) below: 1) Benefit Service x Final Pay x PARS Age Factor 2) Benefit Service x Final Pay x CalPERS Age Factor The CalPERS Age Factor is defined as the 2.5% at 55 Local Miscellaneous Member benefit age factor used by CalPERS determined at your age of retirement. The PARS Age Factor is determined at your age of retirement under CalPERS. Both factors by CalPERS retirement age are presented in the following table: Retirement Age CalPERS Age Factor PARS Age Factor REP % 2.000% 0.000% % 2.140% 0.040% % 2.280% 0.080% % 2.420% 0.120% % 2.560% 0.160% % 2.700% 0.200% Benefits are payable as a life annuity for the lifetime of the eligible employee subject to a 2% annual cost-ofliving increase. Two Optional Forms of payments are also available. Notes to the Basic Financial Statements 39
58 Notes to the Basic Financial Statements, continued June 30, 2016 (15) Retirement Enhancement Plan, continued Employees Covered Table: Contribution Description Inactive employees or beneficiaries current receiving benefits: 1 Active employees 98 Total: 99 The District currently funds the Plan through the PARS trust. As of June 30, 2015, the market value of Plan assets is $5,249,145. The actuarial value of asset method smooths past asset gains and losses over five years. The actuarial value of Plan assets at June 30, 2015 is $5,260,331. The unfunded actuarial accrued liability/ (surplus) is ($739,999). The funded status of the Plan on an accrued liability basis is % at June 30, 2015 an increase from the 89.54% reported in the June 30, 2013 valuation. The annual required contribution for the 2014/2015 fiscal year is $229,000 which is calculated at a rate of 2.85% of annual payroll. This amount is comprised of the present value of benefits accruing in the current fiscal year (normal cost) plus a 13-year amortization (on a level-percentage of pay basis) of the unfunded actuarial accrued liability/(surplus) at June 30, Thus, it represents a means to expense the Plan's liabilities in an orderly manner. The net pension obligation at the end of the fiscal year will reflect any contributions made during the fiscal period by the District. The District contributed $181,815 and $229,000 respectively in fiscal years and Contributions were taken from current fiduciary pension assets. In addition to being updated for new census and asset information, the valuation reflects an update to the demographic (mortality and retirement) assumptions to reflect rates from the most recent CalPERS experience study. Actuarial Methods and Assumptions Used to Determine Total Pension Liability For the measurement period ended June 30, 2015 (the measurement date), the total pension liability was determined by rolling forward the June 30, 2014 total pension liability. The June 30, 2014 and the June 30, 2015 total pension liabilities were based on the following actuarial methods and assumptions: Actuarial Cost Method Actuarial Assumptions Discount Rate 3.80% Inflation 2.75% Salary Increases Investment Rate of Return Mortality Rate Table (1) Post Retirement Benefit Increase Entry Age Normal in accordance with the requirements of GASB Statement No % per annum, in aggregate N/A Derived using CalPERS Membership Data for all Funds Assumed to increase 2% per year (1) The mortality table used was developed based on CalPERS specific data. The table includes 20 years of mortality improvements using Society of Actuaries Scale BB. For more details on this table, please refer to the 2014 experience study report. All other actuarial assumptions used in the June 30, 2015 valuation were based on the results of an actuarial experience study for the period from 1997 to 2011, including updates to salary increase, mortality and retirement rates. The Experience Study report can be obtained at CalPERS website under Forms and Publications. 40 Notes to the Basic Financial Statements
59 Notes to the Basic Financial Statements, continued June 30, 2016 (15) Retirement Enhancement Plan, continued Changes since the prior valuation: The discount rate increased from 5.00% to 6.75% to reflect updated capital market assumptions. The salary increase assumption was updated to reflect the 2014 CalPERS experience study. The increase rate for the IRC 415 and 401(a)(17) limits changed from 3.00% to 2.75% to match the assumed inflation rate. An assumption regarding spouse information was added for simplification. Pension Plan Fiduciary Net Position The plan fiduciary net position disclosed in the GASB 68 accounting valuation report may differ from the plan assets reported in the funding actuarial valuation report due to several reasons. We have determined that the amount of the actuarial liability for the Plan as of June 30, 5 the measurement date, is $4,520,332. This amount represents the present value of all Plan benefits projected to be paid by the District for current and future retirees. If the District were to place this amount in a fund earning interest at the rate of 6.75% per year, and all other actuarial assumptions were met, the fund would have enough to pay all expected benefits. This includes Plan benefits for the current retirees as well as for the current active employees expected to retire in the future. This plan was closed to employees hired after January 11, 2011, therefore, the valuation does not consider employees not yet hired as of the valuation date. If the amount of the actuarial liability is apportioned into past service, current service and future service components, the past service component (actuarial accrued liability) is $5,716,471, and the current service component (service cost) is $167,923. The remaining liability reflects the service components (not yet accrued liability) to be accrued in future fiscal years. Discount Rate The table below reflects long-term expected real rate of return by asset class. The rate of return was calculated using the capital market assumptions applied to determine the discount rate and asset allocation. These geometric rates of return are net of administrative expenses. Asset Class Strategic Allocation Long-Term Expected Real Rate of Return U.S. Equity 36.06% 5.52% International Equity 18.94% 5.78% Fixed Income 43.27% 2.12% Real Estate and Alternatives 0.00% 4.12% Cash and Equivalents 1.73% 0.82% Notes to the Basic Financial Statements 41
60 Notes to the Basic Financial Statements, continued June 30, 2016 (15) Retirement Enhancement Plan, continued Changes in the Net Pension Liability The following table shows the changes in net pension liability recognized over the measurement period. Total Pension Liability (a) Increase (Decrease) Plan Fiduciary Net Position (b) Net Pension Liability/(Assets) (c)=(a)-(b) Balance at: 6/30/2014 (Valuation Date) $ 5,716,471 $ 5,118,661 $ 597,810 Changes Recognized for the Measurement Period: Service Cost 167, ,923 Interest on the Total Pension Liability 291, ,019 Difference between Expected and Actual Experience (59,276) (59,276) Changes of Assumptions (1,467,793) (1,467,793) Changes of Benefit Terms - Contribution from the Employer 181,815 (181,815) Contributions from Employees - Net Investment Income 116,980 (116,980) Benefit Payments including Refunds of Employee Contributions (128,012) (128,012) - Administrative Expense (29,113) 29,113 Net Changes During (1,196,139) 141,670 (1,337,809) Balance at: 6/30/2015 (Measurement Date) $ 4,520,332 $ 5,260,331 $ (739,999) Sensitivity of the Net Pension Liability to Changes in the Discount Rate The annual required contribution is highly sensitive to some of the assumptions used in the valuation. To the extent that a single or a combination of assumptions is not met the future liability may fluctuate significantly from its current measurement. The following presents the net pension liability of the Plan as of the measurement date, calculated using the discount rate of 6.75%, as well as what the net pension liability would be if it were calculated using a discount rate that is 1 percentage-point lower (5.75 percent) or 1 percentage-point higher (7.75 percent) than the current rate: Discount Rate - 1% (5.75%) Current Discount Rate (6.75%) Discount Rate +1% (7.75%) Plan's Net Pension Liability/(Assets) $ (19,499) $ (739,999) $ (1,323,281) Subsequent Events There were no subsequent events that would materially affect the results presented in this disclosure. Recognition of Gains and Losses Under GASB 68, gains and losses related to changes in total pension liability and fiduciary net position are recognized in pension expense systematically over time. The first amortized amounts are recognized in pension expense for the year the gain or loss occurs. The remaining amounts are categorized as deferred outflows and deferred inflows of resources related to pensions and are to be recognized in future pension expense. 42 Notes to the Basic Financial Statements
61 Notes to the Basic Financial Statements, continued June 30, 2016 (15) Retirement Enhancement Plan, continued The amortization period differs depending on the source of the gain or loss: Difference between projected and actual earnings All other amounts 5 year straight-line amortization Straight-line amortization over the average expected remaining service lives of all members that are provided with benefits (active, inactive, and retired) as of the beginning of the measurement period Pension Expense and Deferred Outflows and Deferred Inflows of Resources Related to Pensions As of the end of the measurement period (July 1, 2015), the net pension liability/(asset) is ($739,999). For the measurement period ending June 30, 2015 (the measurement date), the District incurred a pension expense/(income) of $49,455 for the Plan. As of June 30, 2016, the District has deferred outflows and inflows of resources related to pensions as follows: DeferredOutflows of Resources Deferred Inflows of Resources Change in Assumptions $ - $ (1,262,507) Difference between Expected and Actual Experience - (50,986) Net Difference between Projected and Actual Earnings on Pension Plan Investments 108,044 - Contributions subsequent to the Mesaurement Date 229,000 - Total $ 337,044 $ (1,313,493) The amounts above are net of outflows and inflows recognized in the measurement period expense. $229,000 will be recognized as reduction to the Net Pension Liability in the following measurement period, the remaining amounts reported as deferred outflows and deferred inflows of resources related to pensions will be recognized in future pension expense as follows: Measurement Period ended June 30: Deferred Outflows/(Inflows) of Resources $ 2017 (186,565) 2018 (186,565) 2019 (186,565) 2020 (186,565) 2021 (213,576) Thereafter (245,613) Notes to the Basic Financial Statements 43
62 Notes to the Basic Financial Statements, continued June 30, 2016 (16) Excess Benefit Plan Plan Description Effective January 1, 2011, the District established the Excess Benefit Plan (the "Plan") to provide a benefit to participants in the PARS Retirement Enhancement Plan (REP) whose benefit is limited due to the dollar limitation under Section 415 of the Internal Revenue Code. The plan is an agent multiple employer plan. Benefit provisions and all other requirements are established by state statute and the District. Copies of the PARS audited GAAP basis annual financial report may be obtained by writing to PO Box 12919, Newport Beach, CA Eligibility Eligibility for the Plan requires participation in the REP. In general, the Plan will pay a benefit equal to the full REP benefit if the benefit payable under CalPERS is greater than the applicable dollar limitation at retirement. In addition, the Plan will pay a benefit equal to a portion of the REP benefit, if the combined REP and CalPERS benefit is greater than the applicable dollar limit at retirement. Employees hired on or after January 1, 2011 are not eligible for the Plan. Funding Policy The Plan is unfunded and benefits under the Plan are paid through the general fund of the District or through an Excess Benefit Plan Trust (the Trust ) that has been set up by the District through PARS. The Trust is a grantor trust held by the District subject to the claims of the District s creditors. As of June 30, 2015, the market value of assets in the Trust is $4,192. Employees Covered Table: Inactive employees or beneficiaries current receiving benefits: 1 Active employees 98 Total: 99 Contribution Description The annual required contribution for the fiscal year is $24,360. This amount is comprised of estimated benefit payables for the current fiscal year. The net pension obligation at the end of the fiscal year will reflect any benefit payments made during the fiscal period by the District. Actuarial Methods and Assumptions Used to Determine Total Pension Liability For the measurement period ended June 30, 2015 (the measurement date), the total pension liability was determined by rolling forward the June 30, 2014 total pension liability. The June 30, 2015 total pension liabilities were based on the following actuarial methods and assumptions: 44 Notes to the Basic Financial Statements
63 Notes to the Basic Financial Statements, continued June 30, 2016 (16) Excess Benefit Plan, continued Actuarial Cost Method Actuarial Assumptions Discount Rate 3.80% Inflation 2.75% Salary Increases Investment Rate of Return Mortality Rate Table (1) Post Retirement Benefit Increase Entry Age Normal in accordance with the requirements of GASB Statement No % per annum, in aggregate N/A Derived using CalPERS Membership Data for all Funds Assumed to increase 2% per year (1) The mortality table used was developed based on CalPERS specific data. The table includes 20 years of mortality improvements using Society of Actuaries Scale BB. For more details on this table, please refer to the 2014 experience study report. All other actuarial assumptions used in the June 30, 2015 valuation were based on the results of an actuarial experience study for the period from 1997 to 2011, including updates to salary increase, mortality and retirement rates. The Experience Study report can be obtained at CalPERS website under Forms and Publications. Changes is assumptions since the prior valuation: The discount rate increased from 3.75% to 3.80% based on bond index rates. The salary increase assumption was updated to reflect the 2014 CalPERS experience study. The increase rate for the IRC 415 and 401(a)(17) limits changed from 3.00% to 2.75% to match the assumed inflation rate. An assumption regarding spouse information was added for simplification. Market Value of Plan Assets The Plan is unfunded and benefits under the Plan are paid through the general fund of the District or through an Excess Benefit Plan Trust (the Trust ) that has been set up by the District through PARS. The Trust is a grantor trust held by the District subject to the claims of the District s creditors. In the previous year the market value of this asset was included in the Plan Fiduciary Net Position. Based on GASB 73 these assets were removed from the calculation of current year net pension liability. Pension Plan Fiduciary Net Position We have determined that the amount of the actuarial liability for the Plan as of June 30, 2015, the measurement date, is $1,264,680. This amount represents the present value of all Plan benefits projected to be paid by the District for current and future retirees. If the District were to place this amount in a fund earning interest at the rate of 3.80% per year, and all other actuarial assumptions were met, the fund would have enough to pay all expected benefits. This includes Plan benefits for the current retirees as well as for the current active employees expected to retire in the future. This plan was closed to employees hired after January 11, 2011, therefore, the valuation does not consider employees not yet hired as of the valuation date. Notes to the Basic Financial Statements 45
64 Notes to the Basic Financial Statements, continued June 30, 2016 (16) Excess Benefit Plan, continued If the amount of the actuarial liability is apportioned into past service, current service and future service components, the past service component (actuarial accrued liability) is $1,520,054, and the current service component (service cost) is $70,173. The remaining liability reflects the service components (not yet accrued liability) to be accrued in future fiscal years. Changes in the Net Pension Liability The following table shows the changes in net pension liability recognized over the measurement period. Total Pension Liability (a) Increase (Decrease) Plan Fiduciary Net Position (b) Net Pension Liability/(Assets) (c)=(a)-(b) Balance at: 6/30/2014 (Valuation Date) $ 1,523,457 $ 3,403 $ 1,520,054 Changes Recognized for the Measurement Period: Service Cost 70,173 70,173 Interest on the Total Pension Liability 59,298 59,298 Difference between Expected and Actual Experience 153, ,569 Changes of Assumptions (517,106) (517,106) Changes of Benefit Terms - Contribution from the Employer - Contributions from Employees - Net Investment Income - Benefit Payments including Refunds of Employee Contributions (24,711) (24,711) Administrative Expense - Adjustment for GASB 73 - (3,403) 3,403 Net Changes During (258,777) (3,403) (255,374) Balance at: 6/30/2015 (Measurement Date) $ 1,264,680 $ - $ 1,264,680 Sensitivity of the Net Pension Liability to Changes in the Discount Rate The annual required contribution is highly sensitive to some of the assumptions used in the valuation. To the extent that a single or a combination of assumptions is not met the future liability may fluctuate significantly from its current measurement. The following presents the net pension liability of the Plan as of the measurement date, calculated using the discount rate of 3.80 percent, as well as what the net pension liability would be if it were calculated using a discount rate that is 1 percentage-point lower (2.80 percent) or 1 percentage-point higher (4.80 percent) than the current rate: Discount Rate - 1% (2.80%) Current Discount Rate (3.80%) Discount Rate +1% (4.80%) Plan's Net Pension Liability/(Assets) $ 1,507,805 $ 1,264,680 $ 1,072,555 Subsequent Events There were no subsequent events that would materially affect the results presented in this disclosure. 46 Notes to the Basic Financial Statements
65 Notes to the Basic Financial Statements, continued June 30, 2016 (16) Excess Benefit Plan, continued Pension Expense and Deferred Outflows and Deferred Inflows of Resources Related to Pensions As of the end of the measurement period (June 30, 2015), the net pension liability/(asset) is $1,264,680. For the measurement period ending June 30, 2015 (the measurement date), the District incurred a pension expense/(income) of $96,916 for the Plan. As of June 30, 2016, the District has deferred outflows and inflows of resources related to pensions as follows: DeferredOutflows of Resources Deferred Inflows of Resources Change in Assumptions $ - $ (465,958) Difference between Expected and Actual Experience 138,379 - Net Difference between Projected and Actual Earnings on Pension Plan Investments - - Contributions subsequent to the Mesaurement Date 25,205 - Total $ 163,584 $ (465,958) The amounts above are net of outflows and inflows recognized in the measurement period expense. $25,205 will be recognized as reduction to the Net Pension Liability in the following measurement period, the remaining amounts reported as deferred outflows and deferred inflows of resources related to pensions will be recognized in future pension expense as follows: Measurement Period ended June 30: Deferred Outflows/(Inflows) of Resources $ 2017 (35,958) 2018 (35,958) 2019 (35,958) 2020 (35,958) 2021 (35,958) Thereafter (147,789) Notes to the Basic Financial Statements 47
66 Notes to the Basic Financial Statements, continued June 30, 2016 (17) Other Post-Employment Benefits Plan Description The District administers a single-employer defined benefit healthcare plan which provides medical insurance benefits to eligible retirees and their eligible dependents in accordance with District ordinances. Eligibility Employees are eligible for retiree health care benefits according to the following matrix: Minimum Age Years of Service Coverage at Retirement with District Provided Tier 1 - Hired Before 11/1/2006 and Executives Employee Only Tier 2 - Hired Between 11/1/2006 & 1/1/ Employee Only Tier 3 - Hired Before 11/1/2011 and Executives Employee and Dependents Tier 4 - Hired Between 11/1/2006 & 1/1/2011 Employee and and Executives Dependents Health Tier 5 - Hired After 1/1/ Reimbursement Account Employees hired on or after January 1, 2011 are enrolled in a defined contribution health savings plan after five years of employment. Employees Covered Table: Funding Policy Inactive employees or beneficiaries with coverage 36 Inactive employees or beneficiaries without coverage 6 Active employees or beneficiaries with coverage 76 Active employees or beneficiaries without coverage 21 Total: 139 Retirees must pay the portion of the coverage, if any, not covered by their benefits. The required contribution is based on projected pay-as-you-go financing requirements, with an additional amount to prefund benefits as determined annually by the District s Board of Directors. District assets designated for OPEB are invested in California Employers Retiree Benefits Trust (CERBT) Strategy 1, which is a GASB 45 qualified irrevocable trust under IRC Section 115 and administered by CalPERS. Annual contributions by the District are equal to at least 75% of the Annual Required Contribution (ARC). Benefit payments equal to the annual direct plus implicit subsidy are paid from the trust. For fiscal year 2016, the District contributed $988,000 to the plan, including $381,192 for current premiums (approximately 84% of the total premiums) and an additional $666,672 to prefund. Plan members receiving benefits contributed $59,864, or approximately 16% of the total premiums. Actuarial Methods and Assumptions Projections of benefits for financial reporting purposes are based on the substantive plan (the plan as understood by the employer and the plan members) and include the types of benefits provided at the time of each valuation and the historical pattern of sharing of benefit costs between the employer and plan members to that point. The actuarial methods and assumptions used include techniques that are designed to reduce the effects of short-term volatility in actuarial accrued liabilities and the actuarial value of assets, consistent with the long-term perspective of the calculations. 48 Notes to the Basic Financial Statements
67 Notes to the Basic Financial Statements, continued June 30, 2016 (17) Other Post-Employment Benefits, continued Actuarial Cost Method Actuarial Assumptions Discount Rate 6.75% Investment Rate of Return General District Assets 3.75% Irrevocable Trust Assets 7.28% (CERBT Strategy 1) Inflation Rate Payroll Growth Rate (1) 3.00% Healthcare Trend Rates Liabilities are based on the Entry Age Normal level percent of pay cost method. 2.75% (General) 4.00% (CPI Medical Care) Annual increases per capita claims costs and plan premium: Year Ending 30-Jun Medical Coverage 8.25% 7.25% 6.75% 6.00% 5.30% Increases in Direct Subsidy Transition to ultimate rate 4.40% Medicare Part B premiums are assumed to increase 5.0% annually. Dental and vision premiums are assumed to increase 4.0% annually. To apply the Entry Age Normal actuarial cost method, annual medical, Medicare Part B, dental and vision perium cost increases between each participant's entry age and the valuation date are assumed to be 8.25%, 5.0%, 4.0% and 4.0%, respectively. Assumed to increase with healhtcare trend rates (1) Annual Payroll Growth Rate was based on CalPERS 2014 experience study report Assumption changes: The discount rate was changed from 7.00% to 6.75% based on updated expectations of long-term returns on trust and general District assets. Healthcare, dental and vision trend rates were reset to reflect updated cst increase expectations. Medicare per capita claims costs were updated to reflect recent experience. Retirement, disability, mortality and salary increase rates were updated from the rates used in the 6/30/2012 CalPERS Public Agency Miscellaneous actuarial valuation to rates used in the 6/30/2014 CalPERS Public Agency Miscellaneous actuarial valuation. The percent of future retirees eligible for retiree only direct subsidy assumed to elect coverage at retirement changed from 50% to 100% to reflect recent plan experience. The inflation assumption was changed from 2.80% to 2.75% based on an updated historical analysis of inflation rates and forward-looking market expectations. The percent of retirees electing a spouse has changed to 65% to reflect updated expectations based on recent plan experience. The prior valuation assumed that 100% of future retirees currently covering a spouse would elect spouse coverage at retirement, and 80% of future retirees currently waiving coverage who elect coverage at retirement would elect a spouse. The above percentages were reduced by 50% if spouse coverage was only available on a self-pay basis. The percent of future retirees electing non-spouse dependent coverage at retirement changed from 10% to 0% to reflect updated expectations based on recent plan experience. Notes to the Basic Financial Statements 49
68 Notes to the Basic Financial Statements, continued June 30, 2016 (17) Other Post-Employment Benefits, continued Discount Rate The June 30, 2015 actuarial valuation included a 6.75% discount rate. This rate is based on a blend of the longterm expected return on (1) plan assets to the extent they are projected to be sufficient to pay plan benefits, and (2) employer general assets to the extent that projected plan assets are insufficient to pay plan benefits. The expected plan asset return (if any) is based on a blend of the plan s expected asset class returns and target asset allocation, which was based on CERBT investment Strategy 1 and was provided by CalPERS. The expected employer asset return is based on an estimate of short-term investments, using the average 25-year historical return of the Local Agency Investment Fund (LAIF) as a reference. Annual OPEB Cost and Net OPEB Obligation The District s annual other post-employment benefit (OPEB) cost (expense) is calculated based on the annual required contribution of the employer (ARC), an amount actuarially determined in accordance with the parameters of GASB Statement 45. The ARC represents a level of funding that, if paid on an ongoing basis, is projected to cover normal cost each year and amortize any unfunded actuarial liabilities (or funding excess) over a period not to exceed thirty years. GASB 45 accounting rules require selection of a method for amortizing the unfunded actuarial accrued liability (UAAL) when calculating the ARC and Annual OPEC Cost. For the current valuation, the District has elected to amortize the UAAL as a level percentage of payroll over a 30-year closed period. As of June 30, 2015, the remaining amortization period is twenty-two years. The following table shows the components of the District s annual OPEB cost for the year, the amount actually contributed to the plan, and changes in the District s net OPEB obligation: 50 Notes to the Basic Financial Statements Annual required contribution $ 1,414,502 Interest on net OPEB obligation 123,345 (Adjustment to annual required contribution) (123,345) Annual OPEB cost (expense) 1,414,502 Contributions made (988,000) Increase in net OPEB obligation 426,502 Net OPEB obligation - beginning of year 3,083,617 Net OPEB obligation - end of year $ 3,510,119 The District s annual OPEB cost, the percentage of annual OPEB cost contributed to the plan, and the net OPEB obligation for 2009 (the year of implementation) and 2016 were as follows: Funded Status and Funding Progress % of Annual Annual OPEB Cost Net OPEB Fiscal Year OPEB Cost Contributed Obligation ,377, % 2,670, ,373, % 3,083, ,414, % 3,510,119 As of June 30, 2015, the most recent actuarial valuation date, the plan was 27.4% funded. The actuarial accrued liability for benefits was $16,728,353, the actuarial value of assets was $4,584,369 and the unfunded actuarial accrued liability (UAAL) was $12,143,984. The covered payroll (annual payroll of active employees covered by the plan) was $8,003,311 and the ratio of the UAAL to the covered payroll was 151.7%. Actuarial valuations of an ongoing plan involve estimates of the value of reported amounts and assumptions about the probability of occurrence of events far into the future. Examples include assumptions about future
69 Notes to the Basic Financial Statements, continued June 30, 2016 (17) Other Post-Employment Benefits, continued employment, mortality, and the healthcare cost trend. Amounts determined regarding the funded status of the plan and the annual required contributions of the employer are subject to continual revision as actual results are compared with past expectations and new estimates are made about the future. The schedule of funding progress, presented as required supplementary information following the notes to the financial statements, presents multi-year trend information about whether the actuarial value of plan assets is increasing or decreasing over time relative to the actuarial accrued liabilities for benefits. (18) Risk Management The District is exposed to various risks of loss related to torts, theft of, damage to and destruction of assets; errors and omissions; injuries to employees; and natural disasters. The District has purchased various insurance policies to manage the potential liabilities that may occur from the previously named sources and is a member of the Association of California Water Agencies Joint Powers Insurance Authority ( Authority ). The Authority is a risk-pooling, self-insurance authority, created under provisions of California Government Code Sections 6500 et. seq. The purpose of the Authority is to arrange and administer programs of self-insured losses and to purchase excess insurance coverage. At June 30, 2016, the District participated in the liability and property programs of the Authority as follows: Property Loss: Insured up to replacement value with $25,000 deductible per occurrence for buildings, personal property, fixed equipment, and catastrophic coverage. The deductible for mobile equipment is $5,000. The deductible on vehicles is $5,000. The boiler and machinery deductible varies on incident. There is a $150,000,000 program limit with replacement value. These deductible vary based on the property type. The Authority is self-insured up to $100,000 per occurrence and has purchased excess insurance coverage in the amount of $50,000,000. General Liability: The District is insured for general liability through ACWA/JPIA up to $2,000,000 per occurrence, and ACWA/JPIA has purchased additional coverage from commercial insurers, subject to policy aggregate limits. Auto Liability: The District is insured for automobile liability through ACWA/JPIA up to $2,000,000 per occurrence, and ACWA/JPIA has purchased additional coverage from commercial insurers, subject to policy aggregate limits. UST Pollution Liability: The District is insured for underground storage tank liability through ACWA/JPIA with $10,000 deductible per occurrence. The Authority is self-insured up to $500,000 per occurrence and has purchased excess insurance coverage in the amount of $3,000,000,000 subject to a $75,000 aggregate expense limit. Public Officials and Employees Errors and Omissions: The District is insured for through ACWA/JPIA up to $2,000,000 per occurrence, and ACWA/JPIA has purchased additional coverage from commercial insurers, subject to policy aggregate limits. Workers Compensation: The District is insured to statutory requirements. In addition to the above, the Authority also has purchased insurance coverage as follows: Fidelity Coverage: $100,000 total insurance with a $1,000 deductible covering public employee dishonesty, forgery or alteration, and computer fraud. Settled claims have not exceeded any of the coverage amounts in any of the last three fiscal year and there were no reductions in the District s insurance coverage during the years ending June 30, 2016, 2015 and Liabilities are recorded when it is probable that a loss has been incurred and the amount of the loss can be reasonably estimated net of the respective insurance coverage. Liabilities include an amount for claims that have been incurred but not reported (IBNR). There were no IBNR claims payable as of June 30, 2016, 2015 and Notes to the Basic Financial Statements 51
70 Notes to the Basic Financial Statements, continued June 30, 2016 (19) Commitments and Contingencies Construction Commitments The District has entered into several material construction contracts. The following schedule lists the major contractual commitments as of June 30, 2016: Grant Awards Project Vendor Amount Water Treatment Plant Expansion Construction SSC Construction, Inc. $ 4,030,715 Automatic Meter Reader Network Itron 4,025,110 Meter Replacement National Meter & Automation 3,050,923 Construction of Groundwater Well Southwest Pump & Drilling 1,571,319 Grant funds received by the District are subject to audit by the grantor agencies. Such audit could lead to requests for reimbursements to the grantor agencies for expenditures disallowed under terms of the grant. Management of the District believes that such disallowances, if any, would not be significant. Litigation In the ordinary course of operations, the District is subject to claims and litigation from outside parties. After consultation with legal counsel, the District believes the ultimate outcome of such matters, if any, will not materially affect its financial condition. San Bernardino Valley Municipal Water District et al. vs. San Gabriel Valley Water Company et al., San Bernardino Superior Court Case No. CIV DS This case was filed September 12, 2013, and alleges that defendants San Gabriel Water Company and Fontana Union Water Company have extracted more water from the Rialto-Colton Groundwater Basin than permitted under a 1961 decree. It alleges damages in an unknown amount and also seeks an injunction and other remedies. The case is currently in the discovery stage. The District is not a named party to the lawsuit, but it is potentially affected by the lawsuit in three ways: (1) The District is the majority owner of Fontana Union Water Company. (2) The District is entitled to a portion of the water pumped by San Gabriel Water Company from the Rialto-Colton Basin, and is compensated by San Gabriel Water Company for that water. Thus, if San Gabriel Water Company and Fontana Union Water Company are forced to reduce pumping, the District will lose revenue. (3) Under Fontana Union Water Company s approved bankruptcy reorganization plan, if its production of water in the Rialto-Colton Basin is limited by court order, the District is obligated to reduce its water production from the Chino Basin. This may in turn force the District to Purchase more expensive water. On October 13, 2014, the District s Board of Directors agreed to intervene in the lawsuit with the goal to assist the parties to reach a resolution. The defendants in the lawsuit are contesting the matter vigorously. The District believes there are meritorious defenses. However, the District s attorney is unable to characterize the likelihood of an unfavorable outcome as either probable or remote. Similarly, the attorney is unable to estimate the amount or range of potential loss, should an unfavorable outcome occur. (20) Prior Period Adjustment The beginning net position has been decreased by $7,045,639 to correct the calculation of estimated unbilled water sales revenues (revenues earned as of June 30 th but not yet billed to the customer). District staff discovered and corrected the error in the current fiscal year, but the cumulative effect from previous fiscal years required a restatement to beginning net position. 52 Notes to the Basic Financial Statements
71 Notes to the Basic Financial Statements, continued June 30, 2016 <Page Intentionally Left Blank Notes to the Basic Financial Statements 53
72
73 Required Supplementary Information
74 Defined Benefit Pension Plan (PERS) Schedule of Changes in Net Pension Liability and Related Ratios As of June 30, for the Last Ten Fiscal Years (1) MEASUREMENT PERIOD TOTAL PENSION LIABILITY Service Cost $ 1,503,857 $ 1,489,827 Interest 4,682,615 5,013,228 Changes of Benefits Terms - - Changes in Assumptions - (1,378,724) Difference Between expected and Actual Experience - 623,559 Benefit Payments, Including Refunds of employee Contributions (2,290,095) (2,363,439) Net Change in Total Pension Liability $ 3,896,377 $ 3,384,451 Total Pension Liability - Beginning 62,827,983 66,724,360 Total Pension Liability - Ending (a) $ 66,724,360 $ 70,108,811 PLAN FIDUCIARY NET POSITION Contribution - Employer $ 1,517,017 $ 1,653,572 Contribution - Employee 734, ,150 Net Investment Income 7,556,918 1,140,016 Benefit Payments, Including Refunds of Employee Contributions (2,290,095) (2,363,439) Administrative Expense - (58,593) Net Change in Fiduciary Net Position $ 7,517,880 $ 1,270,706 Plan Fiduciary Net Position - Beginning 43,321,632 50,839,512 Plan Fiduciary Net Position - Ending (b) $ 50,839,512 $ 52,110,218 Plan Net Pension Liability/(Assets) - Ending (a) - (b) $ 15,884,848 $ 17,998,593 Plan Fiduciary Net Position as a Percentage of the Total Pension Liability 76.19% 74.33% Covered-Employee Payroll $ 9,082,284 $ 9,362,786 Plan Net Pension Liability/(Asset) as a Percentage of Covered-Employee Payroll % % (1) Historical information is required only for measurement for which GASB 68 is applicable. Fiscal Year 2015 was the first year of implementation, therefore only two years are shown. (2) Net of administrative expenses. Notes to Schedule: Benefit Changes: The figures above do not include any liability impact that may have rsulted from plan changes which occurred after June 30, 2014 valuation date. This applies for voluntary benefit chnages as well as any offers of Two Years Additional Service Credit (a.k.a. Golden Handshakes). Changes of Assumptions: The discount rate was changed from 7.5 percent (net of administrative expense ) to 7.65 percent 52 Defined Benefit Pension Plan (PERS) Schedule of Changes in Net Pension Liability
75 Defined Benefit Pension Plan (PERS) Schedule of Plan Contributions As of June 30, for the Last Ten Fiscal Years (1) Actuarially Determined Contribution $ 2,246,194 $ 2,314,320 Contribution in Relation to the Actuarially Determined Contribution (2,246,194) (2,314,320) Contribution Deficiency (Excess) $ - $ - Covered-Employee Payroll 9,362,786 9,584,870 Contributions as a Percentage of Covered-Employee Payroll 23.99% 24.15% (1) Historical information is required only for measurement for which GASB 68 is applicable. Fiscal Year 2015 was the first year of implementation, therefore only two years are shown. Note to Schedule: Valuation Date: June 30, 2013 Methods and assumptions used to determine contribution rates: Actuarial cost method Entry age normal cost method Amortization method Level percentage of payroll, closed Assets valuation method Market Value Inflation 2.75% Salary Increases 3.30% to 14.20% Payroll growth 3.00% Investment rate of return 7.50% net of pension investment and administrative expenses, including inflation. Retirement age Mortality The probabilities of retirement are based on the 2010 CalPERS Experience Study for the period from 1997 to The probabilities of mortality are based on the 2010 CalPERS Experience Study for the period from 1997 to Pre-retirement and post-retirement mortality rates include 5 years of projected mortality improvement using Scale AA published by the Society of Actuaries. Defined Benefit Pension Plan (PERS) Schedule of Plan Contributions 53
76 Retirement Enhancement Pension Plan (PARS) Schedule of Changes in Net Pension Liability and Related Ratios As of June 30, for the Last Ten Fiscal Years (1) MEASUREMENT PERIOD TOTAL PENSION LIABILITY Service Cost $ 155,755 $ 167,923 Interest 275, ,019 Difference Between expected and Actual Experience - (59,276) Changes in Assumptions - (1,467,793) Changes of Benefits Terms - - Benefit Payments, Including Refunds of employee Contributions (128,070) (128,012) Net Change in Total Pension Liability $ 302,947 $ (1,196,139) Total Pension Liability - Beginning 5,413,524 5,716,471 Total Pension Liability - Ending (a) $ 5,716,471 $ 4,520,332 PLAN FIDUCIARY NET POSITION Contribution - Employer $ - $ 181,815 Contribution - Employee - - Net Investment Income 642, ,980 Benefit Payments, Including Refunds of Employee Contributions (105,433) (128,012) Administrative Expense (51,373) (29,113) Net Change in Fiduciary Net Position $ 485,405 $ 141,670 Plan Fiduciary Net Position - Beginning 4,633,256 5,118,661 Plan Fiduciary Net Position - Ending (b) $ 5,118,661 $ 5,260,331 Plan Net Pension Liability/(Assets) - Ending (a) - (b) $ 597,810 $ (739,999) Plan Fiduciary Net Position as a Percentage of the Total Pension Liability 89.54% % Covered-Employee Payroll $ 8,222,919 $ 8,237,008 Plan Net Pension Liability/(Asset) as a Percentage of Covered-Employee Payroll 7.27% -8.98% (1) Historical information is required only for measurement for which GASB 68 is applicable. Fiscal Year 2015 was the first year of implementation, therefore only two years are shown. (2) Net of administrative expenses. Notes to Schedule: Benefit Changes: There were no changes in benefits Changes of Assumptions: * The discount rate increased from 5.00% to 6.75% to reflect updated capital market assumptions. * The salary increase assumption was updated to reflect 2014 CalPERS experience study. * The increase rate for IRC 415 and 401(a)(17) limits changed from 3.00% to 2.75% to match the assumed inflation rate. * An assumption regarding spouse information was added for simplification. 54 Retirement Enhancement Pension Plan (PARS) Schedule of Changes in Net Pension Liability
77 Retirement Enhancement Pension Plan (PARS) Schedule of Plan Contributions As of June 30, for the Last Ten Fiscal Years (1) Actuarially Determined Contribution $ 181,815 $ 229,000 Contribution in Relation to the Actuarially Determined Contribution (181,815) (229,000) Contribution Deficiency (Excess) $ - $ - Covered-Employee Payroll 8,237,008 8,006,799 Contributions as a Percentage of Covered-Employee Payroll 2.21% 2.86% (1) Historical information is required only for measurement for which GASB 68 is applicable. Fiscal Year 2015 was the first year of implementation, therefore only two years are shown. Note to Schedule: Valuation Date: June 30, 2015 Methods and assumptions used to determine contribution rates: Actuarial cost method Entry age normal Amortization method Level percentage of payroll, closed Remaining amortization period 13 years Assets valuation method 5-year Inflation 2.75% Salary Increases 3.0% per annum, in aggregate Investment rate of return 6.75% net of pension investment and administrative expenses, including inflation. Retirement age Mortality The probabilities of retirement are based on the 2010 CalPERS Experience Study for the period from 1997 to The probabilities of mortality are based on the 2010 CalPERS Experience Study for the period from 1997 to Pre-retirement and post-retirement mortality rates include 5 years of projected mortality improvement using Scale AA published by the Society of Actuaries. Retirement Enhancement Pension Plan (PARS) Schedule of Plan Contributions 55
78 Excess Benefit Pension Plan Schedule of Changes in Net Pension Liability and Related Ratios As of June 30, for the Last Ten Fiscal Years (1) ` TOTAL PENSION LIABILITY Service Cost $ 59,051 $ 70,173 Interest 55,507 59,298 Difference Between expected and Actual Experience - 153,569 Changes in Assumptions - (517,106) Changes of Benefits Terms - - Benefit Payments, Including Refunds of employee Contributions (24,485) (24,711) Net Change in Total Pension Liability $ 90,073 $ (258,777) Total Pension Liability - Beginning 1,433,384 1,523,457 Total Pension Liability - Ending (a) $ 1,523,457 $ 1,264,680 PLAN FIDUCIARY NET POSITION Contribution - Employer $ 22,330 $ - Contribution - Employee - - Net Investment Income Benefit Payments, Including Refunds of Employee Contributions (24,226) - Other Changes in Fiduciary Net Position (48) (3,403) Net Change in Fiduciary Net Position $ (1,838) $ (3,403) Plan Fiduciary Net Position - Beginning 5,241 3,403 Plan Fiduciary Net Position - Ending (b) $ 3,403 $ - Plan Net Pension Liability/(Assets) - Ending (a) - (b) (2) $ 1,520,054 $ 1,264,680 Plan Fiduciary Net Position as a Percentage of the Total Pension Liability 0.22% 0.00% Covered-Employee Payroll $ 8,222,919 $ 8,237,008 Plan Net Pension Liability/(Asset) as a Percentage of Covered-Employee Payroll 18.49% 15.35% (1) Historical information is required only for measurement for which GASB 68 is applicable. Fiscal Year 2015 was the first year of implementation, therefore only two years are shown. (2) Plan Fiduciary Net Posistion balance at previos fiscal year end included pension assets. Under GASB 73, pension assets subject to District's creditors should be reported as assets of the District rather than Plan Fiduciary Net Position. Notes to Schedule: Benefit Changes: There were no changes in benefits Changes of Assumptions: * The discount rate increased from 3.75% to 3.80% based on bond index rates. * The salary increase assumption was updated to reflect 2014 CalPERS experience study. * The increase rate for IRC 415 and 401(a)(17) limits changed from 3.00% to 2.75% to match the assumed inflation rate. * An assumption regarding spouse information was added for simplification. 56 Excess Benefit Pension Plan Schedule of Changes in Net Pension Liability
79 Excess Benefit Pension Plan Schedule of Plan Contributions As of June 30, for the Last Ten Fiscal Years (1) Actuarially Determined Contribution $ 24,711 $ 25,205 Contribution in Relation to the Actuarially Determined Contribution (24,711) (25,205) Contribution Deficiency (Excess) $ - $ - Covered-Employee Payroll 8,237,008 8,006,799 Contributions as a Percentage of Covered-Employee Payroll 0.30% 0.31% (1) Historical information is required only for measurement for which GASB 68 is applicable. Fiscal Year 2015 was the first year of implementation, therefore only one year is shown. Note to Schedule: Valuation Date: June 30, 2015 Methods and assumptions used to determine contribution rates: Actuarial cost method Entry age normal Amortization method Level percentage of payroll, closed Remaining amortization period 15 years Assets valuation method 5-year Inflation 2.75% Salary Increases Varies by entry age and service Investment rate of return N/A Retirement age Mortality The probabilities of retirement are based on the 2010 CalPERS Experience Study for the period from 1997 to The probabilities of mortality are based on the 2010 CalPERS Experience Study for the period from 1997 to Pre-retirement and post-retirement mortality rates include 5 years of projected mortality improvement using Scale AA published by the Society of Actuaries. Excess Benefit Pension Plan Schedule of Plan Contributions 57
80 Other Post-Employment Benefits Plan Schedule of Funding Progress For the Year Ended June 30, 2016 Schedule of Funding Progress The Schedule of Funding Progress below shows the recent history of the actuarial value of assets, actuarial accrued liability, their relationship, and the relationship of the unfunded actuarial accrued liability to payroll. The schedule of funding progress, presented below presents multiyear trend information about whether the actuarial value of plan assets is increasing or decreasing over time relative to the actuarial accrued liability for benefits. Actuarial Entry Age Actuarial Value Unfunded Funded Annual Liability (Excess Valuation Normal Accrued of Assets Liability (Excess Ratio Covered Assets) as a % of Date Liability [A] [B] Assets) [A-B] [B/A] Payroll [C] Payroll [(A-B)/C] June 30, ,320,000 1,416,000 11,904, % 8,213, % June 30, ,955,000 2,813,000 12,142, % 7,907, % June 30, ,728,353 4,584,369 12,143, % 8,003, % 58 Other Post-Employment Benefits Plan Schedule of Funding Progress
81 Statistical Section
82
83 Statistical Section This part of the District s comprehensive annual financial report presents detailed information as a context for understanding what the information in the financial statements, note disclosures, and required supplementary information says about the District s overall financial health. Table of Contents Page No. Financial Trends These schedules contain information to help the reader understand how the District s financial performance and well-being have changed over time. Revenue Capacity These schedules contain information to help the reader assess the District s most significant own-source revenue, water sales. Debt Capacity These schedules present information to help the reader assess the affordability of the District s current levels of outstanding debt and the District s ability to issue additional debt in the future. Demographic Information These schedules offer demographic indicators to help the reader understand the environment within which the District s financial activities take place. Operating Information These schedules contains service and infrastructure data to help the reader understand how the information in the District s financial report relates to the service provided by the District. Statistical Section 59
84 Changes in Net Position and Net Position by Component Last Ten Fiscal Years Fiscal Year Changes in net position: Operating revenues (see Schedule 2) $ 54,829,916 $ 57,450,068 $ 55,672,904 $ 61,108,993 Operating expenses (see Schedule 3) (50,379,152) (54,977,001) (57,386,251) (60,061,448) Operating income(loss) 4,450,764 2,473,067 (1,713,347) 1,047,545 Non-operating revenues(expenses) Investment income 4,122,607 3,102,442 2,093,797 1,938,155 Taxes and assessments Rent and lease revenue 212, , , ,329 Interest expense (7,501,456) (7,666,073) (8,144,911) (8,915,969) Amortization of deferred charge on refunding (176,783) (174,390) (179,187) (193,578) Gain (loss) on disposal of assets 25,328 (466,311) 89, ,387 Other nonoperating revenues 3,671,174 4,322,277 1,828,633 6,122,507 Other nonoperating expenses (1,089,950) (2,759,643) (1,281,167) (4,045,032) Total non-operating revenues(expenses), net (736,497) (3,432,126) (5,393,195) (4,512,163) Net income before capital contributions 3,714,267 (959,059) (7,106,542) (3,464,618) Capital contributions 16,641,858 4,006,780 1,484,108 2,845,995 Changes in net position $ 20,356,125 $ 3,047,721 $ (5,622,434) $ (618,623) Net position by component: Net investment in capital assets $ 208,455,979 $ 214,232,848 $ 217,733,045 $ 207,808,294 Unrestricted 68,120,050 65,390,902 55,215,878 64,522,006 Total net position $ 276,576,029 $ 279,623,750 $ 272,948,923 (1) $ 272,330,300 Notes: (1) The District made a prior period adjustment of ($1,052,393). (2) The District made a net prior period adjustment of ($67,589). (3) The District made a net prior period adjustment of ($20,395,643). (4) The District made a prior period adjustment of ($7,045,639). SOURCE: Cucamonga Valley Water District Accounting Division 60 Changes in Net Position and Net Position by Component
85 Schedule 1 Fiscal Year $ 65,781,091 $ 74,705,240 $ 77,575,410 $ 83,426,225 $ 77,904,102 $ 81,198,764 (58,192,485) (61,486,795) (62,940,607) (67,892,079) (67,584,114) (64,439,623) 7,588,606 13,218,445 14,634,803 15,534,146 10,319,988 16,759, , , , , ,174 1,569, , , , , , ,184 (8,137,741) (7,502,696) (8,493,530) (7,321,681) (6,814,957) (6,052,435) (199,334) 82,749 (8,643) 303,225 (150,560) (225,345) 223,398 21,935 31,565 (16,526) 84,155 (6,153) 1,315,961 2,054, ,483 1,634,133 6,124,244 1,498,448 (947,727) (945,085) (979,443) (1,460,637) (984,585) (1,405,307) (6,638,590) (5,301,995) (8,062,136) (5,555,833) (581,467) (4,183,792) 950,016 7,916,450 6,572,667 9,978,313 9,738,521 12,575,349 1,931,751 1,404,950 3,164,707 5,352,641 2,627,376 3,009,934 $ 2,881,767 $ 9,321,400 $ 9,737,374 $ 15,330,954 $ 12,365,897 $ 15,585,283 $ 206,948,235 $ 215,183,046 $ 248,304,834 $ 212,123,526 $ 219,737,010 $ 230,275,675 68,263,832 69,350,421 45,898,418 97,410,680 81,767,450 79,768,429 $ 275,212,067 $ 284,533,467 $ 294,203,252 (2) $ 309,534,206 $ 301,504,460 (3) $ 310,044,104 (4) Changes in Net position and Net Position by Component 61
86 Operating Revenue by Source Last Ten Fiscal Years Schedule 2 Fiscal Water Meter Water Sewer Total Operating Year Sales Charges Services Services Revenue 2007 $ 36,936,005 $ 8,249,983 $ 851,431 $ 8,792,497 $ 54,829, ,743,239 9,001,080 1,022,487 9,683,262 57,450, ,682,801 9,051,765 1,026,873 9,911,465 55,672, ,134,526 9,809,685 1,047,195 11,117,587 61,108, ,676,752 10,647,664 1,154,225 12,302,450 65,781, ,675,139 11,532,573 1,291,048 13,206,480 74,705, ,983,058 12,122,798 1,229,893 14,239,661 77,575, ,134,874 12,814,590 1,248,185 15,228,576 83,426, ,811,236 13,442,140 1,243,752 16,406,974 77,904, ,914,302 14,595,971 1,266,664 17,421,827 81,198,764 Revenue $85,000,000 $80,000,000 $75,000,000 $70,000,000 $65,000,000 $60,000,000 $55,000,000 $50,000,000 $45,000,000 $40,000,000 $35,000,000 $30,000,000 $25,000,000 $20,000,000 $15,000,000 $10,000,000 $5,000,000 $0 Fiscal Year SOURCE: Cucamonga Valley Water District Accounting Division 62 Operating Revenue by Source
87 Operating Expenses by Activity Last Ten Fiscal Years Schedule 3 Fiscal Source of Pumping Water Transmission and Collection and Customer General and Depreciation and Total Operating Year Supply Operations Treatment Distribution Transmission Accounts Administrative Amortization Expenses 2007 $ 13,499,965 $ 5,946,376 $ 2,667,204 $ 2,353,289 $ 7,080,358 $ 1,747,498 $ 8,491,462 $ 8,593,000 $ 50,379, ,410,729 4,944,428 2,747,185 2,573,217 8,281,559 2,139,143 9,723,052 9,157,688 54,977, ,999,196 6,426,333 2,900,825 2,928,555 8,344,368 2,301,799 10,776,455 9,708,720 57,386, ,387,130 5,659,006 2,674,214 2,828,207 9,174,247 2,080,551 10,915,992 10,342,101 60,061, ,188,936 5,625,091 2,733,477 3,125,140 9,679,819 2,071,599 11,213,478 10,554,945 58,192, ,506,123 4,908,418 3,161,739 3,134,960 10,547,211 2,134,887 10,030,142 10,063,315 61,486, ,006,105 5,491,422 3,134,158 3,104,700 11,116,847 2,044,545 9,840,029 10,202,801 62,940, ,286,846 5,707,682 3,431,498 3,436,889 11,622,712 2,115,655 10,479,755 9,811,042 67,892, ,671,304 6,932,863 3,269,903 3,399,409 13,326,807 2,172,880 10,473,636 10,337,312 67,584, ,286,663 6,485,127 4,380,765 3,284,484 14,240,864 2,266,296 11,134,118 11,361,306 64,439,623 $70,000,000 $65,000,000 $60,000,000 $55,000,000 $50,000,000 $45,000,000 # Expenses $40,000,000 $35,000,000 $30,000,000 $25,000,000 $20,000,000 $15,000,000 $10,000,000 $5,000,000 $0 Fiscal Year SOURCE: Cucamonga Valley Water District Accounting Division Operating Expenses by Activity 63
88 Water Production in Acre Feet Last Ten Fiscal Years Schedule 4 Source Fiscal Local Surface Spring Imported Total Year Groundwater Water Water Water Production ,095 4, ,825 62, ,335 4, ,454 58, ,359 4, ,465 56, ,864 4, ,782 52, ,415 4, ,994 48, ,723 4, ,144 51, ,015 1, ,846 52, ,230 1, ,825 54, ,055 1, ,306 47, , ,682 38,979 70,000 60,000 50,000 Acre Feet 40,000 30,000 20,000 10,000 0 Fiscal Year SOURCE: Cucamonga Valley Water District Production Division 64 Water Production in Acre Feet
89 Water Rate History Last Ten Fiscal Years Schedule 5 Notes: Fiscal Tiered Water Rates (2)(3) Non- Gov't Temp/ Year Tier 1 Tier 2 Tier 3 Tier 4 Residential Irrigation Constr N/A N/A N/A N/A N/A N/A N/A N/A N/A N/A N/A N/A N/A N/A N/A N/A N/A N/A N/A 5.34 Tier Allocation in HCF by Meter Size (3) 3/4 inch 1 inch 1 1/2 inch 2 inch 3 inch 4 inch 6 inch 8 inch 10 inch Tier Tier , , ,200 Tier , ,667 1,334-3,333 2,134-5,333 3,201-8,000 Tier 4 > 100 > 167 > 333 > 533 > 1,000 > 1,667 > 3,333 > 5,333 > 8,000 Fiscal Meter Charge Rates (bi-monthly) Year 3/4 inch 1 inch 1 1/2 inch 2 inch 3 inch 4 inch 6 inch 8 inch 10 inch , , , , , , , , , , , , , , , , , , , , , (1) HCF = 100 Cubic Feet = 748 gallons Water Rate per HCF (1) (2) In 2008, the District adopted a tiered rate structure for residential customers. Prior to 2008, residential customers were charged a uniform rate equal to non-residential customers. Usage is based on a bi-monthly billing period. Non-residential customers are charged a uniform rate based on the average rate paid by residential customers. (3) In 2010, the District adopoted a tiered rate structure for all customers except temporary/construction customers. The tier structure is based on meter sizes. From 2008 to 2010, only residential customers were billed on the tiered rate structure and the 3/4" tier allocation was used for all residential customers regardless of meter size. SOURCE: Cucamonga Valley Water District Accounting Division Water Rate History 65
90 Water Service Accounts Last Ten Fiscal Years Schedule 6 Customer Type Fiscal Government Landscape/ Fire Year Domestic Industrial Irrigation Parkway Lines Total , , , , ,087 1,090 48, , ,570 1,145 48, , ,629 1,299 49, , ,777 1,315 49, , ,790 1,325 49, , ,807 1,333 49, , ,828 1,340 49, , ,808 1,354 50, , ,821 1,359 50,166 60,000 50,000 Number of Customers 40,000 30,000 20,000 10,000 0 Fiscal Year Note: Number of customers as of June 30 of fiscal year. SOURCE: Cucamonga Valley Water District Accounting Division 66 Water Service Accounts
91 Principal Water Customers Current Fiscal Year and Nine Years Ago Schedule Annual Percentage Annual Percentage Customer Usage (HCF) of Total Rank Usage (HCF) of Total Rank City of Rancho Cucamonga 579, % 1 1,047, % 1 County of San Bernardino 217, % 2 267, % 4 City of Fontana 167, % 3 487, % 2 Etiwanda School District 130, % 4 188, % 6 Tamco Steel 125, % 5 146, % 10 Frito Lay 108, % 6 169, % 8 Alta Loma School District 89, % 7 N/A N/A N/A Chaffey College 84, % 8 181, % 7 Lewis Management Corporation 80, % 9 331, % 3 Nestle Waters North America 80, % 10 N/A N/A N/A Inland Rock Company N/A N/A N/A 192, % 5 Empire Lakes Golf Course N/A N/A N/A 162, % 9 Oak Creek Ranch Golf Club, Inc. N/A N/A N/A N/A N/A N/A Total 1,663, % 3,174, % Total Water Consumed (HCF) 16,098, % 25,179, % HCF = 100 cubic feet SOURCE: Cucamonga Valley Water District Accounting Division Principal Water Customers 67
92 Ratio of Outstanding Debt Last Ten Fiscal Years Schedule 8 Certificates Revenue Capital Total Fiscal of Participation Bonds Lease and Loan Debt $ Per As a Share of Year (In Thousands) (In Thousands) (In Thousands) (In Thousands) Capita Personal Income , , % ,155-5, , % ,325-5, ,708 1, % ,006-4, ,781 1, % ,171-7, ,834 1, % ,498-6, ,923 1, % ,860 41,615 5, ,010 1, % ,184 40,797 4, ,737 1, % ,875 53,506 3, ,357 1, N/A ,533 73,203 11, ,753 1, N/A $220,000 $200,000 $180,000 $160,000 # $140,000 Thousands of Dollars $120,000 $100,000 $80,000 $60,000 $40,000 $20,000 $0 Fiscal Year N/A - Data not available for time period NOTE: Amounts in thousands of dollars, except for per capita amounts and percentages. SOURCE: Cucamonga Valley Water District Accounting Division 68 Ratio of Outstanding Debt
93 Debt Coverage Last Ten Fiscal Years Schedule 9 Gross Operating Net Available Debt Service Coverage Fiscal Year Revenues (1) Expenses (2) Revenues Principal Interest Total Ratio ,701,693 33,243,062 28,458,631 1,750,000 7,501,456 9,251, ,734,579 35,790,012 20,944,567 1,810,000 7,666,073 9,476, ,436,612 37,308,718 12,127,894 2,200,000 8,144,911 10,344, ,356,424 38,754,710 19,601,714 2,319,286 8,602,555 10,921, ,402,290 36,121,871 20,280,419 3,834,286 8,637,034 12,471, ,386,200 39,431,891 25,954,309 3,964,286 8,182,797 12,147, ,141,954 40,232,688 26,909,266 4,159,286 8,256,101 12,415, ,855,711 44,836,095 30,019,616 4,954,286 9,211,847 14,166, ,788,304 42,148,489 28,639,815 5,104,286 9,106,864 14,211, ,397,000 36,809,953 32,587,047 4,904,286 8,494,019 13,398, Notes: (1) Gross revenues includes all operating revenue, interest income, other nonoperating revenue (excluding taxes and assessments) and connection fees from the Water and Recycled Water Utility Funds. (2) Operating expenses less depreciation and amortization for the Water and Recycled Water Utility Funds. SOURCE: Cucamonga Valley Water District Accounting Division Debt Coverage 69
94 Demographic and Economic Statistics Last Ten Fiscal Years Schedule 10 Riverside-San Bernardino-Ontario MSA Personal Population - Income Personal Unemployment Rancho (thousands of Income Year Rate Cucamonga dollars) per Capita % 164, ,046 30, % 164, ,620 30, % 164, ,805 29, % 165, ,840 29, % 167, ,982 29, % 169, ,767 31, % 171, ,677 33, % 172, ,727 33, % 174,064 N/A N/A % 175,251 N/A N/A 175,000 Population 150, , ,000 Fiscal Year Dollars $35,000 $30,000 $25,000 $20,000 $15,000 Fiscal Year N/A - Data not available for time period SOURCES: California State Department of Finance, United States Bureau of Economic Analysis and the United States Department of Labor 70 Demographic and Economic Statistics
95 Principal Employers Last Ten Fiscal Years Schedule 11 Number of Percentage Employer Employees of Total Chaffey Community College 1, % Etiwanda School District 1, % Inland Empire Health Plan (IEHP) 1, % Amphastar Pharmaceutical % City of Rancho Cucamonga % Southern California Edison % Alta Loma School District % Big Lots Distribution Center % Mercury Insurance Company % Central School District % Total 8, % Total Employment 84, % NOTE: Data is from June 2015 (latest available data). SOURCE: City of Rancho Cucamonga Personnel Trends 71
96 Personnel Trends Last Ten Fiscal Years Schedule 12 Full Time Equivalent Employees by Department Department Fiscal Finance & General Year Executive Administration Services Engineering Operations Total Employees Fiscal Year SOURCE: Cucamonga Valley Water District Human Resources Division 72 Personnel Trends
97 Other Operating and Capacity Indicators Last Ten Fiscal Years Schedule 13 Water System Fiscal Miles of Number of Annual Average Year Water Mains Fire Hydrants Production (MG) Production (MGD) ,968 20, ,217 19, ,227 18, ,236 17, ,245 15, ,245 16, ,315 17, ,371 18, ,323 16, ,354 13, Sewer System Fiscal Miles of Service Annual Daily Year Sewers Connections Sewerage (MG) Sewerage (MGD) ,201 5, ,658 6, ,835 5, ,025 5, ,177 5, ,448 5, ,688 6, ,884 6, ,012 7, ,061 6, AF - Acre Feet MG - Millions of Gallons MGD - Millions of Gallons per Day SOURCE: Cucamonga Valley Water District GIS, Industrial Waste and Production Divisions Other Operating and Capacity Indicators 73

")
 476-8032")
98 10440 Ashford Street Rancho Cucamonga, CA (909) Phone (909) Fax
Marina Coast Water District Marina, California
 Marina Coast Water District Marina, California Comprehensive Annual Financial Report For The Fiscal Years Ended June 30, 2014 and 2013 11 Reservation Road, Marina California 93933 Marina Coast Water District
FRONTIER PROJECT FOUN DATION BOARD OF DIRECTORS ANN UAL M EETING AG EN DA
 FRONTIER PROJECT FOUN DATION BOARD OF DIRECTORS ANN UAL M EETING AG EN DA F p thefronti erproject June 12, 2018-
COMPREHENSIVE ANNUAL FINANCIAL REPORT
 C COMPREHENSIVE ANNUAL FINANCIAL REPORT FOR THE FISCAL YEAR ENDED JUNE 30, 2018 Mesa Water District Costa Mesa, California MesaWater.org Dedicated to Satisfying our Community s Water Needs Mesa Water
Marina Coast Water District Marina, California
 Marina Coast Water District Marina, California Comprehensive Annual Financial Report For The Fiscal Year Ended June 30, 2015 11 Reservation Road, Marina California 93933 Marina Coast Water District Marina,
East Orange County Water District
 Orange, California Annual Financial Report For the Years Ended June 30, 2016 and 2015 Our Mission Statement To provide the most cost effective, reliable, and highest quality water services for the present
Celebrating 25 Years of Excellence
 Celebrating 25 Years of Excellence Comprehensive Annual Financial Report Fiscal Year Ended June 30, 2017 Chino Hills, California , CALIFORNIA COMPREHENSIVE ANNUAL FINANCIAL REPORT FISCAL YEAR ENDED JUNE
KNOX-CHAPMAN UTILITY DISTRICT OF KNOX COUNTY. Knoxville, Tennessee COMPREHENSIVE ANNUAL FINANCIAL REPORT
 KNOX-CHAPMAN UTILITY DISTRICT OF KNOX COUNTY Knoxville, Tennessee COMPREHENSIVE ANNUAL FINANCIAL REPORT For the Years Ended February 28, 2014 and 2013 PREPARED BY: Carol Taylor, Finance Director KNOX-CHAPMAN
Our Mission Statement
 Our Mission Statement The is a public agency whose goal is the protection of the Chino Groundwater Basin in order to guarantee that current and future water needs will be met. The Basin is protected by
RUNNING SPRINGS WATER DISTRICT ANNUAL FINANCIAL REPORT. Years Ended June 30, 2018 and 2017
 RUNNING SPRINGS WATER DISTRICT ANNUAL FINANCIAL REPORT Years Ended June 30, 2018 and 2017 Running Springs Water District Annual Financial Report Years Ended June 30, 2018 and 2017 I. INTRODUCTORY SECTION
ANNUAL FINANCIAL REPORT FISCAL YEAR ENDED JUNE 30, 2018
 COMPREHENSIVE ANNUAL FINANCIAL REPORT FISCAL YEAR ENDED JUNE 30, 2018 11201 Harrel Street Jurupa Valley, CA 91752 www.jcsd.us Comprehensive Annual Financial Report Fiscal Year Ending 11201 Harrel St. Jurupa
BROWARD COUNTY, FLORIDA WATER AND WASTEWATER FUND A Major Fund of Broward County, Florida
 BROWARD COUNTY, FLORIDA WATER AND WASTEWATER FUND A Major Fund of Broward County, Florida Financial Statements For the Years Ended BROWARD COUNTY, FLORIDA WATER AND WASTEWATER FUND FINANCIAL STATEMENTS
Santa Fe Irrigation District. A Special District of the State of California
 Santa Fe Irrigation District A Special District of the State of California Comprehensive Annual Financial Report Fiscal Year Ended June 30, 2012 Prepared by the Administrative Department Michael J. Bardin,
CITY OF ANAHEIM WATER UTILITY FUND. Financial Statements. June 30, 2014 and (With Independent Auditors Report Thereon)
") Financial Statements (With Independent Auditors Report Thereon) Table of Contents Page Independent Auditors Report 1 Management s Discussion and Analysis (Unaudited) 3 Financial Statements: Statements
Financial Statements (With Independent Auditors Report Thereon) Table of Contents Page Independent Auditors Report 1 Management s Discussion and Analysis (Unaudited) 3 Financial Statements: Statements
Report of Independent Auditors and Financial Statements for. Imperial Irrigation District
 Report of Independent Auditors and Financial Statements for Imperial Irrigation District December 31, 2014 and 2013 CONTENTS REPORT OF INDEPENDENT AUDITORS 1 2 PAGE MANAGEMENT S DISCUSSION AND ANALYSIS
Board of Directors as of June 30, 2018
 McKinleyville, California Annual Financial Report For the Fiscal Year Ended Board of Directors as of Elected/ Current Name Title Appointed Term David Couch President Elected 09/2008-12/2018 George Wheeler
CITY OF ANAHEIM WATER UTILITY FUND. Financial Statements. June 30, 2016 and (With Independent Auditors Report Thereon)
") Financial Statements (With Independent Auditors Report Thereon) Table of Contents Page Independent Auditors Report 1 Management s Discussion and Analysis (Unaudited) 3 Financial Statements: Statement of
Financial Statements (With Independent Auditors Report Thereon) Table of Contents Page Independent Auditors Report 1 Management s Discussion and Analysis (Unaudited) 3 Financial Statements: Statement of
DISTRICT ADMINISTRATIVE OFFICE 6230 SYLVAN ROAD, CITRUS HEIGHTS, CA
 BOARD MEETING AGENDA ANNUAL MEETING OF THE BOARD OF DIRECTORS OF CITRUS HEIGHTS WATER DISTRICT FINANCING CORPORATION JULY 18, 2018 beginning at 6:30 PM DISTRICT ADMINISTRATIVE OFFICE 6230 SYLVAN ROAD,
West Valley Water Disstrict Comprehensive Annual Financial Report For the Years Ended June 30, 2016 and 2015
 West Valley Water District Comprehensive Annual Financial Report For the Years Endedd June 30, 2016 and 2015 Comprehensive Annual Financial Report For the Years Endedd June 30, 2016 and 2015 WEST VALLEY
City of Murphy, Texas
 Comprehensive Annual Financial Report Fiscal Year Ended September 30, 2018 Prepared by: Finance Department This Page Left Intentionally Blank Comprehensive Annual Financial Report For the Fiscal Year Ended
UTILITIES COMMISSION, CITY OF NEW SMYRNA BEACH, FLORIDA
 UTILITIES COMMISSION, CITY OF NEW SMYRNA BEACH, FLORIDA (A COMPONENT UNIT OF THE CITY OF NEW SMYRNA BEACH, FLORIDA) COMPREHENSIVE ANNUAL FINANCIAL REPORT FOR THE FISCAL YEARS ENDED SEPTEMBER 30, 2017 AND
Marina Coast Water District Marina, California
 Marina Coast Water District Marina, California Comprehensive Annual Financial Report For The Fiscal Year Ended June 30, 2011 11 Reservation Road, Marina California 93933 Marina Coast Water District Marina,
WEST COUNTY WASTEWATER DISTRICT Richmond, CA
 WEST COUNTY WASTEWATER DISTRICT Richmond, CA COMPREHENSIVE ANNUAL FINANCIAL REPORT For the Fiscal Years Ended June 30, 2017 and June 30, 2016 Prepared by: Business Services Department WEST COUNTY WASTEWATER
BROWARD COUNTY, FLORIDA WATER AND WASTEWATER FUND A Major Fund of Broward County, Florida
 BROWARD COUNTY, FLORIDA WATER AND WASTEWATER FUND A Major Fund of Broward County, Florida Financial Statements For the Years Ended September 30, 2013 and 2012 BROWARD COUNTY, FLORIDA WATER AND WASTEWATER
SONOMA VALLEY COUNTY SANITATION DISTRICT (A Component Unit of the County of Sonoma) Independent Auditor s Reports, Management s Discussion and
 Independent Auditor s Reports, Management s Discussion and") . SONOMA VALLEY COUNTY SANITATION DISTRICT (A Component Unit of the County of Sonoma) Independent Auditor s Reports, Management s Discussion and Analysis and Basic Financial Statements For the Fiscal Year
. SONOMA VALLEY COUNTY SANITATION DISTRICT (A Component Unit of the County of Sonoma) Independent Auditor s Reports, Management s Discussion and Analysis and Basic Financial Statements For the Fiscal Year
BUCKEYE ELEMENTARY SCHOOL DISTRICT NO. 33
 BUCKEYE ELEMENTARY SCHOOL DISTRICT NO. 33 Comprehensive Annual Financial Report Fiscal Year Ended June 30, 2016 25555 West Durango Street Buckeye, Arizona 85326 BUCKEYE, ARIZONA COMPREHENSIVE ANNUAL FINANCIAL
Comprehensive Annual Financial Report For the Years Ended June 30, 2017 and 2016
 Comprehensive Annual Financial Report For the Years Ended June 30, 2017 and 2016 Comprehensive Annual Financial Report For the Years Ended June 30, 2017 and 2016 West Valley Water District 855 W. Baseline
QUAIL VALLEY WATER DISTRICT
 BASIC FINANCIAL STATEMENTS AND SUPPLEMENTARY INFORMATION Year Ended June 30, 2016 (With Independent Auditor s Report Thereon) Bill R. Walker Certified Public Accountant TABLE OF CONTENTS Page(s) Independent
City of Bentonville, Arkansas
 Comprehensive Annual Financial Report For the Year Ended December 31, 2016 Prepared by: Denise Land Finance Director Jake Harper Assistant Finance Director Visit our web site at: www.bentonvillear.com
Marin Municipal Water District
 Marin Municipal Water District Corte Madera, California Basic Financial Statements And Independent Auditors Report For the years ended June 30, 2012 and 2011 Basic Financial Statements Table of Contents
MADISON METROPOLITAN SEWERAGE DISTRICT Madison, Wisconsin. FINANCIAL STATEMENTS December 31, 2016 and 2015
 MADISON METROPOLITAN SEWERAGE DISTRICT Madison, Wisconsin FINANCIAL STATEMENTS TABLE OF CONTENTS PAGE INDEPENDENT AUDITORS REPORT... 1 MANAGEMENT S DISCUSSION AND ANALYSIS... 3 BASIC FINANCIAL STATEMENTS
City of Rittman, Ohio
 City of Rittman, Ohio Comprehensive Annual Financial Report For the Year Ended December 31, 2013 Members of Council and Management City of Rittman 30 North Main Street Rittman, Ohio 44270 We have reviewed
SUNNYSIDE UNIFIED SCHOOL DISTRICT NO. 12 COMPREHENSIVE ANNUAL FINANCIAL REPORT FOR THE FISCAL YEAR ENDED JUNE 30, 2015
 COMPREHENSIVE ANNUAL FINANCIAL REPORT FOR THE FISCAL YEAR ENDED JUNE 30, 2015 2238 East Ginter Road Tucson, Arizona 85706 TUCSON, ARIZONA COMPREHENSIVE ANNUAL FINANCIAL REPORT FOR THE FISCAL YEAR ENDED
DISCOVERY Clean Water Alliance. Vancouver, Washington
 DISCOVERY Clean Water Alliance Vancouver, Washington Comprehensive Annual Financial Report For The Fiscal Year Ended December 31, 2016 DISCOVERY CLEAN WATER ALLIANCE Vancouver, Washington COMPREHENSIVE
Comprehensive Annual Financial Report Year Ended June 30, 2018
 Comprehensive Annual Financial Report Year Ended June 30, 2018 Indio, California Comprehensive Annual Financial Report For the Year Ended June 30, 2018 Prepared by: Administration and Finance Department
MADISON METROPOLITAN SEWERAGE DISTRICT Madison, Wisconsin. FINANCIAL STATEMENTS December 31, 2015 and 2014
 MADISON METROPOLITAN SEWERAGE DISTRICT Madison, Wisconsin FINANCIAL STATEMENTS TABLE OF CONTENTS PAGE INDEPENDENT AUDITOR S REPORT... 1 MANAGEMENT S DISCUSSION AND ANALYSIS... 3 BASIC FINANCIAL STATEMENTS
CITY OF HEALDSBURG HEALDSBURG, CALIFORNIA COMPREHENSIVE ANNUAL FINANCIAL REPORT WITH REPORT ON AUDIT BY INDEPENDENT CERTIFIED PUBLIC ACCOUNTANTS
 HEALDSBURG, CALIFORNIA COMPREHENSIVE ANNUAL FINANCIAL REPORT WITH REPORT ON AUDIT BY INDEPENDENT CERTIFIED PUBLIC ACCOUNTANTS FISCAL YEAR ENDED JUNE 30, 2008 Prepared by the Finance Department COMPREHENSIVE
CAFR COMPREHENSIVE ANNUAL FINANCIAL REPORT
 C I T Y OF LY N WO OD FISCAL YEAR 2014-2015 CAFR COMPREHENSIVE ANNUAL FINANCIAL REPORT Y E A R E N DING J U N E 3 0, 2 0 1 5 Comprehensive Annual Financial Report City of Lynwood, California with Report
CITY OF LAKE ELMO, MINNESOTA COMPREHENSIVE ANNUAL FINANCIAL REPORT FOR THE FISCAL YEAR ENDED DECEMBER 31, 2017
 COMPREHENSIVE ANNUAL FINANCIAL REPORT FOR THE FISCAL YEAR ENDED DECEMBER 31, 2017 PREPARED BY: FINANCE DEPARTMENT CITY OF LAKE ELMO, MINNESOTA FINANCIAL STATEMENTS For the Fiscal Year Ended December 31,
HEBER-OVERGAARD UNIFIED SCHOOL DISTRICT NO. 6
 HEBER-OVERGAARD UNIFIED SCHOOL DISTRICT NO. 6 Comprehensive Annual Financial Report Fiscal Year Ended June 30, 2012 3375 Buckskin Canyon Road P.O. Box 547 Heber, Arizona 85928 HEBER, ARIZONA COMPREHENSIVE
GLENN-COLUSA IRRIGATION DISTRICT AUDITED FINANCIAL STATEMENTS. September 30, 2017 and 2016
 AUDITED FINANCIAL STATEMENTS September 30, 2017 and 2016 AUDITED FINANCIAL STATEMENTS September 30, 2017 and 2016 TABLE OF CONTENTS Independent Auditor s Report... 1 Management s Discussion and Analysis...
AGENDA. A) Approve Minutes from September 18, 2012 Regular Meeting (Draft Att.) B) Approve Minutes from June 19, 2012 Annual Meeting (Draft Attached)
 Approve Minutes from September 18, 2012 Regular Meeting (Draft Att.) B) Approve Minutes from June 19, 2012 Annual Meeting (Draft Attached)") F p t ('frontierp Ojeet AGENDA FRONTIER PROJECT FOUNDATION BOARD OF DIRECTORS REGULAR 8: ANNUAL MEETING JUNE11,2013 ~ 5:30PM CVWD Board Room 10440 Ashford Street, Rancho Cucamonga, CA 1. CALL TO ORDER
F p t ('frontierp Ojeet AGENDA FRONTIER PROJECT FOUNDATION BOARD OF DIRECTORS REGULAR 8: ANNUAL MEETING JUNE11,2013 ~ 5:30PM CVWD Board Room 10440 Ashford Street, Rancho Cucamonga, CA 1. CALL TO ORDER
RAMONA MUNICIPAL WATER DISTRICT
 A. Opening of Meeting RAMONA MUNICIPAL WATER DISTRICT Regular Meeting of the Board of Directors Ramona Community Center 434 Aqua Lane, Ramona, CA 92065 Tuesday, January 8, 2019 2:00 P.M. AGENDA A.1. A.2.
CHEROKEE COUNTY WATER AND SEWERAGE AUTHORITY CHEROKEE COUNTY, GEORGIA FINANCIAL STATEMENTS FOR THE FISCAL YEAR ENDED AUGUST 31, 2017
 CHEROKEE COUNTY WATER AND SEWERAGE AUTHORITY CHEROKEE COUNTY, GEORGIA FINANCIAL STATEMENTS FOR THE FISCAL YEAR ENDED AUGUST 31, 2017 TOGETHER WITH INDEPENDENT AUDITORS REPORTS FINANCIAL STATEMENTS AUGUST
Diablo Water District
 Diablo Water District Oakley, California Annual Financiall Report For the Years Endedd June 30, 2016 and 2015 For the Year Ended June 30, 2016 BOARD OF DIRECTORS Howard Hobbs Kenneth L. Crockett Enrico
Los Angeles Community College District
 Los Angeles Community College District Basic Financial Statements and Supplemental Information June 30, 2016 and 2015 (With Independent Auditors Report Thereon) June 30, 2016 and 2015 Los Angeles County,
Desert Recreation District. Annual Financial Report. For the Fiscal Year Ended June 30, 2018
 Annual Financial Report For the Fiscal Year Ended June 30, 2018 Board of Directors as of June 30, 2018 Name Title Term Laura McGalliard President 12/2015-12/2019 Rudy Gutierrez Vice President 12/2015-12/2019
2017 FINANCIAL REPORT
 2017 FINANCIAL REPORT COMPREHENSIVE ANNUAL Sacramento Regional County Sanitation District Sacramento, California REGIONAL SAN SERVICE AREA SACRAMENTO REGIONAL COUNTY SANITATION DISTRICT Sacramento, California
METROPOLITAN SEWER DISTRICT OF GREATER CINCINNATI HAMILTON COUNTY TABLE OF CONTENTS. Independent Auditor s Report... 1
 METROPOLITAN SEWER DISTRICT OF GREATER CINCINNATI TABLE OF CONTENTS TITLE PAGE Independent Auditor s Report... 1 Prepared by Management: Management s Discussion and Analysis... 5 Basic Financial Statements:
CITY OF CLARKSVILLE, TENNESSEE
 GAS, WATER AND Wastewater DEPARTMENTS AUDITED FINANCIAL STATEMENTS AND OTHER INFORMATION JUNE 30, 2018 AND 2017 JUNE 30, 2018 AND 2017 TABLE OF CONTENTS Financial Section Independent Auditor s Report 1
ARIZONA POWER AUTHORITY (A BODY, CORPORATE AND POLITIC, OF THE STATE OF ARIZONA) PHOENIX, ARIZONA FINANCIAL STATEMENTS SEPTEMBER 30, 2014 AND 2013
 PHOENIX, ARIZONA FINANCIAL STATEMENTS SEPTEMBER 30, 2014 AND 2013") (A BODY, CORPORATE AND POLITIC, OF THE STATE OF ARIZONA) PHOENIX, ARIZONA FINANCIAL STATEMENTS TABLE OF CONTENTS INDEPENDENT AUDITORS' REPORT 1 MANAGEMENT S DISCUSSION AND ANALYSIS 3 FINANCIAL STATEMENTS
(A BODY, CORPORATE AND POLITIC, OF THE STATE OF ARIZONA) PHOENIX, ARIZONA FINANCIAL STATEMENTS TABLE OF CONTENTS INDEPENDENT AUDITORS' REPORT 1 MANAGEMENT S DISCUSSION AND ANALYSIS 3 FINANCIAL STATEMENTS
Basic Financial Statements and Report of Independent Certified Public Accountants City of Dallas, Texas Dallas Water Utilities (An Enterprise Fund of
 Basic Financial Statements and Report of Independent Certified Public Accountants City of Dallas, Texas September 30, 2016 FINANCIAL STATEMENTS For Fiscal Year Ended September 30, 2016 TABLE OF CONTENTS
Fountain Valley Authority (A Component Unit of the City of Colorado Springs, Colorado)
") (A Component Unit of the City of Colorado Springs, Colorado) Financial Statements and Report of Independent Certified Public Accountants (A Component Unit of the City of Colorado Springs, Colorado) Financial
(A Component Unit of the City of Colorado Springs, Colorado) Financial Statements and Report of Independent Certified Public Accountants (A Component Unit of the City of Colorado Springs, Colorado) Financial
CHINLE UNIFIED SCHOOL DISTRICT NO. 24
 CHINLE UNIFIED SCHOOL DISTRICT NO. 24 Comprehensive Annual Financial Report Fiscal Year Ended June 30, 2012 PO Box 587 Chinle, Arizona 86503 CHINLE, ARIZONA COMPREHENSIVE ANNUAL FINANCIAL REPORT FOR THE
CITY OF FLORENCE, ALABAMA ELECTRICITY, GAS, AND WATER AND WASTEWATER DEPARTMENTS. FINANCIAL STATEMENTS JUNE 30, 2017 and 2016
 ELECTRICITY, GAS, AND WATER AND WASTEWATER DEPARTMENTS FINANCIAL STATEMENTS JUNE 30, 2017 and 2016 ELECTRICITY, GAS, AND WATER AND WASTEWATER DEPARTMENTS T ABLE OF C ONTENTS PAGE Independent Auditor s
COMPREHENSIVE ANNUAL FINANCIAL REPORT FOR THE FISCAL YEAR ENDED JUNE 30, 2015
 CALIFORNIA INFRASTRUCTURE AND ECONOMIC DEVELOPMENT BANK FUND AND CALIFORNIA INFRASTRUCTURE GUARANTEE TRUST FUND, ENTERPRISE FUNDS OF THE CALIFORNIA INFRASTRUCTURE AND ECONOMIC DEVELOPMENT BANK (A Component
CITY OF MONTE VISTA, COLORADO
 FINANCIAL STATEMENTS TABLE OF CONTENTS Independent Auditor s Report Management s Discussion and Analysis a - c i - xi Basic Financial Statements Statement of Net Position 1 Statement of Activities 2 Balance
CITY OF ATWATER, CALIFORNIA ANNUAL FINANCIAL REPORT FOR THE FISCAL YEAR ENDED JUNE 30, 2016
 CITY OF ATWATER, CALIFORNIA ANNUAL FINANCIAL REPORT FOR THE FISCAL YEAR ENDED JUNE 30, 2016 Prepared by: Finance Department This page intentionally left blank. Basic Financial Statements Table of Contents
PLUM CREEK LIBRARY SYSTEM AUDITED FINANCIAL STATEMENTS AND SUPPLEMENTARY INFORMATION JUNE 30, 2016
 AUDITED FINANCIAL STATEMENTS AND SUPPLEMENTARY INFORMATION JUNE 30, 2016 Conway, Deuth & Schmiesing, PLLP Certified Public Accountants Willmar, Minnesota This page intentionally left blank TABLE OF CONTENTS
BUCKEYE ELEMENTARY SCHOOL DISTRICT NO. 33
 BUCKEYE ELEMENTARY SCHOOL DISTRICT NO. 33 Comprehensive Annual Financial Report Fiscal Year Ended June 30, 2015 25555 West Durango Street Buckeye, Arizona 85326 BUCKEYE, ARIZONA COMPREHENSIVE ANNUAL FINANCIAL
WEST BAY SANITARY DISTRICT FINANCIAL STATEMENTS AND INDEPENDENT AUDITOR S REPORT JUNE 30, 2015 * * *
 WEST BAY SANITARY DISTRICT FINANCIAL STATEMENTS AND INDEPENDENT AUDITOR S REPORT JUNE 30, 2015 * * * CHAVAN & ASSOCIATES LLP CERTIFIED PUBLIC ACCOUNTANTS 1475 SARATOGA AVE, SUITE 180 SAN JOSE, CA 95129
CITY OF LOS ANGELES DEPARTMENT OF WATER AND POWER WATER SYSTEM. Financial Statements and Required Supplementary Information. June 30, 2016 and 2015
 Financial Statements and Required Supplementary Information (With Independent Auditors Report Thereon) Table of Contents Page(s) Independent Auditors Report 1 2 Management s Discussion and Analysis (unaudited)
SUNNYSIDE UNIFIED SCHOOL DISTRICT NO. 12 COMPREHENSIVE ANNUAL FINANCIAL REPORT FOR THE FISCAL YEAR ENDED JUNE 30, 2012
 COMPREHENSIVE ANNUAL FINANCIAL REPORT FOR THE FISCAL YEAR ENDED JUNE 30, 2012 2238 East Ginter Road Tucson, Arizona 85706 TUCSON, ARIZONA COMPREHENSIVE ANNUAL FINANCIAL REPORT FOR THE FISCAL YEAR ENDED
SUFFOLK COUNTY WATER AUTHORITY. Financial Statements and Required Supplementary Information. May 31, 2017 and 2016
 Financial Statements and Required Supplementary Information (With Independent Auditors Reports Thereon) Table of Contents Independent Auditors Report 1 Management s Discussion and Analysis (Unaudited)
City of La Palma Agenda Item No. 6
 City of La Palma Agenda Item No. 6 MEETING DATE: December 20, 2016 TO: FROM: SUBMITTED BY: CITY COUNCIL CITY MANAGER Sea Shelton, Administrative Services Director AGENDA TITLE: Comprehensive Annual Financial
SUNNYSIDE UNIFIED SCHOOL DISTRICT NO. 12 COMPREHENSIVE ANNUAL FINANCIAL REPORT FOR THE FISCAL YEAR ENDED JUNE 30, 2014
 COMPREHENSIVE ANNUAL FINANCIAL REPORT FOR THE FISCAL YEAR ENDED JUNE 30, 2014 2238 East Ginter Road Tucson, Arizona 85706 TUCSON, ARIZONA COMPREHENSIVE ANNUAL FINANCIAL REPORT FOR THE FISCAL YEAR ENDED
PLUM CREEK LIBRARY SYSTEM AUDITED FINANCIAL STATEMENTS AND SUPPLEMENTARY INFORMATION JUNE 30, 2015
 AUDITED FINANCIAL STATEMENTS AND SUPPLEMENTARY INFORMATION JUNE 30, 2015 Conway, Deuth & Schmiesing, PLLP Certified Public Accountants Willmar, Minnesota This page intentionally left blank TABLE OF CONTENTS
Joshua Basin Water District. Annual Financial Report
 Annual Financial Report Board of Directors as of June 30, 2018 Elected/ Current Name Title Appointed Term Mickey Luckman President Elected 12/16-12/20 Robert Johnson Vice President Elected 12/16-12/20
CITY OF FLORENCE, ALABAMA ELECTRICITY, GAS, AND WATER AND WASTEWATER DEPARTMENTS. FINANCIAL STATEMENTS JUNE 30, 2010 and 2009
 ELECTRICITY, GAS, AND WATER AND WASTEWATER DEPARTMENTS FINANCIAL STATEMENTS JUNE 30, 2010 and 2009 ELECTRICITY, GAS, AND WATER AND WASTEWATER DEPARTMENTS TABLE OF CONTENTS Independent Auditor s Report
SAN BERNARDINO VALLEY MUNICIPAL WATER DISTRICT
 SAN BERNARDINO VALLEY MUNICIPAL WATER DISTRICT San Bernardino, California Basic Financial Statements and Supplementary Information Basic Financial Statements and Supplementary Information Table of Contents
Eagle River Water and Sanitation District Vail, Colorado. Financial Statements December 31, 2014
 Vail, Colorado Financial Statements Financial Statements Table of Contents Page INDEPENDENT AUDITOR S REPORT Management s Discussion and Analysis A1 A2 B1 B8 Basic Financial Statements: Statement of Net
ARIZONA POWER AUTHORITY (A BODY, CORPORATE AND POLITIC, OF THE STATE OF ARIZONA) PHOENIX, ARIZONA FINANCIAL STATEMENTS SEPTEMBER 30, 2015
 PHOENIX, ARIZONA FINANCIAL STATEMENTS SEPTEMBER 30, 2015") (A BODY, CORPORATE AND POLITIC, OF THE STATE OF ARIZONA) PHOENIX, ARIZONA FINANCIAL STATEMENTS TABLE OF CONTENTS INDEPENDENT AUDITORS' REPORT 1 MANAGEMENT S DISCUSSION AND ANALYSIS 3 FINANCIAL STATEMENTS
(A BODY, CORPORATE AND POLITIC, OF THE STATE OF ARIZONA) PHOENIX, ARIZONA FINANCIAL STATEMENTS TABLE OF CONTENTS INDEPENDENT AUDITORS' REPORT 1 MANAGEMENT S DISCUSSION AND ANALYSIS 3 FINANCIAL STATEMENTS
HOUSING AUTHORITY OF THE CITY AND COUNTY OF SAN FRANCISCO, CALIFORNIA. Annual Financial and Compliance Report. For the Year Ended September 30, 2016
 CITY AND COUNTY OF SAN FRANCISCO, CALIFORNIA Annual Financial and Compliance Report FINANCIAL SECTION Table of Contents Page Independent Auditor s Report... 1 Management s Discussion and Analysis (Required
COMPREHENSIVE ANNUAL FINANCIAL REPORT CITY OF ORMOND BEACH, FLORIDA FISCAL YEAR ENDED SEPTEMBER 30, 2018
 City of Ormond Beach Florida Photo by Sam West Comprehensive Annual Financial Report Fiscal Year Ended September 30, 2018 COMPREHENSIVE ANNUAL FINANCIAL REPORT FISCAL YEAR ENDED Prepared by: Finance Department
Ramona Municipal Water District Financial Statements June 30, 2016
 Ramona Municipal Water District Financial Statements INDEX TO FINANCIAL STATEMENTS Independent Auditor s Report... 2 Management s Discussion and Analysis... 5 Statement of Net Position... 12 Statement
City of Chicago Department of Water Management Water Fund Comprehensive Annual Financial Report For the Years Ended December 31, 2016 and 2015
 City of Chicago Department of Water Management Water Fund Comprehensive Annual Financial Report For the Years Ended December 31, 2016 and 2015 Rahm Emanuel, Mayor Carole L. Brown, Chief Financial Officer
COVINA-VALLEY UNIFIED SCHOOL DISTRICT ANNUAL FINANCIAL REPORT JUNE 30, 2016
 ANNUAL FINANCIAL REPORT TABLE OF CONTENTS FINANCIAL SECTION Independent Auditor's Report 2 Management's Discussion and Analysis 5 Basic Financial Statements Government-Wide Financial Statements Statement
CHEROKEE COUNTY WATER AND SEWERAGE AUTHORITY CHEROKEE COUNTY, GEORGIA FINANCIAL STATEMENTS FOR THE FISCAL YEAR ENDED AUGUST 31, 2016
 CHEROKEE COUNTY WATER AND SEWERAGE AUTHORITY CHEROKEE COUNTY, GEORGIA FINANCIAL STATEMENTS FOR THE FISCAL YEAR ENDED AUGUST 31, 2016 TOGETHER WITH INDEPENDENT AUDITORS REPORTS FINANCIAL STATEMENTS AUGUST
City of Chicago Department of Water Management Sewer Fund Comprehensive Annual Financial Report For the Year Ended December 31, 2012
 City of Chicago Department of Water Management Sewer Fund Comprehensive Annual Financial Report For the Year Ended December 31, 2012 Rahm Emanuel, Mayor Lois Scott, Chief Financial Officer Amer Ahmad,
CITY OF CLARKSVILLE, TENNESSEE GAS DEPARTMENT AND WATER & SEWER DEPARTMENT AUDITED FINANCIAL STATEMENTS AND OTHER INFORMATION JUNE 30, 2013 AND 2012
 CITY OF CLARKSVILLE, TENNESSEE GAS DEPARTMENT AND WATER & SEWER DEPARTMENT AUDITED FINANCIAL STATEMENTS AND OTHER INFORMATION JUNE 30, 2013 AND 2012 CITY OF CLARKSVILLE, TENNESSEE GAS DEPARTMENT AND WATER
GOLETA WATER DISTRICT COMPREHENSIVE ANNUAL FINANCIAL REPORT FOR THE FISCAL YEAR ENDED JUNE 30, 2018
 GOLETA WATER DISTRICT COMPREHENSIVE ANNUAL FINANCIAL REPORT FOR THE FISCAL YEAR ENDED JUNE 30, 2018 PAGE INTENTIONALLY LEFT BLANK GOLETA WATER DISTRICT BOARD OF DIRECTORS AS OF JUNE 30, 2018 Name Title
CONTINUING DISCLOSURE ANNUAL REPORT
 CONTINUING DISCLOSURE ANNUAL REPORT FISCAL YEAR ENDED JUNE 30, 2018 REFUNDING REVENUE BONDS, SERIES 2012A FINANCING AUTHORITY REVENUE BONDS, SERIES 2017A 1717 E. Miraloma Avenue Placentia, California 92870
TEMPLETON COMMUNITY SERVICES DISTRICT FINANCIAL STATEMENTS JUNE 30, 2018
 TEMPLETON COMMUNITY SERVICES DISTRICT FINANCIAL STATEMENTS L & C Leaf & Cole, LLP Certified Public Accountants FINANCIAL STATEMENTS TABLE OF CONTENTS Independent Auditor s Report 1-2 Management s Discussion
San Rafael Sanitation District A Component Unit of the City of San Rafael. Basic Financial Statements Fiscal Years Ended June 30, 2013 and 2012
 San Rafael Sanitation District A Component Unit of the City of San Rafael Basic Financial Statements Fiscal Years Ended June 30, 2013 and 2012 TABLE OF CONTENTS Independent Auditors Report 1 Management
Mission. Cover photo: Bill Dewey
 Mission To provide an adequate supply of quality water at the most reasonable cost to the present and future customers within the Goleta Water District Cover photo: Bill Dewey Comprehensive Annual Financial
I. INTRODUCTORY SECTION
 Spartanburg Water System Spartanburg, South Carolina Comprehensive Annual Financial Report For the Years Ended June 30, 2018 and 2017 I. INTRODUCTORY SECTION SPARTANBURG WATER SYSTEM SPARTANBURG, SOUTH
CITY OF LAKE ELMO, MINNESOTA COMPREHENSIVE ANNUAL FINANCIAL REPORT FOR THE FISCAL YEAR ENDED DECEMBER 31, 2016
 COMPREHENSIVE ANNUAL FINANCIAL REPORT FOR THE FISCAL YEAR ENDED DECEMBER 31, 2016 PREPARED BY: FINANCE DEPARTMENT CITY OF LAKE ELMO, MINNESOTA FINANCIAL STATEMENTS For the Fiscal Year Ended December 31,
Costa Mesa Sanitary District Costa Mesa, California Comprehensive Annual Financial Report For Fiscal Year Ended June 30, 2015
 Costa Mesa, California Comprehensive Annual Financial Report For Fiscal Year Ended June 30, 2015 Comprehensive Annual Financial Report For the Year Ended June 30, 2015 628 W. 19th Street Costa Mesa, California
I. INTRODUCTORY SECTION
 Spartanburg Water System Spartanburg, South Carolina Comprehensive Annual Financial Report For the Year Ending June 30, 2017 I. INTRODUCTORY SECTION SPARTANBURG WATER SYSTEM SPARTANBURG, SOUTH CAROLINA
Lake Buena Vista, Florida ANNUAL FINANCIAL REPORT
 Lake Buena Vista, Florida ANNUAL FINANCIAL REPORT (LOCATED IN ORANGE AND OSCEOLA COUNTIES) 1900 HOTEL PLAZA BOULEVARD LAKE BUENA VISTA, FLORIDA BOARD OF SUPERVISORS DONALD R. GREER, PRESIDENT LAURENCE
ENGLEWOOD WATER DISTRICT FINANCIAL STATEMENTS AND SUPPLEMENTARY INFORMATION YEARS ENDED SEPTEMBER 30, 2017 AND 2016
 FINANCIAL STATEMENTS AND SUPPLEMENTARY INFORMATION YEARS ENDED TABLE OF CONTENTS YEARS ENDED INDEPENDENT AUDITORS REPORT 1 MANAGEMENT S DISCUSSION AND ANALYSIS 4 BASIC FINANCIAL STATEMENTS STATEMENTS OF
Comprehensive Annual Financial Report
 Comprehensive Annual Financial Report Cambrian Commons, Rosemount - Built in 2016 For the Year Ended June 30, 2016 Dakota County Community Development Agency A component unit of Dakota County, Minnesota
Mojave Basin Area Watermaster A Component Unit of the Mojave Water Agency. Annual Financial Report. For the Fiscal Years Ended June 30, 2015 and 2014
 A Component Unit of the Mojave Water Agency Annual Financial Report Annual Financial Report Table of Contents Page No. Table of Contents i Financial Section Independent Auditor s Report 1-2 Management
ALHAMBRA ELEMENTARY SCHOOL DISTRICT NO. 68
 ALHAMBRA ELEMENTARY SCHOOL DISTRICT NO. 68 Comprehensive Annual Financial Report Fiscal Year Ended June 30, 2013 4510 North 37 th Avenue Phoenix, Arizona 85019 PHOENIX, ARIZONA COMPREHENSIVE ANNUAL FINANCIAL
PLUM CREEK LIBRARY SYSTEM AUDITED FINANCIAL STATEMENTS AND SUPPLEMENTARY INFORMATION JUNE 30, 2017
 AUDITED FINANCIAL STATEMENTS AND SUPPLEMENTARY INFORMATION JUNE 30, 2017 Conway, Deuth & Schmiesing, PLLP Certified Public Accountants & Consultants Willmar, Minnesota This page intentionally left blank
IRVINE UNIFIED SCHOOL DISTRICT ANNUAL FINANCIAL REPORT JUNE 30, 2017
 IRVINE UNIFIED SCHOOL DISTRICT ANNUAL FINANCIAL REPORT TABLE OF CONTENTS FINANCIAL SECTION Independent Auditor's Report 2 Management's Discussion and Analysis 5 Basic Financial Statements Government-Wide
(This page intentionally left blank.)
") (This page intentionally left blank.) ANNUAL FINANCIAL REPORT of the For the Year Ended (This page intentionally left blank.) TABLE OF CONTENTS FINANCIAL SECTION Independent Auditor s Report 1 Management
(This page intentionally left blank.) ANNUAL FINANCIAL REPORT of the For the Year Ended (This page intentionally left blank.) TABLE OF CONTENTS FINANCIAL SECTION Independent Auditor s Report 1 Management
COMPREHENSIVE ANNUAL FINANCIAL REPORT OF THE LONG BEACH WATER DEPARTMENT
 COMPREHENSIVE ANNUAL FINANCIAL REPORT OF THE LONG BEACH WATER DEPARTMENT A Department of the City of Long Beach, California For The Fiscal Year Ended September 30, 2017 Long Beach Water Department 1800
City of Grand Ledge. FINANCIAL STATEMENTS (With Required Supplementary Information) June 30, 2018
 June 30, 2018") FINANCIAL STATEMENTS (With Required Supplementary Information) TABLE OF CONTENTS Page INDEPENDENT AUDITOR S REPORT MANAGEMENT S DISCUSSION AND ANALYSIS i-iii iv-x BASIC FINANCIAL STATEMENTS Government-wide
FINANCIAL STATEMENTS (With Required Supplementary Information) TABLE OF CONTENTS Page INDEPENDENT AUDITOR S REPORT MANAGEMENT S DISCUSSION AND ANALYSIS i-iii iv-x BASIC FINANCIAL STATEMENTS Government-wide
City of Placerville. Placerville, California. Basic Financial Statements And Independent Auditors Report
 City of Placerville Placerville, California Basic Financial Statements And Independent Auditors Report For the year ended June 30, 2011 CITY OF PLACERVILLE Basic Financial Statements For the year ended
Town of Waterford, Connecticut. Annual Financial Report
 Town of Waterford, Connecticut Annual Financial Report Fiscal Year Ended June 30, 2017 Town of Waterford, Connecticut Annual Financial Report Fiscal Year Ended June 30, 2017 Finance Department Contents