strong brands, products & relationships A GLOBAL CONSUMER PRODUCTS COMPANY 2005 ANNUAL REPORT
|
|
|
- Stanley Lucas
- 6 years ago
- Views:
Transcription


1 strong brands, products & relationships A GLOBAL CONSUMER PRODUCTS COMPANY 2005 ANNUAL REPORT
2 TABLE OF CONTENTS profile 1 message to shareholders 2 at a glance 4 11-year financial retrospective 6 management's discussion and analysis 7 consolidated financial statements 21 board of directors 50 major operations 51 corporate information 52
3 2005 ANNUAL REPORT 1 DOREL INDUSTRIES (TSX: DII.B, DII.A; NASDAQ: DIIB) IS A GLOBAL CONSUMER PRODUCTS COMPANY ENGAGED IN THE DESIGNING, MANUFACTURING AND MARKETING OF A DIVERSE PORTFOLIO OF POWERFUL CONSUMER BRANDS, SOLD THROUGH ITS JUVENILE, HOME FURNISHINGS, AND RECREATIONAL/LEISURE SEGMENTS. HEADQUARTERED IN MONTREAL, DOREL EMPLOYS APPROXIMATELY 4,500 PEOPLE IN FOURTEEN COUNTRIES. DOREL ALSO HAS EIGHT OFFICES IN CHINA, HEADQUARTERED IN SHANGHAI, WHICH OVERSEE THE SOURCING, ENGINEERING AND LOGISTICS OF THE COMPANY S ASIAN SUPPLIER CHAIN SALES WERE US$1.8 BILLION. US OPERATIONS INCLUDE DOREL JUVENILE GROUP USA, WHICH MARKETS THE COSCO AND SAFETY 1 st BRANDS AS WELL EDDIE BAUER AND DISNEY BABY LICENSED PRODUCTS; AMERIWOOD INDUSTRIES, WHICH MARKETS READY-TO-ASSEMBLE PRODUCTS UNDER THE AMERIWOOD, CARINA, SYSTEMBUILD, ALTRA FURNITURE AND RIDGEWOOD/CHARLESWOOD BRANDS AS WELL AS THE CALIFORNIA CLOSETS LICENSE; COSCO HOME & OFFICE, WHICH MARKETS HOME/OFFICE PRODUCTS UNDER THE COSCO AND COSCO ABILITY ESSENTIALS AND ADEPTA BRANDS AND SAMSONITE LICENSE; AND PACIFIC CYCLE, WHICH MARKETS THE SCHWINN, MONGOOSE, GT, INSTEP AND ROADMASTER BRANDS. IN CANADA, DOREL OPERATES DOREL DISTRIBUTION CANADA, RIDGEWOOD INDUSTRIES AND DOREL HOME PRODUCTS. DOREL EUROPE MARKETS JUVENILE PRODUCTS THROUGHOUT EUROPE, UNDER THE BÉBÉ CONFORT, MAXI-COSI, QUINNY, SAFETY 1 ST, BABIDÉAL, MON BÉBÉ AND BABY RELAX BRANDS. DOREL ASIA SOURCES AND IMPORTS HOME FURNISHINGS PRODUCTS. REVENUES (in thousands of U.S. dollars) NET INCOME (in thousands of U.S. dollars) NET INCOME PER DILUTED SHARE (in U.S. dollars) 2,000,000 1,600, ,000 80, ,200,000 60, , , , ,073 1,180,777 1,709,074 1,760,865 40,000 20,000 25,504 61,595 74, ,076 91,

4 2 DOREL INDUSTRIES INC. MESSAGE TO SHAREHOLDERS Dear fellow shareholder, The majority of our varied business units did well in 2005 and Dorel posted another profitable year. Full year net income, adjusted for the Ameriwood restructuring costs, was US$97.5 million or US$2.96 per diluted share compared to US$100 million or US$3.04 per diluted share last year. Unadjusted, annual net income was US$91.3 million or US$2.77 per diluted share. Revenue for the full year was US$1.8 billion, up slightly from last year s US$1.7 billion. Juvenile and Home Furnishing revenues increased by 9.1% and 4.8% respectively. Gains were offset by the decline in Recreational/Leisure sales. As previously discussed, two issues affected results. Inefficiencies in our ready-to-assemble (RTA) furniture division and a spectacular 2004 sales run for the Sting-Ray bicycle, which could not be repeated in 2005, minimized our overall corporate performance. Both matters are being decisively dealt with. Dorel s revitalized RTA furniture division is delivering Last year we initiated a plan to re-ignite the RTA furniture division. Important progress has been made. An enhanced new product development capability has resulted in an exciting flow of new products; Ameriwood has widened its customer base; sourcing has increased significantly from China and overheads have been reduced due to operational improvements at North American factories. As of this writing, the required turnaround was being affected by industry-wide particle board shortages and steep price increases. Customer price increases are being implemented which will take effect later this year. The rebuilding plan at Ameriwood included the December 2005 closure of the Wright City, Missouri factory. In the first quarter this year orders were above expectations and beyond the immediate capabilities of the three remaining North American RTA furniture plants, as the integration of the Wright City operations had not yet been completed. The insufficient level of finished goods inventory and a tight particle board supply meant orders were either cancelled or delayed. This situation substantially improved in late March. Traditionally Dorel has done well in RTA, even when some of our competitors have not. We firmly believe we will be a thriving survivor in an industry which continues to consolidate. Dorel has the resources to see situations such as this through and we have made a commitment to make the necessary adjustments to ensure that our RTA furniture operations deliver the required levels of profitability.
5 2005 ANNUAL REPORT 3 Home Furnishings successes Our two other Home Furnishings divisions performed well as did Dorel Home Product s futons. Dorel Asia had another record year. Strong 2006 juvenile and dining room programs, encompassing various imported items, are already in place at a number of mass merchants. Cosco Home & Office repositioned its furniture business in Long known for its folding furniture, the division took significant steps to re-establish itself as a leading supplier of fashion furniture. This focus is expected to provide greater revenue and margin growth. On the commercial front, use of the successful Samsonite brand is being expanded to all furniture products within the business office market. The division also pursued its development of a full line of both retail and commercial home health care products. Juvenile continues to grow The Juvenile segment had a very satisfying year. Numerous new product introductions drove revenues up 9% in North America and 8% in Europe. Costs were well contained despite higher raw material prices. DJG, USA has several new product launches planned this year. Among them are Safety 1st items, a new Disney-branded collection, an opening price point travel system, and a series of Eddie Bauer travel safety items. Canada anticipates a successful 2006 with strong organic growth. The Quinny brand will be expanded as will other select products from Dorel Europe. There was progress in several European markets, particularly in the United Kingdom, Germany, Italy and Spain, driven by the introduction of new travel systems under the Quinny brand. Dorel Europe also anticipates further progress through 2006 with new product introductions. New opportunities in Recreational/Leisure Pacific Cycle continues to sell more bikes than any other US bicycle company. With the leading mass merchant market share, it heads the industry both in dollars generated (25%*) and units sold (30%*). Clearly, the Schwinn brand is as strong as ever. Among the new products introduced in 2005 was a line of gas-powered motor scooters, a new business for Pacific. An impressive dealer network is being established. The motor scooter market is the fastest growing in the motorcycle segment. With higher gasoline prices prompting many to be more energy conscious, scooters are likely to become even more popular. Pacific also entered a new category, metal swing sets, under the Playsafe brand. In April, Pacific launched its Mongoose bicycle program in China at the Shanghai Bike Show. Mongoose has signed with the Chinese National Cycling Federation to be the exclusive supplier to the Chinese National team at the 2008 Beijing Summer Olympics. Outlook Considerable effort was expended in 2005 creating new products in all of our segments that the market wants and at the right prices. This includes the marketing of higher margin items at higher price points, particularly in Europe. With the right products, our focus through the balance of 2006 is to produce efficiently and deal with raw material supply and costs. Two challenges face the RTA furniture industry, both with particle board. Supply is exceedingly tight. Board prices began increasing during the first quarter and have continued to climb. Dorel Asia and Cosco Home & Office business is robust and a solid year is expected in both divisions. There have been exciting new futon product additions and we also expect growth in Dorel Home Products. The Juvenile segment should continue to perform well, although we are closely monitoring resin prices. In Recreational/Leisure sales of motor scooters and swing sets are expected to augment Pacific s bicycle revenues. Acknowledgements 2005 was a year of change and adjustment for many. The positive spirit with which our employees faced their respective assignments was again a reminder of the caliber of the Dorel workforce globally. To reinforce the strong relationships with our suppliers in China, the annual Far East Suppliers Conference featured a first-ever awards banquet to appropriately recognize key supplier achievements. I thank our Board of Directors for their wisdom and guidance and express sincere gratitude to our shareholders. I particularly want to express my gratitude to Dr. Laurent Picard who will be stepping down from the Board this year. Laurent has been a close associate since shortly after our 1987 IPO. His constant support and knowledge, both as a Director and friend, have been of immeasurable help through Dorel s growth. We wish him well. Martin Schwartz President and Chief Executive Officer May 9, 2006 * Source: BMRI and Company estimates.


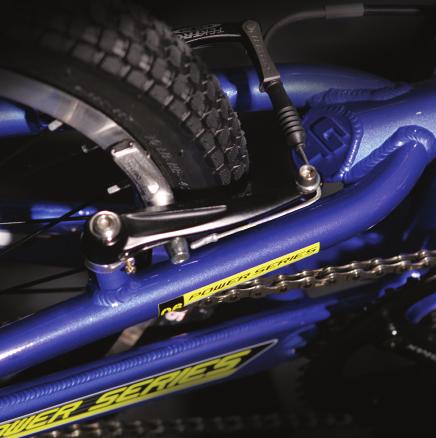
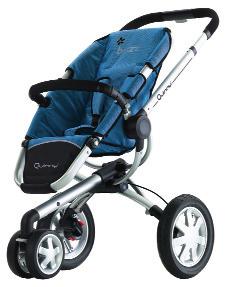
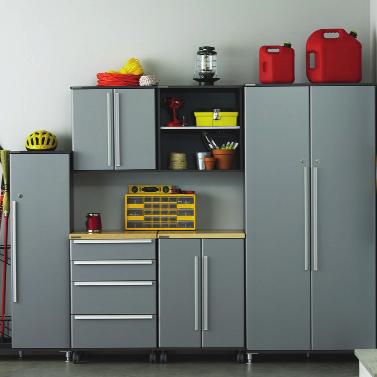
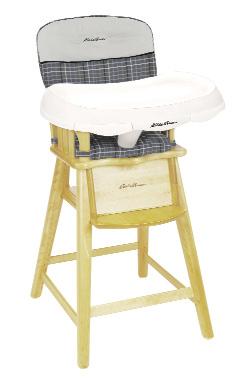
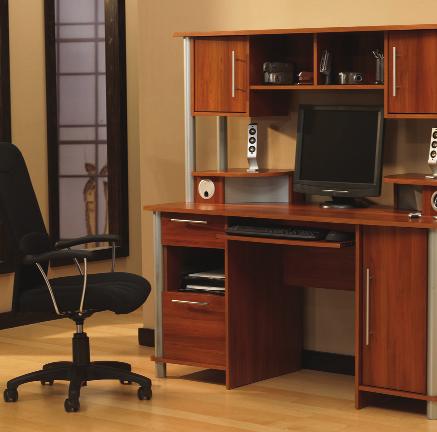
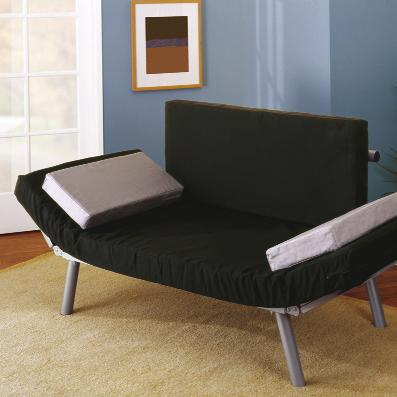
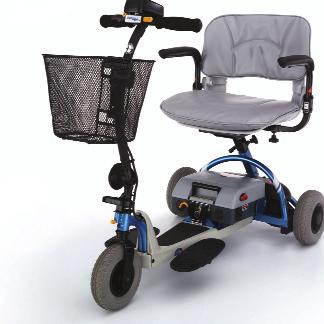
6 4 DOREL INDUSTRIES INC. DIVISIONS PRODUCT RANGE A T A G L A N C E JUVENILE DOREL JUVENILE GROUP DOREL DISTRIBUTION CANADA DOREL EUROPE INFANT CAR SEATS; STROLLERS; HIGH CHAIRS; PLAYPENS; TODDLER BEDS; EARLY LEARNING/INFANT HEALTH/SAFETY AIDS; RIDE-ON-TOYS HOME FURNISHINGS AMERIWOOD COSCO HOME & OFFICE DOREL ASIA READY-TO-ASSEMBLE; METAL FOLDING FURNITURE; STEP STOOLS; LADDERS; FUTONS; IMPORTED FURNITURE ITEMS; OFFICE/HOME OFFICE FURNITURE; ENTERTAINMENT UNITS; HOME HEALTHCARE PRODUCTS RECREATIONAL / LEISURE PACIFIC CYCLE BICYCLES; JOGGING STROLLERS; ELECTRIC SCOOTERS; GAS SCOOTERS; OTHER RECREATIONAL PRODUCTS


7 2005 ANNUAL REPORT 5 DESIGN/PRODUCT DEVELOPMENT CENTRES OUR BRANDS OPERATING FACILITIES CANTON, MASSACHUSETTS COLUMBUS, INDIANA CHOLET, FRANCE HELMOND, HOLLAND COLUMBUS, INDIANA GREENWOOD, INDIANA CHOLET, FRANCE HELMOND, HOLLAND LAUSANNE, SWITZERLAND BOREHAMWOOD, UK MONTREAL, QUEBEC ONTARIO, CALIFORNIA SABADELL, SPAIN TELGATE, ITALY VILA DO CONDE, PORTUGAL KONIGSDORF, GERMANY COLUMBUS, INDIANA ST. LOUIS, MISSOURI COLUMBUS, INDIANA CORNWALL, ONTARIO DOWAGIAC, MICHIGAN MONTREAL, QUEBEC ONTARIO, CALIFORNIA TIFFIN, OHIO MADISON, WISCONSIN LAKE FOREST, CALIFORNIA LONGMONT, COLORADO MADISON, WISCONSIN VACAVILLE, CALIFORNIA OLNEY, ILLINOIS
8 6 DOREL INDUSTRIES INC. annual results OPERATING RESULTS (IN THOUSANDS OF US DOLLARS, EXCEPT PER SHARE AMOUNTS) Revenues 1,760,865 1,709,074 1,180, , , , , , , , ,682 Cost of sales 1,367,217 1,315, , , , , , , , , ,417 Gross profit 393, , , , , , , ,729 87,200 71,835 63,265 as percent of sales 22.4 % 23.0 % 25.9 % 23.4 % 21.7 % 23.1 % 24.1 % 22.5 % 24.8 % 25.3 % 23.5 % Operating expenses 279, , , , , ,356 85,996 74,635 61,024 55,161 52,081 Restructuring costs and other one-time charges 6,982 20,000 12,037 10,066 Pretax earnings 106, ,973 99,351 85,694 31,293 35,406 57,732 26,027 26,176 16,674 11,184 as percent of sales 6.1 % 6.3 % 8.4 % 8.6 % 3.4 % 4.7 % 9.7 % 5.3 % 7.4 % 5.9 % 4.2 % Income taxes 15,591 6,897 25,151 24,099 4,731 5,432 17,756 8,330 8,862 5,991 3,716 Net earnings from continuing operations 91, ,076 74,200 61,595 26,562 29,974 39,977 17,697 17,314 10,683 7,468 as percent of sales 5.2 % 5.9 % 6.3 % 6.2 % 2.9 % 4.0 % 6.7 % 3.6 % 4.9 % 3.8 % 2.8 % Income (loss) from discontinued operations (1,058) (12,668) (1,401) 1, Net earnings 91, ,076 74,200 61,595 25,504 17,306 38,576 18,697 17,539 10,768 7,468 as percent of sales 5.2 % 5.9 % 6.3 % 6.2 % 2.8 % 2.3 % 6.5 % 3.8 % 5.0 % 3.8 % 2.8 % Earnings per share Basic * Fully diluted * Book value per share at end of year** * Adjusted to account for the weighted daily average number of shares outstanding. ** Based on the number of shares outstanding at year end. All per share amounts have been adjusted to give retroactive recognition to the two-for-one stock split that took place in Figures for 1995 have not been restated for discontinued operations.
9 MANAGEMENT S DISCUSSION AND ANALYSIS 2005 ANNUAL REPORT 7
10 8 DOREL INDUSTRIES INC. This Management s Discussion and Analysis of financial conditions and results of operations ( MD&A ) should be read in conjunction with the consolidated financial statements for Dorel Industries Inc. ( Dorel or the Company ) for fiscal years ended December 30, 2005 and 2004 ( the Consolidated Financial Statements ), as well as with the notes to the Consolidated Financial Statements. All financial information contained in this MD&A and in the Company s Consolidated Financial Statements have been prepared in accordance with Canadian generally accepted accounting principles (GAAP) using the U.S. dollar as the reporting currency. Any non-gaap financial measures referred to in this MD&A are clearly identified and reconciled to GAAP as necessary. The effect of significant differences between Canadian and U.S. GAAP are discussed in Note 26 to the Company s Consolidated Financial Statements. Unless otherwise indicated, all figures are in U.S. dollars. This MD&A is current as of February 24, Additional information relating to the Company filed with the Canadian securities regulatory authorities, including the Company s Annual Information Form ( AIF ), and with the U.S. Securities and Exchange Commission, including the annual report on form 40F, are to be available within the prescribed filing deadlines on-line at and respectively. CORPORATE OVERVIEW The Company s head office is based in Montreal, Quebec, Canada. In addition to the facilities described below, the Company s subsidiaries have North American showrooms in Toronto, Ontario and High Point, North Carolina. In total, the Company operates in fourteen countries with sales made throughout the world and employs approximately 4,500 people. Dorel s ultimate goal is to satisfy consumer needs while achieving maximum financial results for its shareholders. The Company s growth has resulted from both increasing sales of existing businesses and by acquiring businesses that management believe add value to the Company. Strategy Dorel s goal is to be the premier consumer products company in its market segments in North America and Europe. Dorel is a global consumer products company engaged in the design, manufacture and marketing of a diverse portfolio of strong consumer brands, sold through its Juvenile, Home Furnishings, and Recreational/Leisure segments. Within each of these segments, there are several operating divisions or subsidiaries. Each is operated independently by a separate group of managers. Senior management of the Company coordinates the businesses of all segments and maximizes cross-selling, cross-marketing, procurement and other complementary business opportunities. Dorel conducts its business through a variety of sales and distribution arrangements. These consist of salaried employees; individual agents who carry the Company's products on either an exclusive or non-exclusive basis; individual specialized agents who sell products, including Dorel's, exclusively to one customer such as a major discount chain; and sales agencies which themselves employ their own sales force. While retailers carry out the bulk of the advertising of Dorel s products, all of the segments advertise and promote their products through the use of advertisements in specific magazines, multi-product brochures and other media outlets. Dorel believes that its commitment to providing a high quality, industry-leading level of service has allowed it to develop successful and mutually beneficial relationships with major retailers. A high level of customer satisfaction has been achieved by fostering particularly close contacts between Dorel s sales representatives and clients. Permanent, full-service agency account teams dedicated exclusively to certain major accounts have been established. These dedicated account teams provide these customers with the assurance that inventory and supply requirements will be met and that any problems will be immediately addressed. In addition to quality products and dedicated customer service, strong consumer brands are an important element of Dorel s strategy. As examples, in North America, Dorel s Schwinn product line is one of the most recognized sporting goods brand names. Safety 1st is a highly regarded Dorel brand in the North American juvenile products market. In Europe, Bébé Confort is universally recognized and has superior brand awareness in France. These brands, and the fact that Dorel has a wide range of other brand names, allows for product and price differentiation within the same product categories. Product development is the final element of Dorel s past and future growth. As a growing consumer products company, Dorel has invested heavily in this area, focusing on innovation, quality, safety and speed to market with several design and product development centres. Over the past two years, Dorel has spent $34.0 million on new product development. OPERATING SEGMENTS Juvenile Products The Juvenile Products ( Juvenile ) segment operates in both North America and Europe. Dorel Juvenile Group (DJG) USA s operations in the United States are headquartered from Columbus, Indiana with facilities in Canton, Massachusetts and Ontario, California. As well as being the headquarters, all North American manufacturing and car seat product development is based in Columbus. Juvenile products, other than car seats, are conceived, designed and developed at the Canton location. Dorel Distribution Canada is located in Montreal, Quebec and sells to customers throughout Canada. The principal brand names in North America are Cosco and Safety 1 st. In addition, DJG North America has a licensing agreement with the well-recognized Eddie Bauer brand name. Dorel Europe is headquartered in Cholet, France and includes major manufacturing facilities in France, Italy and Portugal. In addition, sales and/or distribution subsidiaries are located in Holland, Spain, the United Kingdom, Germany, Belgium, Austria and Switzerland. In Europe, products are marketed under the brand names Bébé Confort, Maxi-Cosi, Quinny, Monbébé, Babidéal, Baby Relax and Safety 1 st. In addition, many of Dorel s divisions sell products to customers which are marketed under various house brand names.
11 2005 ANNUAL REPORT 9 The Juvenile segment manufactures and imports products such as infant car seats, strollers, high chairs, toddler beds, playpens, swings and infant health and safety aids. Dorel is among the three largest juvenile products companies in North America along with Graco (a part of the Newell Group of companies) and Evenflo Company Inc. In Europe Dorel is also one of the largest juvenile products companies, competing with firms such as Britax, Peg Perego, Chicco, as well as several smaller companies. Dorel s combined juvenile operations make it the largest juvenile products company in the world, within its principal categories. In North America, Dorel manufactures and sells juvenile products at all price levels - from entry level to high-end price points with products designed for consumers whose priorities are safety and quality at reasonable prices. However as the majority of sales are through mass merchants, department stores and hardware/home centres, the majority of sales are at lower to mid-price points. In recent years, licensing agreements with well-recognized brand names have accelerated the entry into the higher priced juvenile products market. In addition, large retailers are beginning to enter this higher end market. In Europe, Dorel sells higher-end juvenile products to boutiques and smaller stores along with major European chains. In 2005, this segment accounted for 48% of Dorel s revenues. Home Furnishings The Home Furnishings segment consists of Ameriwood Industries ( Ameriwood ), as well as Cosco Home & Office ( Cosco ) and Dorel Asia. Ameriwood specializes in ready-to-assemble (RTA) furniture and futons and is headquartered in Wright City, Missouri. In addition, significant manufacturing and distribution facilities are located in Michigan, Ohio, Ontario and Quebec. Brand names used by Ameriwood are Ameriwood, Ridgewood, Charleswood, Altra, Dorel Home Products, Carina and SystemBuild. Also, Ameriwood has entered into several licensing arrangements, including one with California Closets which provides additional branding opportunities. Cosco is located in Columbus, Indiana and in addition to selling under its own brand has a licensing agreement with Samsonite. In 2004, Cosco entered the home healthcare market with its launch of Cosco Ability Care Essentials, a line of healthcare products aimed at the end consumer. This line was augmented in 2005 with the launch of products under the Adepta brand name. Dorel Asia specializes in sourcing finished goods from the Orient for sale in North America, and is becoming a proportionately larger piece of the segment. The Home Furnishings segment produces RTA furniture for the home and office, metal folding furniture, futons, step stools, ladders and other imported furniture items. RTA furniture is manufactured and packaged as component parts and is assembled by the consumer. RTA furniture, by its nature, is a reasonably priced alternative to traditional wooden furniture. Home furnishings are sold mainly to mass merchants, office superstores and hardware/home centres. Dorel believes it is now the second largest producer of RTA furniture in North America. The Company s competitors include Bush Industries, O Sullivan Industries and Sauder. Besides these large RTA manufacturers, the Home Furnishings industry segment in which Dorel competes is characterized by a large number of smaller competitors. As such, there is little market share information available that would help determine the Company s size or performance in relation to these competitors. In 2005, this segment accounted for 32% of Dorel s revenues. Recreational/Leisure This segment consists of Pacific Cycle and is based in Madison, Wisconsin with distribution in California and Illinois. Pacific Cycle is a leader in the design, marketing and distribution of high quality, branded bicycles and other recreational products. Best known for its Schwinn, Mongoose and GT bicycle brands, the Company also markets products under the Roadmaster, InStep, Pacific, and Murray labels. Pacific Cycle combines these well-known brands with long-established, efficient Asian sourcing. It distributes its brands through its strong relationships with high volume retailers, particularly in the mass merchant channel. By capitalizing on the continued growth of this sales channel, Pacific Cycle has garnered an industry-leading share of total U.S. bicycle sales, including a significant presence in the mass merchant sector. Pacific s brand portfolio enables it to serve virtually all consumer demographics, price categories and bicycling styles. Additionally, Pacific licenses its brand names internationally on bicycles, as well as in the United States on other products such as clothing and bike accessories. In 2005, this segment accounted for 20% of Dorel s revenues. Pacific Cycle in the U.S. participates in the $75 billion recreational products industry comprised of sports and fitness equipment, footwear, apparel, and recreational transport items including bicycles, pleasure boats and RVs. Within the recreational products market, the U.S. bicycle industry accounts for an estimated $5.5 billion in retail sales annually, of which approximately $2.3 billion represents bicycles while the remainder represents parts and accessories. Principal competitors include Huffy, Dynacraft, Trek, Derby, Giant, Specialized and Cannondale. While sales have varied during certain periods with product trends, such as the rise in popularity of mountain bikes in the late 1990s, the overall market has been stable. Between 16 and 18 million units have been sold annually since 1995 in the U.S. While the U.S. bicycle market has remained relatively flat over the past five years, the mass merchant channel has captured market share. Purchasing patterns are generally influenced by economic conditions, weather and seasonality. The mass merchant channel today represents over 75% of unit sales. During that same period, the average retail price of bicycles has fallen as production has shifted almost entirely overseas. OPERATING RESULTS Part of Dorel s growth strategy is through strategic acquisitions. In reviewing the results of the Company s operating performance and its financial position, the following acquisitions in 2003 and 2004 must be considered. In February 2003 Dorel acquired Ampa Development SAS (Ampafrance) of Cholet, France a developer, manufacturer, marketer and distributor of juvenile products for a total consideration of $247.2 million. Now known as Dorel France, its brands are extremely well-recognized throughout Europe and its products include prams, strollers, car seats, high chairs, beds, play yards, safety aids, apparel, as well as feeding accessories.
12 10 DOREL INDUSTRIES INC. In September 2003, the Company acquired all of the outstanding common shares of Carina Furniture Industries Ltd., a manufacturer of RTA furniture, for a total consideration of $39.9 million. The addition of Carina broadened Dorel s product line and helped make Dorel the number two RTA furniture producer in North America. In February 2004 the Company acquired Pacific Cycle for total consideration of $311.0 million. Pacific Cycle is a leader in the design, marketing and distribution of high quality, branded bicycles and other recreational products. With the acquisition of Pacific, the Company began reporting in three segments, adding Recreational/Leisure to Juvenile and Home Furnishings. On September 19, 2005 the Company announced a significant consolidation at Ameriwood Industries, the Company s ready-to-assemble (RTA) furniture division. Production ceased at its Wright City, Missouri facilities, the manufacturing premises were closed and these assets are being disposed of. The closure was necessitated by excess capacity caused by a strategic shift away from exclusive domestic production to a combination of North American production and imported items. The restructuring is part of an overall plan to improve the earnings of the Home Furnishings Segment. This plan encompasses an expanded marketing strategy, realigning marketing into four distinct groups, each focused on developing products unique to their categories. This strategy will include expanding into new designs and materials and aggressively growing the customer base. This product development process will encompass common defined processes and methodologies to allow for exceptional speed to market, from conception to delivery. It is expected that the closure of the Wright City plant will result in total pre-tax restructuring costs of approximately $10.4 million, the majority of which is recorded in This estimate of $10.4 million is reduced slightly from the initial estimate of $11.3 million that was previously announced. The 2005 results include total restructuring costs of $9.5 million, of which $2.5 million is grouped in cost of sales. A complete description of these costs is contained in Note 3 to the year end financial statements. Of this amount, $9.3 million is a non-cash cost representing the write-down of building and equipment as well as other items. Annual pre-tax savings as a result of the closure are expected to exceed $5 million, commencing in The Company is including in this MD & A the terms adjusted gross margin, adjusted earnings from operations, adjusted pre-tax income and adjusted net income, non-gaap financial measures, as it believes this permits more meaningful comparisons of its core business performance between the periods presented. As a result, this MD & A contains these non-gaap financial measures which do not have a standardized meaning prescribed by GAAP and therefore are unlikely to be comparable to similar measures presented by other issuers. Below is a reconciliation of these non-gaap financial measures to the most directly comparable financial measures calculated in accordance with GAAP: Results for the year ended December 30, 2005 As reported Restructuring Adjusted, Costs Excluding Costs TOTAL REVENUE $ 1,760,865 $ $ 1,760,865 EXPENSES Cost of sales 1,367,217 ( 2,478 ) 1,364,739 Selling, general and administrative 200, ,159 Depreciation and amortization 38,999 38,999 Research and development costs 7,945 7,945 Restructuring costs 6,982 ( 6,982 ) Interest on long-term debt 31,240 31,240 Other interest 1,410 1,410 1,653,952 ( 9,460 ) 1,644,492 Income before income taxes 106,913 9, ,373 Income taxes 15,591 3,329 18,920 NET INCOME $ 91,322 $ 6,131 $ 97,453 EARNINGS PER SHARE Basic $ 2.78 $ 0.19 $ 2.97 Diluted $ 2.77 $ 0.19 $ 2.96 SHARES OUTSTANDING Basic - weighted average 32,836,733 32,836,733 32,836,733 Diluted - weighted average 32,927,701 32,927,701 32,927,701
13 2005 ANNUAL REPORT 11 Following is a selected summary of Dorel s operating results on an annual and quarterly basis: Selected Financial Information (all tabular figures are in thousands except per share amounts) Operating Results for the Years ended December 30: 2003 $ % of $ % of $ % of revenues revenues revenues Revenues $1,760, % $ 1,709, % $ 1,180, % Net income $ 91, % $ 100, % $ 74, % Earnings per share Basic $ 2.78 $ 3.06 $ 2.33 Diluted $ 2.77 $ 3.04 $ 2.29 Operating Results for the Quarters Ended 31-Mar Jun Sep Dec-05 Revenues $ 471,903 $ 435,375 $ 423,329 $ 430,258 Net income $ 27,205 $ 21,745 $ 19,826 $ 22,546 Earnings per share Basic $ 0.83 $ 0.66 $ 0.60 $ 0.69 Diluted $ 0.83 $ 0.66 $ 0.60 $ 0.69 Operating Results for the Quarters Ended 31-Mar Jun Sep Dec-04 Revenues $ 396,812 $ 409,352 $ 433,838 $ 469,072 Net income $ 19,400 $ 17,908 $ 28,046 $ 34,722 Earnings per share Basic $ 0.59 $ 0.55 $ 0.86 $ 1.06 Diluted $ 0.59 $ 0.54 $ 0.85 $ 1.05 Seasonality Though operating segments within Dorel may vary in their seasonality, for the Company as a whole variations between quarters are not significant as illustrated below. Revenues by quarter by segment 500, , , ,000 Total Revenues 300, , ,000 Recreational products Home Furnishings Juvenile 150, ,000 50,000 0 QTR 1 QTR 2 QTR 3 QTR 4 QTR 1 QTR 2 QTR 3 QTR 4 QTR 1 QTR 2 QTR 3 QTR Quarter
14 12 DOREL INDUSTRIES INC. INCOME STATEMENT - OVERVIEW 2005 versus 2004 For fiscal 2005, Dorel recorded revenues of $1,761 million, an increase of 3.0% from the $1,709 million last year. Increases in revenues occurred in both the Juvenile and Home Furnishing segments, increasing by 9.1% and 4.8% respectively. The gains were offset by a decline in Recreational/Leisure sales in that 2004 included exceptional sales of the Sting-Ray model of bicycle. In 2005, sales of these models were negligible as retailers were fully stocked throughout the year. It should be noted that sales of non-sting-ray products in that segment actually increased by 9% over 2004 as the core business remains strong and is being expanded. Gross margins for the year declined by 60 basis points to 22.4% for the year, from 23.0% last year. Margin improvements in the Juvenile segment were offset by declines in the Home Furnishings and Recreational/Leisure segments. Selling, general and administrative expenses declined from 2004 levels by $11.2 million to $200.2 million in 2005 from $211.4 million in This decrease was due to savings in product liability costs. The combined cost decrease in both the juvenile and home furnishing segments was $22.3 million, of which $22.6 million was in the juvenile segment. The total cost was $33.1 million in 2004 and $10.8 million in These costs were offset by other increases. Excluding this decrease, these costs as a percentage of revenues were 12.7% in 2005 versus 12.4% in Interest costs in 2005 decreased slightly from The benefit of lower average borrowings in 2005 were offset by higher interest rates incurred. The Company s average interest rate on its long-term borrowings and revolving facilities in 2005 was approximately 6%, 1 percentage point higher than in For the year, the decrease in interest costs can be broken down as follows: Higher interest rates in 2005 $ 5,600 Interest incurred in 2004 on product liability settlement ( 2,100 ) Benefit of lower average debt levels in 2005 ( 1,900 ) Other ( 463 ) $ 1,137 As a multi-national company, Dorel is resident in numerous countries and therefore subject to different tax rates in those various tax jurisdictions and by the application of income tax treaties between various countries. As such, variations from year to year in the Company s combined tax rate can occur. In 2005 the Company s effective tax rate is 14.6%. After removing the impact of the restructuring costs the Company s tax rate for the year was 16.3%, which was in line with expectations. The Company s statutory tax rate is 33%. The variation from 33% to 14.6% can be explained as follows: $ % PROVISION FOR INCOME TAXES $ 35, % ADD (DEDUCT) EFFECT OF: Difference in effective tax rates of foreign subsidiaries ( 13,791 ) ( 12.9 % ) Recovery of income taxes arising from exempt items and the use of unrecorded tax benefits ( 6,461 ) ( 6.0 % ) Change in future income taxes resulting from changes in tax rates ( 249 ) ( 0.2 % ) Change in valuation allowance % Other net % ACTUAL PROVISION FOR INCOME TAXES $ 15, % Net income for the full year amounted to $91.3 million or $2.77 per share fully diluted, compared to 2004 net income of $100.1 million or $3.04 per diluted share. Excluding restructuring costs, adjusted net income for the year was $97.5 million or $2.96 per share. Income before income taxes in 2005 was flat when compared to the prior year at $106.9 million in 2005 versus $107.0 million in Adjusted income before taxes and restructuring costs was $116.4 million in 2005 versus $107.0 million, an increase of $9.4 million or 8.8%. Fourth quarter 2005 versus 2004 Revenues for the fourth quarter were $430.3 million compared to $469.1 million a year ago, a decline of 8.3%. Net income for the fourth quarter was $22.5 million down from $34.7 million. Earnings per share for the final quarter were $0.69 fully diluted, compared to $1.05 per share in the fourth quarter the previous year. Revenues within the Juvenile and Home Furnishing segments were up slightly over the prior year increasing by 1.5% and 2.0% respectively. However, Recreational/Leisure revenues declined from $125.0 million to $80.2 million, a decrease of $44.8 million or 35.8%. This is attributable to the large amount of Sting Ray bicycle sales in the fourth quarter of Excluding the Sting Rays sold in 2004, fourth quarter 2005 Recreational/Leisure revenues were actually higher than the prior year by 10%, indicating that the segment s core business and new product initiatives remain strong.
15 2005 ANNUAL REPORT 13 The fourth quarter net income decrease of $12.2 million was due to several factors. Lower earnings in the Recreational/Leisure segment, due to the decline in sales described above, combined with lower earnings in Home Furnishings were offset by gains in Juvenile and a decrease in other costs, resulting in an overall pre-tax decline in earnings of $8.3 million or 24.6%. This decline in pre-tax earnings was compounded by an increase in income taxes of $3.9 million as 2004 included several one time positive issues. The 2004 full year tax rate of 6.4% was unusually low due to lower earnings in higher tax rate jurisdictions as well as a revaluation of long-term future tax balances, the benefit of loss carry-forwards not previously recognized and other adjustments. To adjust the Company s income tax rate to 6.4% from the 11% to 12% as at the end of the third quarter, a tax recovery of $0.8 million was recorded in the fourth quarter, explaining the majority of the 2005 fourth quarter increase. Tabular Summaries 2005 versus 2004 The variations in revenue across the Company segments are as follows: Fourth Quarter Year Increase (decrease) Increase (decrease) $ % $ % Juvenile $ 201,215 $ 198,157 $ 3, % $ 846,856 $ 776,370 $ 70, % Home Furnishings 148, ,940 2, % 569, ,219 26, % Recreational/Leisure 80, ,975 ( 44,779 ) ( 35.8 %) 344, ,485 ( 44,823 ) ( 11.5 % ) Total Revenues $ 430,258 $ 469,072 $ ( 38,814 ) ( 8.3 %) $1,760,865 $1,709,074 $ 51, % The principal changes in earnings are summarized as follows: Fourth Quarter Year Earnings from operations by Segment: Juvenile increase $ 5,049 $ 33,718 Home Furnishings decrease (excluding restructuring costs) ( 5,996 ) ( 10,098 ) Restructuring costs ( 535 ) ( 9,460 ) Recreational / Leisure decrease ( 9,176 ) ( 14,569 ) Total earnings from operations decrease ( 10,658 ) ( 409 ) Lower interest costs 221 1,137 Impact of higher tax rate ( 3,845 ) ( 8,694 ) Other 2,106 ( 788 ) Total decrease in net income $ ( 12,176 ) $ ( 8,754 ) Detailed analyses of segmented annual results are presented within the discussions that follow this overview. SEGMENT RESULTS JUVENILE Change % of % of $ sales $ sales $ % Revenues $ 846, % $ 776, % $ 70, % Gross Profit 248, % 224, % 24, % Selling, general and administrative 112, % 126, % ( 14,085 ) ( 11.2 % ) Depreciation and amortization 31, % 27, % 4, % Research and Development 5, % 4, % % Earnings from operations $ 99, % $ 65, % $ 33, %
16 14 DOREL INDUSTRIES INC. The Company s Juvenile segment had the most profitable year in its history. Successes occurred in both North America and Europe, an accomplishment made even more impressive in an environment of higher raw material costs. Revenues increased by 9.1% to reach $846.9 million versus $776.4 in 2004, with increases occurring in both North America and Europe. In North America, Juvenile sales increased by 8%. In the United States, sales increased by 5% mainly due to improved sales in categories where the Company expanded its product offering such as play yards, walkers and swings. Canadian sales were aided by new booster seat legislation in Ontario and the strong Canadian dollar. Juvenile success in Europe occurred in several markets, the most impressive of which were the United Kingdom, Germany, Italy and Spain. To a great extent, the success was driven by the successful introduction of new travel systems under the Quinny brand, known as the Buzz and Zapp. Sales in Europe as a whole increased by 9% over It should be noted that the average rate of exchange versus the U.S. dollar was similar in both 2005 and As such, revenue growth in Europe was unaffected by exchange rate variances. Gross margins for the segment improved slightly to 29.4% in 2005 compared to 28.9% in 2004, with gross margin improvements in Europe and Canada offsetting declines in the United States. European margin improvements were made possible by the success of new products, which were able to attract higher margins. These improvements totaled 270 basis points. Canadian margins were helped by a positive product mix as well as the strong Canadian dollar, as the majority of its purchases are made in U.S. dollars. U.S. margins declined by 200 basis points due to higher raw material costs, principally resin, and a less profitable product mix. Earnings from operations were $99.4 million for the year versus $65.7 million in As a percentage of revenues this represents 11.7% in 2005 versus 8.5% in European earnings improved by 35%. North American earnings improved by 80%. In Canada, higher earnings were driven by higher sales and higher gross margins for the reasons listed above. Earnings in the U.S. rose as lower gross margins were offset by savings in product liability costs. The year-over-year decline in product liability costs was $22.6 million comprising both insurance and settlement costs. This is the primary reason for the decrease in selling, general and administrative costs of $14.1 million. HOME FURNISHINGS Change % of % of $ sales $ sales $ % Revenues $ 569, % $ 543, % $ 26, % Gross Profit 73, % 83, % ( 9,465 ) ( 11.4 % ) Selling, general and administrative 34, % 31, % 2, % Depreciation and amortization 6, % 6, % ( 115 ) (1.8 % ) Research and development 2, % 1, % % Restructuring costs 6, % 6,982 Earnings from operations $ 23, % $ 43, % $ ( 19,558 ) ( 45.2 % ) Reconciliation of non-gaap financial measures As Restructuring Adjusted, Year ended December 30, 2005 reported costs Excluding Costs Revenues $ 569,347 $ $ 569,347 Cost of sales 495,492 ( 2,478 ) 493,014 Gross Profit 73,855 2,478 76,333 Gross Margin % 13.0 % 13.4 % Selling, general and administrative 34,410 34,410 Depreciation and amortization 6,318 6,318 Research and development costs 2,403 2,403 Restructuring costs 6,982 ( 6,982 ) Earnings from operations $ 23,742 $ 9,460 $ 33,202
17 2005 ANNUAL REPORT 15 Revenues in Home Furnishings were $569.3 million versus $543.2 million in 2004, an increase of 4.8%. Revenue increases occurred at all Home Furnishing operations with the exception of ready-to-assemble (RTA) furniture sales by Ameriwood. Cosco sales of folding furniture and other imported home furnishings increased by 7% over 2004, with gains coming mainly from sales of ladders and step stools. Successful new product placements in several categories by Dorel Asia at new and existing customers helped revenues reach $133 million, a 65% increase from Ameriwood futon sales also rose, increasing by 28% over the prior year. However, ready-to-assemble furniture sales declined by 17% from the prior year due to declines in sales to mass merchant customers. Gross margins for the segment declined to 13% from the 15.3% recorded in Adjusted gross margins, after removing restructuring costs in cost of sales were 13.4%, a decline of 190 basis points. The principal reason for the decline is lower margins at Ameriwood. These margin declines were due principally to lower efficiencies and higher overhead absorption due to lower sales levels. The stronger Canadian dollar also decreased earnings as two of the five Ameriwood plants are located in Canada and have substantial sales into the U.S. As announced, one of the unit s manufacturing facilities was closed in the year. This closure alone is expected to save at least $5 million pre-tax in Over and above these savings, other efficiency initiatives have been undertaken to improve margins. Selling, general and administrative costs remained in line with 2004 levels at 6.1% of revenues in 2005 versus 5.9% in Earnings from operations, after all restructuring costs, declined by $19.6 million, or 45.2%, to $23.7 million in 2005 versus $43.3 million in Adjusted earnings from operations excluding all restructuring costs were $33.2 million, a decline of $10.1 million from the prior year. Earnings from operations at Ameriwood, including all restructuring costs, declined by $24.6 million from 2004 levels. Adjusted Ameriwood earnings declined by $15.1 million from 2004 levels, offset by improved earnings at all other divisions within the segment. Of this decline, approximately $5 million was due to lower sales levels with the balance due to decreased margins. The RTA division is undergoing several initiatives to re-ignite its earnings in an attempt to reach acceptable levels of profitability. It has successfully broadened its customer base from the traditional mass merchants and has implemented an increasingly successful import program. However, the required improved efficiencies at its manufacturing facilities remain to be realized. RECREATIONAL/LEISURE Change % of % of $ sales $ sales $ % Revenues $ 344, % $ 389, % $ ( 44,823 ) ( 11.5 % ) Gross Profit 71, % 85, % ( 14,597 ) ( 17.0 % ) Selling, general and administrative 35, % 35, % ( 466 ) ( 1.3 % ) Depreciation and amortization % % % Earnings from operations $ 34, % $ 49, % $ ( 14,569 ) ( 29.5 % ) Recreational / Leisure revenues decreased 11.5% to $344.7 million in 2005 compared to $389.5 million a year ago. Included in the 2005 year-to-date revenues figure are January sales in the amount of $12.3 million. This is an extra month s revenues versus 2004, as Pacific Cycle was acquired effective February Therefore, organic revenues actually declined from the prior year by 14.7%. Excluding sales of the Sting-Ray bicycle, revenues increased by 9% over the prior year. These revenue increases occurred in several product categories and brands. However, Sting-Ray sales in 2004 far exceeded those in 2005, more than offsetting any increases. Earnings from operations decreased to $34.9 million from $49.5 million last year, a decrease of 29.5%. Gross margins decreased by 140 basis points in the year. This is due to the fact that Sting-Ray sales in 2004 carried a higher average margin than the Company s other product offerings. For the year, excluding January 2005 operating costs of $2.9 million, comparable eleven month total operating costs declined from $35.8 million to $32.4 million. Operating costs as a percentage of revenue increased to 10.2% versus 9.2% in 2004, due to substantially higher revenues in the prior year. Higher commissions on sales to the mass merchant channel and some additional promotional costs were offset by savings in general and administrative costs. BALANCE SHEET Selected Balance Sheet Data as at December 30: 2003 Total assets $ 1,542,668 $ 1,611,389 $ 1,128,963 Long-term Financial Liabilities, excluding current portion: Long-term debt $ 439,634 $ 505,816 $ 282,421 Other long-term liabilities, including balance of sale amounts $ 6,321 $ 9,909 $ 10,580
18 16 DOREL INDUSTRIES INC. As there were no business acquisitions in 2005, the Company s balance sheet as at December 30, 2005 is comparable to that as at December 30, However, the decrease in the value of the Euro against the U.S. dollar as at the year end did impact all line items, in some cases significantly reducing 2005 year end balances. The decrease in total assets of $68.7 million in 2005 can be summarized as follows: Conversion of Euro denominated assets at lower rate of exchange $ 71,558 Excess of amortization over capital additions during the year 8,574 Increase in trade accounts receivable in the year ( 12,220 ) Other 809 Total $ 68,721 Certain of the Company s working capital ratios are as follows: As at December 30, Quick ratio Current ratio # of Days in receivables # of Days in inventory Borrowings, in the form of bank indebtedness and long-term debt, decreased by $62.9 million in the year as free cash flow generated by the business was used to pay down debt. The change in debt level is summarized as follows: Free cash flow generated in the year $ 71,124 Used to pay balances of sale ( 7,440 ) Other ( 754 ) Total $ 62,930 The Company s subsidiaries are considered to be self-sustaining. As such, any foreign exchange fluctuations on conversion of non-u.s. functional currency subsidiaries to the U.S. dollar are included in the cumulative translation adjustment (CTA) account as opposed to the income statement. In 2005, exchange rates had a significant impact on the CTA account which decreased from $79.5 million to $28.1 million. LIQUIDITY AND CAPITAL RESOURCES Cash Flow Free cash flow, a non-gaap financial measure, is defined as cash flow from operations less capital expenditures and changes in funds held by ceding insurer, was $71.1 million in 2005 versus $66.2 million in 2004, detailed as follows: Change Cash flow from operations before changes in non-cash working capital: $ 143,213 $ 133,715 $ 9,498 Change in: Inventories 2,112 ( 28,769 ) 30,881 Accounts receivable ( 12,220 ) ( 34,816 ) 22,596 Accounts payable and other liabilities ( 35,741 ) 42,377 ( 78,118 ) Income taxes ( 544 ) 3,340 ( 3,884 ) Other 2, ,235 ( 44,345 ) ( 17,055 ) ( 27,290 ) Cash flow from operations 98, ,660 ( 17,792 ) Plus (less): Additions to capital assets - net ( 19,895 ) ( 32,600 ) 12,705 Deferred charges ( 7,909 ) ( 13,688 ) 5,779 Intangible assets ( 4,213 ) ( 3,029 ) ( 1,184 ) Funds held by ceding insurer 4,273 ( 1,117 ) 5,390 ( 27,744 ) ( 50,434 ) 22,690 FREE CASH FLOW $ 71,124 $ 66,226 $ 4,898
19 2005 ANNUAL REPORT 17 During 2005, cash flow from operations, before changes in working capital, improved by $9.5 million. However, after changes in non-cash working capital items, cash flow from operations declined by $17.8 million. The main reasons for the decline were higher accounts receivable balances and lower accounts payable balances. The increase in accounts receivable is principally due to a slight increase in collection days from in 2004 to in Accounts payable balances at the end of 2004 were unusually high due to substantial inventory purchases in late In 2005 accounts payable balances have returned to more normal levels, thereby using cash in the year. Capital spending declined from 2004 as the juvenile factory of the future project that started in 2003 at the Company s Columbus, Indiana facility was completed in 2004 at a total cost of $24.0 million. Capitalized research and development costs were $8.1 million in 2005 versus $12.1 million in In 2005, the Company s borrowing availability under its unsecured credit facility decreased to $425.0 million from $470.0 million as was disclosed in the Company s year-end financial statements dated December 30, This decreased availability is per the original terms negotiated in January As of December 30, 2005, Dorel was compliant with all covenant requirements and expects to be so going forward. The Company continuously reviews its cash management and financing strategy to optimize the use of funds and minimize its cost of borrowing. It is the Company policy not to pay dividends to its shareholders in the belief that cash is best conserved to finance its ongoing growth strategy, though the Board of Directors will continue to evaluate the merits of this policy going forward. CONTRACTUAL OBLIGATIONS The following is a table of significant contractual obligations of the Company as of December 30, 2005: Contractual Obligations Total less than After 5 year years years years Long-term debt repayments $ 447,708 $ 8,029 $ 339,581 $ 73,598 $ 26,500 Net operating lease commitments 77,620 21,327 30,673 14,310 11,310 Capital addition purchase commitments Minimum payments under licensing agreements 6,223 3,968 2,255 Total contractual obligations $ 531,956 $ 33,729 $ 372,509 $ 87,908 $ 37,810 The Company does not have significant contractual commitments beyond those reflected in the consolidated balance sheet, the commitments in Note 19 to the Consolidated Financial Statements or those listed in the table above. For purposes of this table, contractual obligations for the purchases of goods or services are defined as agreements that are enforceable and legally binding on the Company and that specify all significant terms, including: fixed or variable price provisions; and the approximate timing of the transaction. The Company does not have significant agreements for the purchase of raw materials or finished goods specifying minimum quantities or set prices that exceed its short term expected requirements. Therefore, not included in the above table are Dorel s outstanding purchase orders for raw materials, finished goods or other goods and services which are based on current needs and are fulfilled by our vendors on relatively short timetables. As new product development is vital to the continued success of Dorel, the Company must make capital investments in research and development, moulds and other machinery, equipment and technology. It is expected that the Company will invest at least $25.0 million over the course of 2006 to meet its new product development and other growth objectives. The Company expects its existing operations to be able to generate sufficient cash flow to provide for this and other requirements as they arise throughout the year. Over and above long-term debt in the contractual obligation table, included in the Company s long-term liabilities are the following amounts: Pension and post-retirement benefit obligations: As detailed in Note 15 of the Consolidated Financial Statements, this amount of $19.1 million pertains to the Company pension and post-retirement benefit plans. Contributions expected to be made and benefits expected to be paid under these plans in 2006 approximate $2.4 million. Other long-term liabilities consist of: Government mandated employee savings plans in Europe, the majority of which are due after five years $ 3,039 A non-interest-bearing State government loan due in equal instalments of $167 over the next three years 500 Other liabilities due in more than one year 2,117 $ 5,656
20 18 DOREL INDUSTRIES INC. DERIVATIVE FINANCIAL INSTRUMENTS As a result of its global operating activities, Dorel is subject to various market risks relating primarily to foreign currency exchange rate risk. In order to reduce or eliminate the associated risks, the Company uses various derivative financial instruments such as options, futures and forward contracts to hedge against adverse fluctuations in currency. The Company s main source of foreign currency exchange rate risk resides in sales and purchases of goods denominated in currencies other than the functional currency of each of Dorel s subsidiaries. In fact, the Company s financial debt mainly consists of notes issued exclusively in U.S. dollars, for which no foreign currency hedging is required. Short-term credit lines and overdrafts commonly used by Dorel s subsidiaries are in the currency of the borrowing entity and therefore carry no exchange-rate risk. Inter-company loans/borrowings are economically hedged as appropriate, whenever they present a net exposure to exchange-rate risk. As such, derivative financial instruments are used as a method for meeting the risk reduction objectives of the Company by generating offsetting cash flows related to the underlying position in respect of amount and timing of forecasted transactions. Dorel does not hold or use derivative financial instruments for trading or speculative purposes. The Company does not apply hedge accounting to foreign exchange contracts where hedging relationships have not been formally documented. The fair values and notional amounts of derivatives and the fair values and carrying amounts of financial instruments are disclosed in Note 13 of the Consolidated Financial Statements. The Company recorded net foreign exchange gains in the amount of $4.5 million in 2005 and $3.8 million in CRITICAL ACCOUNTING POLICIES AND ESTIMATES The Consolidated Financial Statements have been prepared in accordance with Canadian GAAP. The preparation of these financial statements requires estimates and judgments that affect the reported amounts of assets, liabilities, revenues and expenses, and related disclosure of contingent assets and liabilities. A complete list of all relevant accounting policies is listed in Note 2 to the Consolidated Financial Statements. The Company believes the following are the most critical accounting policies that affect Dorel s results as presented herein and that would have the most material effect on the financial statements should these policies change or be applied in a different manner: >>> Goodwill and certain other indefinite life intangible assets: Goodwill and certain other intangible assets have indefinite useful lives and as such, are not amortized to income. Instead, the Company must determine at least once annually whether the fair values of these assets are less than their carrying value, thus indicating impairment. The Company uses either the discounted cash flows valuation method or valuations based on a market approach and makes assumptions and estimates in a number of areas, including future cash flows, appropriate multiples of earnings of comparable companies and discount rates. >>> Product liability: The Company is insured for product liability by the use of both traditional and self-funded insurance to mitigate its product liability exposure. The estimated product liability exposure is calculated by an independent actuarial firm based on historical sales volumes, past claims history and management and actuarial assumptions. The estimated exposure includes incidents that have occurred, as well as incidents anticipated to occur on units sold prior to December 30, Significant assumptions used in the actuarial model include management s estimates for pending claims, product life cycle, discount rates, and the frequency and severity of product incidents. >>> Pension plans and post retirement benefits: The costs of pension and other post-retirement benefits are calculated based on assumptions determined by management, with the assistance of independent actuarial firms and consultants. These assumptions include the long-term rate of return on pension assets, discount rates for pension and other post-retirement benefit obligations, expected service period, salary increases, retirement ages of employees and health care cost trend rates. >>> Allowances for sales returns and other customer programs: At the time revenue is recognized certain provisions may also be recorded, including returns and allowances, which involve estimates based on current discussions with applicable customers, historical experience with a particular customer and/or product, and other relevant factors. Historical sales returns, allowances, write-offs, changes in our internal credit policies and customer concentrations are used when evaluating the adequacy of our allowance for sales returns. In addition, the Company records estimated reductions to revenue for customer programs and incentive offerings, including special pricing agreements, promotions, advertising allowances and other volume-based incentives. Historical sales data, agreements, customer vendor agreements, changes in internal credit policies and customer concentrations are analyzed when evaluating the adequacy of our allowances. CHANGES IN ACCOUNTING POLICIES >>> Variable Interest Entities: The Canadian Institute of Chartered Accountants Guideline 15, Consolidation of Variable Interest Entities, provides clarification on the application of consolidation to entities defined as variable interest entities, when equity holders are not considered to have a controlling financial interest or they have not invested enough equity to allow the entity to finance its activities without additional subordinated financial support provided by any parties, including the equity holders. The guideline is effective for fiscal years and periods beginning on or after November 1, This change in accounting policy did not have a material impact on the Company s results.
21 2005 ANNUAL REPORT 19 MARKET RISKS AND UNCERTAINTIES Product Costs Dorel purchases raw materials, component parts, and finished goods. The main commodity items purchased for production include particleboard and plastic resins. Key component parts include car seat and futon covers, hardware, buckles and harnesses, and futon frames. These parts are derived from textiles, and a wide assortment of metals, plastics, and wood. Plastic resin prices were on average 20% higher in 2005 than in 2004, while steel prices were on average 10% higher in 2005 versus These higher raw material costs were a significant contributor to decreased margins in Furthermore, rising energy costs contributed to increased costs in operating facilities, as well as in shipping the Company s products. The Company's purchased finished goods are largely produced from steel, aluminum, resins, textiles, rubber, and wood. Prices of these commodities increased during 2005, causing purchase price increases in finished goods. In addition, Dorel is among the world s largest 15 purchasers of ocean freight container transport from the Far East. Container freight costs were higher in 2005 relative to 2004 as supply continued to be tight in both eastbound trans-pacific and Asia-Europe lanes and due to higher fuel costs. The higher costs experienced in 2005 are for the most part expected to remain in place throughout most of Further increases in these costs could affect earnings negatively going forward. Concentration of Revenues For the year ended December 30, 2005, approximately 59.1% of Dorel s revenues came from its three largest customers. In 2004, there were two major customers representing 51.4% of total revenues. Dorel does not have long-term contracts with its customers, and as such revenues are dependent upon Dorel s continuing ability to deliver attractive products at a reasonable price, combined with high levels of service. There can be no assurance that Dorel will be able to sell to such customers on an economically advantageous basis in the future or that such customers will continue to buy from Dorel. Credit Risk A substantial portion of Dorel s revenues are to major retail chains. If certain of these major retailers cease operations, there could be a material adverse effect on the Company s consolidated results of operations. It should be noted that the Company conducts ongoing credit reviews and maintains credit insurance on selected accounts to minimize this risk. Product Liability As with all manufacturers of products designed for use by consumers, Dorel is subject to numerous product liability claims, particularly in the U.S. At Dorel, there is an ongoing effort to improve quality control and to ensure the safety of its products. The Company is insured for product liability, by the use of both traditional insurance and by the Company's wholly owned subsidiary, Dorel Insurance Corporation, which functions as a captive insurance company, providing a self funded insurance program to mitigate its product liability exposure. No assurance can be given that a judgment will not be rendered against it in an amount exceeding the amount of insurance coverage or in respect of a claim for which Dorel is not insured. Foreign Currency As a multinational company that uses the U.S. dollar as its reporting currency, Dorel is subject to variations in currency values against the U.S. dollar. The functional currency of Dorel s European operations is the Euro, with all other significant subsidiaries using the U.S. dollar as its functional currency. As a result, Dorel s operating units outside of the U.S. assume the majority of the Company s foreign exchange risk. Dorel s Canadian operations benefit from a stronger U.S. dollar as large portions of its revenues are generated in the U.S. and the majority of its costs are in Canadian dollars. This situation is mitigated by Dorel Canada s juvenile operations that import U.S. dollar denominated goods. Dorel s European operations are negatively effected by a stronger U.S. dollar as portions of its purchases are in U.S. dollars while its revenues are not. Where advantageous, the Company uses options, futures and forward contracts to hedge against these adverse fluctuations in currency. While the Canadian operations and European operations offset the possible negative impact of changes in the U.S. dollar, a significant change in the value of the U.S. dollar could affect future earnings. Valuation of Goodwill and other Intangible Assets As part of annual impairment tests, the value of goodwill and other indefinite life intangible assets are subject to significant assumptions, such as future expected cash flows, comparable market transaction multiples and assumed discount rates. In addition, the value of customer relationship intangible assets recognized includes significant assumptions in reference to customer attrition rates and useful lives. Changes in these assumptions could materially affect these valuations. Income Taxes The Company s current organizational structure has resulted in a comparatively low effective income tax rate. This structure and the resulting tax rate are supported by current domestic tax laws in which the Company operates and by the application of income tax treaties between various countries. Unanticipated changes to either these current domestic tax laws or rates, or to these tax treaties, could impact the effective income tax rate of the Company.
22 20 DOREL INDUSTRIES INC. Product and Brand Development To support continued revenue growth, the Company must continue to update existing products, design innovative new items, develop strong brands and make significant capital investments. The Company has invested heavily in product development and plans to keep it at the centre of its focus. In addition, the Company must continue to maintain, develop and strengthen our end-user brands. Should the Company invest in or design products that are not accepted in the marketplace, or if its products are not brought to market in a timely manner, and in certain cases, fail to be approved by the appropriate regulatory authorities, this could negatively impact future growth. OTHER INFORMATION The designation, number and amount of each class and series of its shares outstanding as of December 30, 2005 are as follows: An unlimited number of Class "A" Multiple Voting Shares without nominal or par value, convertible at any time at the option of the holder into Class "B" Subordinate Voting Shares on a one-for-one basis, and; An unlimited number of Class "B" Subordinate Voting Shares without nominal or par value, convertible into Class "A" Multiple Voting Shares, under certain circumstances, if an offer is made to purchase the Class "A" shares. Details of the issued and outstanding shares are as follows: Class A Class B Total Number Amount Number Amount Amount 4,473,244 $ 1,939 28,385,698 $ 160,564 $ 162,503 Outstanding stock options and Deferred Share Unit items are disclosed in Note 17 to the financial statements. There were no significant changes to these values in the period between the year end and the date of the preparation of this MD & A. DISCLOSURE CONTROLS AND PROCEDURES OVER FINANCIAL REPORTING Disclosure controls and procedures are designed to provide reasonable assurance that all relevant information is gathered and reported to senior management, including the Chief Executive Officer (CEO) and the Chief Financial Officer (CFO), on a timely basis so that appropriate decisions can be made regarding public disclosure. As at December 30, 2005, the CEO and the CFO have evaluated the effectiveness of Dorel s disclosure controls and procedures as defined in Multilateral Instrument of the Canadian Securities Administrators and have concluded that such disclosure controls and procedures are effective. FORWARD LOOKING INFORMATION Certain statements included in this MD&A may constitute forward looking statements within the meaning of the U.S. Private Securities Litigation Reform Act of Forward looking statements generally can be identified by the use of forward looking terminology such as may, will, expect, intend, estimate, anticipate, plan, foresee, believe or continue or the negatives of these terms or variations of them or similar terminology. We refer you to the Company s filings with the Canadian securities regulatory authorities and the U.S. Securities and Exchange Commission for a discussion of the various factors that may affect the Company s future results. Readers are cautioned, however, not to place undue reliance on forward looking statements as there can be no assurance that the plans, intentions or expectations upon which they are based will occur. By their nature, forward looking statements involve numerous assumptions, known and unknown risks and uncertainties, both general and specific, that contribute to the possibility that the predictions, forecasts, projections and other forward looking statements will not occur. This may cause the Company s actual performance and financial results in future periods to differ materially from any estimates or projections of future performance or results expressed or implied by such forward looking statements. We believe that the expectations represented by such forward looking statements are reasonable, yet there can be no assurance that such expectations will prove to be correct. Furthermore, the forward looking statements contained in this report are made as of the date of this report, and we do not undertake any obligation to update publicly or to revise any of the included forward looking statements, whether as a result of new information, future events or otherwise. The forward looking statements contained in this report are expressly qualified by this cautionary statement.
23 2005 ANNUAL REPORT 21 CONSOLIDATED FINANCIAL STATEMENTS AS AT DECEMBER 30, 2005 AND 2004


24 22 DOREL INDUSTRIES INC. MANAGEMENT S REPORT Dorel Industries Inc. s Annual Report for the year ended December 30, 2005, and the financial statements included herein, were prepared by the Corporation s Management and approved by the Board of Directors. The Audit Committee of the Board is responsible for reviewing the financial statements in detail and for ensuring that the Corporation s internal control systems, management policies and accounting practices are adhered to. The financial statements contained in this Annual Report have been prepared in accordance with the accounting policies which are enunciated in said report and which Management believes to be appropriate for the activities of the Corporation. The external auditors appointed by the Corporation s shareholders, KPMG, LLP have audited these financial statements and their report appears below. All information given in this Annual Report is consistent with the financial statements included herein. Martin Schwartz President and Chief Executive Officer Jeffrey Schwartz Chief Financial Officer AUDITORS' REPORT TO THE SHAREHOLDERS OF DOREL INDUSTRIES INC. We have audited the consolidated balance sheet of Dorel Industries Inc. as at December 30, 2005 and the consolidated statements of income, retained earnings and cash flows for the year then ended. These financial statements are the responsibility of the Company s management. Our responsibility is to express an opinion on these financial statements based on our audit. We conducted our audit in accordance with Canadian generally accepted auditing standards. Those standards require that we plan and perform an audit to obtain reasonable assurance whether the financial statements are free of material misstatement. An audit includes examining, on a test basis, evidence supporting the amounts and disclosures in the financial statements. An audit also includes assessing the accounting principles used and significant estimates made by management, as well as evaluating the overall financial statement presentation. In our opinion, these consolidated financial statements present fairly, in all material respects, the financial position of the Company as at December 30, 2005 and the results of its operations and its cash flows for the year then ended in accordance with Canadian generally accepted accounting principles. The consolidated financial statements as at December 30, 2004 and for the year then ended were audited by other auditors, who expressed an opinion without reservation on those statements in their report, dated February 4, 2005 (except as to Note 25 which is as of February 11, 2005). Chartered Accountants Montreal, Canada February 24, 2006
DOREL COMPLETES SUCCESSFUL YEAR
 JUVENILE Cosco Safety 1 st Maxi-Cosi Bébé Confort Quinny Baby Relax Babidéal Hoppop Bertini Mother s Choice RECREATIONAL / LEISURE Cannondale GT SUGOI Schwinn Mongoose Iron Horse InSTEP HOME FURNISHINGS
performance: generation after generation 2002 ANNUAL REPORT
 performance: generation after generation 2002 ANNUAL REPORT financial highlights ANNUAL RESULTS 1998-2002 Operating Results (IN THOUSANDS OF US DOLLARS, EXCEPT PER SHARE AMOUNTS) 2002 2001 2000 1999 1998
DOREL POSTS ANOTHER IMPRESSIVE QUARTER Organic revenue growth of almost 10% Earnings improve in difficult cost environment
 JUVENILE Cosco Safety 1 st Maxi-Cosi Bébé Confort Quinny Baby Relax Babidéal Hoppop Bertini Mother s Choice RECREATIONAL / LEISURE Cannondale GT SUGOI Schwinn Mongoose Iron Horse InSTEP HOME FURNISHINGS
Leveraging Our Strengths
 Leveraging Our Strengths Fourth Quarterly Report for the Year Ended December 30, 2016 MANAGEMENT S DISCUSSION AND ANALYSIS This Management s Discussion and Analysis of financial conditions and results
STYLE INNOVATION SAFETY 2013 ANNUAL REPORT
 STYLE INNOVATION SAFETY 2013 ANNUAL REPORT Revenue (In thousands of U.S. dollars) 2,140,114 2,312,986 2,364,229 2,490,710 2,435,449 09 10 11 12 13 Net Income (In thousands of U.S. dollars) 107,234 127,727
A WORLD CLASS JUVENILE PRODUCTS AND BICYCLE COMPANY 2007 ANNUAL REPORT
 A WORLD CLASS JUVENILE PRODUCTS AND BICYCLE COMPANY 2007 ANNUAL REPORT At a Glance Juvenile Our Premium Brands Recreational/Leisure Home Furnishings Table of Contents 3 Financial Highlights 4 Message to
DOREL REPORTS THIRD QUARTER RESULTS
 DOREL JUVENILE Maxi-Cosi Quinny Tiny Love Safety 1st Bébé Confort Cosco Infanti DOREL SPORTS Cannondale Schwinn Caloi GT Mongoose KidTrax DOREL HOME Dorel Home Products Cosco Home & Office Ameriwood Dorel
DOREL REPORTS THIRD QUARTER RESULTS
 DOREL JUVENILE Maxi-Cosi Quinny Safety 1st Tiny Love Bébé Confort Cosco Infanti Mother s Choice Voyage BabyArt DOREL SPORTS Cannondale Schwinn Mongoose GT Caloi SUGOI DOREL HOME Ameriwood Altra Furniture
C O M M U N I Q U É DOREL REPORTS Q4 AND 2017 YEAR-END RESULTS
 DOREL JUVENILE Maxi-Cosi Quinny Safety 1st Tiny Love Bébé Confort Cosco Infanti Mother s Choice Voyage BabyArt DOREL SPORTS Cannondale Schwinn Mongoose GT Caloi SUGOI DOREL HOME Ameriwood Altra Furniture
Management s Discussion and Analysis
 First Quarterly Report for the Three Months Ended March 31, 2017 Management s Discussion and Analysis of Financial Conditions and Results of Operations For the three months ended March 31, 2017 All figures
Management s Discussion and Analysis
 Third Quarterly Report for the Nine Months Ended 2017 Management s Discussion and Analysis of Financial Conditions and Results of Operations For the third quarter and nine months ended 2017 All figures
Leveraging Our Strengths
 Leveraging Our Strengths First Quarterly Report for the Three Months Ended March 31, 2016 Management s Discussion and Analysis of Financial Conditions and Results of Operations For the three months ended
forty years and stillgrowing
 forty years and stillgrowing A N N U A L R E P O R T 2 0 0 1 DOREL industries inc. is a rapidly growing global consumer products manufacturer specializing in three product areas: juvenile products, ready-to-assemble
STYLE INNOVATION SAFETY
 STYLE INNOVATION SAFETY SECOND QUARTERLY REPORT FOR THE SIX MONTHS ENDED JUNE 30, 2014 DOREL INDUSTRIES INC. Management s Discussion and Analysis of Financial Conditions and Results of Operations For the
forty years and stillgrowing FIRST QUARTERLY REPORT for the three months ended M A R C H 31, 2002
 forty years and stillgrowing FIRST QUARTERLY REPORT for the three months ended M A R C H 31, 2002 message to shareholders On behalf of the Board of Directors, I am very pleased to report record first quarter
Leveraging Our Strengths
 Leveraging Our Strengths Second Quarterly Report for the Six Months Ended 2016 Management s Discussion and Analysis of Financial Conditions and Results of Operations For the second quarter and six months
STYLE INNOVATION SAFETY FIRST QUARTERLY REPORT FOR THE THREE MONTHS ENDED MARCH 31, 2014
 STYLE INNOVATION SAFETY FIRST QUARTERLY REPORT FOR THE THREE MONTHS ENDED MARCH 31, 2014 Management s Discussion and Analysis of Financial Conditions and Results of Operations For the quarter ended March
UPPING OUR GAME 2017 ANNUAL REPORT
 UPPING OUR GAME 2017 ANNUAL REPORT 2017 TOTAL REVENUE BY BUSINESS SEGMENT 33% 36% Dorel Sports Dorel Juvenile 31% Dorel Home 4% 2017 TOTAL REVENUE BY GEOGRAPHIC REGION Canada 21% 60% 2% Europe Asia United
WINNING THROUGH INNOVATION
 WINNING THROUGH INNOVATION Dorel Industries Inc. First Quarterly Report for the Three Months Ended March 31, 2010 Management s Discussion and Analysis of Financial Conditions and Results of Operations
Management s Discussion and Analysis
 SECOND QUARTERLY REPORT FOR THE SIX MONTHS ENDED JUNE 30, 2018 Management s Discussion and Analysis of Financial Conditions and Results of Operations For the second quarter and six months ended June 30,
Management s Discussion and Analysis
 FIRST QUARTERLY REPORT FOR THE THREE MONTHS ENDED MARCH 31, 2018 Management s Discussion and Analysis of Financial Conditions and Results of Operations For the three months ended March 31, 2018 All figures
2017 FIRST QUARTER INTERIM REPORT
 2017 FIRST QUARTER INTERIM REPORT INTERIM MANAGEMENT S DISCUSSION AND ANALYSIS March 31, 2017 Quarterly highlights 3 Preliminary comments to Management s discussion and analysis 4 Profile and description
2nd. Quarterly Report To Shareholders. Ended August 2, 2008
 2nd Quarterly Report To Shareholders 2009 Ended August 2, 2008 Table of Contents President's Message.......................................... 3 Management's Discussion and Analysis.......................
Management s discussion and analysis ( MD&A ) May 17, 2017
 May 17, 2017") Management s discussion and analysis ( MD&A ) May 17, 2017 The following discussion and analysis is a review of the financial condition and operating results of Just Energy Group Inc. ( JE or Just Energy
Management s discussion and analysis ( MD&A ) May 17, 2017 The following discussion and analysis is a review of the financial condition and operating results of Just Energy Group Inc. ( JE or Just Energy
INTERIM REPORT RAPPORT INTERMÉDIAIRE
 INTERIM REPORT RAPPORT INTERMÉDIAIRE POUR LES FOR NEUFS THE NINE MOIS MONTHS TERMINÉS ENDED LE 27 OCTOBER OCTOBRE 27, 2018 2018 MESSAGE TO SHAREHOLDERS Dear shareholders, Sales for the third quarter ended
2018 SECOND QUARTER INTERIM REPORT
 2018 SECOND QUARTER INTERIM REPORT INTERIM MANAGEMENT S DISCUSSION AND ANALYSIS June 30, 2018 Quarterly highlights 3 Preliminary comments to Management s discussion and analysis 4 Profile and description
more
 Q1 Quarterly Report First quarter ended March 31, 2004 Stock Exchange Toronto Stock Exchange: MB Shares Outstanding (as at March 31, 2004) 27,131,200 Common Shares First Quarter Fiscal 2004 Trading History
2018 THIRD QUARTER INTERIM REPORT
 2018 THIRD QUARTER INTERIM REPORT INTERIM MANAGEMENT S DISCUSSION AND ANALYSIS September 30, 2018 Quarterly highlights 3 Preliminary comments to Management s discussion and analysis 4 Profile and description
On behalf of the Board of Directors, I am pleased to provide the results of Le Château Inc. for the third quarter ended October 30, 2010.
 interim report For the nine months ended October 30, 2010 MESSAGE TO SHAREHOLDERS On behalf of the Board of Directors, I am pleased to provide the results of Le Château Inc. for the third quarter ended
Third Quarter Report to Shareholders
 Third Quarter Report to Shareholders Thirteen and thirty-nine weeks ended MANAGEMENT'S DISCUSSION AND ANALYSIS For the thirteen and thirty-nine weeks ended (All amounts are in United States dollars unless
second quarterly report
 second quarterly report Intertape Polymer Group Inc. Management s Discussion and Analysis Consolidated Quarterly Statements of Earnings Three month periods ended (In thousands of US dollars, except per
A GLOBAL CONSUMER PRODUCTS COMPANY. Annual Report 1999
 A GLOBAL CONSUMER PRODUCTS COMPANY Annual Report 1999 DOREL (UK) LTD. Ready-to-Assemble Juvenile Home Furnishings The fourth largest Cosco ranks Cosco is the leading manufacturer in the among the top three
Overall Corporate Results The following table sets out certain highlights of the company s performance in 2009 and 2008:
 LINAMAR CORPORATION MANAGEMENT S DISCUSSION AND ANALYSIS For the Year Ended December 31, 2009 This Management s Discussion and Analysis of Financial Condition and Results of Operations ("MD&A") of Linamar
2015 SECOND QUARTER INTERIM REPORT. Empowered by customer experience
 2015 SECOND QUARTER INTERIM REPORT Empowered by customer experience Interim Management s Discussion and Analysis as at June 30, 2015 Quarterly highlights 3 Preliminary comments to Management s Discussion
MANAGEMENT S DISCUSSION AND ANALYSIS OF FINANCIAL CONDITION AND RESULTS OF OPERATIONS FOR THE THREE AND TWELVE-MONTH PERIODS ENDED DECEMBER 31, 2010
 MANAGEMENT S DISCUSSION AND ANALYSIS OF FINANCIAL CONDITION AND RESULTS OF OPERATIONS FOR THE THREE AND TWELVE-MONTH PERIODS ENDED DECEMBER 31, 2010 The following management s discussion and analysis of
Q3 QUARTERLY REPORT. Richards Packaging Income Fund. Quarter ended September 30, Report Contents
 Q3 QUARTERLY REPORT Richards Packaging Income Fund Quarter ended September 30, 2007 Report Contents Report to Unitholders...1 Management s discussion and analysis...2 Consolidated financial statements...12
Double Digit Growth Again Drives Record Sales and Earnings at Linamar, Diversification Strategy Paying Dividends
 Double Digit Growth Again Drives Record Sales and Earnings at Linamar, Diversification Strategy Paying Dividends August 7, 2018, Guelph, Ontario, Canada (TSX: LNR) Sales increase 22.1% over the second
First Quarter Fiscal 2017 Financial Report
 First Quarter Fiscal 2017 Financial Report For the three months ended March 31, 2017 and 2016 TSX: AVO AVIGILON CORPORATION MANAGEMENT S DISCUSSION AND ANALYSIS INTRODUCTION The following Management s
INTERIM MANAGEMENT DISCUSSION AND ANALYSIS FIRST QUARTER 2013
 Q1 INTERIM MANAGEMENT DISCUSSION AND ANALYSIS FIRST QUARTER 2013 SUMMARY - Uni-Select posted sales of $421.8 million during the quarter, a negative organic growth of 1.1%. Our operations were affected
2018 FIRST QUARTER INTERIM REPORT
 2018 FIRST QUARTER INTERIM REPORT INTERIM MANAGEMENT S DISCUSSION AND ANALYSIS March 31, 2018 Quarterly highlights 3 Preliminary comments to Management s discussion and analysis 4 Profile and description
2O16 FIRST QUARTERLY REPORT
 2O16 FIRST QUARTERLY REPORT Intertape Polymer Group Inc. Management s Discussion and Analysis Consolidated Quarterly Statements of Earnings Three month periods ended (In thousands of US dollars, except
The Second Cup Ltd. Management s Discussion and Analysis
 CAUTION REGARDING FORWARD-LOOKING STATEMENTS Certain statements in this ( MD&A ) may constitute forward-looking statements within the meaning of applicable securities legislation. The terms the Company,
HARDWOODS DISTRIBUTION INCOME FUND
 HARDWOODS DISTRIBUTION INCOME FUND 2006 Second Quarter Report To Unitholders The Beauty of Hardwood About the Fund Hardwoods Distribution Income Fund (the Fund ) is an unincorporated open-ended limited
Linamar Delivers Another Solid Quarter of Strong Earnings and Cash Flow, Major EV Business Win Sets Stage for Future
 Linamar Delivers Another Solid Quarter of Strong Earnings and Cash Flow, Major EV Business Win Sets Stage for Future August 2, 2017, Guelph, Ontario, Canada (TSX: LNR) Sales increase 6.6% over the second
Hardwoods Distribution Income Fund
 Hardwoods Distribution Income Fund The Beauty of Hardwood First Annual Report to Unitholders For the period March 23 to December 31, 2004 About the Fund Hardwoods Distribution Income Fund is an unincorporated
DH CORPORATION Management s Discussion and Analysis For the quarter ended March 31, 2016
 DH CORPORATION Management s Discussion and Analysis For the quarter ended March 31, 2016 D+H Q1 2016 1 Management s Discussion and Analysis For the quarter ended March 31, 2016 Page 1 Introduction 3 2
METRO S FULLY DILUTED NET EARNINGS PER SHARE INCREASED 8.8% IN THE SECOND QUARTER OF 2010
 PRESS RELEASE METRO S FULLY DILUTED NET EARNINGS PER SHARE INCREASED 8.8% IN THE SECOND QUARTER OF 2010 2010 SECOND QUARTER HIGHLIGHTS Net earnings of $80.3 million, up 5.2% Fully diluted net earnings
INTERIM MANAGEMENT REPORT. Quarter 2012
 INTERIM MANAGEMENT REPORT 3 rd Quarter 2012 SUMMARY 3 rd Quarter 2012 During the quarter, Uni-Select established a distribution network consolidation plan ( optimization plan ) which also includes a revision
Financial Highlights (1)
") Loblaw Companies limited 2013 Annual Report Financial review Financial Highlights (1) As at or for the periods ended December 28, 2013 and December 29, 2012 2013 2012 (2) 2011 (3) (millions of Canadian
Loblaw Companies limited 2013 Annual Report Financial review Financial Highlights (1) As at or for the periods ended December 28, 2013 and December 29, 2012 2013 2012 (2) 2011 (3) (millions of Canadian
MANAGEMENT DISCUSSION AND ANALYSIS OF OPERATING RESULTS AND FINANCIAL POSITION. For the three months ended March 31, 2018
 MANAGEMENT DISCUSSION AND ANALYSIS OF OPERATING RESULTS AND FINANCIAL POSITION For the three months ended The following management discussion and analysis ( MD&A ) was prepared as of May 3, 2018 and should
AUTOCANADA INCOME FUND MANAGEMENT S DISCUSSION AND ANALYSIS OF FINANCIAL CONDITION AND RESULTS OF OPERATIONS
 AUTOCANADA INCOME FUND MANAGEMENT S DISCUSSION AND ANALYSIS OF FINANCIAL CONDITION AND RESULTS OF OPERATIONS For the period from April 1, to (including business operations from May 11, to ) MANAGEMENT
CCL INDUSTRIES INC Second Quarter Consolidated Statements of Earnings and Retained Earnings
 CCL INDUSTRIES INC. 2007 Second Quarter Consolidated Statements of Earnings and Retained Earnings Unaudited Three months ended June 30th Six months ended June 30th (in millions of Cdn dollars, except per
52-Week High Trailing PE Week Low Forward PE 6.2. Hold 3 Analysts. 1-Year Return: -59.9% 5-Year Return: -68.6%
 Last Close 11.74 (CAD) Avg Daily Vol 179,153 52-Week High 29.78 Trailing PE -- Annual Div 0.80 ROE -53.3% LTG Forecast -- 1-Mo -31.8% 2019 April 04 TORONTO Exchange Market Cap (Consol) 385M 52-Week Low
MANAGEMENT S DISCUSSION AND ANALYSIS OF FINANCIAL CONDITION AND RESULTS OF OPERATIONS
 MANAGEMENT S DISCUSSION AND ANALYSIS OF FINANCIAL CONDITION AND RESULTS OF OPERATIONS For the Three and Nine Months Ended September 30, 2010 As of November 8, 2010 MANAGEMENT S DISCUSSION AND ANALYSIS
INTERIM FINANCIAL REPORT
 Constellation Software Inc. INTERIM FINANCIAL REPORT First Quarter Fiscal Year 2010 For the three month period ended March 31, 2010 (UNAUDITED) CONSTELLATION SOFTWARE INC. MANAGEMENT S DISCUSSION AND ANALYSIS
INTERIM MANAGEMENT DISCUSSION AND ANALYSIS SECOND QUARTER 2013
 Q2 INTERIM MANAGEMENT DISCUSSION AND ANALYSIS SECOND QUARTER 2013 SUMMARY The Corporation completed a formal review of strategic alternatives centered on its US automotive operations to unlock additional
Columbia Sportswear Company Reports First Quarter 2018 Financial Results; Raises Full Year 2018 Financial Outlook
 April 26, 2018 Columbia Sportswear Company Reports First Quarter 2018 Financial Results; Raises Full Year 2018 Financial Outlook PORTLAND, Ore.--(BUSINESS WIRE)-- Columbia Sportswear Company (NASDAQ:COLM):
FINAL RESULTS ANNOUNCEMENT FOR THE YEAR ENDED 31 MARCH 2010 FINANCIAL HIGHLIGHTS. Own stores number reached 764, increased by 11.
 Hong Kong Exchanges and Clearing Limited and The Stock Exchange of Hong Kong Limited take no responsibility for the contents of this announcement, make no representation as to its accuracy or completeness
AG GROWTH INTERNATIONAL INC. MANAGEMENT S DISCUSSION AND ANALYSIS Dated: March 14, 2019
 AG GROWTH INTERNATIONAL INC. MANAGEMENT S DISCUSSION AND ANALYSIS Dated: March 14, 2019 This Management s Discussion and Analysis [ MD&A ] should be read in conjunction with the audited consolidated comparative
MAISONS DU MONDE: FULL-YEAR 2017 RESULTS
 PRESS RELEASE MAISONS DU MONDE: FULL-YEAR 2017 RESULTS Very good performance across the board, in line with targets Solid sales growth and profitability Excellent free cash flow generation and strong deleveraging
Samsonite International S.A Avenue de la Liberte, L-1931, Luxembourg RCS Luxembourg: B (Incorporated under the laws of Luxembourg with
 Samsonite International S.A. 13 15 Avenue de la Liberte, L-1931, Luxembourg RCS Luxembourg: B159469 (Incorporated under the laws of Luxembourg with limited liability) Consolidated financial statements
POINTS INTERNATIONAL LTD. MANAGEMENT'S DISCUSSION AND ANALYSIS INTRODUCTION
 POINTS INTERNATIONAL LTD. MANAGEMENT'S DISCUSSION AND ANALYSIS INTRODUCTION The following management s discussion and analysis ( MD&A ) of the performance, financial condition and future prospects of Points
First Quarter 2016, Champion Europe and Knights Apparel FAQs
 First Quarter 2016, Champion Europe and Knights Apparel FAQs Updated April 21, 2016 New or updated information is in red First Quarter 2016 and HBI related FAQs Q: Can you provide an update on your various
more
 Q3 Quarterly Report Third quarter ended 2004 Stock Exchange Toronto Stock Exchange: MB Shares Outstanding (as at 2004) 27,234,265 Common Shares Third Quarter Fiscal 2004 Trading History TSX (CA$) High:
ATS REPORTS FOURTH QUARTER AND ANNUAL FISCAL 2018 RESULTS
 (519) 653-6500 730 Fountain Street North, Cambridge, Ontario N3H 4R7 ATS REPORTS FOURTH QUARTER AND ANNUAL FISCAL 2018 RESULTS Cambridge, Ontario (May 17, 2018): ATS Automation Tooling Systems Inc. (TSX:
MAISONS DU MONDE: FULL-YEAR 2018 RESULTS
 PRESS RELEASE MAISONS DU MONDE: FULL-YEAR 2018 RESULTS Strong performance in line with targets Continued solid momentum in online and international sales Focus on strategic pillars to deliver further profitable
 Print Page Close Window
 BRAINHUNTER INC. Management Discussion and Analysis For the Period Ending March 31st, 2006
 BRAINHUNTER INC. Management Discussion and Analysis For the Period Ending March 31st, 2006 May 15, 2006 Page 1 BASIS OF PRESENTATION The Management s Discussion and Analysis, dated May 15th, 2006 should
Q Quarterly Report
 Q1 2015 Quarterly Report Casper, WY Management s Discussion and Analysis of Financial Condition and Results of Operations of Ritchie Bros. Auctioneers Incorporated for the quarter ended March 31, 2015
LE CHÂTEAU REPORTS THIRD QUARTER RESULTS Q3 Comparable Store Sales Increased by 1.3%
 PRESS RELEASE LE CHÂTEAU REPORTS THIRD QUARTER RESULTS Q3 Comparable Store Sales Increased by 1.3% Montréal, December 21, 2018 Le Château Inc. (TSX VENTURE: CTU), today reported that sales for the third
PREMIUM BRANDS INCOME FUND. First Quarter 2007
 PREMIUM BRANDS INCOME FUND Management s Discussion and Analysis First Quarter 2007 OVERVIEW Premium Brands owns a broad range of leading branded specialty food businesses with manufacturing and distribution
HARDWOODS DISTRIBUTION INCOME FUND
 HARDWOODS DISTRIBUTION INCOME FUND The Beauty of Hardwood Third Quarter Report To Unitholders For the period ended September 30, 2005 1 About the Fund Hardwoods Distribution Income Fund (the Fund ) is
Q Management s Discussion and Analysis May 2, 2017
 Q1 2017 Management s Discussion and Analysis May 2, 2017 TABLE OF CONTENTS Restatement of Comparative Results... 2 First Quarter 2017 Overview... 2 Outlook... 3 Risks... 4 About Stuart Olson Inc.... 5
Continued revenue and earnings growth, with significant contribution from new Investment Management platform
 COMPANY CONTACTS: Jay S. Hennick Chairman & CEO John B. Friedrichsen CFO (416) 960-9500 FOR IMMEDIATE RELEASE Colliers International Reports Strong Third Quarter Results Continued revenue and earnings
Ulf Santjer, Tel Dieter Bock, Tel
 For immediate release MEDIA CONTACT: INVESTOR CONTACT: Ulf Santjer, Tel. +49 9132 81 2489 Dieter Bock, Tel. +49 9132 81 2261 Herzogenaurach, Germany, February 10, 2006 PUMA AG announces its consolidated
MANAGEMENT'S DISCUSSION AND ANALYSIS OF FINANCIAL CONDITION AND RESULTS OF OPERATIONS SECOND QUARTER 2002
 MANAGEMENT'S DISCUSSION AND ANALYSIS OF FINANCIAL CONDITION AND RESULTS OF OPERATIONS SECOND QUARTER 2002 The following discussion of the financial condition and results of operations of the Company should
FOR IMMEDIATE RELEASE FEBRUARY 28, 2018 SYKES ENTERPRISES, INCORPORATED REPORTS FOURTH QUARTER AND FULL YEAR 2017 FINANCIAL RESULTS
 News Release news release FOR IMMEDIATE RELEASE FEBRUARY 28, 2018 SYKES ENTERPRISES, INCORPORATED REPORTS FOURTH QUARTER AND FULL YEAR 2017 FINANCIAL RESULTS --Higher overall demand drives strong underlying
INTERIM MANAGEMENT REPORT. Quarter 2012
 INTERIM MANAGEMENT REPORT nd Quarter 2012 SUMMARY 2 nd Quarter 2012 UNI-SELECT INC. MANAGEMENT REPORT, 1 st quarter 2012 Uni-Select recorded sales of $483 million (including over $337 million in the United
CanWel Building Materials Group Ltd.
 Management s Discussion and Analysis July 27, 2011 This Management s Discussion and Analysis ( MD&A ) provides a review of the significant developments that have impacted (the Company ), the successor
MANAGEMENT DISCUSSION AND ANALYSIS OF OPERATING RESULTS AND FINANCIAL POSITION. For the three and nine months ended September 30, 2017
 MANAGEMENT DISCUSSION AND ANALYSIS OF OPERATING RESULTS AND FINANCIAL POSITION For the three and nine months ended The following management discussion and analysis ( MD&A ) was prepared as of November
POINTS INTERNATIONAL LTD. MANAGEMENT'S DISCUSSION AND ANALYSIS INTRODUCTION
 POINTS INTERNATIONAL LTD. MANAGEMENT'S DISCUSSION AND ANALYSIS INTRODUCTION The following management s discussion and analysis ( MD&A ) of the performance, financial condition and future prospects of Points
CURO Group Holdings Corp Announces Fourth Quarter and Full Year 2017 Financial Results and Issues 2018 Earnings Outlook
 CURO Group Holdings Corp Announces Fourth Quarter and Full Year 2017 Financial Results and Issues 2018 Earnings Outlook Wichita, Kansas--February 1, 2018-CURO Group Holdings Corp. (NYSE: CURO) ( CURO or
AECON GROUP INC. We ARE Aecon. Second Quarter Report A We ARE Aecon 2016 Annual Report
 AECON GROUP INC. We ARE Aecon Second Quarter Report 2017 A We ARE Aecon 2016 Annual Report Dear Fellow Shareholders, Aecon s solid second quarter results demonstrate the strength of our diverse business
Constellation Software Inc. FINANCIAL REPORT. Fourth Quarter Fiscal Year For the three and twelve month periods ended December 31, 2009
 Constellation Software Inc. FINANCIAL REPORT Fourth Quarter Fiscal Year 2009 For the three and twelve month periods ended December 31, 2009 TO OUR SHAREHOLDERS We had discontinued the quarterly president's
Q3 QUARTERLY REPORT. Richards Packaging Income Fund. Quarter ended September 30, Report Contents
 Q3 QUARTERLY REPORT Richards Packaging Income Fund Quarter ended September 30, 2017 Report Contents CEO s report to Unitholders... 1 Management s discussion and analysis... 2 Financial statements... 11
ECOLAB SECOND QUARTER REPORTED DILUTED EPS $1.20 ADJUSTED DILUTED EPS $1.27, +13% FULL YEAR 2018 ADJUSTED DILUTED EPS FORECAST $5.
 News Release Ecolab Inc. 1 Ecolab Place, St. Paul, Minnesota 55102 FOR IMMEDIATE RELEASE Michael J. Monahan (651) 250-2809 Andrew C. Hedberg (651) 250-2185 ECOLAB SECOND QUARTER REPORTED DILUTED EPS $1.20
21MAR Second Cup Royalty Income Fund TSX: SCU.UN 2007 ANNUAL REPORT FOR THE YEAR ENDED DECEMBER 31, 2007
 21MAR200609313517 Second Cup Royalty Income Fund TSX: SCU.UN 2007 ANNUAL REPORT FOR THE YEAR ENDED DECEMBER 31, 2007 TABLE OF CONTENTS Letter from the Chairman of Second Cup Royalty Income Fund 2 Letter
McCORMICK REPORTS DOUBLE DIGIT THIRD QUARTER SALES AND PROFIT GROWTH AND INCREASES 2018 EARNINGS PER SHARE OUTLOOK
 FOR IMMEDIATE RELEASE McCORMICK REPORTS DOUBLE DIGIT THIRD QUARTER SALES AND PROFIT GROWTH AND INCREASES 2018 EARNINGS PER SHARE OUTLOOK HUNT VALLEY, Md., September 27, 2018 - McCormick & Company, Incorporated
Linamar Delivers Another Quarter of Solid Earnings, Cash Flow and New Business Wins
 Linamar Delivers Another Quarter of Solid Earnings, Cash Flow and New Business Wins November 7, 2017, Guelph, Ontario, Canada (TSX: LNR) Sales increase 6.5% over the third quarter of 2016 ( Q3 2016 ) to
FOSSIL GROUP, INC. REPORTS FIRST QUARTER FISCAL 2015 RESULTS; First Quarter Net Sales of $725 Million; Diluted EPS of $0.75
 FOSSIL GROUP, INC. REPORTS FIRST QUARTER FISCAL 2015 RESULTS; First Quarter Net Sales of $725 Million; Diluted EPS of $0.75 Maintains Full Year Constant Currency Guidance and Provides Second Quarter Guidance
CCL INDUSTRIES INC First Quarter Consolidated Statements of Earnings and Retained Earnings
 CCL INDUSTRIES INC. 2007 First Quarter Consolidated Statements of Earnings and Retained Earnings Unaudited Three months ended March 31st (in millions of Cdn dollars, except per share data) 2007 2006 %
Press Release For immediate release
 Uni-Select Inc. Reports Third Quarter 2018 Financial Results: Sales up 13.4% to $448.8 million, driven by the contribution of TPA and organic growth; Consolidated organic growth (1) of 3.4% with positive
Stock Symbol: TSX CCL.A and CCL.B. CCL Industries Reports a 25% Increase in Third Quarter 2012 Net Earnings and Declares Dividend Results Summary
 CCL Industries Inc. 105 Gordon Baker Road, Suite 500, Toronto, Ontario M2H 3P8 Telephone: (416) 756-8500 Fax: (416) 756-8555 News Release Stock Symbol: TSX CCL.A and CCL.B For Immediate Release Tuesday,
Unless otherwise noted, tabular amounts are in thousands of Canadian dollars.
 MANAGEMENT S DISCUSSION AND ANALYSIS The following management s discussion and analysis ( MD&A ) of financial condition and results of operations is prepared as of February 27, 2018. This discussion should
NEWS RELEASE CONTACTS: News Media Colin Wheeler (303) Investor Relations Dave Dunnewald (303)
 Investor Relations Dave Dunnewald (303)") NEWS RELEASE CONTACTS: News Media Colin Wheeler (303) 927-2443 Investor Relations Dave Dunnewald (303) 927-2334 Molson Coors Reports Higher Underlying After-Tax Income and EBITDA for the First Quarter
NEWS RELEASE CONTACTS: News Media Colin Wheeler (303) 927-2443 Investor Relations Dave Dunnewald (303) 927-2334 Molson Coors Reports Higher Underlying After-Tax Income and EBITDA for the First Quarter
REDKNEE SOLUTIONS INC. MANAGEMENT S DISCUSSION AND ANALYSIS FOR THE SECOND QUARTER ENDED MARCH 31, 2016
 REDKNEE SOLUTIONS INC. MANAGEMENT S DISCUSSION AND ANALYSIS FOR THE SECOND QUARTER ENDED MARCH 31, 2016 DATED: May 9, 2016 SCOPE OF ANALYSIS This ( MD&A ) covers the results of operations, financial condition
Management s Discussion and Analysis May 7, 2012
 Management s Discussion and Analysis May 7, 2012 This management s discussion and analysis ( MD&A ) has been prepared by Hardwoods Distribution Inc. ( HDI or the Company ) as of May 7, 2012. This MD&A
Message to Shareholders
 1 Interim Report Three-month period ended February 28, 1 Message to Shareholders We would like to present Richelieu s results for the first quarter ended February 28,. The Company achieved net earnings
Management s Discussion and Analysis of Financial Condition and Results of Operations of Sleep Country Canada Holdings Inc.
 Management s Discussion and Analysis of Financial Condition and Results of Operations of Sleep Country Canada Holdings Inc. 1 B a s is of P re se nt ation... 1 2 F o r w a r d - l o o ki n g I n f o r
McCormick & Company, Inc. 4th Quarter 2018 Financial Results and 2019 Outlook
 McCormick & Company, Inc. 4th Quarter 2018 Financial Results and 2019 Outlook January 24 th 2019 The following slides accompany a January 24 th 2019, earnings release conference call. This information