Q Result presentation. Oslo, 13 February 2018
|
|
|
- Maximillian Lindsey
- 6 years ago
- Views:
Transcription


1 Q Result presentation Oslo, 13 February 2018
2 Disclaimer Forward Looking Statements This presentation contains forward-looking statements that involve risks and uncertainties. All statements other than statements of historical facts are forward-looking. You should not place undue reliance on these forward-looking statements for many reasons. These forward-looking statements reflect current views with respect to future events and are by their nature subject to significant risk and uncertainties because they relate to events and depend on circumstances that will occur in future. There are a number of factors that could cause actual results and developments to differ materially from those expressed or implied by these forward-looking statements. Although we believe that the expectations reflected in the forward-looking statements are reasonable, we cannot assure you that our future results, level of activity or performance will meet these expectations. Moreover, neither we nor any other person assumes responsibility for the accuracy and completeness of the forward-looking statements. Unless we are required by law to update these statements, we will not necessarily update any of these statements after the date of this presentation, either to conform them to actual results or to changes in our expectations. 2
3 Highlights Continued strong project execution Key events Increase in tender activity in Norway Strong order backlog of NOK 2,408 million, an increase of 72% Proposed dividend of NOK 1.75 per share Key figures Q4 Revenues of NOK 674 million in 2017 vs NOK 552 million in 2016 EBITDA of NOK 70 million in 2017 vs NOK 47 million in 2016 EBITDA margin of 10.4% in 2017 vs 8.6% in 2016 Key figures 2017 EBITDA margin improved to 9.7% for 2017 from 7.7% in 2016 Full year revenue growth of 20% 3
4 Financials 4
5 Q key figures profit and loss Revenue in Q of NOK 674 million (NOK 552 million) EBITDA in Q of NOK 70 million (NOK 47 million) Includes M&A cost of NOK 2.4 million EBITA in Q of NOK 55 million (NOK 41 million) Restated (Amounts in NOK million) Q Q Revenue 673,8 551, , ,0 Operating expenses 604,1 504, , ,6 EBITDA 69,7 47,4 229,2 152,4 EBITA 54,7 41,2 183,7 127,7 EBIT 46,4 34,2 149,5 99,3 EBT 45,6 31,1 143,8 89,4 EBITDA (%) 10,4 % 8,6 % 9,7 % 7,7 % EBIT in Q of NOK 46 million (NOK 34 million) *Reported numbers for the first three quarters of 2016 reflects the corrections of the purchase price allocations for the 2015 business combinations and the divestment of the Geo business Amortisation of intangible assets is estimated to NOK 17 million in 2018 (NOK 34 million in 2017) 5
6 Order book development Order book* Q Q In NOK million Order book development Q3 17 Q4 17 In NOK million , , , ** % 1 000, ,00 0 Q4 15 Q1 16 Q2 16 Q3 16 Q4 16 Q1 17 Q2 17 Q3 17 Q4 17 0,00 Q3 17 Revenue Contracts FX effect Q4 17 *Reported figures Order book Revenues FX effects Contracts not announced Announced contracts **including Fibertech 6
7 Q key figures balance sheet Intangible assets of NOK 1,048 million Cash is NOK 409 million Net debt is NOK 30 million Equity ratio is 55% (Amounts in NOK million) ASSETS Intangible assets 1 047,9 631,8 Other non-current assets 287,2 150,8 Other current assets 740,6 422,5 Cash and cash equivalents 408,5 418,4 Total assets 2 484, ,4 EQUITY AND LIABILITIES Total equity 1 357, ,2 Non-current interest-bearing liabilities 317,3 110,8 Other non-current liabilities 26,7 16,0 Interest-bearing current liabilities 121,1 82,1 Other current liabilities 661,8 400,3 Total equity and liabilities 2 484, ,4 7
8 Q key figures cash flow Cash flow from operating activities of NOK 160 million Net cash flow from investing activities is NOK -29 million Fibertech net of NOK -24 million Capex NOK -6 million Net cash flow from financing activities is NOK -35 million Repayment of debt: NOK -26 million Share buyback: NOK -12 million Restated (Amounts in NOK million) Q Q Profit/loss before tax 45,6 31,1 143,8 89,4 Net cash flow from operating activities 160,1 67,1 132,6 146,9 Net cash flow from investing activities conti. oper. -28,5-18,8-246,9-88,9 Net cash flow from financing activities -35,4 130,8 92,2 93,1 Net change in cash and cash equivalents 96,2 201,8-18,1 172,1 Cash and cash equivalents at the start of the period 308,2 213,1 418,4 258,2 Translation differences 4,1 3,5 8,2-12,0 Cash and cash equivalents at the end of the period 408,5 418,4 408,5 418,4 8
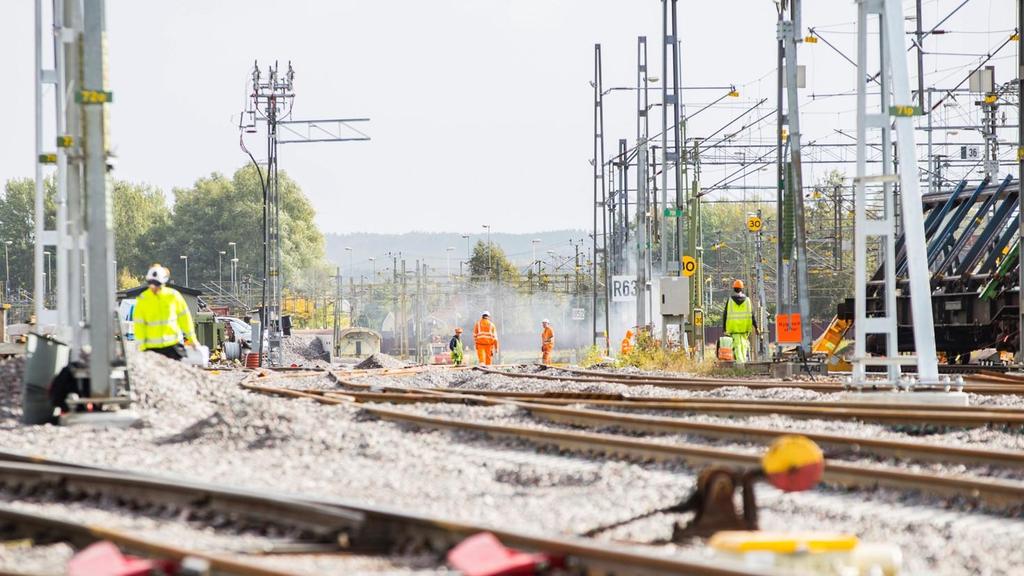
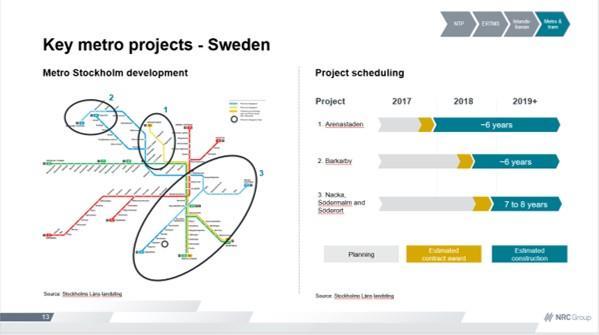
9 Long-term growth for railway activity in Sweden NTP ERTMS Inlandsbanan Metro & tram Annual average spending in new proposed NTP* SEK billion Long-term railway spending development** SEK billion 7,1 +47% 10,4 23,1 +20% 27,8 25,0 20,0 15,0 10,0 Railroad operations and maintenance 10,8 11,5 10,7 8,6 9,8 7,5 8,3 Investments 10,1 10,3 11,1 13,3 5,0 6,2 5,8 6,6 7,5 7,4 7,3 7,6 9,0 8,2 9,3 10,1 Maintenance Maintenance Investments Investments , E 2019E 2020E Continued high activity levels expected in Sweden for 2018 The new NTP is scheduled for approval in April and is a likely trigger for further growth in demand for infrastructure services The Government s estimates for railway spending indicate another step-up in activity in 2019 and 2020 Sources: *) Preliminary NTP proposal **) : Swedish national budget: Tables for Investment plan for Trafikvärket and Maintenance of the State transport infrastructure 9


10 Continued market growth in Sweden NTP ERTMS Inlandsbanan Metro & tram 10
11 Long-term growth and improved visibility in Norway NTP ERTMS Metro & tram 2018 proposed railway spending Long-term railway spending development NOK billion per year 16.7% NOK billion per year 35,0 Operations, maintenance and renewal (partly non-adressable) Investments 13.7% 30,0 14,4 25,0 11,0 20,0 18,4 8,2 8, approved budget NTP Operations, maintenance and renewal Investments Includes funding for operations of Bane NOR and planning *) 15,0 10,0 5,0 0,0 9,8 9,1 3,8 4,4 5,1 6,5 3,1 2,3 2,4 1,4 3,3 3,4 3,7 4,7 5,4 5,7 5,6 5,5 6,7 7,4 10,7 9,0 10,9 11,0 14,4 7,1 8,2 8,9 10,4 NOK 430 million additional funding to railway operations and maintenance in final 2018 budget vs. proposed budget Norwegian Government supportive of increased investments in environmentally friendly transport systems Improved visibility on future spending as Bane Nor signed first four-year funding agreement with the Government 11 *)Sources: The Norwegian national budget, national accounts and the most recent NTP

12 Increased tender activity - Norway Selected investment projects included in first six years of NTP schedule NTP ERTMS Metro & tram NOK million ERTMS contract award planned H Source: Bane NOR, Contractor-day presentation 23 October 2017

13 Several tramline contracts coming up for award in Oslo NTP ERTMS Metro & tram Key tramway development projects A selection of upcoming tram tender processes Project Holtet ~2 years 2. Thv. Meyers Gate ~2 years 3. Storgata ~2 years 4. Grefsenveien ~3 years 5. Majorstua ~2 years Planning Estimated contract award Estimated construction 13 Source: Oslo Sporveier

14 Delivering on market consolidation strategy in


15 Record contract for Oslo tram confirms strategic positioning Major award for rebuilding Holtet base NOK 402 million turnkey contract including a full scope of specialist rail services including track, electro and groundwork Structure for reception and operation of new Oslo trams Base for 43 of 87 trams to be delivered by 2021 The biggest-ever award for NRC Group in Norway Tender with significant emphasis on execution capacity, environment and quality in addition to price The first major turnkey contract awarded by Sporveien Confirming shift towards bigger contracts involving several specialist disciplines In line with NRC Group s strategic positioning Source: Sporveien 15

16 Summary & outlook Solid results in 2017 Strong balance sheet and proposed dividend of NOK 1.75 per share Strong market outlook Overall improved project pipeline visibility Continue to build orderbook Continued focus on project execution Continued focus on consolidation and M&As 16

17 Appendix 17
18 20 largest shareholders Per 12 February 2018 INVESTOR NO OF SHARES % OF SHARES ACC TYPE COUNTRY DATUM ,05 NOR KGL PROSJEKT ,58 NOR ARCTIC FUNDS ,75 IRL DNB NOR MARKETS ,06 NOR SWEDBANK ,89 NOM SWE DANSKE BANK ,88 NOM SWE CHARLOTTE HOLDING ,14 NOR NORRON SICAV TARGE ,86 LUX NORDEA BANK ,75 NOM SWE LGA HOLDING ,68 NOR SOGN INVEST ,62 NOR VERDIPAPIRFONDET ALFRED BERG ,31 NOR FIRST GENERATOR ,91 NOR MIDDELBORG INVEST ,83 NOR JPMORGAN CHASE ,66 NOM SWE E.K HOLDING ,61 NOR SEB ,49 NOM SWE SEB ,28 NOM LUX HSBC TRINKAUS & BURK ,23 NOM DEU VERDIPAPIRFONDET ALFRED BERG ,23 NOR TOTAL NUMBER OWNED BY TOP ,81 TOTAL NUMBER OF SHARES
19 NOK mill. NOK mill. Seasonal fluctuations reported figures Revenues Q Q In NOK million EBITDA Q Q In NOK million ,0% ,0% 12,0% 10,0% 8,0% Q4 15 Q1 16 Q2 16 Q3 16 Q4 16 Q1 17 Q2 17 Q3 17 Q Q4 15 Q1 16 Q2 16 Q3 16 Q4 16 Q1 17 Q2 17 Q3 17 Q4 17 6,0% 4,0% 2,0% 0,0% 19
20 Segments key figures quarterly development Restated Restated Restated Restated Restated Reported Reported Reported Reported Norway operations (NOK million) Full year 2015 Q Q Q Q Q Q Q Q Revenue 348,6 113,2 162,2 161,0 168,1 108,2 188,8 254,8 218,8 Operating profit/loss before depr. and amort. (EBITDA) 26,9-5,4 6,2 13,9-1,5-5,5 9,5 18,6 17,8 Operating profit/loss before amort. (EBITA) 21,3-7,8 3,4 10,6-3,7-9,9 5,1 13,0 9,7 Operating profit/loss (EBIT) 18,7-9,0 2,3 9,4-5,1-12,1 1,8 8,4 4,1 Sweden operations (NOK million) Full year 2015 Q Q Q Q Q Q Q Q Revenue 329,7 206,6 341,4 438,9 383,6 232,7 395,8 524,5 460,3 Operating profit/loss before depr. and amort. (EBITDA) 44,3 10,8 34,0 72,6 56,1 19,3 42,0 95,5 62,0 Operating profit/loss before amort. (EBITA) 42,1 9,2 31,7 66,6 52,2 15,0 37,2 88,6 55,0 Operating profit/loss (EBIT) 35,3 3,1 25,8 60,6 46,5 9,1 32,0 83,8 52,3 Parent, holding companies and eliminations (NOK million) Full year 2015 Q Q Q Q Q Q Q Q Revenue 0,0 0,0 0,0 0,0 0,0 0,0-3,0-2,8-5,3 Operating profit/loss before depr. and amort. (EBITDA) -39,3-4,5-17,3-5,3-7,3-7,8-8,6-3,6-10,0 Operating profit/loss before amort. (EBITA) -39,5-4,5-17,3-5,3-7,3-7,8-8,6-3,6-10,0 Operating profit/loss (EBIT) -39,5-4,5-17,4-5,3-7,2-7,8-8,6-3,6-10,0 20
REPORT 1ST QUARTER NRC GROUP ASA / Q1 REPORT 2018
 REPORT 1ST QUARTER 2018 NRC GROUP ASA / Q1 REPORT 2018 Highlights 1 st quarter 2018 / KEY EVENTS Record-high order intake of NOK 1,727 million, an increase of 126% compared to 1 st quarter 2017 Appointed
NRC GROUP ASA / Q4 REPORT 2017.
 NRC GROUP ASA / Q4 REPORT 2017. Highlights 4 th quarter 2017 / KEY EVENTS Continued strong project execution Increase in tender activity in Norway Strong order backlog of NOK 2,408 million, an increase
Highlights. 3 rd quarter 2017 / KEY EVENTS
 NRC GROUP ASA / Q3 REPORT 2017 Highlights 3 rd quarter 2017 / KEY EVENTS All time high quarterly revenue and EBITDA Record EBITDA margin driven by strong project execution Closed acquisitions of ALTi and
Highlights and key figures third quarter 2016
 Report for 3rd quarter 2016 Highlights and key figures third quarter 2016 Highlights All-time high revenue and profit for the quarter High activity, particularly in Sweden Strong order backlog of NOK 1,444
Highlights. 1 st quarter 2017 / KEY EVENTS
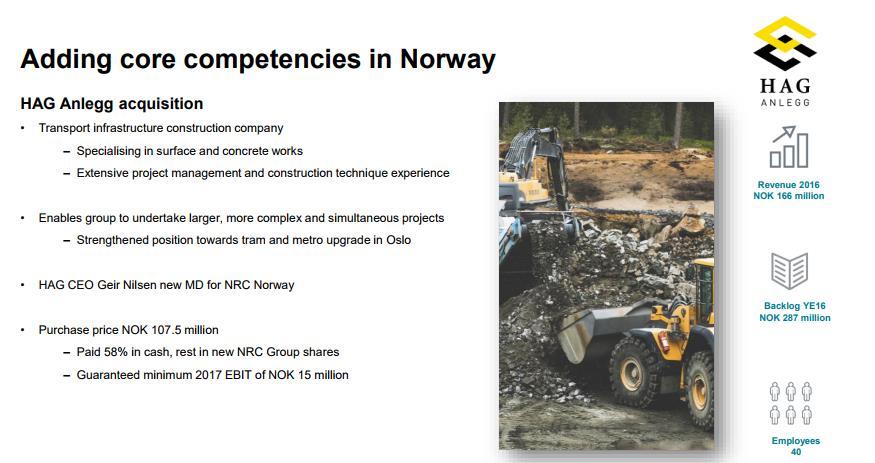
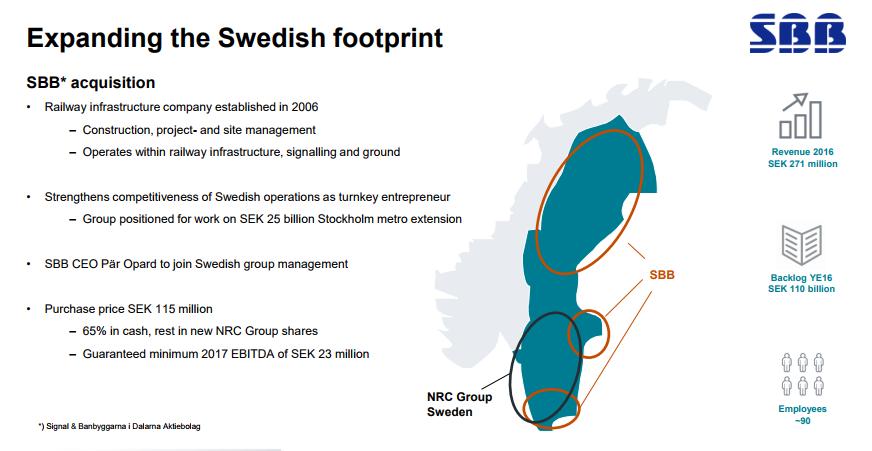
 . Highlights 1 st quarter 2017 / KEY EVENTS Adding core competencies by acquiring Norwegian construction company HAG Anlegg AS Strengthened position in Sweden by acquiring Swedish railway infrastructure
Highlights. 2 nd quarter and first half 2018 / KEY FIGURES Q2 2018
 Highlights 2 nd quarter and first half 2018 / KEY FIGURES Q2 2018 Revenues of NOK 827 million in 2018, an increase of 42% EBITDA of NOK 65 million in 2018, an increase of 51% Order backlog of NOK 3,178
Highlights. 2 nd quarter and first half 2017 / KEY EVENTS
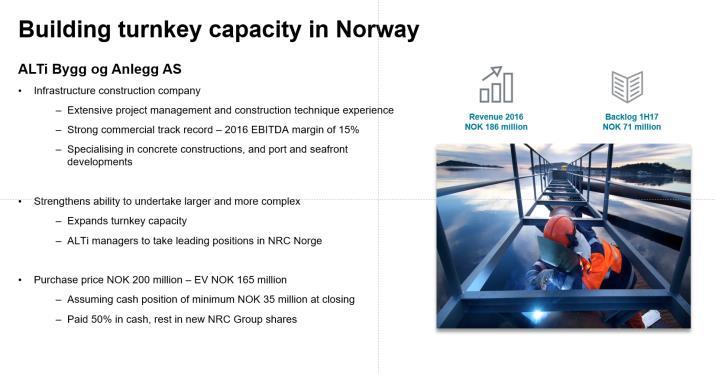
 Highlights 2 nd quarter and first half 2017 / KEY EVENTS Record-high order intake of NOK 1,231 million Adding groundwork and project management expertise by acquiring ALTi Bygg og Anlegg AS Initiated and
Report for 4th Quarter 2015
 Report for 4th Quarter 2015 Highlights and Key Figures Fourth Quarter 2015 Highlights The acquisitions of Segermo, Litz and Elektrobyggnad will further strengthen the company's competitive position within
REPORT 3RD QUARTER NRC GROUP ASA / Q3 REPORT 2018
 REPORT 3RD QUARTER 2018 NRC GROUP ASA / Q3 REPORT 2018 Highlights 3 rd quarter 2018 / ACQUISITION OF VR TRACK OY CREATING THE LARGEST NORDIC RAIL INFRASTRUCTURE GROUP An even stronger platform to capture
Your Aquaculture Technology and Service Partner. Q Presentation Oslo - February 19 th, 2016 Trond Williksen, CEO Eirik Børve Monsen, CFO
 Q4 2015 Presentation Oslo - February 19 th, 2016 Trond Williksen, CEO Eirik Børve Monsen, CFO Agenda 1 Highlights 2 Financial performance 3 Outlook 4 Q&A Highlights Q4 2015 - by CEO Trond Williksen 3 MNOK
Q presentation. Oslo, 28 November 2018
 Q3 2018 presentation Oslo, 28 November 2018 Highlights Q3 2018 Overview High gross cash collection of NOK 1,022m up 57% (NOK 650m in Q3 2017) Financial developments Cash EBITDA increased by 65% to NOK
60 Kärnhem. 348 BWG Homes AB. 643 Block Watne 2 QUARTER NEW ORDERS NOK million OPERATIONAL REVENUES NOK million 1 053
 2 QUARTER 2013 NEW ORDERS NOK million 1 088 OPERATIONAL REVENUES NOK million 1 053 OPERATIONAL EBITDA MARGIN Per cent 12.3 OPERATIONAL REVENUE PER BUSINESS AREA NOK million 60 Kärnhem 643 Block Watne 348
Dolphin Group ASA. SEB Nordic Seminar - 8 th January Atle Jacobsen (CEO) & Erik Hokholt (CFO)
 & Erik Hokholt (CFO)") Dolphin Group ASA SEB Nordic Seminar - 8 th January 2015 Atle Jacobsen (CEO) & Erik Hokholt (CFO) 2 Disclaimer This presentation includes and is based, inter alia, on forward-looking information and statements
Dolphin Group ASA SEB Nordic Seminar - 8 th January 2015 Atle Jacobsen (CEO) & Erik Hokholt (CFO) 2 Disclaimer This presentation includes and is based, inter alia, on forward-looking information and statements
About EVRY.
 OSLO BØRS TICKER: EVRY Interim Report for Q3 2017 Contents Financial Highlights 5 Key Figures and Financial Ratios 6 Group Performance 7 Target for 2017 9 Business Area Performance 10 Condensed Consolidated
Your Aquaculture Technology and Service Partner. Q Presentation Oslo - August 17 th, 2016 Trond Williksen, CEO Eirik Børve Monsen, CFO
 Q2 2016 Presentation Oslo - August 17 th, 2016 Trond Williksen, CEO Eirik Børve Monsen, CFO Agenda 1 Highlights 2 Financial performance 3 Outlook 4 Q&A Highlights Q2 2016 - by CEO Trond Williksen 3 Improved
Q presentation. 19 November 2015
 Q3 2015 presentation 19 November 2015 1 Today s presenters Axel Hjärne Chief Executive Officer Gert Sköld Chief Financial Officer 2 Eltel in brief Q3 2015 business performance Q3 2015 financials Market
Norlandia Health & Care Group AS Q3 Interim Report 2017
 Norlandia Health & Care Group AS Q3 Interim Report 2017 CONTENT CONTENT... 2 KEY FIGURES... 3 Q3 2017 HIGHLIGHTS... 3 NORLANDIA HEALTH & CARE GROUP AS... 5 GROUP ACTIVITIES... 5 FINANCIALS... 6 GROUP FINANCIAL
EVRY ASA Q4/FY 2017 PRESENTATION. CEO Björn Ivroth CFO Henrik Schibler
 EVRY ASA Q4/FY 2017 PRESENTATION CEO Björn Ivroth CFO Henrik Schibler Agenda Q4/ Preliminary FY 2017 presentation Group highlights Business update & trends Financial highlights Business area performance
Your Aquaculture Technology and Service Partner. Q Presentation Oslo - May 11 th, 2016 Trond Williksen, CEO Eirik Børve Monsen, CFO
 Q1 2016 Presentation Oslo - May 11 th, 2016 Trond Williksen, CEO Eirik Børve Monsen, CFO Agenda 1 Highlights 2 Financial performance 3 Outlook 4 Q&A Highlights Q1 2016 - by CEO Trond Williksen 3 MNOK On
Revenue 1,716 million (7% y/y) EBITA 150 million (11% y/y) EBITA margin 8,8 %
 EBITA 150 million (11% y/y) EBITA margin 8,8 %") Q3 HIGHLIGHTS GROUP Revenue 1,716 million (7% y/y) EBITA 150 million (11% y/y) EBITA margin 8,8 % Gaining share in Bank & Finance; +6% y/y Change in pension scheme implemented Significant restructuring
Q3 HIGHLIGHTS GROUP Revenue 1,716 million (7% y/y) EBITA 150 million (11% y/y) EBITA margin 8,8 % Gaining share in Bank & Finance; +6% y/y Change in pension scheme implemented Significant restructuring
Page 2. 1 st quarter 2015
 Page 2 1 st quarter 2015 The 1 st quarter is normally the weakest quarter. Winter entails a low level of production, and delayed start-up in the spring results in additional costs being incurred. Adjusted
Q Presentation. Oslo November 2 nd 2018 Hallvard Muri, CEO Simon Nyquist Martinsen, CFO
 Q3 218 Presentation Oslo November 2 nd 218 Hallvard Muri, CEO Simon Nyquist Martinsen, CFO Agenda Highlights Financial performance Outlook Q&A Highlights Q3 218 by CEO Hallvard Muri Order Intake development
EDB Business Partner ASA REPORT FOR THE THIRD QUARTER OF 2007
 - 1 - EDB Business Partner ASA REPORT FOR THE THIRD QUARTER OF 2007 Revenues of NOK 1,465 million, 7% y/y growth Improved EBITA margin to 9.3% compared to 8.9% in 2006 Solutions and Application Services
Report Third quarter evry.com
 Report Third quarter 2012 evry.com About EVRY EVRY is one of the leading IT companies in the Nordic countries, with a strong local and regional presence in 50 Nordic towns and cities. Through its knowledge,
OSLO BØRS TICKER: EVRY
 OSLO BØRS TICKER: EVRY Interim Report for Q4 2017 and preliminary full year 2017 Contents Financial Highlights 5 Key Figures and Financial Ratios 6 Group Performance 7 Business Area Performance 10 Condensed
EVRY ASA Q PRESENTATION CEO BJÖRN IVROTH CFO HENRIK SCHIBLER
 1 EVRY ASA Q1 2018 PRESENTATION CEO BJÖRN IVROTH CFO HENRIK SCHIBLER Agenda Group highlights Business update Financial highlights Business area performance Targets and Concluding remarks Q&A 2 Group highlights
Prospectus. NRC Group ASA
 Prospectus NRC Group ASA (a public limited liability company organized under the laws of the Kingdom of Norway) Business registration number: 910 686 909 Subsequent Offering of up to 370,370 Offer Shares
NOBINA AB INVESTOR PRESENTATION, YEAR-END REPORT MARCH 2016 FEBRUARY 2017
 1 NOBINA AB INVESTOR PRESENTATION, YEAR-END REPORT MARCH 2016 FEBRUARY 2017 LARGEST PUBLIC TRANSPORT COMPANY IN THE NORDIC REGION Nobina s economies of scale, market expertise and outstanding bus fleet,
Investor presentation, Interim report September 2018 November 2018 NOBINA AB. Nobina investor presentation, Q3 2018/19
 1 Investor presentation, Interim report September 2018 November 2018 NOBINA AB PROFITABLE GROWTH IN THIRD QUARTER NET SALES EBITA EBT CASH FLOW SEK Millions 2,609 (2,260) SEK Millions 256 (221) SEK Millions
Q presentation. 5 February 2015
 Q4 2014 presentation 5 February 2015 Agenda Highlights Financial overview Market outlook Q4 Highlights Strong finish to a record year Revenue of NOK 7 549 million, up 10.3% EBITDA* of NOK 396 million,
Consolidated Statement of Financial Position
 Consolidated Statement of Financial Position as at 31 December 2013 Assets Non-current assets 31.12.2013 31.12.2012 Intangible assets (1) 461,311 455,812 Property, plant and equipment (2) 60,968 60,196
NOBINA AB Investor presentation, Interim report March 2018 May 2018
 1 NOBINA AB Investor presentation, Interim report March 2018 May 2018 FINANCIAL OVERVIEW ¹ NET SALES EBIT EBT CASH FLOW 2,361 (2,205) 104 (95) 72 (58) -74 (-60) FINANCIAL HIGHLIGHTS Net sales grew 7.1%
Third quarter presentation 2012
 Proud ownership Third quarter presentation 2012 Agenda Highlights and Industrial Holdings Øyvind Eriksen President and CEO Financial Investments and Statement Trond Brandsrud CFO Q&A 2 Third quarter 2012
1 ST QUARTER RESULTS Kenneth Ragnvaldsen, CEO April 19, 2013, Oslo
 Q1 1 ST QUARTER RESULTS 2013 Kenneth Ragnvaldsen, CEO April 19, 2013, Oslo AGENDA Financial status Business update Outlook Q&A HIGHLIGHTS Profitability continues to improve. Positive development in Services.
CEO Terje Mjøs. Oslo, 8 February Q Presentation
 CEO Terje Mjøs Oslo, 8 February 213 2 Presentation Part I ` Report o Group o Segments Part II Cost improvements o Revenue and margin analysis o Future proof Part III Outlook o Market o Company Summary
Q presentation. Oslo, 25 August 2017
 Q2 2017 presentation -- Oslo, 25 August 2017 B2Holding status update Overview Gross cash collection above expectation total NOK 604m (vs. NOK 427m Q2 2016) Financial developments Cash EBITDA increased
Investor presentation, Interim report June 2018 August 2018 NOBINA AB. Nobina investor presentation, Q2 2018/19
 1 Investor presentation, Interim report June 2018 August 2018 NOBINA AB SECOND QUARTER WITH SOLID PERFORMANCE NET SALES EBIT EBT CASH FLOW SEK Millions 2,235 (2,169) SEK Millions 117 (106) SEK Millions
STRABAG SE JANUARY JUNE 2014 RESULTS 29 AUGUST 2014
 STRABAG SE JANUARY JUNE 2014 RESULTS 29 AUGUST 2014 DISCLAIMER This presentation is made by STRABAG SE (the "Company") solely for use at investor meetings and is furnished to you solely for your information.
Viking Redningstjeneste Topco AS. Interim financial statements 4Q 2018
 Viking Redningstjeneste Topco AS Interim financial statements 4Q 2018 Quarterly report October December 2018 Viking Redningstjeneste Topco AS Fourth quarter 2018 Org no. 998 858 690 Quarterly report FOURTH
Third quarter of 2010
 Third quarter of 2010 Main features of the third quarter of 2010 Merger with ErgoGroup completed with effect from 30 September 2010 Operating revenue NOK 1,679 million (NOK 1,716 million) EBITA NOK 70
First half year and Q2 results Peter Nilsson, CEO Cathrin Nylander, CFO
 First half year and Q2 results 2018 Peter Nilsson, CEO Cathrin Nylander, CFO 12 July, 2018 Financial highlights Q2: Continued growth and solid profitability Continued revenue growth Highest Q2 revenue
Report Q August 14, 2017
 Report Q2 2017 August 14, 2017 Highlights Second Quarter of 2017 Gross revenue grows by 37% from previous quarter to EUR 26.9 million. Net profit is positive with EUR 4.6 million for the quarter. EBITDA
Norwegian Finans Holding ASA. Investor Presentation for Contemplated Private Placement April 2016
 Norwegian Finans Holding ASA Investor Presentation for Contemplated Private Placement April 2016 Disclaimer THIS PRESENTATION (HEREINAFTER REFERRED TO AS THE PRESENTATION ) HAS BEEN PREPARED BY NORWEGIAN
EVRY IFRS 15 Transition 4 MAY 2018
 EVRY Transition 4 MAY 2018 Transition EVRY has adopted using the modified retrospective method Only contracts not completed at 31 December 2017 have been subject to transition to Prior comparative periods
1 st Half 2018 Update. September 10, 2018
 1 st Half 2018 Update September 10, 2018 IMPORTANT INFORMATION This presentation (the "Presentation") has been produced by Atlantic Sapphire AS (the "Company") exclusively for information purposes. This
3Q 2018 Fornebu, October 24, 2018 Luis Araujo and Svein Stoknes
 3Q 2018 Fornebu, October 24, 2018 Luis Araujo and Svein Stoknes Agenda 3Q 2018 Answers Questions Introduction Luis Araujo Chief Executive Officer Financials Svein Stoknes Chief Financial Officer Q&A Session
Acta Holding ASA. Interim Report. 2nd quarter th August 2007.
 Acta Holding ASA. Interim Report. 2nd quarter 2007. 15th August 2007. Highlights 2nd quarter 2007 Acta invests in future growth Best second quarter with gross subscriptions of 6,729 million kroner, up
1Q 2018 Fornebu, April 27, 2018 Luis Araujo and Svein Stoknes
 1Q 2018 Fornebu, April 27, 2018 Luis Araujo and Svein Stoknes Agenda 1Q 2018 Answers Questions Introduction Luis Araujo Chief Executive Officer Financials Svein Stoknes Chief Financial Officer Q&A Session
4Q 2018 Fornebu, February 8, 2019 Luis Araujo and Svein Stoknes
 4Q 2018 Fornebu, February 8, 2019 Luis Araujo and Svein Stoknes Agenda 4Q 2018 Answers Questions Introduction Luis Araujo Chief Executive Officer Financials Svein Stoknes Chief Financial Officer Q&A Session
Magseis ASA Q th August Expanding operational footprint
 Magseis ASA Q2 2018 16 th August 2018 Expanding operational footprint Disclaimer This presentation (the Presentation") has been prepared by Magseis ASA (the Company or Magseis ). The Presentation contains
CEO Terje Mjøs. Oslo, 17 July Q Presentation
 CEO Terje Mjøs Oslo, 17 July 1 Q 1 Presentation Q 1 Highlights Profitable and strong organic growth in Sweden +1% YoY o Flat in Norway, +3% in total EBITA NOK 15 million (+9% YoY*) o Including synergy
100 Kärnhem. 538 Block Watne. 387 BWG Homes AB 4 QUARTER NEW ORDERS NOK million 951. OPERATIONAL REVENUES NOK million 1 036
 4 QUARTER 2013 NEW ORDERS NOK million 951 OPERATIONAL REVENUES NOK million 1 036 OPERATIONAL EBITDA MARGIN Per cent 10.3 OPERATIONAL REVENUE PER BUSINESS AREA NOK million 100 Kärnhem 538 Block Watne 387
RECORD-BREAKING FOURTH QUARTER SALES AND EBITA AS MARKET CONDITIONS RETURN TO NORMAL
 RECORD-BREAKING FOURTH QUARTER SALES AND EBITA AS MARKET CONDITIONS RETURN TO NORMAL Bygghemma Group First AB (publ) 1 Today s presenters Mikael Olander President and CEO Martin Edblad CFO Bygghemma Group
Blom ASA. 1 st Quarter 2012 Results. Presentation by CEO Dirk Blaauw. May 31 st 2012 Thon Hotel Vika Atrium, Oslo
 Blom ASA 1 st Quarter 2012 Results Presentation by CEO Dirk Blaauw May 31 st 2012 Thon Hotel Vika Atrium, Oslo Disclaimer Forward Looking Statements This presentation contains forward-looking statements
Fourth quarter of 2010
 Fourth quarter of 2010 Main features of the fourth quarter of 2010 Operating revenue NOK 3,363 million, 2% organic growth EBITA before synergy costs NOK 171 million (NOK 283 million) Revenue growth and
INTERIM REPORT Q1 2015
 INTERIM REPORT Q1 2015 HIGHLIGHTS Robust earnings with solid underlying EBITDA in the quarter Strong order intake during the quarter Good project execution and cost control Successful Initial Public Offering
Q1 Presentation April, 2013
 Q1 Presentation 19 April, Disclaimer This presentation has been prepared by Duni AB (the Company ) solely for use at this investor presentation and is furnished to you solely for your information and may
Q3 report 2017, Avida Holding AB
 Q3 report 2017, Avida Holding AB Third quarter highlights Group results Strong growth with volumes up 93% YoY to SEK2,379m Revenues increased to SEK83.8m in Q3 and net profit increased to SEK16.3m ROE
AINMT Scandinavia Holdings AS. Quarterly Report January - June
 Quarterly Report January - June 2 0 1 6 Quarterly report SECOND QUARTER SUMMARY - Service revenue of NOK 194,257 thousands; 19% y-o-y growth - EBITDA* of NOK -76,232 thousands - Book equity of NOK 534
PHOTOCURE ASA RESULTS FOR FIRST QUARTER MAY Kjetil Hestdal, MD, President & CEO Erik Dahl, CFO
 PHOTOCURE ASA RESULTS FOR FIRST QUARTER 2018 23 MAY 2018 Kjetil Hestdal, MD, President & CEO Erik Dahl, CFO DISCLAIMER The information included in this Presentation contains certain forward-looking statements
Viking Assistance Group AS. Quarterly Report 3Q17 July September 2017
 Viking Assistance Group AS Quarterly Report 3Q17 July September 2017 THIRD QUARTER 2017 SUMMARY Group revenues of MNOK 179,0 Group EBITDA of MNOK 12,6 Solid assistance margins during the quarter Higher
Q U A R T E R L Y R E P O R T 2018 FIRST QUARTER
 Q U A R T E R L Y R E P O R T 2018 FIRST QUARTER Contents Highlights 3 Group summary 5 Business areas 6 Other matters 7 Outlook 7 Financial statements 8 Notes to the financial statements 13 Definitions
Q Presentation. Oslo May 16 th 2018 Hallvard Muri, CEO Simon Nyquist Martinsen, CFO
 Q1 218 Presentation Oslo May 16 th 218 Hallvard Muri, CEO Simon Nyquist Martinsen, CFO Agenda Highlights Financial performance Outlook Q&A Highlights Q1 218 by CEO Hallvard Muri Continued growth in order
Handelsbanken January June July 2013
 Handelsbanken January June 2013 17 July 2013 Q307 Q407 Q108 Q208 Q308 Q408 Q109 Q209 Q309 Q409 Q110 Q210 Q310 Q410 Q111 Q211 Q311 Q411 Q112 Q212 Q312 Q412 Q113 Q213 Handelsbanken Group Average annual growth
Cash flow from operations in the quarter of NOK 51.5 million
 Revenues of NOK 436.2 million, an increase of 5.1 %. EBITDA of NOK 46.1 million down from NOK 62.5 million. One-off costs for recruitment and severance of NOK 3.7 million taken in the quarter. EBITDA margin
FOURTH QUARTER RESULTS FROM HI BIDCO AS (HEREINAFTER REFERRED TO AS "MELIN GROUP")
") Q4 2017 FOURTH QUARTER RESULTS FROM HI BIDCO AS (HEREINAFTER REFERRED TO AS "MELIN GROUP") HI BIDCO AS FORETAKSREGISTERET NO 919 505 214 GRANDAVEGEN 26, 6823 SANDANE, NORWAY MELINGROUP.NO +47 21 62 73
Q4 2017 FOURTH QUARTER RESULTS FROM HI BIDCO AS (HEREINAFTER REFERRED TO AS "MELIN GROUP") HI BIDCO AS FORETAKSREGISTERET NO 919 505 214 GRANDAVEGEN 26, 6823 SANDANE, NORWAY MELINGROUP.NO +47 21 62 73
EVRY ASA Q PRESENTATION CEO BJÖRN IVROTH CFO HENRIK SCHIBLER
 1 EVRY ASA Q3 2018 PRESENTATION CEO BJÖRN IVROTH CFO HENRIK SCHIBLER Agenda Group highlights Business update Financial highlights Business area performance Concluding remarks Q&A 2 Group highlights Q3
AFFECTO PLC INTERIM REPORT 4 AUGUST 2009 at 9.30 MEUR 4-6/09 4-6/08 1-6/09 1-6/
 1 INTERIM REPORT 1-6/2009 AFFECTO PLC INTERIM REPORT 4 AUGUST 2009 at 9.30 AFFECTO PLC'S INTERIM REPORT 1-6/2009 GROUP KEY FIGURES MEUR 4-6/09 4-6/08 1-6/09 1-6/08 2008 Net sales 26.2 36.2 53.7 69.8 131.6
Year-end report January - December January 24, 2017 Mattias Ankarberg and Pernilla Walfridsson
 Year-end report January - January 24, 2017 Mattias Ankarberg and Pernilla Walfridsson Summary Q4 2016 Net sales increased +16.2 percent, compared with pro forma unchanged (0.0%). Net sales for comparable
Report Q Snow clearing in Geiranger. quarterly report Q Revenue NOK 5 billion Profit before tax NOK -42 million
 Report Q1 2015 1 Snow clearing in Geiranger quarterly report Q1 2015 Revenue NOK 5 billion Profit before tax NOK -42 million Report Q1 2015 2 The first quarter got the year off to a good start for Veidekke.
RECORD SALES, EBITA AND CASH FLOW ACCELERATED ORGANIC GROWTH TO 19 %
 RECORD SALES, EBITA AND CASH FLOW ACCELERATED ORGANIC GROWTH TO 19 % Bygghemma Group First AB (publ) 1 Today s presenters Mikael Olander President and CEO Martin Edblad CFO Bygghemma Group since 2012 CEO
Interim Report January March 2003
 Interim Report January March 2003 23 April 2003 January-March Jan.-Dec. April-March Key figures 2003 2002 2002 2002/03 Net sales, SEK m 2,346 2,404 9,594 9,536 Operating income before depreciation, SEK
SOLON EIENDOM ASA Q Andreas Martinussen, CEO Scott Danielsen, CFO 9 November 2017
 SOLON EIENDOM ASA Q3 2017 Andreas Martinussen, CEO Scott Danielsen, CFO 9 November 2017 Agenda Highlights Operational update Financial update Market Summary Highlights Q3 Real estate segment revenue increased
Good market activity continues
 Good market activity continues First quarter 2017 HIGHLIGHTS Good market activity across all regions High quoting activity in the Land Based segment Strong growth in order intake and revenue (+34% / +30%)
Viking Redningstjeneste Topco AS. Interim financial statements 1Q 2018
 Viking Redningstjeneste Topco AS Interim financial statements 1Q 2018 Quarterly report January - March 2018 Viking Redningstjeneste Topco AS Org no. 998 858 690 First quarter 2018 Quarterly report FIRST
Q presentation. 15 July 2015
 Q2 2015 presentation 15 July 2015 Q2 Highlights Revenue of NOK 6 842 million, up 14.4% EBITDA* of NOK 157 million, down 11.2% Large variance in performance across countries, with strong results in Sweden,
INCREASED FOCUS ON COSTS
 The leading hotel company in the Nordics January March 2018 INCREASED FOCUS ON COSTS FIRST QUARTER IN SUMMARY Net sales rose by 22.5 percent to 3,791 MSEK (3,095), driven by more rooms in operation and
Conference Call Half Year Closing Zurich, 22 August 2013
 Conference Call Half Year Closing 2013 Zurich, 22 August 2013 Disclaimer This communication contains statements that constitute forward-looking statements. In this communication, such forward-looking statements
Report second quarter 2015, Veidekke ASA 1. Photo/collage: Knut Opeide and David Fursenberg. E39 Svegatjørn - Rådal
 Report second quarter 2015, Veidekke ASA 1 Photo/collage: Knut Opeide and David Fursenberg E39 Svegatjørn - Rådal 2nd quarter 2015 Report second quarter 2015, Veidekke ASA 2 Arne Giske President and CEO
Q1 results Peter Nilsson, CEO Cathrin Nylander, CFO
 Q1 results 2018 Peter Nilsson, CEO Cathrin Nylander, CFO 20 April, 2018 Financial highlights Q1: Solid growth and improved profitability Strong revenue growth Underlying growth 8.9% EBIT margin 6.0% (5.3%)
Fourth-Quarter and Preliminary Results 2014
 Fourth-Quarter and Preliminary Results 2014 Frank O. Reite and Leif Borge Oslo 10 February 2015 2015 Akastor Agenda Introduction Frank O. Reite CEO Financials Leif Borge CFO Q&A Q&A Session Frank O. Reite
Strong online sales and improved margins
 FIRST QUARTER SEPTEMBER 1, 2016 NOVEMBER 30, 2016 Strong online sales and improved margins Interim Report September November 2016 First quarter Net sales for the quarter increased 7.5 per cent to SEK 2,284
Report third quarter 2016, Veidekke ASA. Horten upper secondary school
 Report third quarter 2016, Veidekke ASA 1 Horten upper secondary school 3rd quarter 2016 Report third quarter 2016, Veidekke ASA 2 Arne Giske President and CEO We are pleased to see that the positive trend
Q PRESENTATION 7 FEBRUARY 2018
 Q4 2017 PRESENTATION 7 FEBRUARY 2018 Highlights Q4 2017 Record high revenue, operating profit, and cash flow from operations REVENUE of NOK 10.0 billion (up 10.1%) Change in currency rates positively impacts
Interim Report January - March 2015
 Interim Report January - March 2015 The period January - March 2015* Net sales increased by 23% in the period to SEK 1,848 (1,508) m. Adjusted EBITA improved by SEK 19 m, and amounted to SEK 100 (81) m.
Second-Quarter Results 2014
 2Q Second-Quarter Results 214 Fornebu, July 17, 214 Øyvind Eriksen and Leif Borge 214 Aker Solutions Slide 1 July 17, 214 Second-quarter results 214 Agenda 2Q 214 Introduction Øyvind Eriksen Chairman Financials
Oslo, June NSB Group Interim report April 2017
 Oslo, June 15 2017 NSB Group Interim report April 2017 A new NSB Group Passenger train Bus Freight Travel Annual revenue: 7 880 mill. NOK 3 246 man years Annual revenue: 5 850 mill. NOK 5 229 man years
First quarter results
 Q1 2017 First quarter results Highlights of the first quarter 2017 Operating revenues of NOK 456 million (NOK 624 million) Adjusted EBITDA* of NOK 94 million (NOK 91 million) and ordinary EBITDA of NOK
FULL-YEAR RESULTS 2017
 FULL-YEAR RESULTS 2017 INVESTOR PRESENTATION RESULTS FROM JANUARY TO DECEMBER 2017 BASEL 07 MARCH 2018 Achievements and key figures Operating and financial review IFRS changes 2018 Financial guidance 2018
OSRAM with a solid start into FY18
 www.osram.com OSRAM with a solid start into FY18 Q1 FY18 Earnings Release (unaudited figures) February 7, 2018 Light is OSRAM Disclaimer This presentation may contain forward-looking statements that are
REPORT FIRST QUARTER 2018 VEIDEKKE ASA 1. First quarter Illustration: Schmidt, Hammer Lassen, DK. VIA (House of Oslo), Oslo
, Oslo") REPORT FIRST QUARTER 2018 VEIDEKKE ASA 1 First quarter 2018 Illustration: Schmidt, Hammer Lassen, DK VIA (House of Oslo), Oslo 2 REPORT FIRST QUARTER 2018 VEIDEKKE ASA HIGHLIGHTS OF THE FIRST QUARTER OF
REPORT FIRST QUARTER 2018 VEIDEKKE ASA 1 First quarter 2018 Illustration: Schmidt, Hammer Lassen, DK VIA (House of Oslo), Oslo 2 REPORT FIRST QUARTER 2018 VEIDEKKE ASA HIGHLIGHTS OF THE FIRST QUARTER OF
Q Axactor AB. November 1, 2017
 Q3 2017 Axactor AB November 1, 2017 Key highlights Q3 REVENUE 23.6 EUR MILLION ERC 526 EUR MILLION EBITDA 2.0 EUR MILLION CASH EBITDA 6.2 EUR MILLION CASH BALANCE 54.7 EUR MILLION +113% y/y +108% y/y 10%
Prospectus. Supplement to
 Prospectus BW Offshore Limited Supplement to Registration Document Dated 26 September 2012 Bermuda, 22 April 2013 Joint Lead Managers: Page 1 of 7 Words with capital initial letter are defined under Definitions
Interim Report Q3 2013
 Interim Report Q3 Q3 A CHALLENGING QUARTER ADDNODE GROUP CAN DO BETTER Net sales totaled SEK 301.4 (291.3) M, up 3 percent. EBITA amounted to SEK 14.4 (27.1) M, and EBITA-margin of 4.8 (9.3) percent. 1)
4Q16. Fornebu, February 9, 2017 Luis Araujo and Svein Stoknes Aker Solutions
 4Q16 Fornebu, February 9, 2017 Luis Araujo and Svein Stoknes Agenda Introduction Luis Araujo Chief Executive Officer Q&A Session Luis Araujo Svein Stoknes Financials Svein Stoknes Chief Financial Officer
Report Q February 13, 2018
 Report Q4 2017 February 13, 2018 Highlights Fourth Quarter of 2017 Gross collection for the quarter of EUR 34.5 million. EBITDA of EUR 5.6 million and Cash EBITDA at a record high EUR 13.5 million for
Year-end report Jan-Dec February, 2018
 1 Year-end report Jan-Dec 2017 1 February, 2018 Executive summary on development We follow our strategic plan Good sales growth continues Supply chain back on track Efficiency improvements according to
SEB Enskilda Nordic Seminar 2010 Thursday, 7 January Long Term Performer High Performance Potential
 SEB Enskilda Nordic Seminar 2010 Thursday, 7 January 2010 Long Term Performer High Performance Potential Veidekke - A Scandinavian Contractor and Property Developer Contents About Veidekke Our Performance
THIRD QUARTER REPORT 2018 Q3
 THIRD QUARTER REPORT 218 Q3 Defence/Aerospace Energy/Telecoms Industry Medical devices Offshore/Marine Norway Sweden Lithuania Germany USA China Report third quarter 218 Strong order growth, including
Concluding. remarks 15:30 12:45. Business Area. Priorities. Lunch. Berghult 12:00. Strategic Update
 Concluding remarks 15:30 12:45 Business Area Priorities Berghult Lunch 12:00 Strategic Update 1 Trelleborg Group financial update Financial overview CGS synergies Financial targets 2 Trelleborg Group financial