BLS Spotlight on Statistics: International Labor Comparisons
|
|
|
- Darleen Paul
- 6 years ago
- Views:
Transcription
1 Cornell University ILR School Federal Publications Key Workplace Documents BLS : International Labor Comparisons Bureau of Labor Statistics Follow this and additional works at: Thank you for downloading an article from DigitalCommons@ILR. Support this valuable resource today! This Article is brought to you for free and open access by the Key Workplace Documents at DigitalCommons@ILR. It has been accepted for inclusion in Federal Publications by an authorized administrator of DigitalCommons@ILR. For more information, please contact hlmdigital@cornell.edu.
2 BLS : International Labor Comparisons Abstract [Excerpt] With international trade at an all-time high, global markets are the new normal for U.S. companies and residents. In 2012, total volume of trade (imports and exports) in the United States was nearly $5 trillion the largest in the world. U.S. international competitiveness can be assessed by comparing key economic measures across countries. These measures include gross domestic product, unemployment rates, compensation costs, labor productivity rates, and consumer prices. In this, we compare these and other measures across countries in the Americas, Europe, and Asia and the South Pacific to get a glimpse of how individual economies have performed in recent years and historically. Comments Suggested Citation U.S. Department of Labor, Bureau of Labor Statistics. (2013). BLS spotlight on statistics: International labor comparisons. Washington, D.C.: Author. This article is available at DigitalCommons@ILR:
 in the United States was nearly $5 trillion the largest in the world. U.S. international competitiveness can be assessed by comparing key economic measures across countries.")
3 MAY 2013 International Labor Comparisons With international trade at an all-time high, global markets are the new normal for U.S. companies and residents. In 2012, total volume of trade (imports and exports) in the United States was nearly $5 trillion the largest in the world. U.S. international competitiveness can be assessed by comparing key economic measures across countries. These measures include gross domestic product, unemployment rates, compensation costs, labor productivity rates, and consumer prices. In this, we compare these and other measures across countries in the Americas, Europe, and Asia and the South Pacific to get a glimpse of how individual economies have performed in recent years and historically. Page 1
4 Real gross domestic product per capita and per hour, in U.S. dollars Gross domestic product (GDP) per hour is a general indicator of productivity while GDP per capita is an indicator of overall wealth in a country. Increases in productivity signal a potential for increases in a country's standard of living. Generally since 1970, overall productivity and wealth have tended to grow together for all countries shown. Countries which gravitate toward the lower right of the chart have lower productivity (GDP per hour) relative to their wealth (GDP per capita) than countries which gravitate to the upper left. Singapore and the United States, for example, have had consistently high wealth, relative to productivity. In contrast, productivity has been relatively higher than wealth in countries such as France and Germany. Page 2
5 Unemployment rates, Although unemployment rates in the countries compared generally remained higher in 2011 than they were in 2008, most countries experienced some recovery in unemployment in 2011: Unemployment rates fell or stayed the same from 2010 to 2011 in all countries compared except Spain and the United Kingdom. Historically, compared with unemployment rates in the 1990s, rates in 2011 were typically lower in a majority of countries. The United States is a notable exception, where unemployment rates in 2011 were about double the rates in the late 1990s. Page 3

6 Employment-population ratios by sector, The percentage of the working age population employed has remained between 50 and 65 percent in most countries covered over the past 40 years, but the share of the working age population employed in each sector has shifted over time. The share of the working age population employed in agriculture dropped by more than half in all countries covered except the Netherlands, and the share of the working age population employed in industry (manufacturing, mining, and construction) fell in all countries covered except the Republic of Korea. In contrast, the share of the working age population employed in services increased in all countries covered, and by 2011, the share was nearly at or above 40 percent in all countries except Italy. Page 4
7 Labor force size and participation rates by sex, 2011 Labor force participation rates provide information about what percentage of the working age population is employed or actively seeking work. Labor force participation rates are higher for men than women in all countries compared, but relatively fewer women are working or actively seeking work in Turkey (27 percent) and Mexico (41 percent). On the other end of the spectrum, men and women are much more evenly engaged in the labor force in Canada, New Zealand, and the United States, which have among the highest overall rates of labor force participation. Page 5

8 Labor force participation rates by sex, Men continue to have higher rates of labor force participation than women, but the gap between the two has been narrowing over the past 40 years in all countries compared. In most countries, this is due to a combination of a decreasing rate of participation for men and an increasing rate for women. In 2011, the gap between the sexes was narrowest in Sweden, Canada, and France, and was largest in Turkey, Mexico, and the Republic of Korea. Page 6
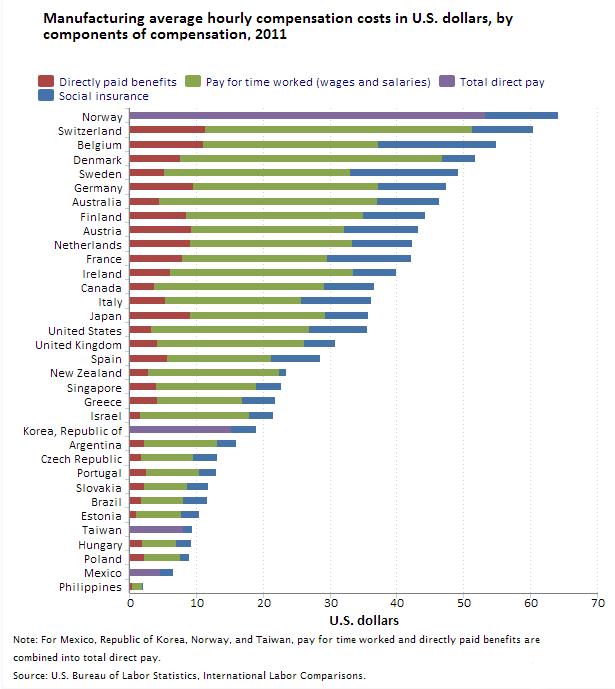
9 Manufacturing average hourly compensation costs in U.S. dollars, by components of compensation, 2011 Hourly compensation costs measure the average hourly cost to employ a worker, including benefits. Compared to the United States, countries with higher average hourly compensation costs were primarily in northern and western Europe. Countries with lower average hourly compensation costs were primarily in southern and eastern Europe, Asia, and Latin America. Expanding the chart to show components of compensation as a percentage of total compensation reveals that the proportion of directly paid benefits (mostly leave time and bonuses) was lower in the United States than in all countries compared except Israel, while the proportion of social insurance costs tended to be higher than the U.S. level in Europe and Latin America. Page 7
10 Page 8
11 Average hourly compensation costs in sub-manufacturing industries, U.S. dollars, 2011 Average hourly compensation costs in manufacturing can vary widely by industry. In the United States, average costs in the highest cost industry (other transport equipment) are nearly 2.5 times those of the lowest cost industry (wearing apparel). Selecting other countries shows that, in general, the same industries (for example, petroleum and pharmaceuticals) tend to rank among the highest compensated industries across countries, while the same is true for the lowest compensated industries (apparel, textiles, leather, and wood). Page 9
12 Page 10
13 Average annual percent change in manufacturing productivity, output, and hours worked, Increases in labor productivity are approximately equal to the difference between the growth of output and the growth of hours worked; the larger the gap between output and hours, the greater the productivity growth. Since 2000, output has outpaced hours in all countries compared, resulting in increasing productivity. The largest productivity gains were in the Czech Republic, Taiwan, and the Republic of Korea, and were primarily the result of strong output growth (while hours dipped slightly); productivity also increased in the United Kingdom, Spain, and Denmark despite declining output because hours worked declined even more. Page 11

14 Annual percent change in manufacturing productivity, output, and hours worked, In 2011, output growth was the main driver of productivity in many countries, although robust productivity growth in both Spain and the United Kingdom resulted from approximately equal portions of output growth and hours decline. The four countries with red bars at the right of the chart experienced declines in productivity when output was outpaced by hours; Australia, where output fell about 2 percent despite a 2 percent increase in hours, saw the biggest drop in productivity. Page 12
15 Gap between productivity and real hourly compensation in manufacturing, Since 1970, labor productivity has outpaced real hourly compensation in the United States, creating a productivitycompensation gap. Increases in productivity signal a potential for increases in labor income, and by extension, for increases in the standard of living of workers. Although the U.S. gap is the largest among the countries compared, selecting other countries shows the existence of a productivity-compensation gap in all countries except Norway. Page 13

16 Measures of consumer price inflation, average annual percent changes, Consumer price indexes (CPI) and harmonized indexes of consumer prices (HICP) are two measures of consumer price changes. The HICP, however, are adjusted for comparability across countries, whereas the CPI are not adjusted. Over the past 4 years, inflation averaged between 1.5 and 2.5 percent in all but four countries compared. Prices increased at a faster rate in the United Kingdom and Belgium, while Japan was the only country where prices declined since Page 14
17 More For more information visit International Labor Comparisons at the BLS website. Page 15
A Chartbook of International Labor Comparisons
 Cornell University ILR School DigitalCommons@ILR Federal Publications Key Workplace Documents 3-2009 A Chartbook of International Labor Comparisons U.S. Department of Labor Follow this and additional works
Chartbook of International Labor Comparisons: The Americas, Asia/Pacific, Europe
 Cornell University ILR School DigitalCommons@ILR Federal Publications Key Workplace Documents January 28 Chartbook of International Labor Comparisons: The Americas, Asia/Pacific, Europe U.S. Department
Around the World in Eight Charts March 2008
 Around the World in Eight Charts March 2008 Jules Verne isn't the only one who can take you on a worldwide adventure. Travel the globe in eight charts with the Bureau of Labor Statistics! Although BLS
A Chartbook of International Labor Comparisons: The Americas, Asia-Pacific, Europe (June 2007)
") Cornell University ILR School DigitalCommons@ILR Federal Publications Key Workplace Documents June 27 A Chartbook of International Labor Comparisons: The Americas, Asia-Pacific, Europe (June 27) United
Cornell University ILR School DigitalCommons@ILR Federal Publications Key Workplace Documents June 27 A Chartbook of International Labor Comparisons: The Americas, Asia-Pacific, Europe (June 27) United
Financial wealth of private households worldwide
 Economic Research Financial wealth of private households worldwide Munich, October 217 Recovery in turbulent times Assets and liabilities of private households worldwide in EUR trillion and annualrate
A Chartbook of International Labor Comparisons: The Americas, Asia, Europe, January 2007
 Cornell University ILR School DigitalCommons@ILR Federal Publications Key Workplace Documents January 2007 A Chartbook of International Labor Comparisons: The Americas, Asia, Europe, January 2007 U.S.
Chart 1. Percent change in manufacturing output per hour,
 For release 10:00 a.m. (EDT) Thursday, October 22, 2009 Technical Information: (202) 691-5654 ilchelp@bls.gov www.bls.gov/ilc Media Contact: (202) 691-5902 PressOffice@bls.gov USDL-09-1271 INTERNATIONAL
Sources of Government Revenue in the OECD, 2016
 FISCAL FACT No. 517 July, 2016 Sources of Government Revenue in the OECD, 2016 By Kyle Pomerleau Director of Federal Projects Kevin Adams Research Assistant Key Findings OECD countries rely heavily on
Foreign Direct Investment in the United States: An Economic Analysis
 Cornell University ILR School DigitalCommons@ILR Federal Publications Key Workplace Documents 12-11-2013 Foreign Direct Investment in the United States: An Economic Analysis James K. Jackson Congressional
High-Income Household Spending And The Economic Recovery
 Cornell University ILR School DigitalCommons@ILR Federal Publications Key Workplace Documents 4-2014 High-Income Household Spending And The Economic Recovery Aaron E. Cobet Bureau of Labor Statistics Follow
Statistical annex. Sources and definitions
 Statistical annex Sources and definitions Most of the statistics shown in these tables can be found as well in several other (paper or electronic) publications or references, as follows: the annual edition
Sources of Government Revenue in the OECD, 2014
 FISCAL FACT Nov. 2014 No. 443 Sources of Government Revenue in the OECD, 2014 By Kyle Pomerleau Economist Key Findings OECD countries rely heavily on consumption taxes, such as the value added tax, and
Sources of Government Revenue in the OECD, 2018
 FISCAL FACT No. 581 Mar. 2018 Sources of Government Revenue in the OECD, 2018 Amir El-Sibaie Analyst Key Findings In 2015, OECD countries relied heavily on consumption taxes, such as the value-added tax,
Sources of Government Revenue in the OECD, 2017
 FISCAL FACT No. 558 Aug. 2017 Sources of Government Revenue in the OECD, 2017 Amir El-Sibaie Analyst Key Findings: OECD countries rely heavily on consumption taxes, such as the value-added tax, and social
Results Fall Atradius Payment Practices Barometer. International survey of B2B payment behaviour Core results overall survey
 Results Fall 2011 Atradius Payment Practices Barometer International survey of B2B payment Core results overall survey 2 Copyright by Atradius N.V. October 2011 Published by Atradius Corporate Communications
Indicator B3 How much public and private investment in education is there?
 Education at a Glance 2014 OECD indicators 2014 Education at a Glance 2014: OECD Indicators For more information on Education at a Glance 2014 and to access the full set of Indicators, visit www.oecd.org/edu/eag.htm.
Sources of Government Revenue across the OECD, 2015
 FISCAL FACT Apr. 2015 No. 465 Sources of Government Revenue across the OECD, 2015 By Kyle Pomerleau Economist Key Findings OECD countries rely heavily on consumption taxes, such as the value added tax,
TAX POLICY CENTER BRIEFING BOOK. Background. Q. What are the sources of revenue for the federal government?
 What are the sources of revenue for the federal government? FEDERAL BUDGET 1/4 Q. What are the sources of revenue for the federal government? A. About 48 percent of federal revenue comes from individual
Switzerland and Germany top the PwC Young Workers Index in developing younger people
 Press release Date 9 November 2015 Contact Mihnea Anastasiu Pages 5 Media Relations Manager Tel: +40 21 225 3546 Email: mihnea.anastasiu@ro.pwc.com Switzerland and Germany top the PwC Young Workers Index
BLS Spotlight on Statistics: Self-Employment in the United States
 Cornell University ILR School DigitalCommons@ILR Federal Publications Key Workplace Documents 3-2016 BLS : Self-Employment in the United States Steven F. Hipple Bureau of Labor Statistics Laurel A. Hammond
Foreign Direct Investment in the United States. Organization for International Investment
 Foreign Direct Investment in the United States Organization for International Investment March 16, 2011 FOREIGN DIRECT INVESTMENT IN THE UNITED STATES Key Findings Foreign Direct Investment in the United
Trends in Retirement and in Working at Older Ages
 Pensions at a Glance 211 Retirement-income Systems in OECD and G2 Countries OECD 211 I PART I Chapter 2 Trends in Retirement and in Working at Older Ages This chapter examines labour-market behaviour of
GLOBAL INEQUALITY AND AUSTRALIA S ROLE
 GLOBAL INEQUALITY AND AUSTRALIA S ROLE PRESENTATION TO A RECEPTION HOSTED BY OXFAM AUSTRALIA GOVERNMENT HOUSE, HOBART, TASMANIA 29 TH MAY 217 The good news: global poverty has fallen by almost 6% over
ManpowerGroup Employment Outlook Survey Finland
 ManpowerGroup Employment Outlook Survey Finland 4 217 The ManpowerGroup Employment Outlook Survey for the fourth quarter 217 was conducted by interviewing a representative sample of 625 employers in Finland.
OECD Report Shows Tax Burdens Falling in Many OECD Countries
 OECD Centres Germany Berlin (49-30) 288 8353 Japan Tokyo (81-3) 5532-0021 Mexico Mexico (52-55) 5281 3810 United States Washington (1-202) 785 6323 AUSTRALIA AUSTRIA BELGIUM CANADA CZECH REPUBLIC DENMARK
Budget repair and the size of Australia s government. Melbourne Economic Forum John Daley, Grattan Institute December 2015
 Budget repair and the size of Australia s government Melbourne Economic Forum John Daley, Grattan Institute December 2015 Budget repair and the size of Australia s government Attitudes to the best approach
Global Construction 2030 Expo EDIFICA 2017 Santiago Chile. 4-6 October 2017
 Global Construction 2030 Expo EDIFICA 2017 Santiago Chile 4-6 October 2017 Graham Robinson Global Construction Perspectives Global Construction 2030 is the fourth in a series of global studies of the construction
Ways to increase employment
 Ways to increase employment Iceland Luxembourg Spain Canada Italy Norway Denmark Germany Portugal Ireland Japan Belgium Switzerland Austria Slovenia United States New Zealand Finland France Netherlands
Corrigendum. OECD Pensions Outlook 2012 DOI: ISBN (print) ISBN (PDF) OECD 2012
 ISBN (PDF) OECD 2012") OECD Pensions Outlook 2012 DOI: http://dx.doi.org/9789264169401-en ISBN 978-92-64-16939-5 (print) ISBN 978-92-64-16940-1 (PDF) OECD 2012 Corrigendum Page 21: Figure 1.1. Average annual real net investment
OECD Pensions Outlook 2012 DOI: http://dx.doi.org/9789264169401-en ISBN 978-92-64-16939-5 (print) ISBN 978-92-64-16940-1 (PDF) OECD 2012 Corrigendum Page 21: Figure 1.1. Average annual real net investment
International Statistical Release
 International Statistical Release This release and additional tables of international statistics are available on efama s website (www.efama.org). Worldwide Investment Fund Assets and Flows Trends in the
Restaurants Help Feed Job Growth: How the Leisure and Hospitality Industry Fared After the Recent Employment Downturn
 Cornell University ILR School DigitalCommons@ILR Federal Publications Key Workplace Documents 7-2014 Restaurants Help Feed Job Growth: How the Leisure and Hospitality Industry Fared After the Recent Employment
UK trade in goods statistics by business characteristics 2015
 Coverage: United Kingdom Theme: Business and Energy Released: 24 November 2016 UK trade in goods statistics by business characteristics 2015 Experimental Official Statistics Media contact: HMRC Press Office
WikiLeaks Document Release
 WikiLeaks Document Release February 2, 2009 Congressional Research Service Report RL34073 Productivity and National Standards of Living Brian W. Cashell, Government and Finance Division July 5, 2007 Abstract.
Statistical Annex ANNEX
 ISBN 92-64-02384-4 OECD Employment Outlook Boosting Jobs and Incomes OECD 2006 ANNEX Statistical Annex Sources and definitions Most of the statistics shown in these tables can be found as well in three
BETTER POLICIES FOR A SUCCESSFUL TRANSITION TO A LOW-CARBON ECONOMY
 BETTER POLICIES FOR A SUCCESSFUL TRANSITION TO A LOW-CARBON ECONOMY Rintaro Tamaki Deputy Secretary-General, OECD International Forum for Sustainable Asia and the Pacific (ISAP)1 Yokohama, July 1 Four
Income, pensions, spending and wealth
 CHAPTER 18 Income, pensions, spending and wealth After four years of growth, the median after-tax income for Canadian families of two or more people remained virtually stable in 2008 at $63,900. The level
Manpower Employment Outlook Survey Global
 Manpower Employment Outlook Survey Global 3 216 Global Employment Outlook ManpowerGroup interviewed nearly 59, employers across 43 countries and territories to forecast labor market activity in Quarter
ICT, knowledge and the economy 2012 Statistical annex
 ICT, knowledge and the economy 2012 Statistical annex This annex includes some tables with supplementary figures to the publication ICT, knowledge and the economy 2012. The tables are arranged by chapter.
OECD HEALTH SYSTEM CHARACTERISTICS SURVEY 2012
 OECD HEALTH SYSTEM CHARACTERISTICS SURVEY 2012 Emily Hewlett OECD Health Data National Correspondents and Health Accounts Experts Meeting, 17 th October 2013 Health System Characteristics Survey 2012 HSC
Global Consumer Confidence
 Global Consumer Confidence The Conference Board Global Consumer Confidence Survey is conducted in collaboration with Nielsen 4TH QUARTER 2017 RESULTS CONTENTS Global Highlights Asia-Pacific Africa and
A Comparison of the Tax Burden on Labor in the OECD, 2017
 FISCAL FACT No. 557 Aug. 2017 A Comparison of the Tax Burden on Labor in the OECD, 2017 Jose Trejos Research Assistant Kyle Pomerleau Economist, Director of Federal Projects Key Findings: Average wage
International comparison of poverty amongst the elderly
 International comparison of poverty amongst the elderly RPRC PensionBriefing 2009-1 ------------------------------------------------------------------------------------------------------- This PensionBriefing
Linking Education for Eurostat- OECD Countries to Other ICP Regions
 International Comparison Program [05.01] Linking Education for Eurostat- OECD Countries to Other ICP Regions Francette Koechlin and Paulus Konijn 8 th Technical Advisory Group Meeting May 20-21, 2013 Washington
10% 10% 15% 15% Caseload: WE. 15% Caseload: SS 10% 10% 15%
 Percentchangeincaseload 15% 10% 5% 0% 5% 10% 15% Caseload: AO 0 1 2 3 4 5 Percentchangein caseload 15% 10% 5% 0% 5% 10% 15% Caseload: NC 0 1 2 3 4 5 Years Years Percentchangein caseload 15% 10% 5% 0% 5%
Foreign Direct Investment in the United States 2013 Preliminary Data. Organization for International Investment (OFII)
") Foreign Direct Investment in the United States 2013 Preliminary Data Organization for International Investment (OFII) Key Findings: Foreign Direct Investment in the United States, 2003-2013 1 Foreign direct
Foreign Direct Investment in the United States 2013 Preliminary Data Organization for International Investment (OFII) Key Findings: Foreign Direct Investment in the United States, 2003-2013 1 Foreign direct
Burden of Taxation: International Comparisons
 Burden of Taxation: International Comparisons Standard Note: SN/EP/3235 Last updated: 15 October 2008 Author: Bryn Morgan Economic Policy & Statistics Section This note presents data comparing the national
Consumer credit market in Europe 2013 overview
 Consumer credit market in Europe 2013 overview Crédit Agricole Consumer Finance published its annual survey of the consumer credit market in 28 European Union countries for seven years running. 9 July
Statistics Brief. Investment in Inland Transport Infrastructure at Record Low. Infrastructure Investment. July
 Statistics Brief Infrastructure Investment July 2015 Investment in Inland Transport Infrastructure at Record Low The latest update of annual transport infrastructure investment and maintenance data collected
Executive Summary. The Transatlantic Economy Annual Survey of Jobs, Trade and Investment between the United States and Europe
 The Transatlantic Economy 2011 Annual Survey of Jobs, Trade and Investment between the United States and Europe Daniel S. Hamilton Daniel S. Hamilton and Joseph P. Quinlan and Joseph P. Quinlan Center
PENSIONS IN OECD COUNTRIES: INDICATORS AND DEVELOPMENTS
 PENSIONS IN OECD COUNTRIES: INDICATORS AND DEVELOPMENTS Marius Lüske Directorate for Employment, Labour and Social Affairs, OECD Lisbon, 28.09.2018 Marius.LUSKE@oecd.org www.oecd.org/els OUTLINE Talk based
Swiss Global Finance. Facts and Figures
 Swiss Global Finance Facts and Figures Latin America Bilateral Economic Relations Switzerland s Main Trading Partners in Latin America Share of Total Goods Exports (in % of total Swiss exports to Latin
VEDP QUARTERLY ECONOMIC UPDATE
 VEDP QUARTERLY ECONOMIC UPDATE September 2016 VIRGINIA ECONOMIC DEVELOPMENT PARTNERSHIP YESVIRGINIA.ORG 1 US ECONOMIC OUTLOOK 1 8% - Source: Consensus Forecasts, September 2016 2 US WEEKLY INDICATORS 5%
Israel through the Global Crisis: Do Innovations Help?
 Israel through the Global Crisis: Do Innovations Help? Prof. Zvi Eckstein Dean, School of Economics, IDC Herzliya 24 March 2014 1 Outline The Macro Picture Innovations and Start Ups 2 Growth Rates - Israel,
Actuarial Supply & Demand. By i.e. muhanna. i.e. muhanna Page 1 of
 By i.e. muhanna i.e. muhanna Page 1 of 8 040506 Additional Perspectives Measuring actuarial supply and demand in terms of GDP is indeed a valid basis for setting the actuarial density of a country and
A Profile of the Working Poor, 2001
 Cornell University ILR School DigitalCommons@ILR Federal Publications Key Workplace Documents 6-2003 A Profile of the Working Poor, 2001 Abraham Mosisa Bureau of Labor Statistics Follow this and additional
Women in the Labor Force: A Databook
 Cornell University ILR School DigitalCommons@ILR Federal Publications Key Workplace Documents 12-2011 Women in the Labor Force: A Databook Bureau of Labor Statistics Follow this and additional works at:
American healthcare: How do we measure up?
 American healthcare: How do we measure up? December 2009 September 2009 Lauren Damme Economic Growth Program Next Social Contract Initiative The U.S. is one of the only industrialized nations in the world
Development Updates and Trends : Opportunities and Risks Local Details Operating for a Global Strategy
 Development s and Trends : Opportunities and Risks Local Details Operating for a Global Strategy Claro dg. Cordero, Jr. Head Research, Consulting & Valuation Services 19 October 2012 1 Discussion agenda
INSOLVENCIES February 2018
 Photo by Jose Fontano on Unsplash Economic Research INSOLVENCIES February 201 FEWER CASES, BIGGER CRASHES Insolvencies Decline, Major Failures Rise 04 Global Forecast: Less Cases, Regional Disparities
Quarterly Investment Update First Quarter 2018
 Quarterly Investment Update First Quarter 2018 Dimensional Fund Advisors Canada ULC ( DFA Canada ) is not affiliated with [insert name of Advisor]. DFA Canada is a separate and distinct company. Market
Women in the Labor Force: A Databook
 Cornell University ILR School DigitalCommons@ILR Federal Publications Key Workplace Documents 2-2013 Women in the Labor Force: A Databook Bureau of Labor Statistics Follow this and additional works at:
Quarterly Investment Update First Quarter 2017
 Quarterly Investment Update First Quarter 2017 Market Update: A Quarter in Review March 31, 2017 CANADIAN STOCKS INTERNATIONAL STOCKS Large Cap Small Cap Growth Value Large Cap Small Cap Growth Value Emerging
Health Care in Crisis
 Health Care in Crisis The Economic Imperative for Health Care Reform James Kvaal and Ben Furnas February 19, 2009 1 Center for American Progress Health Care in Crisis U.S. spends twice as much per capita
The Economics of Public Health Care Reform in Advanced and Emerging Economies
 The Economics of Public Health Care Reform in Advanced and Emerging Economies Benedict Clements Fiscal Affairs Department, IMF November 2012 This presentation represents the views of the author and should
ManpowerGroup Employment Outlook Survey Global
 ManpowerGroup Employment Outlook Survey Global 1 19 ManpowerGroup interviewed over 6, employers across 44 countries and territories to forecast labor market activity* in January-March 19. All participants
International Statistical Release
 International Statistical Release This release and additional tables of international statistics are available on efama s website (www.efama.org) Worldwide Investment Fund Assets and Flows Trends in the
ManpowerGroup Employment Outlook Survey Finland
 ManpowerGroup Employment Outlook Survey Finland 4 18 The ManpowerGroup Employment Outlook Survey for the fourth quarter 18 was conducted by interviewing a representative sample of 625 employers in Finland.
Private pensions. A growing role. Who has a private pension?
 Private pensions A growing role Private pensions play an important and growing role in providing for old age in OECD countries. In 11 of them Australia, Denmark, Hungary, Iceland, Mexico, Norway, Poland,
American healthcare: How do we measure up?
 American healthcare: How do we measure up? December 2009 September 2009 Lauren Damme Economic Growth Program Next Social Contract Initiative The U.S. is one of the only industrialized nations in the world
2018 UX Salary Survey
 2018 UX Salary Survey August 2018 Research Methodology STUDY DESIGN Online survey (15 minutes) SAMPLE SIZE 1,326 UX Professionals Initial respondents were recruited through postings on professional networks
Slovak Competitiveness: Fundamentals, Indicators and Challenges
 Copyright rests with the author Slovak Competitiveness: Fundamentals, Indicators and Challenges Presentation by Mark De Broeck European Department, IMF Seminar Organized by the European Commission November
Report on Finnish Technology Industry Exports
 Report on Finnish Technology Industry Exports Last observation October 2018, 2.1.2019 Goods Export of Technology Industry from Finland Goods Export of Technology Industry from Finland by Branches Source:
C W S S u m m i t. Dambisa Moyo 16 May 2012 London
 2 0 1 2 C W S S u m m i t Dambisa Moyo 16 May 2012 London Table of Contents I Global Labour Market Picture II Six Labour Market Drivers III The Challenges Ahead 2 Global unemployment (millions) Unemployment
Global Research and Development Expenditures: Fact Sheet
 Global Research and Development Expenditures: Fact Sheet John F. Sargent Jr. Specialist in Science and Technology Policy June 16, 2017 Congressional Research Service 7-5700 www.crs.gov R44283 R esearch
Approach to Employment Injury (EI) compensation benefits in the EU and OECD
 compensation benefits in the EU and OECD") Approach to (EI) compensation benefits in the EU and OECD The benefits of protection can be divided in three main groups. The cash benefits include disability pensions, survivor's pensions and other short-
Approach to (EI) compensation benefits in the EU and OECD The benefits of protection can be divided in three main groups. The cash benefits include disability pensions, survivor's pensions and other short-
THE STATE OF THE ECONOMY
 THE STATE OF THE ECONOMY ANGELA GUO Portland State University The United States economy in the fourth quarter of 2013 appears to have a more robust foothold pointing to a healthier outlook for 2014. Much
2017 Global Trends in Investor Relations
 0 2017 Global Trends in Investor Relations Primacy of Geopolitical Risk Geopolitical risk is still the number one concern for companies globally. Concern is increasing regarding the impact of emerging
Statistical Annex. Sources and definitions
 Statistical Annex Sources and definitions Most of the statistics shown in these tables can also be found in two other (paper or electronic) publication and data repository, as follows: The annual edition
Global Select International Select International Select Hedged Emerging Market Select
 International Exchange Traded Fund (ETF) Managed Strategies ETFs provide investors a liquid, transparent, and low-cost avenue to equities around the world. Our research has shown that individual country
Global Business Barometer April 2008
 Global Business Barometer April 2008 The Global Business Barometer is a quarterly business-confidence index, conducted for The Economist by the Economist Intelligence Unit What are your expectations of
A. Definitions and sources of data
 Poland A. Definitions and sources of data Data on foreign direct investment (FDI) in Poland are reported by the National Bank of Poland (NBP), the Polish Agency for Foreign Investment (PAIZ) and the Central
Key-elements nell allocazione delle risorse degli investitori internazionali
 Key-elements nell allocazione delle risorse degli investitori internazionali Alcune evidenze dalla «INREV» Accounting, Control, Finance & Real Estate Department Real Estate a Hot Ticket for Global Diversification
The macroeconomic effects of a carbon tax in the Netherlands Íde Kearney, 13 th September 2018.
 The macroeconomic effects of a carbon tax in the Netherlands Íde Kearney, th September 08. This note reports estimates of the economic impact of introducing a carbon tax of 50 per ton of CO in the Netherlands.
DFA Global Equity Portfolio (Class F) Quarterly Performance Report Q2 2014
 Quarterly Performance Report Q2 2014") DFA Global Equity Portfolio (Class F) Quarterly Performance Report Q2 2014 This presentation has been prepared by Dimensional Fund Advisors Canada ULC ( DFA Canada ), manager of the Dimensional Funds.
DFA Global Equity Portfolio (Class F) Quarterly Performance Report Q2 2014 This presentation has been prepared by Dimensional Fund Advisors Canada ULC ( DFA Canada ), manager of the Dimensional Funds.
australia Statistical Profile introduction to australia australia statistical profile no.14 november 2009
 australia australia australia Statistical Profile Tia Di Biase, Joanne Goodall, Annie Chen and Philip Taylor introduction to australia Australia Papua New Guinea About this Statistical Profile Organizations
The Outlook for the U.S. Economy and the Policies of the New President
 The Outlook for the U.S. Economy and the Policies of the New President Jason Furman Senior Fellow, PIIE SNS/SHOF Finance Panel Stockholm June 12, 2017 Peterson Institute for International Economics 1750
Fiscal Policy in Japan
 Fiscal Policy in Japan - Issues and Future Directions - Introduction 1.Social security benefits have been increasing every year due to the aging population. 2.With these situations, the public finance
WHAT ARE THE FINANCIAL INCENTIVES TO INVEST IN EDUCATION?
 INDICATOR WHAT ARE THE FINANCIAL INCENTIVES TO INVEST IN EDUCATION? Not only does education pay off for individuals ly, but the public sector also from having a large proportion of tertiary-educated individuals
InterTrade Ireland Economic Forum 25 November 2011 The jobs crisis: stylised facts and policy challenges
 InterTrade Ireland Economic Forum 25 November 2011 The jobs crisis: stylised facts and policy challenges John P. Martin Director for Employment, Labour and Social Affairs, OECD The jobs crisis An unprecedented
Trade and Development Board Sixty-first session. Geneva, September 2014
 UNITED NATIONS CONFERENCE ON TRADE AND DEVELOPMENT Trade and Development Board Sixty-first session Geneva, 15 26 September 2014 Item 3: High-level segment Tackling inequality through trade and development:
Queensland Budget
 Advancing Queensland s Economy Growing Innovation $300 billion Economy $53 billion Budget Attracting Investment Creating Jobs More than $40 billion infrastructure over 4 years Building Infrastructure 2
Foreign Direct Investment in the United States. Organization for International Investment
 Foreign Direct Investment in the United States Organization for International Investment March 14, 2012 FOREIGN DIRECT INVESTMENT IN THE UNITED STATES Key Findings Foreign Direct Investment in the United
DFA Global Equity Portfolio (Class F) Performance Report Q2 2017
 Performance Report Q2 2017") DFA Global Equity Portfolio (Class F) Performance Report Q2 2017 This presentation has been prepared by Dimensional Fund Advisors Canada ULC ( DFA Canada ), manager of the Dimensional Funds. This presentation
DFA Global Equity Portfolio (Class F) Performance Report Q2 2017 This presentation has been prepared by Dimensional Fund Advisors Canada ULC ( DFA Canada ), manager of the Dimensional Funds. This presentation
DFA Global Equity Portfolio (Class F) Performance Report Q3 2018
 Performance Report Q3 2018") DFA Global Equity Portfolio (Class F) Performance Report Q3 2018 This presentation has been prepared by Dimensional Fund Advisors Canada ULC ( DFA Canada ), manager of the Dimensional Funds. This presentation
DFA Global Equity Portfolio (Class F) Performance Report Q3 2018 This presentation has been prepared by Dimensional Fund Advisors Canada ULC ( DFA Canada ), manager of the Dimensional Funds. This presentation
DFA Global Equity Portfolio (Class F) Performance Report Q4 2017
 Performance Report Q4 2017") DFA Global Equity Portfolio (Class F) Performance Report Q4 2017 This presentation has been prepared by Dimensional Fund Advisors Canada ULC ( DFA Canada ), manager of the Dimensional Funds. This presentation
DFA Global Equity Portfolio (Class F) Performance Report Q4 2017 This presentation has been prepared by Dimensional Fund Advisors Canada ULC ( DFA Canada ), manager of the Dimensional Funds. This presentation
Low employment among the 50+ population in Hungary
 Low employment among the + population in Hungary The role of incentives, health and cognitive capacities Janos Divenyi (Central European University) and Gabor Kezdi (Central European University and IE-CRSHAS)
DFA Global Equity Portfolio (Class F) Performance Report Q3 2015
 Performance Report Q3 2015") DFA Global Equity Portfolio (Class F) Performance Report Q3 2015 This presentation has been prepared by Dimensional Fund Advisors Canada ULC ( DFA Canada ), manager of the Dimensional Funds. This presentation
DFA Global Equity Portfolio (Class F) Performance Report Q3 2015 This presentation has been prepared by Dimensional Fund Advisors Canada ULC ( DFA Canada ), manager of the Dimensional Funds. This presentation
Revenue Statistics Tax revenue trends in the OECD
 Revenue Statistics 2017 Tax revenue trends in the OECD OECD 2017 The OECD freely authorises the use of this material for non-commercial purposes, provided that suitable acknowledgment of the source and
Australian welfare spending trends: past changes and future drivers Brotherhood of St Laurence lunchtime seminar
 Australian welfare spending trends: past changes and future drivers Brotherhood of St Laurence lunchtime seminar John Daley CEO, Grattan Institute 8 August 213 Overview Stable overall spending conceals
New in 2013: Greater emphasis on capital flows Refinements to EBA methodology Individual country assessments
 As in 212: Stock-take: multilaterally consistent assessment of external sector policies of the largest economies Feeds into Article IVs Draws on External Balance Assessment (EBA) methodology/other Identifies