The next regular meeting of the Retirement Board will be held at 8:30 a.m. on Thursday, March 15, 2018.
|
|
|
- Ferdinand Craig
- 6 years ago
- Views:
Transcription

1

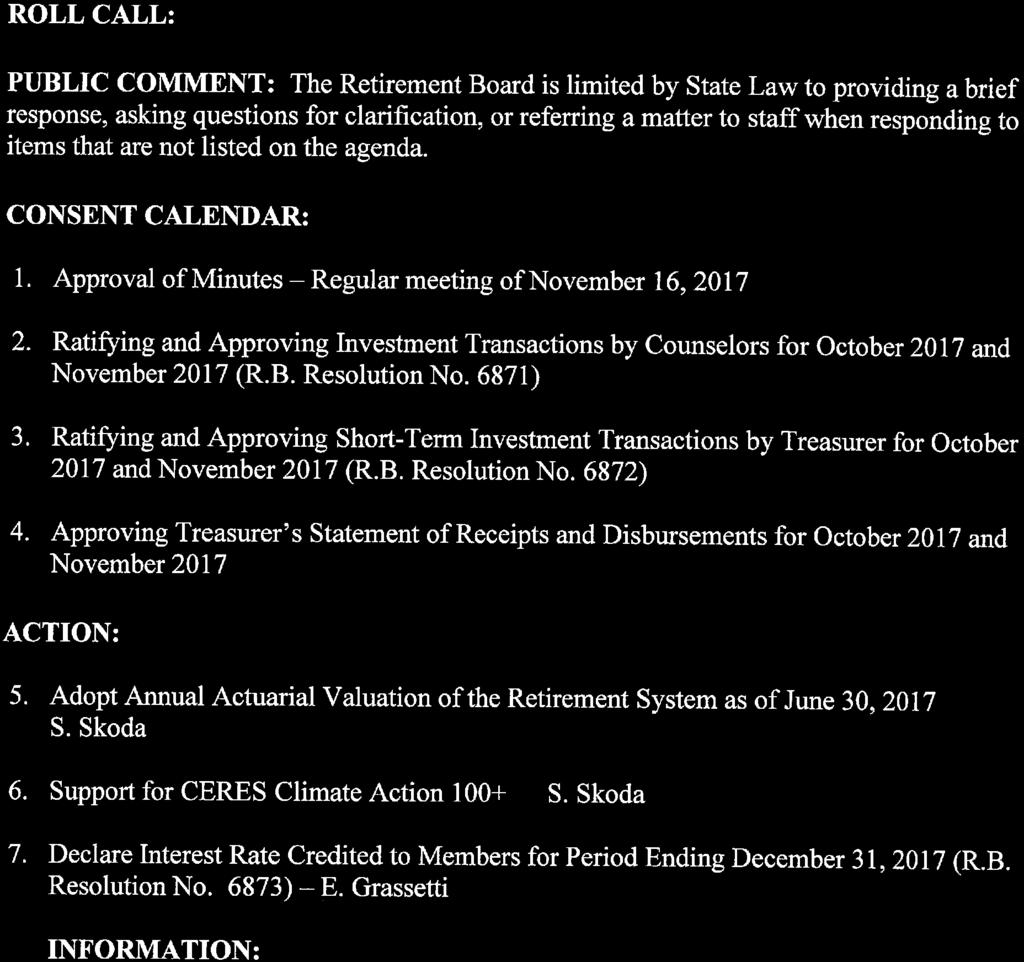
2
3 11. Working Capital Management Strategy S. Skoda 12. Annual Retirement Board Training Report E. Grassetti REPORTS FROM THE RETIREMENT BOARD: 13. Brief report on any course, workshop, or conference attended since the last Retirement Board Meeting ITEMS TO BE CALENDARED: MEETING ADJOURNMENT: The next regular meeting of the Retirement Board will be held at 8:30 a.m. on Thursday, March 15, Retirement Board Meetings March 15, 2018 May17, 2018 July 19, 2018 September 20, 2018 November 15, 2018

4

5
6
7

8
9


10


11


12


13
14


15


16

17

18


19
20
21 East Bay Municipal Utility District Retirement System Actuarial Valuation and Review of Pension Plan and Health Insurance Benefit Plan as of June 30, 2017 Supplemental Exhibits This report has been prepared at the request of the Retirement Board to assist in administering the Fund. This valuation report may not otherwise be copied or reproduced in any form without the consent of the Retirement Board and may only be provided to other parties in its entirety. The measurements shown in this actuarial valuation may not be applicable for other purposes. Copyright 2018 by The Segal Group, Inc. All rights reserved.
22 100 MONTGOMERY STREET, SUITE 500 SAN FRANCISCO, CA T January 12, 2018 Ms. Sophia Skoda Director of Finance East Bay Municipal Utility District 375 Eleventh Street Oakland, CA Re: June 30, 2017 Actuarial Valuations Supplemental Exhibits Dear Sophia: Enclosed please find two exhibits that provide supplemental information to the June 30, 2017 actuarial valuations for the pension and health insurance benefit (HIB) plans. Exhibit A provides a summary of the funding valuation results for both the pension plan and HIB plan. In particular, for the HIB plan, this information is based on our HIB funding valuation report dated January 12, 2018 that includes a maximum monthly benefit of $450 ($550 benefit for a retiree with a spouse or EBMUD domestic partner). It does not include the accounting liability for the implicit subsidy associated with the pooling of the health care premium rate for actives and retirees under age 65. In Exhibit B, we have included a comparison of the historical Projected Benefit Obligations with the market value of assets for both plans. We look forward to discussing this information with you and the Board. Sincerely, Andy Yeung, ASA, MAAA, FCA, EA Vice President and Actuary DNA/bqb Enclosures v3/
23 I. Total Membership Exhibit A East Bay Municipal Utility District Retirement System Summary of Significant Valuation Results for the Funding Valuations June 30, 2017 June 30, 2016 Change From Prior Year A. Active Members 1,802 1, % B. Pensioners and Beneficiaries 1,713 1, % II. Valuation Salary (1) III. A. Total Annual Payroll $184,858,798 $183,970, % B. Average Yearly Salary 102, , % Total System Assets A. Valuation Value of Pension Plan Assets $1,549,213,319 $1,425,784, % B. Valuation Value of HIB Plan Assets 31,451,690 27,002, % C. Total Valuation Value (Actuarial Value) $1,580,665,009 $1,452,786, % D. Market Value of Pension Plan Assets $1,580,556,000 $1,391,771, % E. Market Value of HIB Plan Assets 32,088,000 26,358, % F. Total Market Value $1,612,644,000 $1,418,129, % IV. Unfunded Actuarial Accrued Liability (UAAL) and Funded Ratio (2) A. Pension Plan $518,801,626 $570,078, % B. Funded Ratio 74.9% 71.4% 3.5% C. HIB Plan $86,207,371 $88,652, % D. Funded Ratio 26.7% 23.3% 3.4% E. Pension Plan and HIB Plan $605,008,997 $658,731, % F. Funded Ratio 72.3% 68.8% 3.5% (1) Projected payroll. (2) Based on valuation value of assets. Note: The HIB information is based on our HIB funding valuation report that includes a maximum monthly benefit of $450 ($550 for a retiree with a spouse or EBMUD domestic partner). It does not include the accounting liability for the implicit subsidy associated with the pooling of the health care premium rate for actives and retirees under age 65. 1
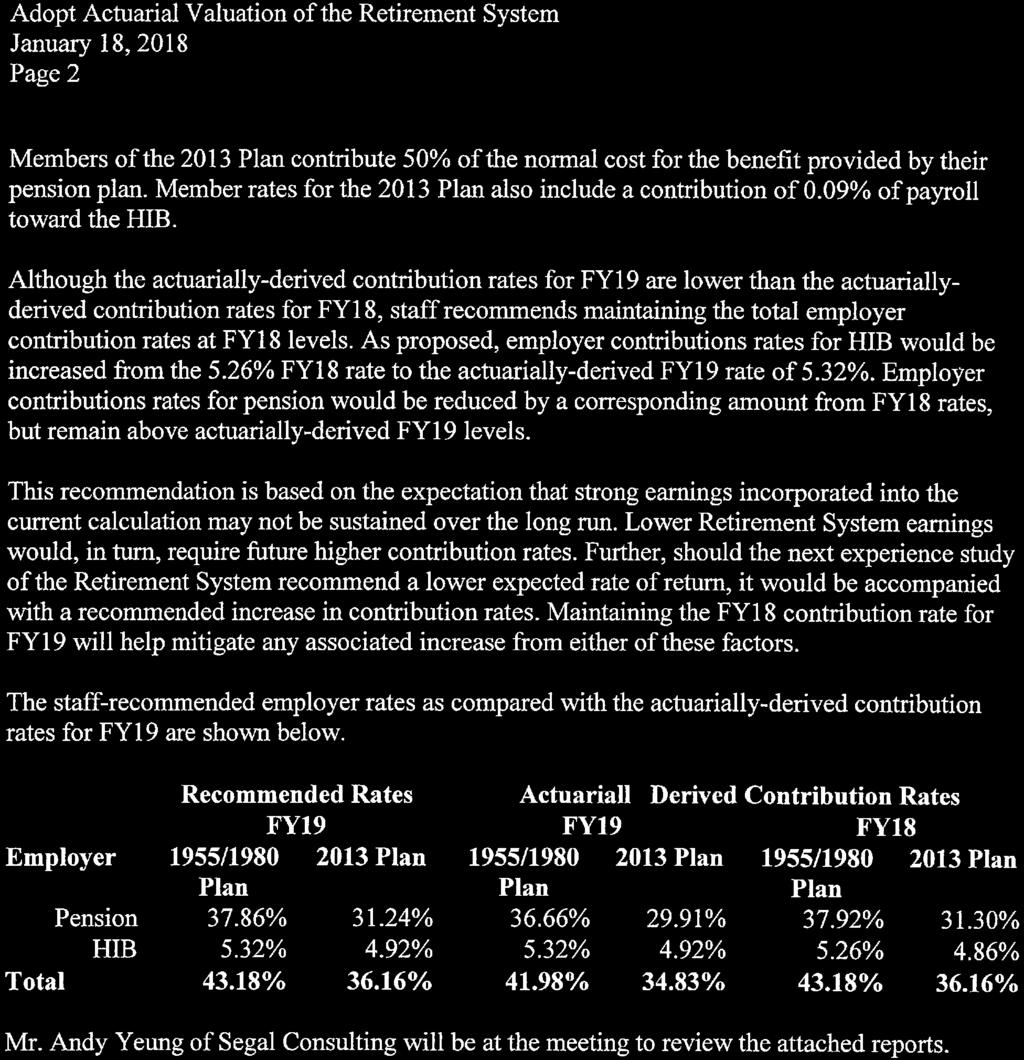
24 Exhibit A (continued) East Bay Municipal Utility District Retirement System Summary of Significant Valuation Results for the Funding Valuations June 30, 2017 June 30, 2016 Change From Prior Year V. Projected Benefit Obligation (3) A. Pension Plan $2,013,986, 000 $1,939,458, % B. Funded Ratio 78.5% 71.8% 6.7% C. HIB Plan $123,497,000 $121,744, % D. Funded Ratio 26.0% 21.7% 4.3% E. Pension Plan and HIB Plan $2,137,483,000 $2,061,202, % F. Funded Ratio 75.4% 68.8% 6.6% VI. Budget Items (4) FY FY Difference 1955/1980 Plan 2013 Tier Combined (5) 1955/1980 Plan 2013 Tier Combined (5) 1955/1980 Plan 2013 Tier Combined (5) A. Pension Plan 1. Total Normal Cost 24.22% 17.56% 22.76% 24.23% 17.70% 22.80% -0.01% -0.14% -0.04% 2. Employee Contributions -8.66% (6) -8.75% -8.68% -8.66% (6) -8.75% -8.68% 0.00% 0.00% 0.00% 3. Employer Normal Cost 15.56% 8.81% 14.08% 15.57% 8.95% 14.12% -0.01% -0.14% -0.04% 4. UAAL (paid by Employer) 21.10% 21.10% 21.10% 22.35% 22.35% 22.35% -1.25% -1.25% -1.25% 5. Total Employer Contribution 36.66% 29.91% 35.18% 37.92% 31.30% 36.47% -1.26% -1.39% -1.29% B. HIB Plan 1. Total Normal Cost 1.23% 0.83% 1.14% 1.25% 0.85% 1.16% -0.02% -0.02% -0.02% 2. Employee Contributions -0.09% -0.09% -0.09% -0.09% -0.09% -0.09% 0.00% 0.00% 0.00% 3. Employer Normal Cost 1.14% 0.74% 1.05% 1.16% 0.76% 1.07% -0.02% -0.02% -0.02% 4. UAAL (paid by Employer) 4.18% 4.18% 4.18% 4.10% 4.10% 4.10% 0.08% 0.08% 0.08% 5. Total Employer Contribution 5.32% 4.92% 5.23% 5.26% 4.86% 5.17% 0.06% 0.06% 0.06% C. Total Contribution 1. Employee Contribution (A2 + B2) 8.75% 8.84% 8.77% 8.75% 8.84% 8.77% 0.00% 0.00% 0.00% 2. Employer Contribution (A5 + B5) 41.98% 34.83% 40.41% 43.18% 36.16% 41.64% -1.20% -1.33% -1.23% (3) Based on market value of assets. (4) (5) (6) Contribution rates, payable at the end of each pay period, are expressed as a percentage of projected pay. Aggregated based on June 30, 2017 projected annual payroll. The rate of 8.66% payable during fiscal years 2017/2018 and 2018/2019 is calculated by taking the total employee rate payable beginning April 18, 2016 (i.e., 8.75%), less the HIB employee contribution rate of 0.09%. 2
25 Exhibit B East Bay Municipal Utility District Retirement System Comparison of Projected Benefit Obligation with the Market Value of Assets (Dollar Amounts in Thousands) Actuarial Valuation Date Projected Benefit Obligation Market Value of Assets Funded Ratio 06/30/2002 $749,113 $536, % 06/30/ , , % 06/30/ , , % 06/30/ , , % 06/30/2006 1,068, , % 06/30/2007 1,160, , % 06/30/2008 1,289, , % 06/30/2009 1,366, , % 06/30/2010 1,444, , % 06/30/2011 1,498, , % 06/30/2012 1,606, , % 06/30/2013 1,699,340 1,124, % 06/30/2014 1,815,349 1,346, % 06/30/2015 1,907,462 1,407, % 06/30/2016 2,061,202 1,418, % 06/30/2017 2,137,483 1,612, % v3/
26 East Bay Municipal Utility District Retirement System Actuarial Valuation and Review of Pension Plan as of June 30, 2017 This report has been prepared at the request of the Retirement Board to assist in administering the Fund. This valuation report may not otherwise be copied or reproduced in any form without the consent of the Retirement Board and may only be provided to other parties in its entirety. The measurements shown in this actuarial valuation may not be applicable for other purposes. Copyright 2018 by The Segal Group, Inc., parent of The Segal Company. All rights reserved.
27 100 MONTGOMERY STREET, SUITE 500 SAN FRANCISCO, CA T January 12, 2018 Ms. Sophia Skoda Director of Finance East Bay Municipal Utility District 375 Eleventh Street Oakland, CA Dear Sophia: We are pleased to submit this Actuarial Valuation and Review as of June 30, 2017 for only the pension plan. The Review of Contribution Rates and Funding Status for the health insurance benefit (HIB) plan is provided in a separate report. This report summarizes the actuarial data used in the valuation, establishes the funding requirements for fiscal 2018/2019 and analyzes the preceding year s experience. This report was prepared in accordance with generally accepted actuarial principles and practices, at the request of the Board to assist in administering the Plan. The census and financial information on which our calculations were based were prepared by EBMUD. That assistance is gratefully acknowledged. The measurements shown in this actuarial valuation may not be applicable for other purposes. Future actuarial measurements may differ significantly from the current measurements presented in this report due to such factors as the following: plan experience differing from that anticipated by the economic or demographic assumptions; changes in economic or demographic assumptions; increases or decreases expected as part of the natural operation of the methodology used for these measurements (such as the end of an amortization period); and changes in plan provisions or applicable law. The actuarial calculations were directed under my supervision. I am a member of the American Academy of Actuaries and I meet the Qualification Standards of the American Academy of Actuaries to render the actuarial opinion herein. To the best of our knowledge, the information supplied in this actuarial valuation is complete and accurate. Further, in our opinion, the assumptions as approved by the Board are reasonably related to the experience of and the expectations for the Plan. We look forward to reviewing this report at your next meeting and to answering any questions. Sincerely, Segal Consulting, a Member of the Segal Group, Inc. By: JRC/hy Andy Yeung, ASA, MAAA, FCA, EA Vice President and Actuary
28 SECTION 1 SECTION 2 SECTION 3 SECTION 4 VALUATION SUMMARY VALUATION RESULTS SUPPLEMENTAL INFORMATION REPORTING INFORMATION Purpose... i Significant Issues in Valuation Year... ii Summary of Key Valuation Results... iv Important Information about Actuarial Valuations... vi A. Participant Data... 1 B. Financial Information... 4 C. Actuarial Experience... 7 D. Employer and Member Contributions E. Funded Ratio F. Volatility Ratios EXHIBIT A Table of Plan Coverage EXHIBIT B Participants in Active Service as of June 30, EXHIBIT C Reconciliation of Participant Data EXHIBIT D Summary Statement of Income and Expenses on an Actuarial Value Basis for All Pension Plan and HIB Plan Assets EXHIBIT I Summary of Actuarial Valuation Results EXHIBIT II Actuarial Assumptions and Actuarial Cost Method EXHIBIT III Summary of Plan Provisions EXHIBIT E Summary Statement of Assets for Pension and HIB Plans EXHIBIT F Development of the Fund Through June 30, 2017 for All Pension Plan and HIB Plan Assets EXHIBIT G Actuarial Balance Sheet EXHIBIT H Development of Unfunded Actuarial Accrued Liability for Year Ended June 30, EXHIBIT I Table of Amortization Bases EXHIBIT J Section 415 Limitations EXHIBIT K Definitions of Pension Terms.. 33
29 SECTION 1: Valuation Summary for the East Bay Municipal Utility District Retirement System Purpose This report has been prepared by Segal Consulting ( Segal ) to present a valuation of the East Bay Municipal Utility District Retirement System as of June 30, The valuation was performed to determine whether the assets and contributions are sufficient to provide the prescribed benefits. The contribution requirements presented in this report are based on: Ref: Pg. 31 The benefit provisions of the pension plan, as administered by the Board; The characteristics of covered active participants, inactive vested participants, and retired participants and beneficiaries as of June 30, 2017, provided by EBMUD; The assets of the plan as of June 30, 2017, provided by EBMUD; Economic assumptions regarding future salary increases and investment earnings adopted by the Board for the June 30, 2017 valuation; and Other actuarial assumptions, regarding employee terminations, retirement, death, etc., adopted by the Board for the June 30, 2017 valuation. One of the general goals of an actuarial valuation is to establish contributions which fully fund the System s liabilities, and which, as a percentage of payroll, remain as level as possible for each generation of active members. Annual actuarial valuations measure the progress toward this goal, as well as test the adequacy of the contribution rates. In preparing this valuation, we have employed generally accepted actuarial methods and assumptions to evaluate the System s assets, liabilities and future contribution requirements. Our calculations are based upon member data and financial information provided to us by the System s staff. This information has not been audited by us, but it has been reviewed and found to be consistent, both internally and with prior year s information. The contribution requirements are determined as a percentage of payroll. The System s employer rates provide for both normal cost and a payment or credit to amortize any unfunded or overfunded actuarial accrued liabilities. In the valuation, new unfunded actuarial accrued liabilities (UAAL) established on or after July 1, 2011 as a result of actuarial gains or losses and change in actuarial assumptions/methods has been amortized over separate declining 20-year and 25-year periods, respectively. The balance of the UAAL established prior to July 1, 2011 continues to be amortized in layers over the current respective remaining fixed periods. Based on the total UAAL contribution rate recommended in the June 30, 2017 valuation, the equivalent single amortization period is about 18 years. The rates calculated in this report may be adopted by the Board for the fiscal year that extends from July 1, 2018 through June 30, i
30 SECTION 1: Valuation Summary for the East Bay Municipal Utility District Retirement System Significant Issues in Valuation Year The following key findings were the result of this actuarial valuation: Ref: Pgs. 18 and 30 Ref: Pg. 15 Ref: Pg. 16 Ref: Pg. 5 The funded ratio measured on a valuation value of assets basis increased from 71.4% at June 30, 2016 to 74.9% at June 30, The funded ratio if measured on a market value of assets basis increased from 69.7% to 76.4%. The UAAL decreased from $570.1 million as of June 30, 2016 to $518.8 million as of June 30, The decrease in the UAAL is primarily due to (a) the higher than expected return on the valuation value of assets (after smoothing) and (b) lower than expected salary increases for actives, 1 offset somewhat by (c) the normal one-year lag in implementing the contribution rates in the June 30, 2016 valuation and (d) other actuarial losses. A complete reconciliation of the System s unfunded actuarial accrued liability is provided in Section 3, Exhibit H. The aggregate employer rate calculated in this valuation has decreased from 36.47% of payroll to 35.18% of payroll. The decrease in the employer rate was primarily due to (a) a decrease in the normal cost rate mostly due to the enrollment of new employees in the 2013 Tier, (b) the higher than expected return on the valuation value of assets (after smoothing), and (c) lower than expected salary increases for actives, 1 offset somewhat by (d) lower than expected growth in total payroll, (e) the normal one-year lag in implementing the contribution rates in the June 30, 2016 valuation, and (f) other actuarial losses. The aggregate member rate calculated in this valuation has remained unchanged at 8.68% of payroll. A reconciliation of the System s aggregate member rate is provided in Section 2, Subsection D (see Chart 15). As indicated in Section 2, Subsection B (see Chart 7) of this report, the total unrecognized investment gain as of June 30, 2017 is $32.0 million for the assets for the pension and HIB plans (note that in the previous valuation, this amount was a deferred loss of $34.7 million). This investment gain will be recognized in the determination of the actuarial value of assets for funding purposes in the next few years. This implies that earning the assumed rate of investment return of 7.25% per year (net of expenses) on a market value basis will produce investment gains on the actuarial value of assets after June 30, We understand that, as a result of ongoing negotiations, there have been no general salary increases other than individual merit and promotional increases since April 2016, if applicable. As a result, the liabilities and the employer contribution rates measured in this report do not reflect any pay increases that might be agreed to by the District and the bargaining parties subsequent to the date of this valuation as of June 30, ii
31 SECTION 1: Valuation Summary for the East Bay Municipal Utility District Retirement System The deferred gains of $32.0 million represent 2.0% of the market value of assets as of June 30, Unless offset by future investment losses or other unfavorable experience, the recognition of the net $32.0 million market gain is expected to have an impact on the System s future funded percentage and contribution rate requirements. This potential impact may be illustrated as follows: If the pension plan portion of the net deferred gains were recognized immediately and entirely in the valuation value of assets, the funded percentage would increase from 74.9% to 76.4%. If the pension plan portion of the net deferred gains were recognized immediately and entirely in the valuation value of assets, the aggregate employer rate (payable at the end of each pay period) would decrease from 35.18% to about 34.0% of payroll. The actuarial valuation report as of June 30, 2017 is based on financial information as of that date. Changes in the value of assets subsequent to that date are not reflected. Declines in asset values will increase the actuarial cost of the plan, while increases will decrease the actuarial cost of the plan. Impact of Future Experience on Contribution Rates Future contribution requirements may differ from those determined in the valuation because of: Differences between actual experience and anticipated experience; Changes in actuarial assumptions or methods; Changes in statutory provisions; and Difference between the contribution rates determined by the valuation and those adopted by the Board. iii
32 SECTION 1: Valuation Summary for the East Bay Municipal Utility District Retirement System Summary of Key Valuation Results June 30, 2017 June 30, 2016 Employer Contribution Rates: Estimated Estimated (payable at the end of each pay period) Total Rate Annual Amount (1) Total Rate Annual Amount (1) 1955/1980 Plan 36.66% $52,931, % $54,750, Tier 29.91% 12,105, % 12,668,524 Combined 35.18% 65,037, % 67,419,042 Average Member Contribution Rates: Estimated Estimated (payable at the end of each pay period) Total Rate Annual Amount (1) Total Rate Annual Amount (1) 1955/1980 Plan 8.66% (2) $12,503, % (2) $12,503, Tier 8.75% 3,541, % 3,541,521 Combined 8.68% 16,045, % 16,045,199 Funded Status: Actuarial accrued liability (AAL) $2,068,014,945 $1,995,863,155 Valuation value of pension plan assets (3) (VVA) 1,549,213,319 1,425,784,553 Market value of pension plan assets (3) (MVA) 1,580,556,000 1,391,771,000 Actuarial value of pension plan and HIB plan assets 1,580,665,009 1,452,786,717 Market value of pension plan and HIB plan assets 1,612,644,000 1,418,129,000 Funded ratio on VVA basis 74.9% 71.4% Funded ratio on pension plan MVA basis 76.4% 69.7% Unfunded actuarial accrued liability (UAAL) on VVA basis $518,801,626 $570,078,602 Unfunded actuarial accrued liability (UAAL) on pension plan MVA basis 487,458, ,092,155 (1) Estimated based on June 30, 2017 projected payroll of $184,858,798. (2) The rate of 8.66% payable during fiscal years 2017/2018 and 2018/2019 is calculated by taking the total employee rate payable beginning April 18, 2016 (i.e., 8.75%), less the HIB employee contribution rate of 0.09%. (3) Net of HIB plan assets. iv
33 SECTION 1: Valuation Summary for the East Bay Municipal Utility District Retirement System Summary of Key Valuation Results (continued) June 30, 2017 June 30, 2016 Demographic Data: Number of retired participants and beneficiaries 1,713 1,630 Number of vested participants Number of active participants 1,802 1,789 Projected total payroll $184,858,798 $183,970,858 Projected average payroll 102, ,834 Key Economic Assumptions: Interest rate 7.25% 7.25% Inflation rate 3.00% 3.00% Across the board salary increase 0.50% 0.50% Cost of living adjustments 3.00% 3.00% v
34 SECTION 1: Valuation Summary for the East Bay Municipal Utility District Retirement System Important Information about Actuarial Valuations An actuarial valuation is a budgeting tool with respect to the financing of future projected obligations of a pension plan. It is an estimated forecast the actual long-term cost of the plan will be determined by the actual benefits and expenses paid and the actual investment experience of the plan. In order to prepare an actuarial valuation, Segal relies on a number of input items. These include: Plan of benefits Plan provisions define the rules that will be used to determine benefit payments, and those rules, or the interpretation of them, may change over time. Even where they appear precise, outside factors may change how they operate. It is important to keep Segal informed with respect to plan provisions and administrative procedures, and to review the plan summary included in our report to confirm that Segal has correctly interpreted the plan of benefits. Participant data An actuarial valuation for a plan is based on data provided to the actuary by the System. Segal does not audit such data for completeness or accuracy, other than reviewing it for obvious inconsistencies compared to prior data and other information that appears unreasonable. It is important for Segal to receive the best possible data and to be informed about any known incomplete or inaccurate data. Assets This valuation is based on the market value of assets as of the valuation date, as provided by the System. The System uses an actuarial value of assets that differs from market value to gradually reflect year-to-year changes in the market value of assets in determining the contribution requirements. Actuarial assumptions In preparing an actuarial valuation, Segal projects the benefits to be paid to existing plan participants for the rest of their lives and the lives of their beneficiaries. This projection requires actuarial assumptions as to the probability of death, disability, termination, and retirement of each participant for each year. In addition, the benefits projected to be paid for each of those events in each future year reflect actuarial assumptions as to salary increases and cost-of-living adjustments. The projected benefits are then discounted to a present value, based on the assumed rate of return that is expected to be achieved on the plan s assets. There is a reasonable range for each assumption used in the projection and the results may vary materially based on which assumptions are selected. It is important for any user of an actuarial valuation to understand this concept. Actuarial assumptions are periodically reviewed to ensure that future valuations reflect emerging plan experience. While future changes in actuarial assumptions may have a significant impact on the reported results, that does not mean that the previous assumptions were unreasonable. The user of Segal s actuarial valuation (or other actuarial calculations) should keep the following in mind: vi
35 SECTION 1: Valuation Summary for the East Bay Municipal Utility District Retirement System The valuation is prepared at the request of the Board to assist the sponsors of the Fund in preparing items related to the pension plan in their financial reports. Segal is not responsible for the use or misuse of its report, particularly by any other party. An actuarial valuation is a measurement of the plan s assets and liabilities at a specific date. Accordingly, except where otherwise noted, Segal did not perform an analysis of the potential range of future financial measures. The actual long-term cost of the plan will be determined by the actual benefits and expenses paid and the actual investment experience of the plan. If the System is aware of any event or trend that was not considered in this valuation that may materially change the results of the valuation, Segal should be advised, so that we can evaluate it. Segal does not provide investment, legal, accounting, or tax advice. Segal s valuation is based on our understanding of applicable guidance in these areas and of the plan s provisions, but they may be subject to alternative interpretations. The Board should look to their other advisors for expertise in these areas. As Segal Consulting has no discretionary authority with respect to the management or assets of the Retirement System, it is not a fiduciary in its capacity as actuaries and consultants with respect to the Retirement System. vii
36 SECTION 2: Valuation Results for the East Bay Municipal Utility District Retirement System A. PARTICIPANT DATA The Actuarial Valuation and Review considers the number and demographic characteristics of covered participants, including active participants, vested terminated participants, retired participants and beneficiaries. This section presents a summary of significant statistical data on these participant groups. More detailed information for this valuation year and the preceding valuation can be found in Section 3, Exhibits A, B, and C. A historical perspective of how the participant population has changed over the past ten valuations can be seen in this chart. CHART 1 Participant Population: Year Ended June 30 Active Participants Vested Terminated Participants Retired Participants and Beneficiaries Ratio of Non-Actives to Actives , , , , , , , , , , , , , , , , , , , ,
37 SECTION 2: Valuation Results for the East Bay Municipal Utility District Retirement System Active Participants Plan costs are affected by the age, years of service and payroll of active participants. In this year s valuation, there were 1,802 active participants with an average age of 48.0, average service of 12.8 years and average payroll of $102,585. The 1,789 active participants in the prior valuation had an average age of 48.5, average service of 13.3 years and average payroll of $102,834. Inactive Participants In this year s valuation, there were 267 participants with a vested right to a deferred or immediate vested benefit compared to 248 in the prior valuation. These graphs show a distribution of active participants by age and by years of service. CHART 2 Distribution of Active Participants by Age as of June 30, 2017 CHART 3 Distribution of Active Participants by Years of Service as of June 30,
38 SECTION 2: Valuation Results for the East Bay Municipal Utility District Retirement System Retired Participants and Beneficiaries As of June 30, 2017, 1,428 retired participants and 285 beneficiaries were receiving total monthly benefits of $7,963,078. For comparison, in the previous valuation, there were 1,346 retired participants and 284 beneficiaries receiving monthly benefits of $7,333,672. These graphs show a distribution of the current retired participants and beneficiaries based on their monthly amount and age, by type of pension. Beneficiary Disability Regular CHART 4 Distribution of Retired Participants and Beneficiaries by Type and by Monthly Amount as of June 30, CHART 5 Distribution of Retired Participants and Beneficiaries by Type and by Age as of June 30,
39 SECTION 2: Valuation Results for the East Bay Municipal Utility District Retirement System B. FINANCIAL INFORMATION Pension plan funding anticipates that, over the long term, both contributions and net investment earnings (less investment fees and administrative expenses) will be needed to cover benefit payments. Pension plan assets change as a result of the net impact of these income and expense components. Additional financial information, including a summary of these transactions for the valuation year, is presented in Section 3, Exhibits D, E and F. The chart depicts the components of changes in the actuarial value of assets over the last ten years. Note: The first bar represents increases in assets during each year while the second bar details the decreases. CHART 6 Comparison of Increases and Decreases in the Actuarial Value of Assets for Years Ended June 30, (for Pension and HIB benefits) $ Millions Adjustment toward market value Benefits paid Net interest and dividends Contributions
40 SECTION 2: Valuation Results for the East Bay Municipal Utility District Retirement System It is desirable to have level and predictable plan costs from one year to the next. For this reason, the Board has approved an asset valuation method that gradually adjusts to market value. Under this valuation method, the full value of market fluctuations is not recognized in a single year and, as a result, the asset value and the plan costs are more stable. The amount of the adjustment to recognize market value is treated as income, which may be positive or negative. Realized and unrealized gains and losses are treated equally and, therefore, the sale of assets has no immediate effect on the actuarial value. The chart shows the determination of the actuarial value of assets as of the valuation date. CHART 7 Determination of Actuarial Value of Assets for Year Ended June 30, 2017 (for Pension and HIB plans) 1. Market value of assets: (a) Pension plan $1,580,556,000 (b) HIB plan 32,088,000 (c) Total $1,612,644,000 Actual Market Expected Market Investment Deferred Deferred 2. Calculation of deferred return: Return (net) Return (net) Gain / (Loss) Factor Return (a) Year ended June 30, 2013 $137,318,000 $76,491,803 $60,826,197 0% $0 (b) Year ended June 30, ,575,000 87,289, ,285,161 20% 26,257,032 (c) Year ended June 30, ,937, ,068,500 (42,131,500) 40% (16,852,600) (d) Year ended June 30, ,894, ,466,650 (92,572,650) 60% (55,543,590) (e) Year ended June 30, ,254, ,606,314 97,647,686 80% 78,118,149 (f) Total unrecognized return* $31,978, Preliminary actuarial value: (1c) - (2f) $1,580,665, Adjustment to be within 30% corridor of market value 0 5. Final actuarial value of assets for pension and HIB plans: (3) + (4) $1,580,665, Actuarial value as a percentage of market value: (5) (1c) 98.0% 7. Valuation value of pension plan assets: (1a) (1c) x (5) $1,549,213,319 * The amount of deferred return that will be recognized in each subsequent valuation is as follows (amounts may not total exactly due to rounding): 6/30/2018 $18,845,739 6/30/2019 (7,411,293) 6/30/2020 1,015,007 6/30/ ,529,537 Total $31,978,991 5
41 SECTION 2: Valuation Results for the East Bay Municipal Utility District Retirement System The market value, actuarial value, and valuation value of assets are representations of EBMUD s financial status. As investment gains and losses are gradually taken into account, the actuarial value of assets tracks the market value of assets. The valuation value of assets is the actuarial value, excluding HIB assets. The valuation value of assets is significant because EBMUD s liabilities are compared to these assets to determine what portion, if any, remains unfunded. Amortization of the unfunded actuarial accrued liability is an important element in determining the contribution requirement. This chart shows the change in the actuarial value of assets versus the market value over the past eleven years. CHART 8 Market Value, Actuarial Value, and Valuation Value of Assets as of June 30, * 1.60 Market Value Actuarial Value $ Billions Valuation Value * Market Value and Actuarial Value of Assets are for pension and HIB benefits. Valuation Value of Assets are for pension benefits only. 6
42 SECTION 2: Valuation Results for the East Bay Municipal Utility District Retirement System C. ACTUARIAL EXPERIENCE To calculate the required contribution, assumptions are made about future events that affect the amount and timing of benefits to be paid and assets to be accumulated. Each year actual experience is measured against the assumptions. If overall experience is more favorable than anticipated (an actuarial gain), the contribution requirement will decrease from the previous year. On the other hand, the contribution requirement will increase if overall actuarial experience is less favorable than expected (an actuarial loss). Taking account of experience gains or losses in one year without making a change in assumptions reflects the belief that the single year s experience was a short-term development and that, over the long term, experience will return to the original assumptions. For contribution requirements to remain stable, assumptions should approximate experience. If assumptions are changed, the contribution requirement is adjusted to take into account a change in experience anticipated for all future years. The total gain is $50,022,788, a $28,130,737 gain from investments and a $21,892,051 gain from all other sources. The net experience variation from individual sources other than investments was 1.06% of the actuarial accrued liability. A discussion of the major components of the actuarial experience is provided on the following pages. This chart provides a summary of the actuarial experience during the past year. CHART 9 Actuarial Experience for Year Ended June 30, Net gain from investments* $28,130, Net gain from other experience** 22,641, Net loss from one-year lag in implementing the contribution rate calculated in the June 30, 2016 valuation until fiscal year 2017/2018 (749,018) 4. Net experience gain: (1) + (2) + (3) $50,022,788 * Details in Chart 10. ** Details in Section 3, Exhibit H. 7
43 SECTION 2: Valuation Results for the East Bay Municipal Utility District Retirement System Investment Rate of Return A major component of projected asset growth is the assumed rate of return. The assumed return should represent the expected long-term rate of return, based on EBMUD s investment policy. For valuation purposes, the assumed rate of return on the valuation value of assets is 7.25% (for the June 30, 2016 valuation). The actual rate of return on a valuation value basis (after smoothing) for the 2016/2017 plan year was 9.23%. Since the actual return for the year was greater than the assumed return, EBMUD experienced an actuarial gain during the year ended June 30, 2017 with regard to its investments. This chart shows the gain/(loss) due to investment experience. CHART 10 Investment Experience for Year Ended June 30, 2017 Valuation Value, Actuarial Value, and Market Value of Assets Valuation Value (includes pension plan assets only) Actuarial Value Market Value (includes pension (includes pension and HIB plan assets) and HIB plan assets) 1. Actual return $131,217,766 $133,617,292 $200,254, Average value of assets $1,421,890,053 $1,449,917,217 $1,415,259, Actual rate of return: (1) (2) 9.23% 9.22% 14.15% 4. Assumed rate of return 7.25% 7.25% 7.25% 5. Expected return: (2) x (4) $103,087,029 $105,118,998 $102,606, Actuarial gain/(loss): (1) (5) $28,130,737 $28,498,294 $97,647,686 8
44 SECTION 2: Valuation Results for the East Bay Municipal Utility District Retirement System Because actuarial planning is long term, it is useful to see how the assumed investment rate of return has followed actual experience over time. The chart below shows the rate of return on a valuation value, actuarial value, and market value basis for the last ten years. CHART 11 Investment Return Valuation Value, Actuarial Value, and Market Value: * Valuation Value Investment Return Actuarial Value Investment Return Market Value Investment Return Year Ended June 30 Amount Percent Amount Percent Amount Percent 2008 $71,124, % $72,404, % $(76,707,000) (8.40)% 2009 (40,442,084) (4.49)% (40,593,156) (4.47)% (171,905,000) (20.47)% ,167, % 51,966, % 95,737, % ,223, % 33,642, % 191,970, % ,558, % 65,488, % 15,202, % ,506, % 76,545, % 137,318, % ,077, % 113,600, % 218,575, % ,145, % 118,952, % 58,937, % ,598, % 104,468, % 12,894, % ,217, % 133,617, % 200,254, % Five-Year Average Return 8.85% 8.84% 10.34% Ten-Year Average Return 6.38% 6.39% 5.61% * Market Value and Actuarial Value of Assets are for the pension plan and the HIB plan. Valuation Value of Assets are for the pension plan only. 9
45 SECTION 2: Valuation Results for the East Bay Municipal Utility District Retirement System Subsection B described the actuarial asset valuation method that gradually takes into account fluctuations in the market value rate of return. The effect of this is to stabilize the actuarial rate of return, which contributes to leveling pension plan (and HIB plan) costs. This chart illustrates how this leveling effect has actually worked over the years CHART 12 Market Value, Actuarial Value, and Valuation Value of Assets: Rates of Return for Years Ended June 30, * Market Value Actuarial Value Valuation Value 30% 25% 20% 15% 10% 5% 0% -5% -10% -15% -20% -25% * Market Value and Actuarial Value of Assets are for pension and HIB benefits. Valuation Value of Assets are for pension benefits only. 10
46 SECTION 2: Valuation Results for the East Bay Municipal Utility District Retirement System Other Experience There are other differences between the expected and the actual experience that appear when the new valuation is compared with the projections from the previous valuation. These include: the extent of turnover among the participants, retirement experience (earlier or later than expected), mortality (more or fewer deaths than expected), the number of disability retirements, and salary increases different than assumed. The net gain from this other experience for the year ended June 30, 2017 amounted to $21,892,051, which is 1.06% of the actuarial accrued liability. 11
47 SECTION 2: Valuation Results for the East Bay Municipal Utility District Retirement System D. EMPLOYER AND MEMBER CONTRIBUTIONS Employer contributions consist of two components: Normal Cost Contribution to the Unfunded Actuarial Accrued Liability (UAAL) Member contributions: The annual contribution rate that, if paid annually from a member s first year of membership through the year of retirement, would accumulate to the amount necessary to fully fund the member's retirement-related benefits. Accumulation includes annual crediting of interest at the assumed investment earnings rate. The contribution rate is expressed as a level percentage of the member s compensation. The annual contribution rate that, if paid annually over the UAAL amortization period, would accumulate to the amount necessary to fully fund the UAAL. Accumulation includes annual crediting of interest at the assumed investment earning rate. The contribution (or rate credit in the case of a negative UAAL) is calculated to remain as a level percentage of future active member payroll (including payroll for new members as they enter the System) assuming a constant number of active members. In order to remain as a level percentage of payroll, amortization payments (credits) are scheduled to increase at the annual rate of 3.50% (i.e., 3.00% inflation plus 0.50% across-the-board salary increase). Plan changes, assumption changes, and experience gains/losses prior to July 1, 2011 are amortized over separate decreasing 30-year amortization periods. On or after July 1, 2011, plan changes are amortized over separate decreasing 15-year periods; assumption or method changes are amortized over separate decreasing 25-year periods; and experience gains/losses are amortized over separate decreasing 20-year periods. The recommended employer contribution rates are provided on Chart /1980 Plan Members Employee contribution rates for 1955/1980 Plan members are prescribed in the Ordinance. Effective April 17, 2006, the rate of member retirement contributions is 6.83%, and 6.74% of that rate is allocated to pay pension benefits. The rest, or 0.09%, is used to pay HIB benefits. The Board of Directors may adjust the employee rates solely pursuant to the terms of a negotiated collective bargaining agreement or memorandum of understanding with employee bargaining units. 12
48 SECTION 2: Valuation Results for the East Bay Municipal Utility District Retirement System Based on bargaining unit contract negotiations in 2013, members are contracted to pay the following employee rates (as a percentage of pay) beginning April 22, 2013: Member Rate Effective Date (a) Total (b) HIB Plan (c) = (a) (b) Pension Plan April 17, 2006* 6.83%* 0.09% 6.74% April 22, % 0.09% 7.24% April 21, % 0.09% 7.74% April 20, % 0.09% 8.24% April 18, % 0.09% 8.66% * Pursuant to the Ordinance Tier Members Pursuant to Section (a) of the Government Code, 2013 Tier members are required to contribute at least 50% of the Normal Cost rate. In addition, there are certain additional requirements that would have to be met such as requiring the employee rates be rounded to the nearest one quarter of one percent and requiring the new employees to pay the contribution rate of similarly situated employees, if it is greater. (reference: Section (c)). We further understand that different rules may have to be applied for collectively bargained employees, non-represented, managerial or other supervisory employees. (reference: Section (e)). In preparing the Normal Cost rates in this report, we have assumed that exactly 50% of the Normal Cost would be paid by the new members and we have taken into account in this valuation only the requirements of Section (c), but not requirements of Section (e). We have also compared the total Normal Cost rates between the current valuation and the initial CalPEPRA valuation so that a rate increase (or decrease) of less than 1% of payroll would result in no change to the member s rate (reference: Section (d)). In particular, the total Normal Cost rate of 17.56% was determined in the first CalPEPRA valuation and has been used since then to determine the 50% of the Normal Cost paid by the employees because the change in the total Normal Cost has been less than 1% of payroll. Accumulation for all members includes crediting of interest at the assumed investment earnings rate. The member contribution rates are provided on Chart
49 SECTION 2: Valuation Results for the East Bay Municipal Utility District Retirement System CHART 13 Recommended Contribution Rates (% of payroll; payable at the end of each pay period) June 30, 2017 Valuation Rate Estimated Annual Amount (1) June 30, 2016 Valuation Rate Estimated Annual Amount (1) 1955/1980 Plan Total Normal Cost 24.22% $34,969, % $34,984,310 Expected Employee Contributions -8.66% (2) -12,503, % (2) -12,503,678 Employer Normal Cost 15.56% $22,466, % $22,480,632 UAAL 21.10% 30,465, % 32,269,886 Total Employer Contribution 36.66% $52,931, % $54,750, Tier Total Normal Cost 17.56% (3) $7,107, % $7,163,990 Expected Employee Contributions -8.75% -3,541, % -3,541,521 Employer Normal Cost 8.81% $3,565, % $3,622,469 UAAL 21.10% 8,540, % 9,046,055 Total Employer Contribution 29.91% $12,105, % $12,668,524 Combined Total Normal Cost 22.76% $42,077, % $42,148,300 Expected Employee Contributions -8.68% -16,045, % -16,045,199 Employer Normal Cost 14.08% $26,031, % $26,103,101 UAAL 21.10% 39,005, % 41,315,941 Total Employer Contribution 35.18% $65,037, % $67,419,042 (1) Amounts are based on the following June 30, 2017 projected annual payroll: 1955/1980 Plan $144,384, Tier 40,474,521 Combined $184,858,798 (2) The rate of 8.66% payable during fiscal years 2017/2018 and 2018/2019 is calculated by taking the total employee rate payable beginning April 18, 2016 (i.e., 8.75%), less the HIB employee contribution rate of 0.09%. (3) 17.56% has been calculated using membership data and actuarial assumptions as of June 30, It is a pure coincidence that this rate is the same as the rate we calculated in the first CalPEPRA valuation. 14
50 SECTION 2: Valuation Results for the East Bay Municipal Utility District Retirement System The employer contribution rates as of June 30, 2017 are based on all of the data described in the previous sections, the actuarial assumptions described in Section 4, and the Plan provisions adopted at the time of preparation of the Actuarial Valuation. They include all changes affecting future costs, adopted benefit changes, actuarial gains and losses, and changes in the actuarial assumptions. Reconciliation of Recommended Employer Contribution The chart below details the changes in the recommended employer contribution from the prior valuation to the current year s valuation. The chart reconciles the employer contribution from the prior valuation to the amount determined in this valuation. CHART 14 Reconciliation of Recommended Employer Contribution Rate from June 30, 2016 to June 30, 2017 Contribution Rate Estimated Amount* Recommended Contribution Rate as of June 30, % $67,419,042 Effect of actuarial experience during fiscal 2016/ Effect of decrease in employer normal cost due to payroll and demographic changes (0.04)% $(73,944) 2. Effect of investment gain (after smoothing) (1.08)% (1,996,475) 3. Effect of lower than expected salary increases (0.91)% (1,682,215) 4. Effect of lower than expected growth in total payroll 0.67% 1,238, Effect of one-year lag in implementing rates 0.03% 55, Effect of other experience losses 0.04% 76,785 Subtotal (1.29)% $(2,381,837) Recommended Contribution Rate as of June 30, % $65,037,205 * Based on June 30, 2017 projected annual payroll of $184,858,
51 SECTION 2: Valuation Results for the East Bay Municipal Utility District Retirement System The member contribution rates as of June 30, 2017 are based on all of the data described in the previous sections, the actuarial assumptions described in Section 4, and the Plan provisions adopted at the time of preparation of the Actuarial Valuation. They include all changes affecting future costs, adopted benefit changes, actuarial gains and losses, and changes in the actuarial assumptions. Reconciliation of Recommended Employee Contribution The chart below details the changes in the recommended member contribution rate from the prior valuation to the current year s valuation. The chart reconciles the employee contribution from the prior valuation to the amount determined in this valuation. CHART 15 Reconciliation of Recommended Employee Contribution Rate from June 30, 2016 to June 30, 2017 Contribution Rate Estimated Amount* Average Contribution Rate as of June 30, % $16,045, Effect of change in member demographics 0.00% 0 Average Contribution Rate as of June 30, % $16,045,199 * Based on June 30, 2017 projected annual payroll of $184,858,
52 SECTION 2: Valuation Results for the East Bay Municipal Utility District Retirement System E. FUNDED RATIO A critical piece of information regarding the Plan s financial status is the funded ratio. This ratio compares the actuarial value of assets to the actuarial accrued liabilities of the Plan as calculated. High ratios indicate a well-funded plan with assets sufficient to cover the plan s actuarial accrued liabilities. Lower ratios may indicate recent changes to benefit structures, funding of the plan below actuarial requirements, poor asset performance, or a variety of other factors. The chart below depicts a history of the funded ratios for this plan. The funded status measures shown in this valuation are appropriate for assessing the need for or amount of future contributions. However, they are not necessarily appropriate for assessing the sufficiency of Plan assets to cover the estimated cost of setting the Plan s benefit obligations. As the chart below shows, the measures are different depending on whether the valuation value or market value of assets is used. CHART 16 Funded Ratio for Plan Years Ending June 30, % 80% 75% VVA Basis MVA Basis 70% 65% 60% 55% 50% 45%
53 SECTION 2: Valuation Results for the East Bay Municipal Utility District Retirement System CHART 17 Schedule of Funding Progress (Dollar Amounts in Thousands) Actuarial Valuation Date Valuation Value of Assets (a) Actuarial Accrued Liability (AAL) (b) Unfunded/ (Overfunded) AAL (UAAL) (b) - (a) Funded Ratio (a) / (b) Covered Payroll (c) UAAL as a Percentage of Covered Payroll [(b) - (a)] / (c) 06/30/2008 $900,917 $1,244,993 $344, % $158, % 06/30/ ,021 1,323, , % 161, % 06/30/ ,845 1,396, , % 164, % 06/30/ ,719 1,446, , % 159, % 06/30/2012 1,021,546 1,556, , % 158, % 06/30/2013 1,095,847 1,646, , % 159, % 06/30/2014 1,210,321 1,756, , % 167, % 06/30/2015 1,327,113 1,845, , % 174, % 06/30/2016 1,425,785 1,995, , % 183, % 06/30/2017 1,549,213 2,068, , % 184, % 18
54 SECTION 2: Valuation Results for the East Bay Municipal Utility District Retirement System F. VOLATILITY RATIOS Retirement plans are subject to volatility in the level of required contributions. This volatility tends to increase as retirement plans become more mature. The Asset Volatility Ratio (AVR), which is equal to the market value of assets divided by total payroll, provides an indication of the potential contribution volatility for any given level of investment volatility. A higher AVR indicates that the plan is subject to a greater level of contribution volatility. This is a current measure since it is based on the current level of assets. For EBMUD, the current AVR is about 8.6. This means that a 1% asset gain/(loss) (relative to the assumed investment return) translates to about 8.6% of one-year s payroll. Since EBMUD amortizes actuarial gains and losses over a 20-year period, there would be a 0.6% of payroll decrease/(increase) in the required contribution for each 1% asset gain/(loss). The Liability Volatility Ratio (LVR), which is equal to the Actuarial Accrued Liability divided by payroll, provides an indication of the longer-term potential for contribution volatility for any given level of investment volatility. This is because, over an extended period of time, the plan s assets should track the plan s liabilities. For example, if a plan is 50% funded on a market value basis, the liability volatility ratio would be double the asset volatility ratio and the plan sponsor should expect contribution volatility to increase over time as the plan becomes better funded. The LVR also indicates how volatile contributions will be in response to changes in the Actuarial Accrued Liability due to actual experience or to changes in actuarial assumptions. For EBMUD, the current LVR is about This is about 30% higher than the AVR. Therefore, we would expect that contribution volatility will increase over the long-term. This chart shows how the asset and liability volatility ratios have varied over time. CHART 18 Volatility Ratios for Years Ended June 30, Year Ended June 30 Asset Volatility Ratio Liability Volatility Ratio
55 SECTION 3: Supplemental Information for the East Bay Municipal Utility District Retirement System This exhibit summarizes the participant data used for the current and prior valuations. EXHIBIT A Table of Plan Coverage i. All Year Ended June 30 Category Change From Prior Year Active participants in valuation: Number 1,802 1, % Average age Average service Projected total payroll $184,858,798 $183,970, % Projected average payroll $102,585 $102, % Account balances $180,582,819 $170,846, % Total active vested participants 1,215 1, % Vested terminated participants: Number % Average age Retired participants: Number in pay status 1,370 1, % Average age Average monthly benefit $5,175 $5, % Disabled participants: Number in pay status % Average age Average monthly benefit $2,209 $2, % Beneficiaries: Number in pay status % Average age Average monthly benefit $2,615 $2, % 20
56 SECTION 3: Supplemental Information for the East Bay Municipal Utility District Retirement System EXHIBIT A Table of Plan Coverage ii. 1955/1980 Plan Year Ended June 30 Category Change From Prior Year Active participants in valuation: Number 1,334 1, % Average age Average service Projected total payroll $144,384,277 $153,100, % Projected average payroll $108,234 $107, % Account balances $173,283,945 $166,926, % Total active vested participants 1,215 1, % Vested terminated participants: Number % Average age Retired participants: Number in pay status 1,370 1, % Average age Average monthly benefit $5,175 $5, % Disabled participants: Number in pay status % Average age Average monthly benefit $2,209 $2, % Beneficiaries: Number in pay status % Average age Average monthly benefit $2,615 $2, % 21
57 SECTION 3: Supplemental Information for the East Bay Municipal Utility District Retirement System EXHIBIT A Table of Plan Coverage iii Tier Year Ended June 30 Category Change From Prior Year Active participants in valuation: Number % Average age Average service Projected total payroll $40,474,521 $30,870, % Projected average payroll $86,484 $84, % Account balances $7,298,874 $3,919, % Total active vested participants 0 0 N/A Vested terminated participants: Number % Average age Retired participants: Number in pay status N/A N/A N/A Average age N/A N/A N/A Average monthly benefit N/A N/A N/A Disabled participants: Number in pay status N/A N/A N/A Average age N/A N/A N/A Average monthly benefit N/A N/A N/A Beneficiaries: Number in pay status N/A N/A N/A Average age N/A N/A N/A Average monthly benefit N/A N/A N/A 22
58 SECTION 3: Supplemental Information for the East Bay Municipal Utility District Retirement System EXHIBIT B Participants in Active Service as of June 30, 2017 By Age, Years of Service, and Average Projected Payroll i. 1955/1980 Plan Years of Service Age Total & over Under $93,848 $88,058 $101, ,146 93,536 99,909 $115, ,608 93, , ,777 $120, , , , , ,474 $108, ,387 98, , , , ,704 $131, , , , , , , ,532 $133,565 $92, ,530 97, , , , , , , ,672 $118, , ,470 99, ,630 92, , , , , , , ,887 95, ,091 99, ,878 84, , , , & over , ,920 87,875 76,635 84,527 97,528 82, Total 1, $108,234 $99,962 $106,106 $107,297 $102,490 $112,776 $112,602 $121,152 $113,275 $120,858 23
59 SECTION 3: Supplemental Information for the East Bay Municipal Utility District Retirement System EXHIBIT B Participants in Active Service as of June 30, 2017 By Age, Years of Service, and Average Projected Payroll ii Tier Years of Service Age Total & over Under $77,032 $77, ,248 82, ,776 83, ,158 89, ,448 90, ,077 92, ,773 83, ,560 89, ,108 80, ,224 89, & over , , Total $86,484 $86,
60 SECTION 3: Supplemental Information for the East Bay Municipal Utility District Retirement System EXHIBIT C Reconciliation of Participant Data Active Participants Vested Participants Disableds Retired Participants Beneficiaries Number as of June 30, , , ,667 New participants Terminations with vested rights Refund of contributions Retirements New disabilities Return to work Died with or without beneficiary (1) -29 Data adjustments 0 16 (2) Number as of June 30, , , ,782 (1) This is the net increase in the number of beneficiaries after subtracting the number of beneficiaries who died during the year. (2) Includes 6 members who were hired and terminated employment during fiscal year 2016/2017 and 10 members who were previously indicated by EBMUD as having a refund of contributions in the prior valuation. Total 25
61 SECTION 3: Supplemental Information for the East Bay Municipal Utility District Retirement System EXHIBIT D Summary Statement of Income and Expenses on an Actuarial Value Basis for All Pension Plan and HIB Plan Assets Year Ended June 30, 2017 Year Ended June 30, 2016 Contribution income: Employer contributions $76,860,000 $74,672,000 Employee contributions 16,018,000 14,925,000 Net contribution income $92,878,000 $89,597,000 Investment income: Interest, dividends and other income $28,865,000 $26,323,000 Recognition of capital appreciation 111,575,292 84,098,421 Less investment and administrative fees (6,823,000) (5,953,000) Net investment income $133,617,292 $104,468,421 Total income available for benefits $226,495,292 $194,065,421 Less benefit payments: Benefits paid $(98,152,000) $(91,152,000) Refund of contributions (465,000) (419,000) Net benefit payments $(98,617,000) $(91,571,000) Change in amount available for future benefits $127,878,292 $102,494,421 26
62 SECTION 3: Supplemental Information for the East Bay Municipal Utility District Retirement System EXHIBIT E Summary Statement of Assets for Pension and HIB Plans Year Ended June 30, 2017 Year Ended June 30, 2016 Cash equivalents $48,988,000 $40,657,000 Accounts receivable: Brokers, securities sold $4,449,000 $1,444,000 Employer and employee contributions 1,263,000 4,551,000 Interest and dividends 2,341,000 2,237,000 Total accounts receivable $8,053,000 $8,232,000 Investments: Equities $1,227,836,000 $1,038,078,000 Fixed income investments 251,860, ,447,000 Real estate 84,282,000 83,140,000 Securities lending collateral 108,858, ,265,000 Other assets 518, ,000 Total investments at market value $1,673,354,000 $1,497,432,000 Total assets $1,730,395,000 $1,546,321,000 Less accounts payable: Accounts payable and accrued expenses $(2,061,000) $(1,755,000) Payables to brokers, securities purchased (6,832,000) (7,172,000) Securities lending collateral (108,858,000) (119,265,000) Total accounts payable $(117,751,000) $(128,192,000) Net assets at market value $1,612,644,000 $1,418,129,000 Net assets at actuarial value $1,580,665,009 $1,452,786,717 Net assets at valuation value (pension plan only) $1,549,213,319 $1,425,784,553 27
63 SECTION 3: Supplemental Information for the East Bay Municipal Utility District Retirement System EXHIBIT F Development of the Fund Through June 30, 2017 for All Pension Plan and HIB Plan Assets Year Ended June 30 Employer Contributions Employee Contributions Net Actuarial Value Investment Return* Benefit Payments Actuarial Value of Assets at End of Year 2008 $44,603,000 $10,394,000 $72,404,538 $50,780,000 $907,927, ,803,000 10,740,000 (40,593,156) 54,502, ,375, ,756,000 10,918,000 51,966,871 58,109, ,906, ,481,000 10,850,000 33,642,654 62,114, ,766, ,651,000 10,723,000 65,488,807 66,843,000 1,035,786, ,567,000 10,566,000 76,545,489 72,095,000 1,112,369, ,117,000 12,133, ,600,558 78,265,000 1,229,955, ,141,000 13,427, ,952,917 85,184,000 1,350,292, ,672,000 14,925, ,468,421 91,571,000 1,452,786, ,860,000 16,018, ,617,292 98,617,000 1,580,665,009 * Net of investment fees and administrative expenses. 28
64 SECTION 3: Supplemental Information for the East Bay Municipal Utility District Retirement System EXHIBIT G Actuarial Balance Sheet An overview of the Plan s funding is given by an Actuarial Balance Sheet. In this approach, we first determine the amount and timing of all future payments that will be made by the Plan for current participants. We then discount these payments at the valuation interest rate to the date of the valuation, thereby determining their present value. We refer to this present value as the liability of the Plan. Second, we determine how this liability will be met. These actuarial assets include the net amount of assets already accumulated by the Plan, the present value of future member contributions, the present value of future employer normal cost contributions, and the present value of future employer amortization payments. Actuarial Balance Sheet Assets June 30, 2017 June 30, Total valuation assets $1,549,213,319 $1,425,784, Present value of future contribution by members 138,093, ,921, Present value of future employer contributions for: (a) entry age normal cost 187,172, ,681,065 (b) unfunded actuarial accrued liability 518,801, ,078, Total current and future assets $2,393,280,373 $2,321,466,086 Liabilities June 30, 2017 June 30, Present value of benefits for retirees and beneficiaries $1,259,012,986 $1,163,750, Present value of benefits for terminated vested members 43,660,442 43,969, Present value of benefits for active members 1,090,606,945 1,113,746, Total liabilities $2,393,280,373 $2,321,466,086 29
65 SECTION 3: Supplemental Information for the East Bay Municipal Utility District Retirement System EXHIBIT H Development of Unfunded Actuarial Accrued Liability for Year Ended June 30, Unfunded actuarial accrued liability at beginning of year $570,078, Normal cost at beginning of year 41,105, Expected employer and member contributions at beginning of year (80,811,863) 4. Interest 38,451, Expected unfunded actuarial accrued liability $568,824, Changes due to: (a) Gain from investments (after smoothing) $(28,130,737) (b) Gain on salaries lower than expected (23,702,193) (c) Loss due to one-year lag in implementing contribution rates in June 30, 2016 valuation (with interest to end of year) 749,018 (d) Loss from all other sources 1,061,124 (e) Total changes $(50,022,788) 7. Unfunded actuarial accrued liability at end of year $518,801,626 Note: The net gain from other experience of $22,641,069 from Section 2, Chart 9 is equal to the sum of items 6(b) and 6(d). 30
66 SECTION 3: Supplemental Information for the East Bay Municipal Utility District Retirement System EXHIBIT I Table of Amortization Bases Type Date Established Initial Years Initial Amount Outstanding Balance Years Remaining Annual Payment* Experience Gain 6/30/ $(10,871,830) $(11,972,424) 13 $(1,130,151) Change in Assumptions 6/30/ ,629,891 9,503, ,097 Plan Amendments 6/30/ ,607,265 14,984, ,414, % COLA Assumption 6/30/ ,057,441 29,796, ,812,681 Experience Loss 6/30/ ,292,281 2,567, ,723 Experience Loss 6/30/ ,232,251 29,724, ,512,460 Plan Amendments 6/30/ ,111,914 5,792, ,606 Experience Loss 6/30/ ,692,270 49,879, ,016,987 Plan Amendments 6/30/ ,138,578 76,646, ,172,597 Experience Loss 6/30/ ,731,232 37,503, ,888,697 New Assumption / Domestic Partners 6/30/ (9,812,646) (11,243,474) 17 (866,016) Experience Loss 6/30/ ,910,233 30,844, ,279,881 Remove Limit Pension Base 6/30/ ,315,928 31,167, ,303,734 Experience Loss 6/30/ ,160,133 16,187, ,151,672 Experience Gain 6/30/ (3,098,126) (3,523,178) 20 (241,901) Experience Gain 6/30/ (7,800,585) (8,803,274) 21 (584,730) Change in Assumptions 6/30/ ,413,374 58,022, ,853,935 Experience Loss 6/30/ ,894, ,400, ,268,517 Experience Loss 6/30/ ,039,098 3,356, ,983 Change in Assumptions 6/30/ ,098,499 8,945, ,557 Experience Loss 6/30/ ,428,038 4,828, ,958 Experience Gain 6/30/ (15,668,764) (15,244,163) 15 (1,288,513) Change in Assumptions 6/30/ ,400,521 55,260, ,794,150 Experience Loss 6/30/ ,858,322 10,677, ,882 Experience Gain 6/30/ (26,406,581) (26,145,148) 17 (2,013,800) Change in Assumptions 6/30/ ,421,049 18,850, ,213,920 Experience Gain 6/30/ (28,955,525) (28,838,293) 18 (2,131,585) Experience Gain 6/30/ (1,408,751) (1,407,148) 19 (100,110) Change in Assumptions 6/30/ ,595,760 53,061, ,230,164 Experience Gain 6/30/ (50,022,788) (50,022,788) 20 (3,434,563) Total $518,801,626 $37,661,337 * Beginning of year payment, reflecting level percentage of payroll. Note: The equivalent single amortization period is about 18 years. 31
67 SECTION 3: Supplemental Information for the East Bay Municipal Utility District Retirement System EXHIBIT J Section 415 Limitations Section 415 of the Internal Revenue Code (IRC) specifies the maximum benefits that may be paid to an individual from a defined benefit plan and the maximum amounts that may be allocated each year to an individual s account in a defined contribution plan. Contribution rates determined in this valuation have not been reduced for the Section 415 limitations. Actual limitations will result in actuarial gains as they occur. A qualified pension plan may not pay benefits in excess of the Section 415 limits. The ultimate penalty for noncompliance is disqualification: active participants could be taxed on their vested benefits and the IRS may seek to tax the income earned on the plan s assets. In particular, Section 415(b) of the IRC limits the maximum annual benefit payable at the Normal Retirement Age to a dollar limit of $160,000 indexed for inflation. That limit is $215,000 for 2017 and $220,000 for Normal Retirement Age for these purposes is age 62. These are the limits in simplified terms. They must be adjusted based on each participant s circumstances, for such things as age at retirement, form of benefits chosen and after tax contributions. Benefits for members in the non-calpepra plan in excess of the limits may be paid through a qualified governmental excess plan that meets the requirements of Section 415(m). Legal Counsel s review and interpretation of the law and regulations should be sought on any questions in this regard. 32
68 SECTION 3: Supplemental Information for the East Bay Municipal Utility District Retirement System EXHIBIT K Definitions of Pension Terms The following list defines certain technical terms for the convenience of the reader: Assumptions or Actuarial Assumptions: Normal Cost: Actuarial Accrued Liability For Actives: Actuarial Accrued Liability For Pensioners: Unfunded Actuarial Accrued Liability: Amortization of the Unfunded Actuarial Accrued Liability: The estimates on which the cost of the Plan is calculated including: (a) (b) (c) (d) Investment return the rate of investment yield that the Plan will earn over the long-term future; Mortality rates the death rates of employees and pensioners; life expectancy is based on these rates; Retirement rates the rate or probability of retirement at a given age; and Turnover rates the rates at which employees of various ages are expected to leave employment for reasons other than death, disability, or retirement. The amount of contributions required to fund the benefit allocated to the current year of service. The equivalent of the accumulated normal costs allocated to the years before the valuation date. The single sum value of lifetime benefits to existing pensioners. This sum takes account of life expectancies appropriate to the ages of the pensioners and the interest that the sum is expected to earn before it is entirely paid out in benefits. The extent to which the actuarial accrued liability of the Plan exceeds the assets of the Plan. There is a wide range of approaches to paying off the unfunded actuarial accrued liability, from meeting the interest accrual only to amortizing it over a specific period of time. Payments made over a period of years equal in value to the Plan s unfunded actuarial accrued liability. 33
69 SECTION 3: Supplemental Information for the East Bay Municipal Utility District Retirement System Investment Return: The rate of earnings of the Plan from its investments, including interest, dividends and capital gain and loss adjustments, computed as a percentage of the average value of the fund. For actuarial purposes, the investment return often reflects a smoothing of the capital gains and losses to avoid significant swings in the value of assets from one year to the next. 34
70 SECTION 4: Reporting Information for the East Bay Municipal Utility District Retirement System EXHIBIT I Summary of Actuarial Valuation Results The valuation was made with respect to the following data supplied to us: 1. Retired participants as of the valuation date (including 285 beneficiaries in pay status) 1, Participants inactive during year ended June 30, 2017 with vested rights Participants active during the year ended June 30, ,802 Fully vested 1,215 Not vested 587 The actuarial factors as of the valuation date are as follows: 1. Normal cost, beginning of year $40,636, Present value of future benefits 2,393,280, Present value of future normal costs 325,265, Actuarial accrued liability Retired participants and beneficiaries $1,259,012,986 Inactive participants with vested rights 43,660,442 Active participants 765,341,517 Subtotal $2,068,014, Valuation value of assets ($1,612,644,000 at market value for pension and HIB plans, as reported by the auditor, and $1,580,665,009 at actuarial value for pension and HIB plans) $1,549,213,319 (1) 6. Unfunded actuarial accrued liability $518,801,626 (1) Net of HIB assets. 35
71 SECTION 4: Reporting Information for the East Bay Municipal Utility District Retirement System EXHIBIT I (continued) Summary of Actuarial Valuation Results The determination of the recommended contribution at the end of each pay period is as follows: 1955/1980 Plan 2013 Tier Combined 1. Total normal cost $34,969,872 $7,107,326 $42,077, Expected employee contributions -12,503,678-3,541,521-16,045, Employer normal cost: (1) + (2) $22,466,194 $3,565,805 $26,031, Payment on unfunded actuarial accrued liability 30,465,082 8,540,124 39,005, Total recommended contribution $52,931,276 $12,105,929 $65,037, Projected payroll $144,384,277 $40,474,521 $184,858, Total recommended contribution as a percentage of projected payroll: (5) (6) 36.66% 29.91% 35.18% Note: The contribution amounts shown above are based on the recommended employer and employee contribution rates payable at the end of each pay period, multiplied by the projected payroll. 36
72 SECTION 4: Reporting Information for the East Bay Municipal Utility District Retirement System EXHIBIT II Actuarial Assumptions and Actuarial Cost Method Rationale for Assumptions: Economic Assumptions: Net Investment Return: Interest Credited to Employee Accounts: 7.25% Inflation: 3.00%* 2 Across the Board Salary Increases: 0.50% The information and analysis used in selecting each assumption that has a significant effect on this actuarial valuation is shown in the July 1, 2012 through June 30, 2016 Actuarial Experience Study report dated November 10, Unless otherwise noted, all actuarial assumptions and methods shown below apply to both tiers. These assumptions were adopted by the Board. 7.25%, net of investment and administrative expenses. Cost of Living Increases: 3.00% per annum. 2 * The maximum amount of pensionable compensation that can be taken into account for 2017 of $118,775 for 2013 Tier members is also assumed to increase by 3.00% per year. 37
73 SECTION 4: Reporting Information for the East Bay Municipal Utility District Retirement System Salary Increases: Demographic Assumptions: Mortality Rates: Pre-retirement Males Females Annual Rate of Compensation Increase Inflation: 3.00% per year; plus across the board salary increases of 0.50% per year; plus the following merit and promotional increases based on years of service: Years of Service Merit and Promotional Increases % % % % % % % % Headcount-Weighted RP-2014 Employee Mortality Table projected 20 years with the two-dimensional improvement scale MP-2015, set forward two years for males Headcount-Weighted RP-2014 Employee Mortality Table projected 20 years with the two-dimensional improvement scale MP-2015, set forward one year for females 38
74 SECTION 4: Reporting Information for the East Bay Municipal Utility District Retirement System After Service Retirement and All Beneficiaries Males Females After Disability Retirement: Males Females Headcount-Weighted RP-2014 Healthy Annuitant Mortality Table projected 20 years with the two-dimensional improvement scale MP-2015, set forward two years for males Headcount-Weighted RP-2014 Healthy Annuitant Mortality Table projected 20 years with the two-dimensional improvement scale MP-2015, set forward one year for females Headcount-Weighted RP-2014 Healthy Annuitant Mortality Table projected 20 years with the two-dimensional improvement scale MP-2015, set forward nine years for males Headcount-Weighted RP-2014 Healthy Annuitant Mortality Table projected 20 years with the two-dimensional improvement scale MP-2015, set forward nine years for females The above mortality tables contain a margin slightly less than 20% for males and females combined, based on actual to expected deaths, as a provision to reflect future mortality improvement, based on a review of mortality experience as of the measurement date. Disability Rates: Rate (%) Rate (%) Age Male Female Age Male Female Note: Disability rates applicable after eight years of service. 39
75 SECTION 4: Reporting Information for the East Bay Municipal Utility District Retirement System Termination Rates: Rate (%) Ordinary Withdrawal* Service Male Female Rate (%) Ordinary Withdrawal** Vested Termination Age Male Female Male Female * Applicable for members with less than five years of service. ** Applicable after five years of service. 40
76 SECTION 4: Reporting Information for the East Bay Municipal Utility District Retirement System Retirement Rates: Rate (%) 1955/1980 Plan 2013 Tier Age Male Female Male Female * * The rate for 1955/1980 Plan members age 54 with 30 or more years of service (i.e., eligible for unreduced benefits) is 50% for males and females. 41
77 SECTION 4: Reporting Information for the East Bay Municipal Utility District Retirement System Retirement Age for Inactive Vested Participants: 59 Reciprocity: Unknown Data for Participants: Percent Married/Domestic Partnership: Age of Spouse/Domestic Partner: Future Benefit Accruals: Actuarial Value of Assets: 30% of members who terminate with a vested benefit are assumed to enter a reciprocal system. For reciprocals, we assume 4.00% compensation increases per annum. Same as those exhibited by members with similar known characteristics. If not specified, members are assumed to be male. Spouses/domestic partners of active and inactive members are assumed to be the opposite sex of the member. The percent married/domestic partnership at retirement is assumed to be 80% for male members and 50% for female members. Female (or male) spouses/domestic partners are 3 years younger (or older) than the members. 1.0 year of service per year of employment plus years of additional service to anticipate conversion of unused sick leave for each year of employment. As directed by EBMUD, this assumption has been applied to active members in the 1955/1980 Plan and the 2013 Tier. Market value of assets less unrecognized returns in each of the last five years. Unrecognized return is equal to the difference between the actual market return and the expected return on the market value, and is recognized over a five-year period, further adjusted, if necessary, to be within 30% of the market value. 42
78 SECTION 4: Reporting Information for the East Bay Municipal Utility District Retirement System Actuarial Cost Method: Entry Age Cost Method. Entry Age is the age at the member s hire date. Actuarial Accrued Liability is calculated on an individual basis and is based on costs allocated as a level percentage of compensation. The Normal Cost is calculated on an individual basis where the Entry Age Normal Cost is calculated as the sum of the individual Normal Costs. The UAAL from plan changes, assumption changes, and experience gains/losses prior to July 1, 2011 are amortized over separate decreasing 30-year amortization periods. On or after July 1, 2011, any new UAAL resulting from plan changes are amortized over separate decreasing 15-year periods; assumption or method changes are amortized over separate decreasing 25-year periods; and experience gains/losses are amortized over separate decreasing 20-year periods. 43
79 SECTION 4: Reporting Information for the East Bay Municipal Utility District Retirement System EXHIBIT III Summary of Plan Provisions This exhibit summarizes the major provisions of the EBMUD included in the valuation. It is not intended to be, nor should it be interpreted as, a complete statement of all plan provisions. Plan Year: July 1 through June 30 Census Date: June 30 Membership Eligibility: 1955/1980 Plan All employees who first become members before January 1, Tier All employees who first become members on or after January 1, Final Compensation for Benefit Determination: 1955/1980 Plan Highest two consecutive years of compensation earnable (FAS2) Tier Highest thirty-six consecutive months of pensionable compensation (FAS3). Compensation Limit: 1955/1980 Plan None 2013 Tier $118,775 for 2017 Normal or Unreduced Retirement Eligibility: Age and Service Requirement 1955/1980 Plan Age 65; Age 62 with 5 years of service; Age 59 with 20 years of service; Age 54 with 30 years of service; Other combinations of age and service between ages 54 and Tier Age 67 with 5 years of service (for unreduced benefit). 44
80 SECTION 4: Reporting Information for the East Bay Municipal Utility District Retirement System Early Retirement Eligibility: Age and Service Requirement 1955/1980 Plan Age 54 with 5 years of service Tier Age 52 with 5 years of service. Benefit Formula: 1955/1980 Plan: 1955 Formula 2.42% (2.82% if member is credited with District Service on or after January 1, 2004) times Final Compensation per year of service including all service extension credit. 1955/80 Formula 2.42% (2.82% if member is credited with District Service on or after January 1, 2004) times Final Compensation per year of service up to August 1, 1980 including all service extension credit, plus 2.20% (2.60% if member is credited with District Service on or after January 1, 2004) times Final Compensation per year of service after August 1, Applies to members who elected to convert to the 1980 Formula in /90 Formula 2.42% (2.82% if member is credited with District Service on or after January 1, 2004) times Final Compensation per year of service up to January 1, 2000 including all service extension credit, plus 2.20% (2.60% if member is credited with District Service on or after January 1, 2004) times Final Compensation per year of service after January 1, Applies to members who elected to convert to the 1980 Formula in Formula 2.20% (2.60% if member is credited with District Service on or after January 1, 2004) times Final Compensation per year of service including all service extension credit. Applies to all members hired on or after January 1, Service Extension Credit 2.42% (2.82% if member is credited with District Service on or after January 1, 2004) for members with any service under the 1955 Formula or 2.20% (2.60% if member is credited with District Service on or after January 1, 2004) for members with service only under the 1980 Formula times Final Compensation per year of Service Extension Credit. Service extension credit is the number of unused sick leave days credited to a member at the time of retirement converted on a 260-day basis. The number of such days is then doubled for the benefit calculation and for service retirements to meet the early retirement provision of the Ordinance. 45
81 SECTION 4: Reporting Information for the East Bay Municipal Utility District Retirement System Benefit Formula: (continued) 1955/1980 Plan: Benefit Adjustments 2013 Tier: Disability: Eligibility Benefit Vesting: Requirements Reduced by 3% per year under the age of eligibility for an unreduced benefit, based on service at retirement, for retirements before age 63 (before age 62 commencing November 1, 2000). Effective July 1, 1999, Service Extension Credit is included in the years of service calculation of service for determining eligibility for unreduced retirement. Retirement Age Benefit Formula % x FAS3 x Years of Service % x FAS3 x Years of Service % x FAS3 x Years of Service % x FAS3 x Years of Service % x FAS3 x Years of Service 67 or later 2.50% x FAS3 x Years of Service Eight years of service (not available for Directors). Greater of: 1.5% times Final Compensation per year of service. One-third of Final Compensation. Five years of service, must leave contributions on deposit, reciprocal service counts for vesting purposes. 46
82 SECTION 4: Reporting Information for the East Bay Municipal Utility District Retirement System Pre-Retirement Death Benefit: Eligibility Benefit Eligible for retirement. 50% of the unmodified service retirement benefit to eligible surviving spouse/surviving domestic partner plus the lump sum payment of accumulated retirement contributions. Eligibility Benefit Post-Retirement Death Benefit: Member Contributions: OR None. Lump sum payment of accumulated retirement contributions. 50% of the unmodified service retirement benefit to surviving spouse or registered domestic partner (tied to the implementation of the AB 205 legislation). 1955/1980 Plan Effective April 17, 2006, retirement system members contribute at a rate of 6.83% of pay, as prescribed in the Ordinance. Based on bargaining unit contract negotiations in 2013, members are contracted to pay the following employee rates (as a percentage of pay) beginning April 22, 2013: Effective Date (a) Total Member Rate (b) HIB Plan (c) = (a) (b) Pension Plan April 17, 2006* 6.83%* 0.09% 6.74% April 22, % 0.09% 7.24% April 21, % 0.09% 7.74% April 20, % 0.09% 8.24% April 18, % 0.09% 8.66% * Pursuant to the Ordinance. 47
83 SECTION 4: Reporting Information for the East Bay Municipal Utility District Retirement System Member Contributions: (continued) 2013 Tier Initial member contribution rate is set at 50% of the total 2013 Tier Normal Cost rate, rounded to the nearest quarter of 1%. Once established, the member contribution rate will be adjusted annually to reflect the change in the 2013 Tier Normal Cost rate, but only if the change is more than 1% of payroll. Cost of Living: Payable July 1 of each year, the basic minimum COLA benefit is the lesser of 3% and the actual change in the cost of living index. Excess of the actual change of cost of living index over 3% is accumulated in individual retiree COLA banks. Withdrawals from the bank are made in years when the index increases less than 3%. Increases of up to 5% are granted in years when the Retirement Board determines that the System is more than 85% funded on a Projected Benefit Obligation basis. In those years when the System is more than 85% funded and the cost of living index exceeds 5%, any excess cost of living over 5% is accumulated in the COLA bank. Effective October 1, 2000, in those years when the system is more than 85% funded on a Projected Benefit Obligation basis and the cost of living is less than 4%, withdrawals from the bank are made to allow cost of living increases up to 4%. Changes in Plan Provisions: None during July 1, 2016 to June 30, NOTE: The summary of major plan provisions is designed to outline principal plan benefits as interpreted for purposes of the actuarial valuation. If the System should find the plan summary not in accordance with the actual provisions, the System should alert the actuary so that both can be sure the proper provisions are valued v4/
84 East Bay Municipal Utility District Retirement System Health Insurance Benefit Valuation Review of Contribution Rates and Funding Status June 30, 2017 This report has been prepared at the request of the Retirement Board to assist in administering the Fund. This valuation report may not otherwise be copied or reproduced in any form without the consent of the Retirement Board and may only be provided to other parties in its entirety. The measurements shown in this actuarial valuation may not be applicable for other purposes. Copyright 2018 by The Segal Group, Inc. All rights reserved.

85 100 MONTGOMERY STREET, SUITE 500 SAN FRANCISCO, CA T January 12, 2018 Ms. Sophia Skoda Director of Finance East Bay Municipal Utility District 375 Eleventh Street Oakland, California Dear Sophia: We are pleased to submit our Health Insurance Benefit Valuation as of June 30, 2017 for the prefunded $450 ($550 for a retiree with a spouse or EBMUD domestic partner) monthly health insurance subsidy. The Governmental Accounting Standards Board (GASB) requires employers, such as EBMUD, that pool health insurance premium rates for actives and retirees under age 65 to also calculate the liability associated with such pooled premiums for retirees under age 65 on an accrual basis. While that liability referred to as the implicit subsidy has to be disclosed, it is not required to be prefunded. The contribution rate developed in this report only includes the prefunding requirement for the $450/$550 benefit. The obligation required for financial disclosure purposes under GASB Statements No. 74 (plan reporting) and 75 (employer reporting) will be provided in separate reports. This valuation is based on financial statements and census data furnished by EBMUD. The actuarial calculations were completed under the supervision of Andy Yeung, ASA, MAAA, Enrolled Actuary and Anna Buzueva, ASA, MAAA, Enrolled Actuary. The health components of the valuation were reviewed under the supervision of Thomas Bergman, ASA, MAAA. The undersigned are members of the American Academy of Actuaries and meet the qualification requirements to render the actuarial opinion contained herein. Sincerely, Segal Consulting, a Member of the Segal Group, Inc. By: Andy Yeung, ASA, MAAA, FCA, EA Vice President and Actuary Anna Buzueva, ASA, MAAA, EA Assistant Actuary JAC/gxk
86 SECTION 1 SECTION 2 SECTION 3 VALUATION SUMMARY Contribution Recommendations and Funding Status... i Important Information about Actuarial Valuations... iii VALUATION RESULTS A. Introduction... 1 B. Financial Information... 2 C. Funding Ratio... 3 D. Recommended Contribution... 4 SUPPORTING EXHIBITS EXHIBIT I Table of Amortization Bases... 5 EXHIBIT II Actuarial Assumptions/Methods.. 6 EXHIBIT III Summary of Plan... 16
87 SECTION 1: Valuation Summary for the East Bay Municipal Utility District Health Insurance Benefit Valuation CONTRIBUTION RECOMMENDATIONS AND FUNDING STATUS The recommended employer contribution rate increased from 5.17% of payroll in the June 30, 2016 valuation to 5.23% of payroll in the June 30, 2017 valuation. We have maintained the allocation of 0.09% of the member contribution to the HIB plan used in last year s valuation. The Unfunded Actuarial Accrued Liability (UAAL) component of the District s contribution rate recommended in the June 30, 2017 valuation has been calculated with the layered amortization approach as explained in Section 2A. In the aggregate, the total payment from all the UAAL layers was about the same as amortizing the entire UAAL over a period of 15 years. The funded ratio measured on a valuation value of assets basis increased from 23.4% at June 30, 2016 to 26.7% at June 30, The funded ratio if measured on a market value of assets basis increased from 22.8% to 27.3%. The UAAL decreased from $88.65 million as of June 30, 2016 to $86.21 million as of June 30, 2017 primarily as a result of (i) updating the spouse/domestic partner coverage and age difference assumptions, (ii) an investment gain on the actuarial value of assets, and (iii) a contribution gain. As indicated in Section 2, Subsection B (see Chart 1) of this report, the total unrecognized investment gain as of June 30, 2017 is $32.0 million for the assets for the pension and HIB plans (note that in the previous valuation, this amount was a deferred loss of $34.7 million). This investment gain will be recognized in the determination of the actuarial value of assets for funding purposes in the next few years. This implies that earning the assumed rate of investment return of 7.25% per year (net of expenses) on a market value basis will produce investment gains on the actuarial value of assets after June 30, The deferred gains of $32.0 million represent 2.0% of the market value of assets as of June 30, Unless offset by future investment losses or other unfavorable experience, the recognition of the $32.0 million market gain is expected to have an impact on the System s future funded percentage and contribution rate requirements. This potential impact may be illustrated as follows: If the HIB plan portion of the deferred gains were recognized immediately and entirely in the valuation value of assets, the funded percentage would increase from 26.7% to 27.3%. If the HIB plan portion of the deferred gains were recognized immediately and entirely in the valuation value of assets, the aggregate recommend employer rate would decrease from 5.23% to about 5.21% of payroll. This report assumes the HIB subsidy limit will remain at the current levels of $450/$550. Future increases in the HIB subsidy will increase the cost of the plan as a percent of pay. i
88 SECTION 1: Valuation Summary for the East Bay Municipal Utility District Health Insurance Benefit Valuation The following tables summarizes the contribution rate recommendations for the employer and the employee: (1) Employer Contribution Rates: (payable at the end of each pay period) June 30, 2017 June 30, 2016 Estimated Estimated Total Rate Annual Amount (1) Total Rate Annual Amount (1) 1955/1980 Plan 5.32% $7,681, % $7,595, Tier 4.92% $1,992, % $1,967,000 Combined 5.23% $9,673, % $9,562,000 Average Member Contribution Rates: Estimated Estimated (payable at the end of each pay period) Total Rate Annual Amount (1) Total Rate Annual Amount (1) 1955/1980 Plan 0.09% $130, % $130, Tier 0.09% $36, % $36,000 Combined 0.09% $166, % $166,000 Based on June 30, 2017 projected payroll of $184,858,798, $144,384,277 for 1955/1980 Plan members and $40,474,521 for 2013 Tier members. The following table compares the valuation value of assets and liabilities for the Health Insurance Benefit as of June 30, 2017 and June 30, 2016: June 30, 2017 June 30, Valuation Value of Assets $31,451,690 $27,002, Actuarial Accrued Liabilities: Current Recipients $82,229,442 $78,603,930 Future Recipients $35,429,619 $37,051,207 Total $117,659,061 $115,655, Liabilities minus Valuation Value of Assets (2) (1) $86,207,371 $88,652, Funding Ratio (1) (2) 26.73% 23.35% ii
89 SECTION 1: Valuation Summary for the East Bay Municipal Utility District Health Insurance Benefit Valuation Important Information about Actuarial Valuations In order to prepare an actuarial valuation, Segal Consulting ( Segal ) relies on a number of input items. These include: Plan of benefits Plan provisions define the rules that will be used to determine benefit payments, and those rules, or the interpretation of them, may change over time. It is important to keep Segal informed with respect to plan provisions and administrative procedures, and to review the plan description in this report to confirm that Segal has correctly interpreted the plan of benefits. Participant data An actuarial valuation for a plan is based on data provided to the actuary by the System. Segal does not audit such data for completeness or accuracy, other than reviewing it for obvious inconsistencies compared to prior data and other information that appears unreasonable. It is important for Segal to receive the best possible data and to be informed about any known incomplete or inaccurate data. Assets This valuation is based on the market value of assets as of the valuation date, as provided by the System. Actuarial assumptions In preparing an actuarial valuation, Segal projects the benefits to be paid to existing plan participants for the rest of their lives and the lives of their beneficiaries. This projection requires actuarial assumptions as to the probability of death, disability, termination, and retirement of each participant for each year. The projected benefits are then discounted to a present value, based on the assumed rate of return that is expected to be achieved on the plan s assets. There is a reasonable range for each assumption used in the projection and the results may vary materially based on which assumptions are selected. It is important for any user of an actuarial valuation to understand this concept. Actuarial assumptions are periodically reviewed to ensure that future valuations reflect emerging plan experience. While future changes in actuarial assumptions may have a significant impact on the reported results, that does not mean that the previous assumptions were unreasonable. The user of Segal s actuarial valuation (or other actuarial calculations) should keep the following in mind: The valuation is prepared at the request of the Board to assist the sponsors of the Fund in preparing items related to the HIB plan in their financial reports. Segal is not responsible for the use or misuse of its report, particularly by any other party. An actuarial valuation is a measurement of the plan s assets and liabilities at a specific date. Accordingly, except where otherwise noted, Segal did not perform an analysis of the potential range of future financial measures. The actual long-term cost of the plan will be determined by the actual benefits and expenses paid and the actual investment experience of the plan. iii
90 SECTION 1: Valuation Summary for the East Bay Municipal Utility District Health Insurance Benefit Valuation If the System is aware of any event or trend that was not considered in this valuation that may materially change the results of the valuation, Segal should be advised, so that we can evaluate it. Segal does not provide investment, legal, accounting, or tax advice. Segal s valuation is based on our understanding of applicable guidance in these areas and of the plan s provisions, but they may be subject to alternative interpretations. The Board should look to their other advisors for expertise in these areas. As Segal Consulting has no discretionary authority with respect to the management or assets of the Retirement System, it is not a fiduciary in its capacity as actuaries and consultants with respect to the Retirement System. iv
91 SECTION 2: Valuation Results for the East Bay Municipal Utility District Health Insurance Benefit Valuation A. INTRODUCTION Pursuant to Section 36 of the Ordinance, the Retirement Board is authorized to administer a Health Insurance Benefit (HIB) through an IRC Section 401(h) account. The HIB may be used for the payment of sickness, accident, hospitalization, and medical expenses as permitted under the IRC and as authorized by the Retirement Board. In particular, the Retirement Board has authorized the use of the HIB towards the payment of medical insurance premiums. This report does not provide information required for disclosure under GASB Statements 74 and 75. Such information will be provided in separate reports. In this valuation, we have used a layered amortization approach to determine the contribution rate to fund the Unfunded Actuarial Accrued Liability (UAAL). Plan changes, assumption changes, and experience gains/losses prior to July 1, 2011 are amortized over separate decreasing 30-year amortization periods. On or after July 1, 2011, plan changes are amortized over separate decreasing 15-year periods; assumption changes are amortized over separate decreasing 25-year periods; and experience gains/losses (including year-to-year health assumption changes) are amortized over separate decreasing 20-year periods. The above payments would continue to be expressed as a level percent of a growing payroll base. The cost of the HIB is funded by both employer and employee contributions. The contribution rates for the employer are calculated to provide for the ongoing normal cost, plus any amounts necessary to fund any shortfall between the valuation value of assets and the actuarial accrued liabilities. A summary of the Health Insurance Benefit provisions is displayed in Section 3, Exhibit III. 1
92 SECTION 2: Valuation Results for the East Bay Municipal Utility District Health Insurance Benefit Valuation B. FINANCIAL INFORMATION It is desirable to have level and predictable plan costs from one year to the next. For this reason, the Board has approved an asset valuation method that gradually adjusts to market value. Under this valuation method, the full value of market fluctuations is not recognized in a single year and, as a result, the asset value and the plan costs are more stable. The amount of the adjustment to recognize market value is treated as income, which may be positive or negative. Realized and unrealized gains and losses are treated equally and, therefore, the sale of assets has no immediate effect on the actuarial value. The chart shows the determination of the actuarial value of assets as of the valuation date. CHART 1 Determination of Actuarial Value of Assets for Year Ended June 30, 2017 (for pension and HIB plans) 1. Market value of assets: (a) Pension plan $1,580,556,000 (b) HIB plan 32,088,000 (c) Total $1,612,644,000 Actual Market Expected Market Investment Deferred Deferred 2. Calculation of deferred return: Return (net) Return (net) Gain / (Loss) Factor Return (a) Year ended June 30, 2013 $137,318,000 $76,491,803 $60,826,197 0% $0 (b) Year ended June 30, ,575,000 87,289, ,285,161 20% 26,257,032 (c) Year ended June 30, ,937, ,068,500 (42,131,500) 40% (16,852,600) (d) Year ended June 30, ,894, ,466,650 (92,572,650) 60% (55,543,590) (e) Year ended June 30, ,254, ,606,314 97,647,686 80% 78,118,149 (f) Total unrecognized return* $31,978, Preliminary actuarial value: (1c) - (2f) $1,580,665, Adjustment to be within 30% corridor of market value 0 5. Final actuarial value of assets for pension and HIB plans: (3) + (4) $1,580,665, Actuarial value as a percentage of market value: (5) (1c) 98.0% 7. Valuation value of HIB plan assets: (1b) (1c) x (5) $31,451,690 * The amount of deferred return that will be recognized in each subsequent valuation is as follows (amounts may not total exactly due to rounding): 6/30/2018 $18,845,739 6/30/2019 (7,411,293) 6/30/2020 1,015,007 6/30/ ,529,537 Total $31,978,991 2
93 SECTION 2: Valuation Results for the East Bay Municipal Utility District Health Insurance Benefit Valuation C. FUNDING RATIO The funding of the Health Insurance Benefit comes from the following sources: 1. The valuation value of HIB assets, which equals $31,451,690 as of June 30, 2017; 2. Contributions from the employer; and 3. Contributions from the employees. The following table provides the funding status of the Health Insurance Benefit as of June 30, 2017 and June 30, 2016: June 30, 2017 June 30, Valuation Value of Assets $31,451,690 $27,002, Actuarial Accrued Liabilities: Current Recipients $82,229,442 $78,603,930 Future Recipients $35,429,619 $37,051,207 Total $117,659,061 $115,655, Liabilities minus Valuation Value of Assets (2) (1) $86,207,371 $88,652, Funding Ratio (1) (2) 26.73% 23.35% The contribution requirements are determined based on the Entry Age Funding Method. The excess of the actuarial accrued liability over assets (Item 3 in the above table) is amortized as a level percentage of payroll for current active members. The employer contribution rates are derived on the following page. 3
94 SECTION 2: Valuation Results for the East Bay Municipal Utility District Health Insurance Benefit Valuation D. RECOMMENDED CONTRIBUTION The amount of annual contribution required to fund the HIB is comprised of a net employer normal cost payment and a payment on the unfunded actuarial accrued liability. This total amount is then divided by the projected payroll for active members to determine the contribution rate of 5.23% of payroll for this year s valuation compared to 5.17% of payroll recommended for last year s valuation. The chart compares this valuation s recommended contribution with the prior valuation. CHART 2 Recommended Contribution (% of payroll) Payable at End of Pay Period 1955/1980 Plan June 30, 2017 June 30, / Tier Combined Plan Tier Combined 1. Total Normal Cost 1.23% 0.83% 1.14% 1.25% 0.85% 1.16% 2. Expected employee contributions -0.09% -0.09% -0.09% -0.09% -0.09% -0.09% 3. Employer normal cost: (1) + (2) 1.14% 0.74% 1.05% 1.16% 0.76% 1.07% 4. Unfunded/(overfunded) actuarial accrued liability 4.18% 4.18% 4.18% 4.10% 4.10% 4.10% 5. Total recommended contribution, end of each pay period 5.32% 4.92% 5.23% 5.26% 4.86% 5.17% 4
95 SECTION 3: Supporting Exhibits for the East Bay Municipal Utility District Health Insurance Benefit Valuation EXHIBIT I Table of Amortization Bases Type Date Established Initial Years Amortization Bases Initial Amount Outstanding Balance Years Remaining Annual Payment* Initial HIB Base 6/30/ $15,829,000 $15,938, $1,860,948 Combined Base 6/30/ (195,000) (203,864) 11 (22,003) Combined Base 6/30/ ,467,754 6,963, ,471 Combined Base 6/30/ ,543,694 6,104, ,279 Combined Base 6/30/ , , ,235 Combined Base 6/30/ ,413,242 20,864, ,763,575 Combined Base 6/30/ ,628,441 7,567, ,407 Combined Base 6/30/ ,942,176 2,281, ,708 Combined Base 6/30/ ,019,739 8,996, ,000 Combined Base 6/30/ (1,769,952) (2,023,410) 19 (143,954) Experience Loss 6/30/ ,878,105 3,272, ,722 Combined Base 6/30/ ,125,015 13,683, ,889 Combined Base 6/30/ (1,240,538) (1,386,367) 22 (89,277) Combined Base 6/30/ , , ,992 Combined Base 6/30/ (60,151) (65,595) 24 (3,993) Experience Gain 6/30/ (1,251,821) (1,217,899) 15 (102,943) Assumption Changes 6/30/ ,374,832 3,492, ,785 Experience Gain 6/30/ (1,155,658) (1,136,391) 16 (91,518) Experience Loss 6/30/ ,287 21, ,623 Assumption Changes 6/30/ ,555,790 2,615, ,423 Experience Gain 6/30/ (810,969) (807,686) 18 (59,700) Assumption Changes 6/30/ ,459,846 2,481, ,071 Experience Gain 6/30/ (1,569,600) (1,567,814) 19 (111,541) Assumption Changes 6/30/ (403,768) (403,768) 25 (23,959) Experience Gain 6/30/ (664,072) (664,072) 20 (45,595) Total $86,207,371 $7,462,645 * Beginning of year payment, reflecting level percentage of payroll Note: The equivalent single amortization period is about 15 years. 5
96 SECTION 3: Supporting Exhibits for the East Bay Municipal Utility District Health Insurance Benefit Valuation EXHIBIT II Actuarial Assumptions/Methods Rationale for Assumptions: Demographic Assumptions: Mortality Rates: After Service Retirement and All Beneficiaries Males Females After Disability Retirement: Males Females Pre-retirement Males Females The information and analysis used in selecting each assumption that has a significant effect on this actuarial valuation is shown in the July 1, 2012 through June 30, 2016 Actuarial Experience Study report dated November 10, 2016 and the Retiree Health assumptions letter dated December 15, Unless otherwise noted, all actuarial assumptions and methods shown below apply to both tiers. These assumptions were adopted by the Board. Headcount-weighted RP-2014 Healthy Annuitant Mortality Table projected 20 years with the two-dimensional improvement scale MP-2015, set forward two years for males Headcount-weighted RP-2014 Healthy Annuitant Mortality Table projected 20 years with the two-dimensional improvement scale MP-2015, set forward one year for females Headcount-weighted RP-2014 Healthy Annuitant Mortality Table projected 20 years with the two-dimensional improvement scale MP-2015, set forward nine years for males Headcount-weighted RP-2014 Healthy Annuitant Mortality Table projected 20 years with the two-dimensional improvement scale MP-2015, set forward nine years for females Headcount-weighted RP-2014 Employee Mortality Table projected 20 years with the two-dimensional improvement scale MP-2015, set forward two years for males Headcount-weighted RP-2014 Employee Mortality Table projected 20 years with the two-dimensional improvement scale MP-2015, set forward one year for females The above mortality tables contain a margin slightly less than 20% for males and females combined, based on actual to expected deaths, as a provision to reflect future mortality improvement, based on a review of mortality experience as of the measurement date. 6
97 SECTION 3: Supporting Exhibits for the East Bay Municipal Utility District Health Insurance Benefit Valuation Disability Rates: Termination Rates: Rate (%) Rate (%) Age Male Female Age Male Female Note: Disability rates applicable after eight years of service. Rate (%) Ordinary Withdrawal* Service Male Female Rate (%) Ordinary Withdrawal** Vested Termination Age Male Female Male Female * Applicable for members with less than five years of service. ** Applicable after five years of service. 7
98 SECTION 3: Supporting Exhibits for the East Bay Municipal Utility District Health Insurance Benefit Valuation Retirement Rates: Rate (%) 1955/1980 Plan 2013 Tier Age Male Female Male Female * * The rate for 1955/1980 Plan members age 54 with 30 or more years of service (i.e., eligible for unreduced benefits) is 50% for males and females. 8
99 SECTION 3: Supporting Exhibits for the East Bay Municipal Utility District Health Insurance Benefit Valuation Retirement Age for Inactive Vested Participants: 59 Unknown Data for Participants: Same as those exhibited by members with similar known characteristics. If not specified, members are assumed to be male. Spouse/Domestic Partner Coverage: 75% of males and 40% of females are assumed to elect spouse/domestic partner HIB coverage at retirement*. For current retirees, we relied upon the coverage indicated in the data. Age of Spouse/Domestic Partner: Future Benefit Accruals: Economic Assumptions: Net Investment Return: Inflation: 3.00% Across the Board Salary Increases: 0.50% Payroll Growth: 3.50% Spouses/domestic partners of male members are 3 years younger than the member. Spouses/domestic partners of female members are 2 years older than the member. 1.0 year of service per year.** 7.25%, net of investment and administrative expenses. * Based on past practice, this is not necessarily the same as the percent married/domestic partnership assumption used in the pension valuation. Some of those members may not elect HIB spouse/domestic partner coverage upon retirement due to the additional cost to the member. ** We have not applied the years of additional service for each year of employment, applied in the Pension valuation to anticipate conversion of unused sick leave, based on our understanding of the HIB plan provisions. 9
100 SECTION 3: Supporting Exhibits for the East Bay Municipal Utility District Health Insurance Benefit Valuation Salary Increases: Actuarial Value of Assets: Actuarial Cost Method: Annual Rate of Compensation Increase Inflation: 3.00% per year; plus across the board salary increases of 0.50% per year; plus the following merit and promotional increases based on years of service: Years of Service Merit and Promotional Increases % Market value of assets less unrecognized returns in each of the last five years. Unrecognized return is equal to the difference between the actual market return and the expected return on the market value, and is recognized over a five-year period, further adjusted, if necessary, to be within 30% of the market value. Entry Age Cost Method. Entry Age is the age at the member s hire date. Actuarial Accrued Liability is calculated on an individual basis and is based on costs allocated as a level percentage of compensation. The Normal Cost is calculated on an individual basis where the Entry Age Normal Cost is calculated as the sum of the individual Normal Costs. 10
101 SECTION 3: Supporting Exhibits for the East Bay Municipal Utility District Health Insurance Benefit Valuation Participation in Health Insurance Benefit Plan: Average HIB Subsidy: Projected HIB Subsidy Increase: 95% of future eligible retirees are assumed to enroll in the HIB plan. All current pensioners and beneficiaries with a retiree health insurance cash subsidy were valued. For deferred vested members, we assume an election equal to 50% of the future retiree election percent. The enrollment percent of 75% is used to estimate the proportion of future retirees expected to participate in the EBMUD medical insurance plans (Kaiser, Blue Cross, Health Net). The difference between the 95% of all future retirees expected to be provided with an HIB subsidy and 75% (i.e. 20%) is what we used to anticipate future retirees who receive reimbursement for medical expenses through the HIB plan without being enrolled in an EBMUD medical insurance plan. For current retirees, we have used the HIB benefit on record. For the expected 95% future retirees who received an HIB, we have assumed that: Retirees under age 65 with single HIB coverage will receive an average $448 monthly benefit as of July 1, 2017, Retirees under age 65 with spouse/domestic partner HIB coverage will receive an average $532 monthly benefit as of July 1, 2017, Retirees age 65 and over with single HIB coverage will receive an average $424 monthly benefit as of July 1, 2017, Retirees age 65 and over with spouse/domestic partner HIB coverage will receive an average $539 monthly benefit as of July 1, The maximum monthly HIB subsidy is $450 for a retiree with single coverage and $550 for a retiree with spouse/domestic partner coverage We have projected the HIB medical benefit to increase with medical trend until it reaches the limits described in the Summary of Plan Provisions. The benefit limits are projected to remain unchanged at the current levels of $450/$
102 SECTION 3: Supporting Exhibits for the East Bay Municipal Utility District Health Insurance Benefit Valuation Health care cost trend rates Trends to be applied in following fiscal years, to all health plans. Trend is to be applied to premium for shown fiscal year to calculate next fiscal year's projected premium First Fiscal Year (July 1, 2018 through June 30, 2019) Non-Medicare Medicare PLAN Kaiser HealthNet Blue Cross Kaiser HealthNet Blue Cross Trend to be applied to Fiscal Year premium 6.33% 7.56% 5.75% 7.25% 5.28% 5.74% The fiscal year trend rates are based on the following calendar year trend rates: Fiscal Year Trend Calendar Year Trend (applied to calculate following year premium) Non-Medicare Medicare Non- Medicare Medicare % 6.375% % 6.50% % 6.125% % 6.25% % 5.875% % 6.00% % 5.625% % 5.75% % 5.375% % 5.50% % 5.125% % 5.25% % 4.875% % 5.00% % 4.625% % 4.75% % 4.500% % 4.50% % 4.500% % 4.50% and later 4.500% 4.500% 2028 and later 4.50% 4.50% 12
103 SECTION 3: Supporting Exhibits for the East Bay Municipal Utility District Health Insurance Benefit Valuation Carrier Election And Monthly Premiums Participant Under Age 65: These premiums apply to the 75% of future retirees assumed to enroll in an EBMUD medical insurance plan Calendar Year Single Party Married/With Domestic Partner Eligible Survivor CARRIER Monthly Premium Monthly Premium Monthly Premium Kaiser $ $1, $ Blue Cross $ $1, $ Health Net $1, $2, $1, Calendar Year Single Party Married/With Domestic Partner Eligible Survivor CARRIER Monthly Premium Monthly Premium Monthly Premium Kaiser $ $1, $ Blue Cross $ $2, $ Health Net $1, $2, $1, Fiscal Year Single Party Married/With Domestic Partner Eligible Survivor Election CARRIER Percent Monthly Premium Monthly Premium Monthly Premium Kaiser 71 $ $1, $ Blue Cross 23 $ $1, $ Health Net 6 $1, $2, $1,
104 SECTION 3: Supporting Exhibits for the East Bay Municipal Utility District Health Insurance Benefit Valuation Carrier Election and Monthly Premiums Participant Age 65 and Older: These premiums apply to the 75% of future retirees assumed to enroll in an EBMUD medical insurance plan Calendar Year Single Party Married/With Domestic Partner Eligible Survivor CARRIER Monthly Premium Monthly Premium Monthly Premium Kaiser $ $ $ Blue Cross $ $1, $ Health Net $ $1, $ Calendar Year Single Party Married/With Domestic Partner Eligible Survivor CARRIER Monthly Premium Monthly Premium Monthly Premium Kaiser* $ $636.4 $ Blue Cross $ $1, $ Health Net $ $1, $ Fiscal Year Single Party Married/With Domestic Partner Eligible Survivor Election CARRIER Percent Monthly Premium Monthly Premium Monthly Premium Kaiser 63 $ $ $ Blue Cross 27 $ $1, $ Health Net 10 $ $1, $ * We assume all future Kaiser Medicare retirees will elect the High option. 14
105 SECTION 3: Supporting Exhibits for the East Bay Municipal Utility District Health Insurance Benefit Valuation Changes in Actuarial Assumptions Medical trends were updated. The average HIB subsidy for future retirees was updated. Updated spouse/domestic partner coverage assumption. Updated age of spouse/domestic partner assumption. 15
106 SECTION 3: Supporting Exhibits for the East Bay Municipal Utility District Health Insurance Benefit Valuation EXHIBIT III Summary of Plan Plan Year: July 1 through June 30 Census Date: June 30 Normal or Unreduced Retirement Eligibility: Age and Service Requirement 1955/1980 Plan Age 65; Age 62 with 5 years of service; Age 59 with 20 years of service; Age 54 with 30 years of service; Other combinations of age and service between ages 54 and Tier Age 67 with 5 years of service (for unreduced benefit). Early Retirement Eligibility: Age and Service Requirement 1955/1980 Plan Age 54 with 5 years of service Tier Age 52 with 5 years of service. Covered Members: All members with at least 5 years of service. Member Contribution Rate: 0.09% Employer Contribution Rate: 100% of total cost net of the 0.09% rate paid by the employee. 16
107 SECTION 3: Supporting Exhibits for the East Bay Municipal Utility District Health Insurance Benefit Valuation Benefit Formula: For members entering the System prior to July 1, 1996, a monthly allowance of up to $450 ($550 for married retirees and retirees with EBMUD domestic partners) is paid to retirees with at least five years of full-time service to reimburse member-paid medical expenses. For members entering the System after June 30, 1996, the members shall receive the full monthly allowance multiplied by the applicable percentage below based on years of full-time service. Years of Full-time Service Percent of HIB Less than 5 0% % % % 20 or more 100% An eligible surviving spouse/domestic partner may receive a Health Insurance Benefit of up to $450 per month v3/
108 East Bay Municipal Utility District Retirement System Governmental Accounting Standards (GAS) 67 Actuarial Valuation for the Pension Plan as of June 30, 2017 This report has been prepared at the request of the Retirement Board to assist in administering the Fund. This valuation report may not otherwise be copied or reproduced in any form without the consent of the Retirement Board and may only be provided to other parties in its entirety. The measurements shown in this actuarial valuation may not be applicable for other purposes. Copyright 2018 by The Segal Group, Inc. All rights reserved.
109 100 Montgomery Street Suite 500 San Francisco, CA T January 12, 2018 Ms. Sophia Skoda Director of Finance East Bay Municipal Utility District 375 Eleventh Street Oakland, CA Dear Sophia: We are pleased to submit this Governmental Accounting Standards (GAS) 67 Actuarial Valuation as of June 30, It contains various information that will need to be disclosed in order to comply with GAS 67. This report was prepared in accordance with generally accepted actuarial principles and practices at the request of the Board to assist in administering the System. The census and financial information on which our calculations were based was prepared by EBMUD. That assistance is gratefully acknowledged. The measurements shown in this actuarial valuation may not be applicable for other purposes. Future actuarial measurements may differ significantly from the current measurements presented in this report due to such factors as the following: plan experience differing from that anticipated by the economic or demographic assumptions; changes in economic or demographic assumptions; and changes in plan provisions or applicable law. The actuarial calculations were completed under the supervision of Andy Yeung, ASA, MAAA, FCA, Enrolled Actuary. I am a member of the American Academy of Actuaries and I meet the Qualification Standards of the American Academy of Actuaries to render the actuarial opinion herein. To the best of our knowledge, the information supplied in the actuarial valuation is complete and accurate. Further, in our opinion, the assumptions as approved by the Board are reasonably related to the experience of and expectations for the System. We look forward to reviewing this report at your next meeting and to answering any questions. Sincerely, Segal Consulting, a Member of The Segal Group, Inc. By: Andy Yeung, ASA, MAAA, FCA, EA Vice President and Actuary DNA/hy cc: Mr. Scott Klein, Controller
110 SECTION 1 SECTION 2 VALUATION SUMMARY GAS 67 INFORMATION Purpose... i General Observations on GAS 67 Actuarial Valuation... i Significant Issues in Valuation Year... ii Summary of Key Valuation Results... iii Important Information about Actuarial Valuations... iv EXHIBIT 1 General Information Financial Statements, Note Disclosures and Required Supplementary Information for a Single- Employer Pension Plan... 1 EXHIBIT 2 Net Pension Liability... 4 EXHIBIT 3 Schedules of Changes in Net Pension Liability Last Two Fiscal Years... 7 EXHIBIT 4 Schedule of EBMUD s Contributions Last Ten Fiscal Years... 8 EXHIBIT 5 Projection of Pension Plan s Fiduciary Net Position for Use in Calculation of Discount Rate as of June 30,
111 SECTION 1: Valuation Summary for the East Bay Municipal Utility District Retirement System Purpose This report has been prepared by Segal Consulting ( Segal ) to present certain disclosure information required by Statement No. 67 of the Governmental Accounting Standards Board as of June 30, This valuation is based on: The benefit provisions of the Pension Plan, as administered by the Board; The characteristics of covered active members, inactive vested members, and retired members and beneficiaries as of June 30, 2017, provided by EBMUD; The assets of the Plan as of June 30, 2017, provided by EBMUD; Economic assumptions regarding future salary increases and investment earnings; and Other actuarial assumptions, regarding employee terminations, retirement, death, etc. General Observations on GAS 67 Valuation The following points should be considered when reviewing this GAS 67 report: The Governmental Accounting Standards Board (GASB) rules only define pension liability and expense for financial reporting purposes, and do not apply to contribution amounts for pension funding purposes. Employers and plans still develop and adopt funding policies under current practices. When measuring pension liability, GASB uses the same actuarial cost method (Entry Age) and the same type of discount rate (expected return on assets) as EBMUD uses for funding. This means that the Total Pension Liability (TPL) measure for financial reporting shown in this report is determined on the same basis as EBMUD s Actuarial Accrued Liability (AAL) measure for funding. We note that the same is true for the Normal Cost component of the annual plan cost for funding and financial reporting. The Net Pension Liability (NPL) is equal to the difference between the TPL and the Plan s Fiduciary Net Position. The Plan s Fiduciary Net Position is equal to the market value of assets and therefore, the NPL measure is the same as the Unfunded Actuarial Accrued Liability (UAAL) calculated on a market value basis. The NPL reflects all investment gains and losses as of the measurement date. This is different from the UAAL calculated on a valuation value of assets basis in the funding valuation that reflects investment gains and losses over a five-year period. i
112 SECTION 1: Valuation Summary for the East Bay Municipal Utility District Retirement System The NPLs measured as of June 30, 2017 and 2016 have been determined from the actuarial valuations as of June 30, 2017 and June 30, 2016, respectively. Significant Issues in Valuation Year The following key findings were the result of this actuarial valuation: The NPL decreased from $604 million as of June 30, 2016 to $487 million as of June 30, This was mainly due to the approximate return on the market value of assets for the Pension Plan of 14.27% 1 during 2016/2017 that was more than the assumption of 7.25% used in the June 30, 2016 valuation (that gain was about $97 million for the Pension Plan). Changes in these values during the last two fiscal years ending June 30, 2016 and June 30, 2017 can be found in Exhibit 3. The discount rate used to determine the TPL and NPL as of June 30, 2017 and 2016 was 7.25%, following the same assumption used by the System in the pension funding valuations as of the same dates. The detailed calculations used in the derivation of the discount rate of 7.25% used in the calculation of the TPL and NPL as of June 30, 2017 can be found in Exhibit 5 of Section 2. Various other information that is required to be disclosed can be found throughout Exhibits 1 through 4 in Section 2. 1 Net of investment expenses and gross of administrative expenses. The rate of return net of both investment and administrative expenses was 14.16%. ii
113 SECTION 1: Valuation Summary for the East Bay Municipal Utility District Retirement System Summary of Key Valuation Results Disclosure elements for fiscal year ending June 30: Service cost (1) $41,105,676 $37,828, Total Pension Liability 2,068,014,945 1,995,863, Plan Fiduciary Net Position 1,580,556,000 1,391,771, Net Pension Liability 487,458, ,092,155 Schedule of contributions for fiscal year ending June 30: 5. Actuarially determined contributions $67,096,000 $65,218, Actual contributions 67,096,000 65,218, Contribution deficiency / (excess) 0 0 Demographic data for plan year ending June 30: 8. Number of retired members and beneficiaries 1,713 1, Number of vested terminated members Number of active members 1,802 1,789 Key assumptions as of June 30: 11. Investment rate of return 7.25% 7.25% 12. Inflation rate 3.00% 3.00% 13. Projected salary increases (2) Ranges from 9.50% to 4.00% based on years of service Ranges from 9.50% to 4.00% based on years of service (1) The service cost is based on the previous year s valuation, meaning the 2017 and 2016 values are based on the valuations as of June 30, 2016 and June 30, 2015, respectively. The 2017 service cost has been calculated using the assumptions shown in the 2016 column and the 2016 service cost has been calculated using the following assumptions: Key assumptions as of June 30, 2015: Investment rate of return 7.50% Inflation rate 3.00% Projected salary increases* Ranges from 9.50% to 4.00%, based on years of service * Includes inflation at 3.00% plus real across the board salary increases of 0.50% plus merit and promotional increases. (2) Includes inflation at 3.00% plus real across the board salary increase of 0.50% plus merit and promotional increases. iii
114 SECTION 1: Valuation Summary for the East Bay Municipal Utility District Retirement System Important Information about Actuarial Valuations An actuarial valuation is a budgeting tool with respect to the financing of future projected obligations of a pension plan. It is an estimated forecast the actual long-term cost of the plan will be determined by the actual benefits and expenses paid and the actual investment experience of the plan. In order to prepare an actuarial valuation, Segal relies on a number of input items. These include: Plan of benefits Plan provisions define the rules that will be used to determine benefit payments, and those rules, or the interpretation of them, may change over time. Even where they appear precise, outside factors may change how they operate. It is important to keep Segal informed with respect to plan provisions and administrative procedures, and to review the plan summary in this report (as well as the plan summary included in our funding valuation report) to confirm that Segal has correctly interpreted the plan of benefits. Participant data An actuarial valuation for a plan is based on data provided to the actuary by the System. Segal does not audit such data for completeness or accuracy, other than reviewing it for obvious inconsistencies compared to prior data and other information that appears unreasonable. It is important for Segal to receive the best possible data and to be informed about any known incomplete or inaccurate data. Assets This valuation is based on the market value of assets as of the valuation date, as provided by the System. The System uses a valuation value of assets that differs from market value to gradually reflect year-to-year changes in the market value of assets in determining contribution requirements. Actuarial assumptions In preparing an actuarial valuation, Segal projects the benefits to be paid to existing plan participants for the rest of their lives and the lives of their beneficiaries. This projection requires actuarial assumptions as to the probability of death, disability, termination, and retirement of each participant for each year. In addition, the benefits projected to be paid for each of those events in each future year reflect actuarial assumptions as to salary increases and cost-of-living adjustments. The projected benefits are then discounted to a present value, based on the assumed rate of return that is expected to be achieved on the plan s assets. There is a reasonable range for each assumption used in the projection and the results may vary materially based on which assumptions are selected. It is important for any user of an actuarial valuation to understand this concept. Actuarial assumptions are periodically reviewed to ensure that future valuations reflect emerging plan experience. While future changes in actuarial assumptions may have a significant impact on the reported results, that does not mean that the previous assumptions were unreasonable. iv
115 SECTION 1: Valuation Summary for the East Bay Municipal Utility District Retirement System The user of Segal s actuarial valuation (or other actuarial calculations) should keep the following in mind: The actuarial valuation is prepared at the request of the Board to assist the sponsors of the Fund in preparing items related to the pension plan in their financial reports. Segal is not responsible for the use or misuse of its report, particularly by any other party. An actuarial valuation is a measurement of the plan s assets and liabilities at a specific date. Accordingly, except where otherwise noted, Segal did not perform an analysis of the potential range of future financial measures. The actual long-term cost of the plan will be determined by the actual benefits and expenses paid and the actual investment experience of the plan. If the System is aware of any event or trend that was not considered in this valuation that may materially change the results of the valuation, Segal should be advised, so that we can evaluate it. Segal does not provide investment, legal, accounting, or tax advice. Segal s valuation is based on our understanding of applicable guidance in these areas and of the plan s provisions, but they may be subject to alternative interpretations. The Board should look to their other advisors for expertise in these areas. As Segal has no discretionary authority with respect to the management or assets of the Plan, it is not a fiduciary in its capacity as actuaries and consultants with respect to the Retirement System. v
116 SECTION 2: GAS 67 Information for the East Bay Municipal Utility District Retirement System EXHIBIT 1 General Information Financial Statements, Note Disclosures and Required Supplementary Information for a Single-Employer Pension Plan Plan Description Plan administration. The East Bay Municipal Utility District (the District) Employees' Retirement System (the System) was established in 1937 to administer a single-employer, contributory, defined benefit pension plan (the Pension Plan). The System provides retirement, disability, survivorship, and post-employment health insurance benefits 2 for eligible directors, officers, and employees of the District. The System is administered by a Retirement Board composed of three members appointed by the board of directors of the District, two members elected by and from the active membership, and one (nonvoting) member elected by and from the retired membership of the System. Retirement Ordinance No. 40 (Ordinance) assigns the authority to establish Plan benefit provisions to the District's board of directors. It should be noted that there are two systems in EBMUD (i.e., Water System and Wastewater System). The System is exempt from the regulations of the Employee Retirement Income Security Act of The System is also exempt from federal income taxes and California franchise taxes. The System is an integral part of the District and the District appoints the majority of the retirement board of the System and provides for its funding. Accordingly, the System's operations have been reported as a Pension and Other Employee Benefit Trust Fund in the District's basic financial statements. Plan membership. All regular full-time employees of the District are members of the Plan, in addition to certain job share and intermittent employees. Eligible employees become members on the first day they are physically on the job. At June 30, 2017, Pension Plan membership consisted of the following: Retired members and beneficiaries currently receiving benefits 1,713 Vested terminated members entitled to, but not yet receiving benefits 267 Active members 1,802 Total 3,782 2 The liabilities and expenses associated with providing post-employment health insurance benefits are reportable under GASB Statements 74 and 75. They have not been included in this report. 1
117 SECTION 2: GAS 67 Information for the East Bay Municipal Utility District Retirement System Benefits provided. EBMUD provides service retirement, disability, death and survivor benefits to eligible employees. There are two tiers in effect currently, the 1955/1980 Plan and the 2013 Tier. Employees who became members of the retirement system prior to January 1, 2013, or who have reciprocal membership are in the 1955/1980 Plan. Employees who became members on or after January 1, 2013 are in the 2013 Tier. 1955/1980 Plan members may elect voluntary reduced service retirement upon attaining the age of 54 and completing 5 years of continuous full-time employment. Members may elect voluntary unreduced service retirement upon attaining the age of 62 and completing 5 years of continuous full-time employment or age 65 without restriction. Members who continue to work upon attaining the normal retirement age of 65 continue to contribute to the Plan, and at the time they retire, computation of their retirement allowance is based upon their compensation and length of service as of the date of retirement. Service retirement allowances are computed by formulas specified in the Ordinance and are based on date of employment, length of employment, age at date of retirement, and compensation earned during employment Tier members may elect voluntary reduced service upon attaining the age of 52 and completing 5 years of continuous full-time employment. Members may elect voluntary unreduced service retirement upon attaining the age of 67, and completing 5 years of continuous full-time employment. Members who continue to work upon attaining the normal retirement age of 67 continue to contribute to the Plan, and at the time they retire, computation of their allowance is based upon their compensation and length of service as of the date of retirement. Service retirement allowances are computed by formulas specified in the Ordinance and are based on length of service, age at retirement, and compensation earned during employment. Members may receive disability retirement benefits prior to age 65 if the member is determined to be physically or mentally incapacitated, provided the member has 8 or more years of continuous full-time employment. The allowance for disability retirement is computed by a formula specified in the Ordinance and is based upon compensation earnable during employment, years of continuous service, and date upon which the retiring individual became a member. There is a guaranteed minimum disability benefit equal to the greater of one-third of terminal compensation (final average salary) or the retirement allowance, based on the disability formula. Death benefits are payable to the estate or beneficiary of a member who dies before retirement. Survivorship benefits are payable to the spouse/domestic partner of a member who dies after retirement, or who was eligible but had not retired from service, provided the spouse/domestic partner was married to/established domestic partnership with the member at the date of retirement and for at least one year prior to the member's death. EBMUD provides an annual cost-of-living benefit to all retirees. The cost-of-living adjustment is capped at 3.0% unless the System is more than 85% funded on a Projected Benefit Obligation basis, in which case the cost-of-living adjustment is capped at 5.0%. 2
118 SECTION 2: GAS 67 Information for the East Bay Municipal Utility District Retirement System The East Bay Municipal Utility District contributes to the Pension Plan based upon actuarially determined contribution rates adopted by the Retirement Board. Employer contribution rates are adopted annually based upon recommendations received from EBMUD s actuary after the completion of the annual actuarial valuation. The average employer contribution rate as of June 30, 2017 for (based on contribution rates adopted for the June 30, 2015 valuation) was 36.86% of pensionable compensation. All members are required to make contributions to EBMUD regardless of the Pension Plan or tier in which they are included. The average member contribution rate as of June 30, 2017 for (based on the June 30, 2015 valuation) was 8.69% of pensionable compensation. 3
119 SECTION 2: GAS 67 Information for the East Bay Municipal Utility District Retirement System EXHIBIT 2 Net Pension Liability The components of the Net Pension Liability are as follows: June 30, 2017 June 30, 2016 Total Pension Liability $2,068,014,945 $1,995,863,155 Plan Fiduciary Net Position -1,580,556,000-1,391,771,000 System s Net Pension Liability $487,458,945 $604,092,155 Plan Fiduciary Net Position as a percentage of the Total Pension Liability 76.43% 69.73% The Net Pension Liability was measured as of June 30, 2017 and The Plan s Fiduciary Net Position (plan assets) was valued as of the measurement date, while the Total Pension Liability was determined based upon the results of the actuarial valuations as of June 30, 2017 and 2016, respectively. Plan provisions. The plan provisions used in the measurement of the NPL as of June 30, 2017 and 2016 are the same as those used in the EBMUD funding valuations as of June 30, 2017 and 2016, respectively. Actuarial assumptions. The Total Pension Liabilities as of June 30, 2017 and June 30, 2016 were determined by actuarial valuations as of June 30, 2017 and June 30, 2016, respectively. The actuarial assumptions used in this June 30, 2017 valuation (and in the June 30, 2016 valuation) were based on the results of an experience study for the period from July 1, 2012 through June 30, They are the same as the assumptions used in the June 30, 2017 funding actuarial valuation for EBMUD. In particular, the following actuarial assumptions were applied to all periods included in the measurement: Inflation 3.00% Salary increases Ranges from 9.50% to 4.00% based on years of service, including inflation Investment rate of return 7.25%, net of Pension Plan investment expense, including inflation Other assumptions Same as those used in the June 30, 2017 actuarial valuation 4
120 SECTION 2: GAS 67 Information for the East Bay Municipal Utility District Retirement System The long-term expected rate of return on Pension Plan investments was determined using a building-block method in which expected future real rates of return (expected returns, net of Pension Plan investment expense and inflation) are developed for each major asset class. These ranges are combined to produce the long-term expected rate of return by weighting the expected future real rates of return by the target asset allocation percentage, and by adding expected inflation and subtracting expected investment expenses and a risk margin. The target allocation and projected arithmetic real rates of return, after deducting inflation, but before deducting investment expenses, used in the derivation of the long-term expected investment rate of return assumption are summarized in the following table: Asset Class Target Allocation Long-Term (Arithmetic) Expected Real Rate of Return Domestic Large Cap Equity 36% 5.78% Domestic Small Cap Equity 4% 6.45% Developed International Equity 12% 7.03% Emerging Markets Equity 3% 9.46% Domestic Bonds 10% 0.99% Non-Core Fixed Income 10% 3.46% Real Estate 5% 4.50% Covered Calls 20% 5.00% Total 100% Discount rate: The discount rate used to measure the Total Pension Liability was 7.25% as of June 30, 2017 and June 30, The projection of cash flows used to determine the discount rate assumed plan member contributions will be made at the current contribution rate and that employer contributions will be made at rates equal to the actuarially determined contribution rates. For this purpose, only employer contributions that are intended to fund benefits of current plan members and their beneficiaries are included. Projected employer contributions that are intended to fund the service costs of future plan members and their beneficiaries, as well as projected contributions from future plan members, are not included. Based on those assumptions, the Pension Plan's Fiduciary Net Position was projected to be available to make all projected future benefit payments for current plan members. Therefore, the long-term expected rate of return on Pension Plan investments was applied to all periods of projected benefit payments to determine the Total Pension Liability as of both June 30, 2017 and June 30,
121 SECTION 2: GAS 67 Information for the East Bay Municipal Utility District Retirement System Sensitivity of the Net Pension Liability to changes in the discount rate. The following presents the Net Pension Liability of EBMUD as of June 30, 2017, calculated using the discount rate of 7.25%, as well as what EBMUD s Net Pension Liability would be if it were calculated using a discount rate that is 1-percentage-point lower (6.25%) or 1-percentage-point higher (8.25%) than the current rate: 1% Decrease (6.25%) Current Discount (7.25%) 1% Increase (8.25%) Net Pension Liability as of June 30, 2017 $751,605,835 $487,458,945 $267,390,111 6
122 SECTION 2: GAS 67 Information for the East Bay Municipal Utility District Retirement System EXHIBIT 3 Schedules of Changes in EBMUD Net Pension Liability Last Two Fiscal Years Total Pension Liability Service cost (1) $41,105,676 $37,828,243 Interest 144,392, ,134,815 Change of benefit terms 0 0 Differences between expected and actual experience -22,641,070 5,278,052 Changes of assumptions 0 52,595,760 Benefit payments, including refunds of employee contributions -90,705,000-83,886,000 Net change in Total Pension Liability $72,151,790 $149,950,870 Total Pension Liability beginning 1,995,863,155 1,845,912,285 Total Pension Liability ending (a) $2,068,014,945 $1,995,863,155 Plan Fiduciary Net Position Contributions employer $67,096,000 $65,218,000 Contributions employee 15,820,000 14,741,000 Net investment income 197,977,000 13,934,000 Benefit payments, including refunds of employee contributions -90,705,000-83,886,000 Administrative expense -1,403,000-1,289,000 Other 0 0 Net change in Plan Fiduciary Net Position $188,785,000 $8,718,000 Plan Fiduciary Net Position beginning 1,391,771,000 1,383,053,000 Plan Fiduciary Net Position ending (b) $1,580,556,000 $1,391,771,000 Plan s Net Pension Liability ending (a) (b) $487,458,945 $604,092,155 Plan Fiduciary Net Position as a percentage of the Total Pension Liability 76.43% 69.73% Covered payroll (2) $182,031,838 $174,586,444 Plan Net Pension Liability as percentage of covered payroll % % (1) The service cost is based on the previous year s valuation, meaning the 2017 and 2016 values are based on the valuations as of June 30, 2016 and June 30, 2015, respectively. The 2017 service costs has been calculated using the assumptions shown on page iii in the 2016 column and the 2016 service cost has been calculated using the following assumptions: Key assumptions as of June 30, 2015: Investment rate of return 7.50% Inflation rate 3.00% Projected salary increases* Ranges from 9.50% to 4.00%, based on years of service * Includes inflation at 3.00% plus real across the board salary increases of 0.50% plus merit and promotional increases. (2) Pensionable payroll reported by EBMUD. 7
123 SECTION 2: GAS 67 Information for the East Bay Municipal Utility District Retirement System EXHIBIT 4 Schedule of EBMUD s Contributions Last Ten Fiscal Years Year Ended June 30 Actuarially Determined Contributions Contributions in Relation to the Actuarially Determined Contributions Contribution Deficiency / (Excess) Covered Payroll (1) Contributions as a Percentage of Covered Payroll 2008 $37,387,000 $37,387,000 $0 $152,538, % ,485,000 39,485, ,193, % ,031,000 44,031, ,641, % ,987,000 50,987, ,336, % ,156,000 52,156, ,481, % ,795,000 53,795, ,706, % ,660,000 61,660, ,513, % ,177,000 64,177, ,886, % ,218,000 65,218, ,586, % ,096,000 67,096, ,031, % See accompanying notes to this exhibit on next page. (1) For years ending prior to June 30, 2013, these amounts were backed into by dividing the contributions in relation to the actuarially determined contributions by the contributions as a percentage of covered payroll. These amounts represent only the pensionable payrolls. For years ending June 30, 2013 and later, these are the pensionable payroll amounts reported by EBMUD. Note: The contribution rates shown above for 2008 were extracted from the previous actuary s past valuation reports. 8
124 SECTION 2: GAS 67 Information for the East Bay Municipal Utility District Retirement System Notes to Exhibit 4 Methods and assumptions used to establish actuarially determined contribution (ADC) rates: Valuation date Actuarial cost method Amortization method Remaining amortization period Asset valuation method Actuarially determined contribution rates are calculated as of June 30, two years prior to the end of the fiscal year in which contributions are reported Entry Age Cost Method Level percent of payroll Actuarial assumptions: June 30, 2015 (for the year ended June 30, 2017 ADC) Plan changes, assumption changes, and experience gains/losses prior to July 1, 2011 are amortized over separate decreasing 30-year amortization periods. On or after July 1, 2011, plan changes are amortized over separate decreasing 15-year periods; assumption or method changes are amortized over separate decreasing 25-year periods; and experience gains/losses are amortized over separate decreasing 20-year periods. Market value of assets less unrecognized returns in each of the last five years. Unrecognized return is equal to the difference between the actual market return and the expected return on the market value, and is recognized over a five year period, further adjusted, if necessary, to be within 30% of the market value. June 30, 2014 (for the year ended June 30, 2016 ADC) Investment rate of return 7.50% 7.50% Inflation rate 3.00% 3.00% Real across-the-board salary increase 0.50% 0.50% Projected salary increases* Ranges from 9.50% to 4.00% based on years of service Ranges from 9.50% to 4.00% based on years of service Cost of living adjustments 3.00% per annum 3.00% per annum Mortality Healthy: RP-2000 Combined Healthy Mortality Table projected with scale AA to 2016, set back one year for males and set back two years for females Other assumptions Same as those used in the June 30, 2015 funding actuarial valuation * Includes inflation at 3.00% plus across the board salary increases of 0.50% plus merit and promotional increases. Healthy: RP-2000 Combined Healthy Mortality Table projected with scale AA to 2016, set back one year for males and set back two years for females Same as those used in the June 30, 2014 funding actuarial valuation 9
125 SECTION 2: GAS 67 Information for the East Bay Municipal Utility District Retirement System EXHIBIT 5 Projection of Pension Plan s Fiduciary Net Position for Use in Calculation of Discount Rate as of June 30, 2017 ($ in millions) Projected Beginning Projected Projected Projected Projected Projected Ending Year Plan Fiduciary Total Benefit Administrative Investment Plan Fiduciary Beginning Net Position Contributions Payments Expenses Earnings Net Position July 1, (a) (b) (c) (d) (e) (f) = (a) + (b) - (c) - (d) + (e) 2016 $1,392 $83 $91 $1 $198 $1, , , , , , , , , , , , , , , , , , , ,968 7 * , ,883 7 * , ,797 6 * , ,711 6 * , ,624 6 * , * 13 0 ** * 11 0 ** * 9 0 ** * 7 0 ** * 5 0 ** ** 1 0 ** 0 ** ** 0 ** 0 ** 0 ** ** 0 ** 0 ** 0 ** 0 ** ** 0 ** 0 ** 0 ** 0 ** 0 ** ** 0 ** 0 ** 0 ** 0 ** 0 ** * Mainly attributable to employer contributions to fund each year's annual administrative expenses. ** Less than $1 million, when rounded. Note that in preparing the above projections, we have not taken into consideration the one-year delay between the date of the contribution rate calculation and the implementation. 10
126 SECTION 2: GAS 67 Information for the East Bay Municipal Utility District Retirement System EXHIBIT 5 Projection of Pension Plan s Fiduciary Net Position for Use in Calculation of Discount Rate as of June 30, 2017 ($ in millions) - continued Notes: (1) (2) (3) (4) (5) (6) (7) (8) (9) Amounts may not total exactly due to rounding. Amounts shown for the year beginning July 1, 2016 row are actual amounts, based on the financial statements provided by EBMUD. Years , , and have been omitted from this table. Column (a): None of the projected beginning Plan Fiduciary Net Position amounts shown have been adjusted for the time value of money. Column (b): Projected total contributions include employee and employer normal cost contributions based on closed group projections (based on covered active members as of June 30, 2017); plus employer contributions to the unfunded actuarial accrued liability; plus contributions to fund each year's annual administrative expenses reflecting a 20-year amortization schedule. Contributions are assumed to occur halfway through the year, on average. Column (c): Projected benefit payments have been determined in accordance with paragraph 39 of GAS Statement No. 67, and are based on the closed group of active, inactive vested, retired members, and beneficiaries as of June 30, The projected benefit payments reflect the cost of living increase assumptions used in the June 30, 2017 funding valuation report. Benefit payments are assumed to occur halfway through the year, on average. In accordance with paragraph 31.b.(1)(e) of GASB Statement No. 67, the long-term expected rate of return on Plan investments of 7.25% was applied to all periods of projected benefit payments to determine the discount rate. Column (d): Projected administrative expenses are calculated as 0.10% of the projected beginning Plan Fiduciary Net Position amount. The 0.10% portion was based on the actual fiscal year 2016/2017 administrative expenses as a percentage of the beginning Plan Fiduciary Net Position amount as of July 1, Administrative expenses are assumed to occur halfway through the year, on average. Column (e): Projected investment earnings are based on the assumed investment rate of return of 7.25% per annum. As illustrated in this Exhibit, the Plan's Fiduciary Net Position was projected to be available to make all projected future benefit payments for current Plan members. In other words, there is no projected 'cross-over date' when projected benefits are not covered by projected assets. Therefore, the long-term expected rate of return on Plan investments of 7.25% per annum was applied to all periods of projected benefit payments to determine the Total Pension Liability as of June 30, 2017 shown earlier in this report, pursuant to paragraph 44 of GASB Statement No v3/

127 East Bay Municipal Utility District Retirement System Governmental Accounting Standards (GAS) 74 Actuarial Valuation for the Health Insurance Benefit Plan as of June 30, 2017 This report has been prepared at the request of the Retirement Board to assist in administering the Fund. This valuation report may not otherwise be copied or reproduced in any form without the consent of the Retirement Board and may only be provided to other parties in its entirety. The measurements shown in this actuarial valuation may not be applicable for other purposes. Copyright 2018 by The Segal Group, Inc. All rights reserved.
128 100 Montgomery Street Suite 500 San Francisco, CA T January 12, 2018 Ms. Sophia Skoda Director of Finance East Bay Municipal Utility District 375 Eleventh Street Oakland, CA Dear Sophia: We are pleased to submit this Governmental Accounting Standards (GAS) 74 Actuarial Valuation as of June 30, It contains various information that will need to be disclosed in order to comply with GAS 74. This report was prepared in accordance with generally accepted actuarial principles and practices at the request of the Board to assist in administering the System. The census and financial information on which our calculations were based was prepared by EBMUD. That assistance is gratefully acknowledged. The measurements shown in this actuarial valuation may not be applicable for other purposes. Future actuarial measurements may differ significantly from the current measurements presented in this report due to such factors as the following: plan experience differing from that anticipated by the economic or demographic assumptions; changes in economic or demographic assumptions; and changes in plan provisions or applicable law. The actuarial calculations were completed under the supervision of Andy Yeung, ASA, MAAA, Enrolled Actuary and Anna Buzueva, ASA, MAAA, Enrolled Actuary. The health components of the valuation were reviewed under the supervision of Thomas Bergman, ASA, MAAA, Enrolled Actuary. We are members of the American Academy of Actuaries and we meet the Qualification Standards of the American Academy of Actuaries to render the actuarial opinion herein. To the best of our knowledge, the information supplied in the actuarial valuation is complete and accurate. Further, in our opinion, the assumptions as approved by the Board are reasonably related to the experience of and expectations for the System. We look forward to reviewing this report at your next meeting and to answering any questions. Sincerely, Segal Consulting, a Member of The Segal Group, Inc. By: Andy Yeung, ASA, MAAA, FCA, EA Vice President and Actuary Anna Buzueva, ASA, MAAA, EA Assistant Actuary JAC/bqb cc: Mr. Scott Klein, Controller
129 SECTION 1 SECTION 2 VALUATION SUMMARY Purpose... i General Observations on GAS 74 Actuarial Valuations... i Significant Issues in Valuation Year... ii Summary of Key Valuation Results... iv Important Information about Actuarial Valuations... v GAS 74 INFORMATION EXHIBIT 1 General Information Financial Statements, Note Disclosures and Required Supplementary Information for a Single-Employer OPEB Plan... 1 EXHIBIT 2 Net OPEB Liability... 4 EXHIBIT 3 Schedules of Changes in Net OPEB Liability Last Two Fiscal Years... 8 ` EXHIBIT 4 Schedule of EBMUD s Contributions Last Ten Fiscal Years... 9 EXHIBIT 5 Projection of OPEB Plan s Fiduciary Net Position for Use in Calculation of Discount Rate as of June 30, EXHIBIT 6 Projection of Contributions Implicit Subsidy Only Projection of Contributions and Benefit Payments - Total... 14
130 SECTION 1: Valuation Summary for the East Bay Municipal Utility District Retirement System Purpose This report has been prepared by Segal Consulting to present certain disclosure information required by Statement No. 74 of the Governmental Accounting Standards Board as of June 30, This valuation is based on: The benefit provisions of the Health Insurance Benefit (HIB) or Other Postemployment Benefits (OPEB) Plan, as administered by the Board; The characteristics of covered active members, inactive vested members, and retired members and beneficiaries as of June 30, 2017, provided by EBMUD; The assets of the Plan as of June 30, 2017, provided by EBMUD; Economic assumptions regarding future salary increases and investment earnings; and Other (health and non-health) actuarial assumptions, regarding employee terminations, retirement, death, health care trend and enrollment, etc. General Observations on GAS 74 Actuarial Valuations The following points should be considered when reviewing this GAS 74 report: The Governmental Accounting Standards Board (GASB) rules only define OPEB liability and expense for financial reporting purposes, and do not apply to contribution amounts for OPEB funding purposes. Employers and plans still develop and adopt funding policies under current practices. When measuring the Total OPEB Liability, GASB uses the same actuarial cost method (Entry Age) for benefits that are being funded on an actuarial basis 1 and the same expected return on Plan assets as EBMUD uses for funding. This means that the Total OPEB Liability (TOL) measure for financial reporting shown in this report is determined on the same basis as EBMUD s Actuarial Accrued Liability (AAL) measure for funding with the exception discussed below on the implicit subsidy. We note that the same is true for the Normal Cost component of the annual plan cost for funding and financial reporting again with the exception discussed below on the implicit subsidy. 1 The $450/$550 HIB subsidy. i
131 SECTION 1: Valuation Summary for the East Bay Municipal Utility District Retirement System Pursuant to Paragraph 46 of GASB Statement No. 74, projected benefit payments should be based on claims costs or age-adjusted premiums approximating claims costs. In effect, GASB requires employers, such as EBMUD, that pool health insurance premium rates for actives and retirees under age 65 to calculate on an accrual basis the liability associated with such pooled premiums for retirees under age 65. That liability, referred to as the implicit subsidy, is included in this valuation in addition to the liability for the $450/$550 subsidy. 2 Pursuant to Paragraph 48 of the GASB Statement No. 74 and based on our understanding of subsequent guidance provided in Implementation Guide No , Financial Reporting for Postemployment Benefit Plans Other Than Pension Plans, OPEB plans that are not being fully funded on an actuarial basis (such as the implicit subsidy component of the HIB for EBMUD that are being paid on a pay-as-you go basis) are required to go through a crossover test in determining the discount rate that would be used in the valuation. The Net OPEB Liability (NOL) is equal to the difference between the TOL and the Plan s Fiduciary Net Position. The Plan s Fiduciary Net Position is equal to the market value of assets. The NOL reflects all investment gains and losses as of the measurement date. Significant Issues in Valuation Year The following findings were the results of this actuarial valuation. Following the method outlined in the Implementation Guide, we have calculated a discount rate of 5.53% 3 instead of 7.25% used in the June 30, 2017 funding valuation. The discount rates used to determine the TOL and NOL as of June 30, 2017 and 2016 were 5.53% and 5.12%, respectively. The detailed calculations used in the derivation of the cross-over date used in determining the discount rate of 5.53% used in the calculation of the TOL and NOL as of June 30, 2017 can be found in Exhibit 5 of Section 2. Various other information that is required to be disclosed can be found throughout Exhibits 1 through 4 in Section 2. The discount rate used in the valuation for financial disclosure purposes as of June 30, 2017 is a blend of the assumed investment return on Plan assets (e.g. 7.25% for the June 30, 2017 valuation) and the rate for 20-year, tax-exempt general 2 We note that the calculation and the disclosure of the liability related to the implicit subsidy were also required under the prior GASB statement No We note that the calculation of a lower discount rate was also required under the prior GASB Statement No. 43. However, the method and the assumption that we are required to follow under GASB Statement No. 74 are different from those under the prior Statement. ii
132 SECTION 1: Valuation Summary for the East Bay Municipal Utility District Retirement System obligation municipal bonds with an average rating of AA/Aa or higher (e.g. 3.58% as of June 30, 2017). Because EBMUD is not prefunding the implicit subsidy, Plan assets, when projected in accordance with the method prescribed by GASB 74, are expected to be sufficient to make benefit payment through June 30, Projected benefit payments are discounted by the Plan investment return assumption of 7.25% until June 30, Benefit payments after June 30, 2042 are then discounted by the municipal bond rate of 3.58%. The 5.53% discount rate used in this valuation is the blended discount rate reflecting benefits discounted by the Plan investment return assumption rate and the bond rate. The NOL has decreased from $145.1 million as of June 30, 2016 to $135.8 million as of June 30, The decrease in NOL is primarily as a result of an increase in the discount rate between the 2016 and 2017 valuations. iii
133 SECTION 1: Valuation Summary for the East Bay Municipal Utility District Retirement System Summary of Key Valuation Results Disclosure elements for fiscal year ending June 30: Service cost (1) $5,275,768 $4,514, Total OPEB Liability 167,893, ,443, Plan Fiduciary Net Position 32,088,000 26,358, Net OPEB Liability 135,805, ,085,453 Schedule of contributions for fiscal year ending June 30: 5. Actuarially determined contributions $9,764,000 $9,454, Actual contributions 9,764,000 9,454, Contribution deficiency (excess) $0 $0 Demographic data for plan year ending June 30: 8. Number of retired members, married dependents and beneficiaries receiving a health subsidy 1,548 1, Number of vested terminated members Number of active members 1,802 1,789 Key assumptions as of June 30: 11. Discount rate 5.53% 5.12% 12. Health care premium trend rates Non-Medicare Graded from 7.00% to 4.50% Graded from 6.50% to 5.00% Medicare Graded from 6.50% to 4.50% Graded from 6.50% to 5.00% 13. Health Insurance Benefit (HIB) subsidy increase 0.00% 0.00% (1) The service cost is based on the previous year s valuation, meaning the June 30, 2017 value is based on the valuation as of June 30, 2016, whereas the June 30, 2016 value is based on the June 30, 2015 valuation. iv
134 SECTION 1: Valuation Summary for the East Bay Municipal Utility District Retirement System Important Information about Actuarial Valuations An actuarial valuation is a budgeting tool with respect to the financing of future projected obligations of an OPEB plan. It is an estimated forecast the actual long-term cost of the plan will be determined by the actual benefits and expenses paid and the actual investment experience of the plan. In order to prepare an actuarial valuation, Segal Consulting ( Segal ) relies on a number of input items. These include: Plan of benefits Plan provisions define the rules that will be used to determine benefit payments, and those rules, or the interpretation of them, may change over time. Even where they appear precise, outside factors may change how they operate. It is important to keep Segal informed with respect to plan provisions and administrative procedures, and to review the plan summary in this report (as well as the plan summary included in our funding valuation report) to confirm that Segal has correctly interpreted the plan of benefits. Participant data An actuarial valuation for a plan is based on data provided to the actuary by the System. Segal does not audit such data for completeness or accuracy, other than reviewing it for obvious inconsistencies compared to prior data and other information that appears unreasonable. It is important for Segal to receive the best possible data and to be informed about any known incomplete or inaccurate data. Assets This valuation is based on the market value of assets as of the valuation date, as provided by the System. The System uses a valuation value of assets that differs from market value to gradually reflect year-to-year changes in the market value of assets in determining contribution requirements. Actuarial assumptions In preparing an actuarial valuation, Segal projects the benefits to be paid to existing plan participants for the rest of their lives and the lives of their beneficiaries. This projection requires actuarial assumptions as to the probability of death, disability, termination, and retirement of each participant for each year. In addition, the benefits projected to be paid for each of those events in each future year reflect actuarial assumptions as to health care trends and member enrollment in retiree health benefits. The projected benefits are then discounted to a present value, based on the assumed rate of return that is expected to be achieved on the plan s assets. There is a reasonable range for each assumption used in the projection and the results may vary materially based on which assumptions are selected. It is important for any user of an actuarial valuation to understand this concept. Actuarial assumptions are periodically reviewed to ensure that future valuations reflect emerging plan experience. While future changes in actuarial assumptions may have a significant impact on the reported results, that does not mean that the previous assumptions were unreasonable. v
135 SECTION 1: Valuation Summary for the East Bay Municipal Utility District Retirement System The user of Segal s actuarial valuation (or other actuarial calculations) should keep the following in mind: The actuarial valuation is prepared at the request of the Board to assist the sponsors of the Fund in preparing items related to the OPEB plan in their financial reports. Segal is not responsible for the use or misuse of its report, particularly by any other party. An actuarial valuation is a measurement of the plan s assets and liabilities at a specific date. Accordingly, except where otherwise noted, Segal did not perform an analysis of the potential range of future financial measures. The actual long-term cost of the plan will be determined by the actual benefits and expenses paid and the actual investment experience of the plan. If the System is aware of any event or trend that was not considered in this valuation that may materially change the results of the valuation, Segal should be advised, so that we can evaluate it. Segal does not provide investment, legal, accounting, or tax advice. Segal s valuation is based on our understanding of applicable guidance in these areas and of the plan s provisions, but they may be subject to alternative interpretations. The Board should look to their other advisors for expertise in these areas. As Segal Consulting has no discretionary authority with respect to the management or assets of the Plan, it is not a fiduciary in its capacity as actuaries and consultants with respect to the Retirement System. vi
136 SECTION 2: GAS 74 Information for the East Bay Municipal Utility District Retirement System EXHIBIT 1 General Information Financial Statements, Note Disclosures and Required Supplementary Information for a Single-Employer OPEB Plan Plan Description Plan administration. The East Bay Municipal Utility District (the District) Employees' Retirement System (the System) was established in 1937 to administer a single-employer, contributory, defined benefit pension plan (the Pension Plan). The System provides retirement, disability, survivorship, and post-employment health insurance benefits (4) for eligible directors, officers, and employees of the District. The System is administered by a Retirement Board composed of three members appointed by the board of directors of the District, two members elected by and from the active membership, and one (nonvoting) member elected by and from the retired membership of the System. Retirement Ordinance No. 40 (Ordinance) assigns the authority to establish Plan benefit provisions to the District's board of directors. It should be noted that there are two systems in EBMUD (i.e., Water System and Wastewater System). The System is exempt from the regulations of the Employee Retirement Income Security Act of The System is also exempt from federal income taxes and California franchise taxes. The System is an integral part of the District and the District appoints the majority of the retirement board of the System and provides for most of its funding. Accordingly, the System's operations have been reported as a Pension and Other Employee Benefit Trust Fund in the District's basic financial statements. Plan membership. All regular full-time employees of the District are members of the Plan, in addition to certain job share and intermittent employees. Eligible employees become members on the first day they are physically on the job. At June 30, 2017, OPEB Plan membership consisted of the following: Retired members, married dependents and beneficiaries currently receiving benefits 1,548 Vested terminated members entitled to, but not yet receiving benefits 267 Active members 1,802 Total 3,617 (4) The liabilities and expenses associated with providing retirement, disability and survivorship benefits are reportable under GASB Statements 67 and 68. They have not been included in this report. 1
137 SECTION 2: GAS 74 Information for the East Bay Municipal Utility District Retirement System Benefits provided. EBMUD provides post-employment health insurance benefits to eligible employees. There are two tiers in effect currently, the 1955/1980 Plan and the 2013 Tier. Employees who became members of the retirement system prior to January 1, 2013, or who have reciprocal membership are in the 1955/1980 Plan. Employees who became members on or after January 1, 2013 are in the 2013 Tier. 1955/1980 Plan members may elect voluntary service retirement upon attaining the age of 54 and completing 5 years of continuous full-time employment Tier members may elect voluntary reduced service retirement upon attaining the age of 52 and completing 5 years of continuous full-time employment. Members may receive disability retirement benefits prior to age 65 if the member is determined to be physically or mentally incapacitated, provided the member has 8 or more years of continuous full-time employment. Death benefits are payable to the eligible beneficiary of a member who dies before retirement. Survivorship benefits are payable to the spouse/domestic partner of a member who dies after retirement, or who was eligible but had not retired from service, provided the spouse/domestic partner was married to/established domestic partnership with the member at the date of retirement and for at least one year prior to the member's death. The District provides post-employment health benefits assistance (administered by the Employees Retirement System) for employees who retire from the District or their surviving spouses. As of June 30, 2017 there were 1,548 participants receiving these health care benefits. Effective July 1, 1996, a 20-year vesting schedule for full benefits was implemented for all new participants with a lesser benefit paid for less than 20 years of service. Effective January 1, 1999, retired members who had separated from the District prior to their retirement and who had at least 10 years of service also became eligible for the post-employment health benefits based on the same sliding scale. The scale provides for 25% of healthcare benefits for service from 5 through 10 years, 50% of healthcare benefits for service from 10 to 15 years, 75% of healthcare benefits for service from 15 through 20 years, and 100% of healthcare benefits for service of 20 years or more. Effective July 1, 2003, the District reimbursed up to $450 per month ($550 per month effective July 1, 2004, for members with a spouse or registered domestic partner) for any health, dental, or long-term care insurance premiums paid by the retiree for themselves, current spouse, or domestic partner, or any health, dental, or long-term care insurance premiums paid by the eligible surviving spouse of a retiree. These benefits are paid from a separate post-employment healthcare benefits fund which up until June 17, 2002, was advance funded entirely by the District on an actuarially determined basis without considering the implicit subsidy. Cash reimbursement of these benefits totaled $7,912,000 in the year ended June 30, Effective June 18, 2002, a portion of the post-employment healthcare benefit costs is recovered through employee contributions. 2
138 SECTION 2: GAS 74 Information for the East Bay Municipal Utility District Retirement System The East Bay Municipal Utility District contributes to the Plan based upon actuarially determined contribution rates adopted by the Retirement Board. Employer contribution rates are adopted annually based upon recommendations received from EBMUD s actuary (Segal) after the completion of the annual actuarial valuation. The average employer contribution rate (not reflecting any estimated implicit subsidies) as of June 30, 2017 for (based on the June 30, 2015 valuation) was 5.36% of pensionable compensation. All members are required to make contributions to EBMUD regardless of the Pension Plan or tier in which they are included. The average member contribution rate as of June 30, 2017 for (based on the June 30, 2015 valuation) was 0.11% of pensionable compensation. 3
139 SECTION 2: GAS 74 Information for the East Bay Municipal Utility District Retirement System EXHIBIT 2 Net OPEB Liability The components of the Net OPEB Liability are as follows: June 30, 2017 June 30, 2016 Total OPEB Liability $167,893,924 $171,443,453 Plan Fiduciary Net Position $32,088,000 26,358,000 System s Net OPEB Liability $135,805,924 $145,085,453 Plan Fiduciary Net Position as a percentage of the Total OPEB Liability 19.11% 15.37% The Net OPEB Liability was measured as of June 30, 2017 and The Plan s Fiduciary Net Position (plan assets) was valued as of the measurement date, while the Total OPEB Liability was determined based upon the results of the funding actuarial valuations as of June 30, 2017 and 2016, respectively, with the following exceptions: Discount rate has been calculated as a blend of the investment return on plan assets and municipal bond rate in accordance with GAS 74 and Illustration 2 of Implementation Guide No , Financial Reporting Postemployment Benefit Plans Other Than Pension Plans. The implicit subsidy benefit payments are based on the age-based costs. Plan provisions. The plan provisions used in the measurement of the TOL as of June 30, 2017 and 2016 are the same as those used in the EBMUD funding valuations as of June 30, 2017 and 2016, respectively. Actuarial assumptions. The Total OPEB Liability as of June 30, 2017 was determined by an actuarial valuation as of June 30, The actuarial assumptions used in the June 30, 2017 valuation were based on the results of an experience study for the period from July 1, 2012 through June 30, They are the same as the assumptions used in the June 30, 2017 funding actuarial valuation for EBMUD except the discount rate is calculated as a blend of the investment return on plan assets and municipal bond rate in accordance with GAS 74, and implicit subsidy benefit payments are based on the age-based costs. In particular, the following actuarial assumptions were applied to all periods included in the measurement: Inflation 3.00% Salary increases Ranges from 9.50% to 4.00% based on years of service, including inflation Discount rate 5.53%, net of OPEB Plan investment expense, including inflation Other assumptions Same as those used in the June 30, 2017 actuarial valuation Health care trend Non-Medicare: 7.00% graded to ultimate 4.50% over 10 years Medicare: 6.50% graded to ultimate 4.50% over 8 years HIB increases 0.00% 4
140 SECTION 2: GAS 74 Information for the East Bay Municipal Utility District Retirement System The Total OPEB Liability as of June 30, 2016 was determined by an actuarial valuation as of June 30, The actuarial assumptions used in the June 30, 2016 valuation were based on the results of an experience study for the period from July 1, 2012 through June 30, They are the same as the assumptions used in the June 30, 2016 funding actuarial valuation for EBMUD except the discount rate is calculated as a blend of the investment return on plan assets and municipal bond rate in accordance with GAS 74, and implicit subsidy benefit payments are based on the age-based costs shown in the June 30, 2016 GAS 43/45 valuation report. In particular, the following actuarial assumptions were applied to all periods included in the measurement: Inflation 3.00% Salary increases Ranges from 9.50% to 4.00% based on years of service, including inflation Discount rate 5.12%, net of OPEB Plan investment expense, including inflation Other assumptions Same as those used in the June 30, 2016 actuarial valuation Health care trend 6.50% graded to ultimate 5.00% over 6 years HIB increases 0.00% The long-term expected rate of return on OPEB Plan investments was determined using a building-block method in which expected future real rates of return (expected returns, net of OPEB Plan investment expense and inflation) are developed for each major asset class. These ranges are combined to produce the long-term expected rate of return by weighting the expected future real rates of return by the target asset allocation percentage, and by adding expected inflation and subtracting expected investment expenses and a risk margin. The target allocation and projected arithmetic real rates of return, after deducting inflation, but before deducting investment expenses, used in the derivation of the long-term expected investment rate of return assumption are summarized in the following table: Asset Class Target Allocation Long-Term (Arithmetic) Expected Real Rate of Return Domestic Large Cap Equity 36% 5.78% Domestic Small Cap Equity 4% 6.45% Developed International Equity 12% 7.03% Emerging Markets Equity 3% 9.46% Domestic Bonds 10% 0.99% Non-Core Fixed Income 10% 3.46% Real Estate 5% 4.50% Covered Calls 20% 5.00% Total 100% 5
141 SECTION 2: GAS 74 Information for the East Bay Municipal Utility District Retirement System Municipal Bond Rate: 3.58% and 2.85% based on the 20-year municipal bond rate for the Bond Buyer 20-Bond GO Index as of June 30, 2017 and June 30, 2016 respectively. Discount rate: The discount rate used to measure the Total OPEB Liability was 5.53% as of June 30, 2017 and 5.12% as of June 30, The projection of cash flows used to determine the discount rate assumed plan member contributions will be made at the current contribution rate and that employer contributions will be made at rates equal to the actuarially determined contribution rates for the $450/$550 HIB Subsidy excluding the implicit subsidy that will continue to be paid on a pay-as-you go basis. For this purpose, only employer contributions that are intended to fund benefits of current plan members and their beneficiaries are included. Projected employer contributions that are intended to fund the service costs of future plan members and their beneficiaries, as well as projected contributions from future plan members, are not included. Only the implicit subsidies for current members were included as employer contributions since the employer is funding the implicit subsidy on a pay-as-you go basis*. Based on those assumptions, the OPEB Plan's assets was projected to be sufficient to make projected future benefit payments for current plan members through June 30, Payments after that date would be funded by employer assets. Therefore, the long-term expected rate of return on OPEB Plan investments (7.25%) was applied to periods of projected benefit payments through June 30, 2042, and the 20-year municipal bond rate (3.58%) was applied to periods after June 30, 2042 to determine the Total OPEB Liability. * See Exhibit 6 for derivation. 6
142 SECTION 2: GAS 74 Information for the East Bay Municipal Utility District Retirement System Sensitivity of the Net OPEB Liability to changes in the discount rate. The following presents the Net OPEB Liability of EBMUD as of June 30, 2017, calculated using the discount rate of 5.53%, as well as what EBMUD s Net OPEB Liability would be if it were calculated using a discount rate that is 1-percentage-point lower (4.53%) or 1-percentage-point higher (6.53%) than the current rate: 1% Decrease (4.53%) Current Discount (5.53%) 1% Increase (6.53%) Net OPEB Liability as of June 30, 2017 $152,785,930 $135,805,924 $121,245,720 Sensitivity of the Net OPEB Liability to changes in the trend rate (only applied to implicit subsidy and not the $450/$550 cash subsidy). The following presents the Net OPEB Liability of EBMUD as of June 30, 2017, calculated using the current trend rates as well as what EBMUD s Net OPEB Liability would be if it were calculated using a trend rate that is 1-percentage-point lower or 1-percentage-point higher than the current rate: 1% Decrease* Current Discount* 1% Increase* Net OPEB Liability as of June 30, 2017 $133,261,500 $135,805,924 $138,660,804 *Current trend rates: 7.00% graded down to 4.50% over 10 years for Non-Medicare medical plan costs and 6.50% graded down to 4.50% over 8 years for Medicare medical plan costs. 7
143 SECTION 2: GAS 74 Information for the East Bay Municipal Utility District Retirement System EXHIBIT 3 Schedules of Changes in EBMUD Net OPEB Liability Last Two Fiscal Years Total OPEB Liability Service cost $5,275,768 $4,514,339 Interest 8,797,042 9,373,807 Change of benefit terms 0 0 Changes due to experience gain and assumption changes other than experience study -1,177,322-3,285,608 Changes due to experience study (including higher discount rate) -6,641,043 12,471,767 Benefit payments cash -7,912,000-7,685,000 Benefit payments estimated implicit subsidy -1,891,974-2,164,432 Net change in Total OPEB Liability ($3,549,529) $13,224,873 Total OPEB Liability beginning 171,443, ,218,580 Total OPEB Liability ending (a) $167,893,924 $171,443,453 Plan Fiduciary Net Position Employer contributions cash $9,764,000 $9,454,000 Employer contributions estimated implicit subsidy 1,891,974 2,164,432 Employer contributions total 11,655,974 $11,618,432 Employee contributions 198, ,000 Net investment income 3,706, ,000 Benefit payments cash -7,912,000-7,685,000 Benefit payments estimated implicit subsidy -1,891,974-2,164,432 Administrative expense -26,000-22,000 Other 0 0 Net change in Plan Fiduciary Net Position $5,730,000 $2,202,000 Plan Fiduciary Net Position beginning 26,358,000 24,156,000 Plan Fiduciary Net Position ending (b) $32,088,000 $26,358,000 Plan s Net OPEB Liability ending (a) (b) $135,805,924 $145,085,453 Plan Fiduciary Net Position as a percentage of the Total OPEB Liability 19.11% 15.37% Covered payroll (1) $182,031,838 $174,586,444 Plan Net OPEB Liability as percentage of covered payroll 74.61% 83.10% (1) Pensionable payroll reported by EBMUD. 8
144 SECTION 2: GAS 74 Information for the East Bay Municipal Utility District Retirement System EXHIBIT 4 Schedule of EBMUD s Contributions Last Ten Fiscal Years Year Ended June 30 Actuarially Determined Contributions Contributions in Relation to the Actuarially Determined Contributions Contribution Deficiency (Excess) Covered Payroll (1) Contributions as a Percentage of Covered-Employee Payroll 2008 $7,216,000 $7,216,000 $0 $152,538, % ,318,000 6,318, ,193, % ,725,000 7,725, ,641, % ,494,000 7,494, ,336, % ,495,000 7,495, ,481, % ,772,000 7,772, ,706, % ,457,000 8,457, ,513, % ,964,000 8,964, ,886, % ,454,000 9,454, ,586, % ,764,000 9,764, ,031, % See accompanying notes to this exhibit on next page. (1) For years ending prior to June 30, 2013, these amounts were backed into by dividing the contributions in relation to the actuarially determined contributions by the contributions as a percentage of covered payroll. These amounts represent only the pensionable payrolls. For years ending June 30, 2013 and later, these are the pensionable payroll amounts reported by EBMUD. 9
145 SECTION 2: GAS 74 Information for the East Bay Municipal Utility District Retirement System Notes to Exhibit 4 Methods and assumptions used to establish actuarially determined contribution (ADC) rates: Valuation date Actuarial cost method Amortization method Remaining amortization period Asset valuation method Actuarially determined contribution rates are calculated as of June 30, two years prior to the end of the fiscal year in which contributions are reported Entry Age Cost Method Level percent of payroll Actuarial assumptions: June 30, 2015 (for the year ended June 30, 2017 ADC) Plan changes, assumption changes, and experience gains/losses prior to July 1, 2011 are amortized over separate decreasing 30-year amortization periods. On or after July 1, 2011, plan changes are amortized over separate decreasing 15-year periods; assumption changes are amortized over separate decreasing 25-year periods; and experience gains/losses are amortized over separate decreasing 20-year periods. Market value of assets less unrecognized returns in each of the last five years. Unrecognized return is equal to the difference between the actual market return and the expected return on the market value, and is recognized over a five year period, further adjusted, if necessary, to be within 30% of the market value. June 30, 2014 (for the year ended June 30, 2016 ADC) Investment rate of return 7.50% 7.50% Inflation rate 3.00% 3.00% Real across-the-board salary increase 0.50% 0.50% Projected salary increases* Ranges from 9.50% to 4.00% based on years of service Ranges from 9.50% to 4.00% based on years of service Cost of living adjustments 3.00% per annum 3.00% per annum Mortality Healthy: RP-2000 Combined Healthy Mortality Table projected with scale AA to 2016, set back one year for males and set back two years for females Other assumptions Same as those used in the June 30, 2015 funding actuarial valuation Healthy: RP-2000 Combined Healthy Mortality Table projected with scale AA to 2016, set back one year for males and set back two years for females Same as those used in the June 30, 2014 funding actuarial valuation * Includes inflation at 3.00% as of June 30, 2015 and at 3.00% as of June 30, 2014, plus across the board salary increases of 0.50% plus merit and promotional increases. 10
146 SECTION 2: GAS 74 Information for the East Bay Municipal Utility District Retirement System EXHIBIT 5 Projection of OPEB Plan s Fiduciary Net Position for Use in Calculation of Discount Rate as of June 30, 2017 ($ in thousands) Projected Beginning Projected Projected Projected Projected Projected Ending Year Plan Fiduciary Total Benefit Administrative Investment Plan Fiduciary Beginning Net Position Contributions Payments Expenses Earnings Net Position July 1, (a) (b) (c) (d) (e) (f) = (a) + (b) - (c) - (d) + (e) 2017 $32,088 $11,950 $11,051 $32 $2,365 $35, ,320 12,116 11, ,588 38, ,470 12,361 11, ,810 41, ,649 12,469 12, ,034 44, ,862 12,635 12, ,260 48, ,104 12,923 13, ,490 51, ,436 13,170 13, ,729 54, ,922 13,414 13, ,981 58, ,631 13,549 13, ,250 62, ,643 3,932 13, ,855 52, ,321 3,062 12, ,440 45, ,801 1,173 12, ,902 36, , , ,252 27, , , ,547 16, , , , , , , , , Note that in preparing the above projections, we have not taken into consideration the one-year delay between the date of the contribution rate calculation and the implementation. 11
147 SECTION 2: GAS 74 Information for the East Bay Municipal Utility District Retirement System EXHIBIT 5 Projection of OPEB Plan s Fiduciary Net Position for Use in Calculation of Discount Rate as of June 30, 2017 ($ in thousands) - continued Notes: (1) (2) (3) (4) (5) (6) (7) (8) Amounts may not total exactly due to rounding. Years and have been omitted from this table. Column (a): None of the projected beginning Plan Fiduciary Net Position amounts shown have been adjusted for the time value of money. Column (b): Projected total contributions include employee and employer normal cost contributions based on closed group projections (based on covered active members as of June 30, 2017); plus employer contributions to the unfunded actuarial accrued liability; plus contributions to fund each year's annual administrative expenses reflecting a 20-year amortization schedule; plus implicit subsidy payments for current plan members as shown in Exhibit 6, based on Illustration 2 of Implementation Guide No , Financial Reporting for Postemployment Benefit Plans Other Than Pension Plans. Contributions are assumed to occur halfway through the year, on average. Column (c): Projected benefit payments have been determined in accordance with paragraph of GAS Statement No. 74, and are based on the closed group of active, inactive vested, retired members, and beneficiaries as of June 30, The projected benefit payments reflect the health care trend assumptions used in the June 30, 2017 funding valuation report. Benefit payments are assumed to occur halfway through the year, on average. In accordance with paragraph 48 of GASB Statement No. 74, the long-term expected rate of return on Plan investments of 7.25% was applied to periods of projected benefit payments through June 30, 2042, and the municipal bond rate (3.58%) was applied to periods after June 30, 2042, to determine the discount rate of 5.53%. See Exhibit 6 for details. Column (d): Projected administrative expenses are calculated as approximately 0.10% of the projected beginning Plan Fiduciary Net Position amount. The 0.10% portion was based on the actual fiscal year 2016/2017 administrative expenses as a percentage of the beginning Plan Fiduciary Net Position amount as of July 1, Administrative expenses are assumed to occur halfway through the year, on average. Column (e): Projected investment earnings are based on the assumed investment rate of return on Plan investments of 7.25% per annum. As illustrated in this Exhibit, the Plan's Fiduciary Net Position was projected to be available to make projected future benefit payments for current Plan members through June 30, In other words, the projected 'cross-over date' when projected benefits are not covered by projected assets occurs between June 30, 2042 and June 30, Therefore, the long-term expected rate of return on Plan investments of 7.25% per annum was applied to periods of projected benefit payments through June 30, Benefit payments after June 30, 2042 were discounted at 3.58%, the municipal bond rate, to be used as the investment return assumption for employer assets. 12
148 SECTION 2: GAS 74 Information for the East Bay Municipal Utility District Retirement System EXHIBIT 6 Table 1: Projection of Contributions Implicit Subsidy Only ($ in thousands) Year Beginning July 1, Payroll for Current Plan Members (a) Projected Payroll Payroll for Future Plan Members 1 (b) = (c) (a) Total Payroll (c) 2 Total Contributions = Implicit Subsidy Benefit Payments (d) Contributions Related to Payroll of Future Plan Members (e) = (b) 0.89% 3 Contributions for Current Plan Members (f) = (d) (e) $184,859 $0 $184,859 $2,351 $0 $2, ,722 11, ,329 2, , ,968 23, ,025 2, , ,999 34, ,956 2, , ,297 47, ,130 2, , ,749 61, ,554 2, , ,901 76, ,239 3, , ,479 90, ,192 3, , , , ,703 2,993 1,885 1, , , ,543 2,901 2, , , ,762 2,875 2, , , ,373 2,915 2, , , ,391 2,862 2, , , ,830 2,938 2, , , ,704 3,043 2, , , ,029 3,033 2, , , ,820 3,089 3, , , ,093 3,079 3, , , ,867 3,078 3, , , ,157 3,133 3, , , ,982 3,172 3, , , ,362 3,030 4, , , ,315 3,024 4, Future plan members assumed to enter plan at the end of the year 2 Initial payroll based on June 30, 2017 funding valuation. Future payrolls are projected with assumed annual 3.50% increase 3 Normal cost rate adjusted for timing of implicit subsidy benefit of 2013 Tier members 4 Numbers may not add up due to rounding YEARS and PAST 2046 NOT SHOWN HERE Projected Contributions 13
149 SECTION 2: GAS 74 Information for the East Bay Municipal Utility District Retirement System EXHIBIT 6 Table 2: Projection of Contributions and Benefit Payments Total ($ in thousands) Contributions for Current Plan Members Benefit Payments Year Beginning July 1, Prefunding (a) Implicit Subsidy (b) Total Contributions (c) = (a) + (b) Cash Subsidy (HIB Subsidy) (a) Implicit Subsidy (b) = (c) - (a) Total Benefit Payments (c) 2017 $9,599 $2,351 $11,950 $8,700 $2,351 $11, ,739 2,377 12,116 9,040 2,480 11, ,937 2,424 12,361 9,325 2,629 11, ,128 2,341 12,469 9,596 2,652 12, ,289 2,346 12,635 9,837 2,772 12, ,491 2,432 12,923 10,052 2,982 13, ,717 2,453 13,170 10,230 3,132 13, ,959 2,455 13,414 10,370 3,262 13, ,123 1,108 6,231 10,611 2,993 13, , ,179 10,534 2,901 13, , ,766 10,434 2,875 13, , ,578 10,317 2,915 13, , ,932 10,189 2,862 13, , ,062 10,033 2,938 12, ,173 9,861 3,043 12, ,677 3,033 12, ,463 3,089 12, ,239 3,079 12, ,996 3,078 12, ,743 3,133 11, ,475 3,172 11, ,186 3,030 11, ,895 3,024 10,919 YEARS and PAST 2046 NOT SHOWN HERE v4/


150

151

152

153

154
155

156

157 Q East Bay Municipal Utility District Quarterly Report This report is solely for the use of client personnel. No part of it may be circulated, quoted, or reproduced for distribution outside the client organization without prior written approval from Pension Consulting Alliance, LLC. Nothing herein is intended to serve as investment advice, a recommendation of any particular investment or type of investment, a suggestion of purchasing or selling securities, or an invitation or inducement to engage in investment activity.
158 TABLE OF CONTENTS INTRODUCTION INVESTMENT MARKET RISK METRICS ECONOMIC OVERVIEW EBMUD PORTFOLIO REVIEW Risk Return Analysis Total Plan Performance Asset Allocation Manager Performance Peer Universe Performance Monitoring Summary MANAGER WATCH SCREENS MANAGER COMPLIANCE CERTIFICATION RESPONSES APPENDIX EBMUD Performance Net of Fees Returns Glossary of Terms EBMUD Policy Benchmark Composition Definition of Benchmarks Risk Metric Description 1
159 Performance and Market Values As of September 30, 2017 Investment Performance Return Quarter 1 Year 3 Year 5 Year 20 Year EBMUD, gross EBMUD, net^ Portfolio Valuation (000's) Quarter 1 Year EBMUD Total Plan Beginning Market Value 1,610,435 1,460,784 Net Contributions -5,345-8,228 Fees/Expenses -1,158-4,325 Gain/Loss 55, ,829 Ending Market Value 1,661,872 1,661,872 Policy Benchmark Median Public Fund> $1B^^ Asset Class Performance (gross of fees) Quarter 1 Year 3 Year 5 Year 10 Year 20 Year EBMUD Total Plan Policy Benchmark^^^ Domestic Equity Russell 3000* International Equity MSCI ACWI x US (blend)** Covered Calls CBOE BXM Fixed Income Fixed Income benchmark (blend)*** Real Estate NCREIF/NAREIT (blend)**** Cash Citigroup 3 Month T-Bill Index ^Historical net returns for the Total Portfolio aggregate are currently available from 2Q ^^ IM Total Public Fund >$1B Universe includes BNY Mellon Public>$1B Fund Universe and IM client data. ^^^ Policy Benchmark consists of 40% Russell 3000 (blend), 15% MSCI ACWIxU.S. (blend), 20% CBOE BXM, 10% BC Aggregate, 5% BC US 1-3 Year Government/Credit, 2.5% BC 1-5 Year U.S. High Yield Cash Pay, 2.5% S&P/LSTA Performing Loans, 2.5% NCREIF (lagged), and 2.5% FTSE NAREIT Equity REITs index 4/1/14-present; see Appendix for historical Policy Benchmark composition. *Russell 3000 as of 10/1/05. Prior: 30% S&P500, 10% S&P400, 10% Russell 2000 (4/1/05-9/30/05); 33% S&P500, 10% S&P400, 10% Russell 2000 (9/1/98-3/31/05); 30% S&P500, 15% Wilshire 5000 (4/1/96-8/31/98). **MSCI ACWIxU.S. as of 1/1/07; MSCI EAFE ND thru 12/31/06. ***50% BC Aggregate, 25% BC US 1-3 Year Government/Credit, 12.5% BC 1-5 Year U.S. High Yield Cash Pay, and 12.5% S&P/LSTA Performing Loans index 4/1/14-present; 75% BC Aggregate, 12.5% BC 1-5 Year U.S. High Yield Cash Pay, and 12.5% S&P/LSTA Performing Loans index 3/1/14-3/31/14; BC Universal 1/1/08-2/28/14; BC Aggregate thru 12/31/07. ****50% NCREIF (lagged), 50% FTSE NAREIT Equity REITs Index as of 11/1/11; NCREIF (lagged) thru 10/31/11. East Bay Municipal Utility District 2
160 Takeaways INVESTMENT MARKET RISK METRICS * Investment Market Risk Metrics Growth risk-based assets generated meaningful returns over the quarter. The U.S. Treasury yield curve continues to flatten, with short-term rates generally increasing and medium and long-term rates largely remaining stable during the quarter. Implied equity market volatility (i.e., VIX) remained near historic lows throughout the quarter. This behavior has been directly mirrored by actual equity market volatility as well as macroeconomic data volatility throughout the globe. Due to recent price increases, Non-U.S. Developed and Emerging Market equity valuations are no longer as cheap relative to their own histories (currently in-line with long-term averages, but they remain modestly cheap relative to U.S. levels. Credit spreads remain tight (risk seeking) in both U.S. investment grade and high yield markets. Inflation indicators remain well behaved; commodity prices are near decade lows and breakeven inflation levels remain stable. PCA s sentiment indicator remains positive. The sentiment indicator remains solidly green. * See Appendix for the rationale for selection and calculation methodology used for the risk metrics. 3
161 Top Decile Valuation Metrics versus Historical Range A Measure of Risk Unfavorable Pricing Average Neutral Bottom Decile Favorable Pricing US Equity (Ex. 1) Dev ex US Equity (Ex. 2) EM Equity Relative to DM Equity (Ex. 3) Private Equity (Ex. 4, 5) Private Real Estate Cap Rate (Ex. 6) Private Real Estate Spread (Ex. 7) US IG Corp Debt Spread (Ex. 9) US High Yield Debt Spread (Ex. 10) Other Important Metrics within their Historical Ranges Pay Attention to Extreme Readings Top Decile Attention! Average Neutral Bottom Decile Attention! Equity Volatility (Ex. 11) Yield Curve Slope (Ex. 12) Breakeven Inflation (Ex. 13, 14) Interest Rate Risk (Ex. 15, 16) 4
162 Information Behind Current Sentiment Reading Bond Spread Momentum Trailing Twelve Months Positive Equity Return Momentum Trailing Twelve Months Positive Positive Agreement Between Bond and Equity Momentum Measures? Agree Growth Risk Visibility (Current Overall Sentiment) 5
163 Developed Public Equity Markets Exhibit 1 P/E Ratio U.S. Equity Market P/E Ratio 1 versus Long Term Historical Average US Markets Current P/E as of 9/2017 =30.6x US Markets Long term Average (since 1880) P/E = 16.8x 1 P/E ratio is a Shiller P/E 10 based on 10 year real S&P 500 earnings over S&P 500 index level. (Please note different time scales) Exhibit 2 P/E Ratio Developed ex U.S. Equity Market P/E Ratio 1 versus Long Term Historical Average 2 Average /2017 EAFE Only P/E = 23.3x Long term Average Historical 2 P/E = 16.9x Intl Developed Markets Current P/E as of 9/2017 = 16.9x 1 P/E ratio is a Shiller P/E 10 based on 10 year real MSCI EAFE earnings over EAFE index level. 2 To calculate the LT historical average, from 1881 to 1982 U.S. data is used as developed market proxy. From 1982 to present, actual developed ex US market data (MSCI EAFE) is used. 6
164 Emerging Markets Public Equity Markets Exhibit 3 275% Emerging Markets PE / Developed Markets PE (100% = Parity between PE Ratios) 250% 225% 200% Russian crisis, LTCM implosion, currency devaluations EM/DM relative PE ratio is slightly below the historical average 175% 150% Mexican Peso crisis Technology and telecom crash World financial crisis 125% 100% 75% 50% 25% 0% Asian crisis Commodityprice run up Source: Bloomberg, MSCIWorld, MSCI EMF EM/DM PE Average EM/DM PE Parity 7
165 U.S. Private Equity Markets 8
166 Exhibit 6 Cap Rates Source: NCRIEF Exhibit % 16.0% 14.0% 12.0% 10.0% 8.0% 6.0% 4.0% 2.0% 0.0% 5.0% 4.0% Core Cap Rate LT Average Cap Rate 10 Year Treasury Rate A cap rate is the current annual income of the property divided by an estimate of the current value of the property. It is the current yield of the property. d Low cap rates indicate high valuations. Private Real Estate Markets Current Value Cap Rates 1 Quarterly Data, Updated to September 30th Core Cap Rate Spread over 10 Year Treasury Interest Rate Spread to the 10 year Treasury marginally narrowed during the third quarter. Core real estate cap rates remain low by historical standards (expensive). Cap Rate Spread 3.0% 2.0% 1.0% Core Cap Rate Spread to Treasuries LT Average Spread Exhibit 8 0.0% Transactions as a % of Market Value Trailing Four Quarters 20.0% 15.0% Activity has been steadily increasing since Q % 5.0% 0.0% Source: NCREIF, PCA calculation 9
167 Exhibit 9 Spread Over Treasuries (basis points) Credit Markets U.S. Fixed Income Investment Grade Corporate Bond Spreads Investment grade spreads narrowed during the third quarter and remain below the long term average level. Investment Grade Bond Spreads Average spread since 1994 (IG Bonds) Source: LehmanLive: Barclays Capital US Corporate Investment Grade Index Intermediate Component. Exhibit 10 Spread Over Treasuries (basis points) High Yield Corporate Bond Spreads Similarly, high yield spreads ticked down over the quarter and still remain below the long term average level. High Yield Bond Spreads Average spread since 1994 (HY Bonds) Source: LehmanLive: Barclays Capital U.S. Corporate High Yield Index. 10
168 Other Market Metrics Exhibit VIX a measure of equity market fear / uncertainty Equity market volatility (VIX) decreased in September and (once again) ended the quarter meaningfully below the long term average level ( 20) at 9.5. Source: (Please note different time scales) Exhibit Yield Curve Slope The average 10 year Treasury interest rate was virtually unchanged ove r the quarter. The average one year Treasury interest rate ticked up during the quarter. The slope decreased during the third quarter, and the yield curve remains upward sloping. Yield curve slopes that are negative (inverted) portend a recession. Source: (10 yeartreasury yield minus 1 year treasury yield) 11
169 Measures of Inflation Expectations Exhibit % 10 Year Breakeven Inflation (10 year nominal Treasury yield minus 10 year TIPS yield) 2.50% 2.00% 1.50% 1.00% 0.50% 0.00% Breakeven inflation ended September at 1.84%, increasing from the end of June. The 10 year TIPS real yield decreased to 0.49%, and the nominal 10 year Treasury yield was virtually unchanged ending the quarter at 2.33%. Source: Daily Yield Curve Rates (10 year nominal treasury yield minus 10 year TIPs yield) (Please note different time scales) Exhibit Inflation Adjusted Bloomberg Commodity Price Index (1991 = 100) Broad commodity prices ticked up during the quarter and continue to remain above the historical lows set in early Source : Bloomberg Commodity I ndex, St. Louis Fed for US CPI a ll urban consumers. 12
170 Exhibit 15 Expected Real Yield of 10 Year Treasury Average since Measures of U.S. Treasury Interest Rate Risk Estimate of 10 Year Treasury Forward Looking Real Yield Sources: 10 year constant maturity rates *Federal Reserve Bank of Philadelphia survey of professional forecasts for inflation estimates The forward looking annual real yi eld on 10 year Treasuries is estimated at approximately 0.05% real, assuming 10 year annualized inflation of 2.25%* per year. Exhibit Year Treasury Bond Duration Higher Risk Lower Risk 10 Year Treasury Duration (Change in Treasury price with a change in interest rates) Interest rate risk is still near all time highs. If the 10 year Treasury yield rises by 100 basis points from today's levels, the capital loss from the change in price is expected to be 8.9%. Source: for 10 year constant maturity rates, calculation of duration 13

171 ECONOMIC & MARKET OVERVIEW 3Q 2017 Overview: US GDP growth increased by 3.0% (advance estimate) in the third quarter of GDP growth during the quarter was driven by increases in consumer spending, inventory investment, business investment, and exports. At quarter-end, the unemployment rate ticked down to 4.2%. The seasonally adjusted Consumer Price Index for All Urban Consumers increased by 4.3% on an annualized basis during the quarter. Commodities increased during the third quarter but are slightly negative over the trailing 1-year period at (0.3%). Global equity returns were positive for the quarter at 5.3% (MSCI ACWI). The US Dollar depreciated against the Euro and the Pound by (3.4%) and (2.9%), respectively. Conversely, the US Dollar appreciated against the Yen by 10 basis points. Economic Growth Real GDP increased at an annualized rate of 3.0 percent in the third quarter of Real GDP growth was driven by increases in consumer spending, inventory investment, business investment, and exports. 1.4% Annualized Quarterly GDP Growth 3.5% 3.1% 3.0% 2.1% 1.4% 4.0% 2.0% GDP growth was partially offset during the quarter by a decline in housing investment Q Q Q Q Q Q3 0.0% -2.0% Inflation The Consumer Price Index for All Urban Consumers (CPI-U) increased 4.3 percent during the third quarter on an annualized basis after seasonal adjustment. Quarterly percentage changes may be adjusted between data publications due to periodic updates in seasonal factors. Core CPI-U increased by 2.1 percent for the quarter on an annualized basis after seasonal adjustment. 3.0% 2016 Q2 CPI-U After Seasonal Adjustment 4.3% 3.0% 2.0% 1.5% 0.1% 2016 Q Q Q Q Q3 5.0% 4.0% 3.0% 2.0% 1.0% 0.0% Over the last 12 months, core CPI-U increased 1.7 percent after seasonal adjustment. Unemployment The US economy gained approximately 274,000 jobs in the third quarter of Unemployment Rate The unemployment rate decreased to 4.2% at quarter end, the lowest level since February The majority of jobs gained occurred in private service providing, education and health services, and professional and business services. The primary contributors to jobs lost were in leisure and hospitality, retail trade, and information. 4.9% 2016 Q2 4.9% 2016 Q3 4.7% 2016 Q4 4.7% 2017 Q1 4.4% 2017 Q2 4.2% 2017 Q3 8.0% 6.0% 4.0% 2.0% 0.0% 14
172 ECONOMIC & MARKET OVERVIEW 3Q 2017 Interest Rates & US Dollar Treasury Yield Curve Changes 6/30/2017 9/30/ % US Treasury yields were generally constant over the quarter. 3.0% The Federal Reserve kept the federal funds rate between 1.00 percent and 1.25 percent. The US dollar depreciated against the Euro and the Pound by (3.4%) and (2.9%), respectively. Conversely the US dollar appreciated against the Yen by 0.1%. 2.0% 1.0% 0.0% 3 mo 6 mo 1 yr 2 yr 3 yr 5 yr 7 yr 10 yr 20 yr 30 yr Source: US Treasury Department Fixed Income US bonds were essentially flat over the quarter except for Credit and High Yield, returning 1.4% and 2.0%, respectively. Government bonds (US Treasuries and Agencies) delivered the worst performance at 0.4%. Over the trailing 1-year period, High Yield materially outperformed all other sectors, producing an 8.9% return over the period. Government bonds (US Treasuries and Agencies) trailed all other bond sectors with a return of minus (1.6%) as rates generally rose over the period. 15.0% Fixed Income Returns US Fixed Income Sector Performance (BB Aggregate Index) 10.0% 5.0% 0.9% 0.4% 1.4% 1.0% 2.0% 0.1% 2.0% 0.3% 8.9% Sector Weight QTR 1 Year Governments* 40.5% 0.5% -1.3% Agencies 3.4% 0.8% 0.8% 0.0% Inv. Grade Credit 25.6% 1.3% 2.2% -5.0% QTR -1.6% 1-Year BB Agg BB Govt* BB Credit BB Mortgage BB High Yield *US Treasuries and Agencies MBS 28.1% 1.0% 0.3% ABS 0.5% 0.4% 0.9% CMBS 1.8% 0.8% -0.1% *US Treasuries and Government Related 15
173 ECONOMIC & MARKET OVERVIEW 3Q 2017 US Equities During the quarter, growth stocks outperformed value stocks across the market cap spectrum. In terms of market capitalization, small cap stocks provided the strongest returns across styles. Small cap growth stocks returned this quarter s strongest return at 6.2%, and large cap value provided the weakest result at 3.1%. During the trailing 1-year period, US equities provided positive double-digit returns, with the top performers, large cap and broad growth, each returning 21.9%. Conversely, large cap value trailed all other market caps and styles with a return of 15.1%. 0.4% 30% 25% 20% 15% 10% 5% 0% -5% 4.6% 5.9% 3.3% 4.5% 5.9% 3.1% 5.7% 6.2% 5.1% QTR U.S. Equity Returns 18.7% 21.9% 15.5% 18.5% 21.9% 15.1% 20.7% 21.0% 20.6% 1-Year R3000 (Broad Core) R3000G (Broad Gr) R3000V (Broad Val) R1000 (Lg Core) R1000G (Lg Gr) R1000V (Lg Val) R2000 (Sm Core) R2000G (Sm Gr) R2000V (Sm Val) US Equity Sector Performance (Russell 3000 Index) Sector Weight QTR 1 Year Financial Services 21.1% 12.7% 14.8% Technology 18.0% 8.9% -3.3% Consumer Disc. 14.0% 7.6% 6.8% Health Care 13.3% 5.9% 5.8% Producer Durables 11.0% -6.8% 26.3% Consumer Staples 7.5% 6.0% 23.1% Energy 6.1% 4.0% 20.1% Utilities 5.3% 3.0% 18.0% Materials & Proc. 3.9% 2.0% 20.5% International Equities International equities performed well over the quarter as each region provided positive returns. The best performer was Emerging Markets with a return of 8.0%. The Pacific trailed all other regions with a return of 4.0%. Over the trailing 1-year period, international equities provided double digit returns across the board. Europe led all other regions with a return of 23.0%, while the Pacific underperformed all other regions with a 14.5% return. 30% 25% 20% 15% 10% 5% 0% -5% International Equity Returns (in USD) 6.3% 5.5% 6.5% QTR 4.0% 8.0% 20.2% 19.7% 23.0% 1-Year MSCI ACW Ex U.S. MSCI EAFE MSCI Europe MSCI Pacific MSCI EM 14.5% 22.9% International Equity Region Performance (in USD) (MSCI ACWI ex US) Sector Weight QTR 1 Year Europe Ex. UK 32.6% 7.0% 26.4% Emerging Markets 24.2% 8.0% 22.9% Japan 16.0% 4.1% 14.5% United Kingdom 12.4% 5.2% 14.7% Pacific Ex. Japan 8.2% 3.7% 14.6% Canada 6.7% 8.1% 15.8% 16
174 ECONOMIC & MARKET OVERVIEW 3Q 2017 Market Summary Long-term Performance* Indexes Month Quarter 1 Year 3 Years 5 Years 10 Years 20 Years Global Equity MSCI AC World Index 2.0% 5.3% 19.3% 8.0% 10.8% 4.4% 6.1% Domestic Equity S&P % 4.5% 18.6% 10.8% 14.2% 7.4% 7.0% Russell % 4.6% 18.7% 10.7% 14.2% 7.6% 7.2% Russell 3000 Growth 1.6% 5.9% 21.9% 12.6% 15.2% 9.0% 6.5% Russell 3000 Value 3.3% 3.3% 15.5% 8.8% 13.2% 6.0% 7.4% Russell % 4.5% 18.5% 10.6% 14.3% 7.5% 7.2% Russell 1000 Growth 1.3% 5.9% 21.9% 12.7% 15.3% 9.1% 6.5% Russell 1000 Value 3.0% 3.1% 15.1% 8.5% 13.2% 5.9% 7.3% Russell % 5.7% 20.7% 12.2% 13.8% 7.8% 7.5% Russell 2000 Growth 5.4% 6.2% 21.0% 12.2% 14.3% 8.5% 6.0% Russell 2000 Value 7.1% 5.1% 20.5% 12.1% 13.3% 7.1% 8.6% Russell Microcap 8.1% 6.7% 22.3% 12.2% 13.9% 6.7% --- CBOE BXM Index 0.9% 2.5% 12.8% 7.1% 7.6% 4.8% 6.4% International Equity MSCI AC World Index ex USA 1.9% 6.3% 20.2% 5.2% 7.5% 1.7% 5.4% MSCI EAFE 2.5% 5.5% 19.7% 5.5% 8.9% 1.8% 5.0% MSCI Pacific 3.3% 6.5% 23.0% 5.0% 9.0% 1.7% 5.8% MSCI Europe 1.1% 4.0% 14.5% 6.9% 8.8% 2.3% 3.7% MSCI EM (Emerging Markets) -0.4% 8.0% 22.9% 5.3% 4.4% 1.7% 6.7% Fixed Income BC Universal -0.4% 1.0% 1.0% 3.1% 2.5% 4.6% 5.3% Global Agg. - Hedged -0.5% 0.8% -0.2% 3.1% 3.1% 4.3% 5.1% BC Aggregate Bond -0.5% 0.8% 0.1% 2.7% 2.1% 4.3% 5.1% BC Government -0.8% 0.4% -1.6% 2.0% 1.3% 3.6% 4.7% BC Credit Bond -0.2% 1.3% 2.0% 3.9% 3.2% 5.5% 5.8% BC Mortgage Backed Securities -0.2% 1.0% 0.3% 2.4% 2.0% 4.1% 5.0% BC High Yield 0.9% 2.0% 8.9% 5.8% 6.4% 7.8% 6.8% BC WGIL All Maturities - Hedged -1.6% 0.6% -1.2% 4.1% 2.9% 4.8% --- Emerging Markets Debt 0.1% 2.3% 4.7% 5.5% 4.4% 7.2% 8.3% Real Estate NCREIF 0.6% 1.9% 7.7% 10.8% 11.6% 5.0% 9.1% FTSE NAREIT All Equity Index -0.6% 1.2% 3.6% 10.3% 9.9% 6.1% 8.6% Commodity Index Bloomberg Commodity Index -0.1% 2.5% -0.3% -10.4% -10.5% -6.8% 0.1% * Performance is annualized for periods greater than one year. 17
175 EBMUD Portfolio Review Gross Investment Performance As of September 30, 2017 Total Fund Risk/Return Analysis - Latest 3 Years Total Fund Risk/Return Analysis - Latest 5 Years Policy Benchmark Median Public Fund> $1B EBMUD Total Plan 15.0 Return (%) Return (%) Policy Benchmark Median Public Fund> $1B EBMUD Total Plan Risk Free Rate Risk Free Rate Risk (Standard Deviation %) Risk (Standard Deviation %) 3 Years Return 3 Years Standard Deviation 3 Years Sharpe Ratio 5 Years Return 5 Years Standard Deviation EBMUD Total Plan Policy Benchmark Median Public Fund> $1B Median Years Sharpe Ratio East Bay Municipal Utility District 18
176 EBMUD Portfolio Relative Performance Results As of September 30, 2017 Trailing Period Perfomance (annualized) 20.0 Return Quarter 1 Year 3 Year 5 Year Since Inception (Aug-1984) EBMUD, gross EBMUD, net Policy Benchmark (1) Median Public Fund> $1B (2) 12-month Performance- As of September 30, Return EBMUD, gross EBMUD, net Policy Benchmark Median Public Fund> $1B (1) Policy Benchmark consists of 40% Russell 3000 (blend), 15% MSCI ACWIxU.S. (blend), 20% CBOE BXM, 10% BC Aggregate, 5% BC US 1-3 Year Government/Credit, 2.5% BC 1-5 Year U.S. High Yield Cash Pay, 2.5% S&P/LSTA Performing Loans, 2.5% NCREIF (lagged), and 2.5% FTSE NAREIT Equity REITs index 4/1/14-present; see Appendix for historical Policy Benchmark composition. (2) IM Total Public Fund >$1B Universe includes BNY Mellon Public>$1B Fund Universe and IM client data. East Bay Municipal Utility District 19
177 Actual vs. Target Allocation As of September 30, 2017 Asset Allocation ($000) Asset Allocation (%) Target Allocation* (%) Variance (%) Minimum Allocation*** (%) Maximum Allocation*** (%) EBMUD Total Plan 1,661, Domestic Equity 720, International Equity 227, Core Fixed Income 141, Non-Core Fixed Income 132, Covered Calls 348, Real Estate 85, Cash 6, *Policy target allocations elected by the Board in September 2013, which took effect March 2014 upon the funding of the new Covered Calls asset class and Non-Core Bonds allocation within Total Fixed Income. **RREEF performance results and allocation are lagged one-quarter. ***Policy rebalancing ranges shown are for non-turbulent market periods. The Plan also has established rebalancing ranges to be in effect during turbulent market periods. Actual Asset Allocation Comparison September 30, 2017 : $1,661,871,769 June 30, 2017 : $1,610,435,485 Cash 0.4 Cash 0.2 RE 5.1 RE 5.2 Fixed Income 16.5 Domestic Equity 43.4 Fixed Income 16.9 Domestic Equity 43.5 Covered Calls 21.0 Covered Calls 20.9 Intl Equity 13.7 Intl Equity 13.3 East Bay Municipal Utility District 20
178 Manager Performance - Gross of Fees As of September 30, 2017 Domestic Equity Manager - Style Large Cap Core *On watch since 12/2014 **On watch since 12/2012 Market Value ($000) Quarter 1 Year 3 Year 5 Year Northern Trust Co. - Passive 284, Russell 1000 Index Large Cap Growth Intech - Active* 88, T.Rowe Price - Active 89, Russell 1000 Growth Index Large Cap Value Barrow Hanley - Active 187, Russell 1000 Value Index Small Cap Growth Northern Trust Co. - Passive 31, Russell 2000 Growth Index Small Cap Value Opus - Active** 38, Russell 2000 Value Index During the latest three-month period ending September 30, 2017, three of EBMUD s six Domestic Equity managers either matched or outperformed their respective benchmarks. Both of EBMUD"s passive Domestic Equity mandates performed in-line with their respective benchmarks. Several of EBMUD's active Domestic Equity managers produced material outperformance/underperformance relative to their respective benchmarks over various trailing periods ending 9/30/2017. The following address the drivers of these excess results. o Intech, one of EBMUD s large cap growth managers, outperformed the Russell 1000 Growth Index over the 1- and 3-year periods by 2.2% and 1.8%, respectively. The portfolio s outperformance is a demonstration of positive trending, which, according to Intech, occurs when the proportion of the overweighted stocks with a positive relative return is above that of the underweights. o T. Rowe Price, EBMUD's other large cap growth manager, exceeded the Russell 1000 Growth Index over the latest 1-, 3-, and 5-year periods by 5.1%, 2.0%, and 1.7%, respectively. For the 1-year period, stock selection and an overweight to Information Technology was a strong contributor to results. Additionally, stock selection in Healthcare and an underweight to Consumer Staples also added value. Relative outperformance for the 3- and 5-year periods was driven by stock selection in Information Technology and Consumer Discretionary. o Barrow Hanley, EBMUD s large cap value manager, trailed the Russell 1000 Value Index by (1.5%) over the quarter as stock selection and an overweight in Healthcare was the primary detractor. The portfolio exceeded the benchmark by 1.0% over the 1-year period. Stock selection in Energy and having no exposure to Real Estate drove relative results. o Opus, EBMUD s active small cap value manager, outperformed the Russell 2000 Value Index over the 1-year period by 1.2%. Sector allocation drove relative outperformance, notably, the portfolio s allocation to Producer Durables & Utilities, which was overweight Durables. The portfolio's bias toward quality earnings and lack of exposure to Energy also benefitted results. East Bay Municipal Utility District 21
179 Manager Performance - Gross of Fees As of September 30, 2017 International Equity Manager - Style Market Value Quarter 1 Year 3 Year 5 Year ($000) Fisher Investments - Active 120, Franklin Templeton - Active* 106, MSCI ACWI x US (blend)** During the latest three-month period ending September 30, 2017, one of EBMUD s two International Equity managers outperformed the MSCI ACWI x U.S. (blend) Index. Both International Equity managers produced material outperformance/underperformance relative to their respective benchmarks over various time periods ending 9/30/2017. The following addresses the drivers of these excess returns. o Fisher outperformed the MSCI ACWI x U.S. (blend) Index over the recent 1-, 3-, and 5-year periods by 4.4%, 3.5%, and 2.1%, respectively. An overweight to and selection within Information Technology was the driver to relative outperformance. o The Franklin Templeton account exceeded the MSCI ACWI x U.S. (blend) Index over the 1-year period by 1.7%. Stock selection in Financials and Industrials, as well as underweights to Consumer Staples and Utilities benefitted results. From a regional perspective, stock selection and an overweight to the Netherlands added value. Over the 3-year period the portfolio trailed the benchmark by (1.5%). Overall allocation decisions detracted from relative results, notably the portfolio s overweight to Telecommunication Services and Healthcare, as well as its cash exposure. *Franklin Templeton s historical returns are reported net of fees (inception - 6/30/2011). The Franklin Templeton institutional mutual fund account was liquidated in June 2011 and moved to a transition account, which later funded the Franklin Templeton new separate account in the same month. The Q return I san aggregate of the institution mutual fund account, Franklin transient account, and new separate account. **As of January , the benchmark changed from MSCI EAFE to MSCI ACWI x U.S. East Bay Municipal Utility District 22
180 Manager Performance - Gross of Fees As of September 30, 2017 Covered Calls Manager - Style Market Value ($000) Quarter 1 Year 3 Year 5 Year Parametric BXM 117, Parametric Delta Shift 123, Van Hulzen 107, CBOE BXM Over the latest quarter ending September 30, 2017, all three of EBMUD s Covered Calls mandates exceeded the CBOE BXM Index. o o o The Parametric BXM strategy outperformed the CBOE BXM Index over the 3-year period by 2.3%. Outperformance can be attributed to the strategy diversifying option expiration dates to reduce path dependency versus the passive index. The long-term spread between implied and realized volatilities remain attractive, which is a essential condition for capturing the volatility risk premium. Parametric Delta Shift strategy exceeded the benchmark over the quarter, 1-, and 3-year periods by 1.4%, 4.3% and 3.8%, respectively. For the quarter, outperformance was a result of the strategy s out-of-money call options and the risk management rules to mitigate option losses. Van Hulzen, outperformed the CBOE BXM Index over the latest quarter by 0.4% but trailed the benchmark over the 1- and 3-year periods by (2.6%), and (1.3%), respectively. For the quarter, the volatility index (VIX) was down 14%; this index is a key determinant of the level of option premium received when writing call options. The covered call strategy thrives in higher volatility as it makes the total return performance less dependent on price appreciation. East Bay Municipal Utility District 23
181 Manager Performance - Gross of Fees As of September 30, 2017 Total Fixed Income Manager - Style Market Value ($000) Quarter 1 Year 3 Year 5 Year Core Fixed Income CS McKee - Active 141, Bloomberg Barclays U.S. Aggregate Index Non- Core Fixed Income Western Asset - Short Duration - Active 66, Bloomberg Barclays 1-3 Year Gov/Credit Index Western Asset - Short-Term HY - Active* 31, Bloomberg Barclays US High Yield 1-5 Yr Cash Pay 2% Western Asset - Bank Loans - Active** 34, S&P/LSTA Performing Loans Index *On watch since 4/2016 ** On watch since 4/2016 Over the latest three-month period ending September 30, 2017, three of EBMUD s four Fixed Income mandates matched or outperformed their respective benchmarks. Two of EBMUD's Fixed Income managers produced material underperformance relative to their respective benchmarks over various trailing time periods ending 9/30/2017. The following items address the primary detractors to these excess returns: o o The WAMCO Short-Term High Yield portfolio underperformed the Bloomberg BC 1-5 Year U.S. High Yield Cash Pay Index by (4.6%) over the 3-year period. Note, the composite portfolio is not measured against a benchmark and accounts that comprise the composite are measured on an absolute basis. The portfolio s positioning in the Energy sub-sector and issue selection in select holdings detracted from results. The WAMCO Bank Loans portfolio underperformed the S&P/LSTA Performing Loans Index over the 3-year period by (1.6%). Sub-sector allocation detracted from results, particularly overweights to Energy, Metals and Mining, and an underweight to Technology. Additionally, overall issue selection was negative for results. East Bay Municipal Utility District 24
182 Manager Performance - Gross of Fees As of September 30, 2017 Real Estate Manager - Style Market Value Quarter 1 Year 3 Year 5 Year ($000) RREEF America II (Lag)* 34, NCREIF NPI (Lag)* CenterSquare 50, FTSE NAREIT Equity REIT Index *Results are lagged one quarter. East Bay s Real Estate manager, RREEF II, outperformed its benchmark, the NCREIF Property Index, during each period measured. During the lagged quarter, RREEF America REIT II operations generated an income return of 1.0% before fees, remaining steady from the previous quarter. Same store net operating income for the 1-year period increased by 3.5% from the prior year, extending the trend of improving same store income from operations. Occupancy at the end of the quarter was 90 percent overall. CenterSquare, East Bay s REIT manager, exceeded the FTSE NAREIT Equity REITs Index return over the recent quarter, 3- and 5-year periods but trailed the benchmark over the 1-year period. The Healthcare sector was the worst performing sector for the quarter and although the fund held an underweight position to the sector, it continues to be the second largest overall sector exposure in the portfolio. Freestanding retail was the best performing sector over the period, which was also underweight in the portfolio. East Bay Municipal Utility District 25
183 Plan Sponsor Peer Group Analysis As of September 30, Return Quarter 1 Year 3 Years 5 Years 10 Years EBMUD Total Plan 3.6 (54) 14.6 (8) 8.3 (5) 10.6 (1) 6.2 (12) Policy Benchmark 3.5 (63) 13.5 (29) 7.7 (19) 9.7 (16) 5.9 (27) 5th Percentile st Quartile Median rd Quartile th Percentile Parentheses contain percentile rankings. Calculation based on monthly periodicity. 26
184 Northern Trust Russell gross of fees As of September 30, 2017 Alpha Beta Information Ratio Sharpe Ratio Tracking Error R-Squared Up Market Capture Down Market Capture Inception Date Northern Trust Russell /01/2006 Russell 1000 Index /01/2006 Trailing Period Performance 32.0 Growth of $1 - Since Inception $ $2.4 $2.6 $2.5 Return $ $ Quarter 1 Year 3 Years 5 Years $0.0 5/06 11/07 5/09 11/10 5/12 11/13 5/15 9/17 Northern Trust Russell 1000 Russell 1000 Index Northern Trust Russell 1000 Russell 1000 Index Calendar Year Performance Risk/Return - Since Inception Return Return (%) Risk (Standard Deviation %) Northern Trust Russell 1000 Russell 1000 Index Return Standard Deviation Northern Trust Russell pr Russell 1000 Index ¾ Median East Bay Municipal Utility District 27
185 Intech - gross of fees As of September 30, 2017 Alpha Beta Information Ratio Sharpe Ratio Tracking Error R-Squared Up Market Capture Down Market Capture Inception Date Intech /01/2007 Russell 1000 Growth Index /01/2007 Trailing Period Performance 32.0 Growth of $1 - Since Inception $4.0 Return $3.0 $2.0 $1.0 $2.6 $ $ Quarter 1 Year 3 Years 5 Years ($1.0) 2/07 5/08 8/09 11/10 2/12 5/13 8/14 11/15 9/17 Intech Russell 1000 Growth Index Intech Russell 1000 Growth Index Calendar Year Performance Risk/Return - Since Inception Return Return (%) Intech Russell 1000 Growth Index Risk (Standard Deviation %) Return Standard Deviation Intech pr Russell 1000 Growth Index ¾ Median East Bay Municipal Utility District 28
186 T.Rowe Price - gross of fees As of September 30, 2017 Alpha Beta Information Ratio Sharpe Ratio Tracking Error R-Squared Up Market Capture Down Market Capture Inception Date T.Rowe Price /01/2007 Russell 1000 Growth Index /01/2007 Trailing Period Performance 40.0 Growth of $1 - Since Inception $3.6 Return $2.7 $1.8 $0.9 $2.9 $ Quarter 1 Year 3 Years 5 Years $0.0 2/07 5/08 8/09 11/10 2/12 5/13 8/14 11/15 9/17 T.Rowe Price Russell 1000 Growth Index T.Rowe Price Russell 1000 Growth Index Calendar Year Performance 60.0 Return T.Rowe Price Russell 1000 Growth Index Risk/Return - Since Inception Return (%) Risk (Standard Deviation %) Return Standard Deviation T.Rowe Price pr Russell 1000 Growth Index ¾ Median East Bay Municipal Utility District 29
187 Barrow Hanley - gross of fees As of September 30, 2017 Alpha Beta Information Ratio Sharpe Ratio Tracking Error R-Squared Up Market Capture Down Market Capture Inception Date Barrow Hanley /01/2005 Russell 1000 Value Index /01/2005 Trailing Period Performance 24.0 Growth of $1 - Since Inception $3.2 Return $2.4 $1.6 $2.4 $ $ Quarter 1 Year 3 Years 5 Years $0.0 7/05 1/07 7/08 1/10 7/11 1/13 7/14 1/16 9/17 Barrow Hanley Russell 1000 Value Index Barrow Hanley Russell 1000 Value Index Calendar Year Performance 45.0 Risk/Return - Since Inception 12.0 Return Return (%) Barrow Hanley Russell 1000 Value Index Risk (Standard Deviation %) Return Standard Deviation Barrow Hanley pr Russell 1000 Value Index ¾ Median East Bay Municipal Utility District 30
188 Northern Trust Russell 2000 Growth - gross of fees As of September 30, 2017 Alpha Beta Information Ratio Sharpe Ratio Tracking Error R-Squared Up Market Capture Down Market Capture Inception Date Northern Trust Russell 2000 Growth /01/2008 Russell 2000 Growth Index /01/2008 Trailing Period Performance 32.0 Growth of $1 - Since Inception $ Return $4.0 $3.9 $ $ Quarter 1 Year 3 Years 5 Years $0.0 Northern Trust Russell 2000 Growth 11/08 11/09 11/10 11/11 11/12 11/13 11/14 11/15 11/16 9/17 Russell 2000 Growth Index Northern Trust Russell 2000 Growth Russell 2000 Growth Index Calendar Year Performance 60.0 Risk/Return - Since Inception 28.0 Return Return (%) Risk (Standard Deviation %) Return Standard Deviation Northern Trust Russell 2000 Growth Northern Trust Russell 2000 Growth Russell 2000 Growth Index pr Russell 2000 Growth Index ¾ Median East Bay Municipal Utility District 31
189 Opus - gross of fees As of September 30, 2017 Alpha Beta Information Ratio Sharpe Ratio Tracking Error R-Squared Up Market Capture Down Market Capture Inception Date Opus /01/2005 Russell 2000 Value Index /01/2005 Trailing Period Performance 32.0 Growth of $1 - Since Inception $ $2.4 $2.3 $2.4 Return $ $ Quarter 1 Year 3 Years 5 Years $0.0 11/05 5/07 11/08 5/10 11/11 5/13 11/14 5/16 9/17 Opus Russell 2000 Value Index Opus Russell 2000 Value Index Calendar Year Performance 60.0 Risk/Return - Since Inception 14.0 Return Opus Russell 2000 Value Index Return (%) Risk (Standard Deviation %) Return Standard Deviation Opus pr Russell 2000 Value Index ¾ Median East Bay Municipal Utility District 32
190 Franklin Templeton - gross of fees As of September 30, 2017 Alpha Beta Information Ratio Sharpe Ratio Tracking Error R-Squared Up Market Capture Down Market Capture Inception Date Franklin Templeton /01/2011 MSCI ACWI xus (blend) /01/2011 Trailing Period Performance 32.0 Growth of $1 - Since Inception $1.8 Return $1.5 $1.2 $1.4 $ $ Quarter 1 Year 3 Years 5 Years $0.6 5/11 2/12 11/12 8/13 5/14 2/15 11/15 8/16 9/17 Franklin Templeton MSCI ACWI xus (blend) Franklin Templeton MSCI ACWI xus (blend) Calendar Year Performance 45.0 Risk/Return - Since Inception 10.0 Return Return (%) Risk (Standard Deviation %) Franklin Templeton MSCI ACWI xus (blend) Return Standard Deviation Franklin Templeton pr MSCI ACWI xus (blend) ¾ Median East Bay Municipal Utility District 33
191 Fisher Investments - gross of fees As of September 30, 2017 Alpha Beta Information Ratio Sharpe Ratio Tracking Error R-Squared Up Market Capture Down Market Capture Inception Date Fisher Investments /01/2004 MSCI ACWI xus (blend) /01/2004 Trailing Period Performance 32.0 Growth of $1 - Since Inception $4.0 Return $3.2 $2.4 $1.6 $0.8 $2.7 $ Quarter 1 Year 3 Years 5 Years $0.0 2/04 11/05 8/07 5/09 2/11 11/12 8/14 9/17 Fisher Investments MSCI ACWI xus (blend) Fisher Investments MSCI ACWI xus (blend) Calendar Year Performance 30.0 Risk/Return - Since Inception 10.0 Return Return (%) Risk (Standard Deviation %) Fisher Investments MSCI ACWI xus (blend) Return Standard Deviation Fisher Investments pr MSCI ACWI xus (blend) ¾ Median East Bay Municipal Utility District 34
192 CS McKee - gross of fees As of September 30, 2017 Alpha Beta Information Ratio Sharpe Ratio Tracking Error R-Squared Up Market Capture Down Market Capture Inception Date CS McKee /01/2010 Bloomberg Barclays U.S. Aggregate Index /01/2010 Trailing Period Performance 4.0 Growth of $1 - Since Inception $1.6 Return $1.4 $1.2 $1.3 $ Quarter Year Years 5 Years $1.0 $0.8 4/10 4/11 4/12 4/13 4/14 4/15 4/16 9/17 CS McKee CS McKee Bloomberg Barclays U.S. Aggregate Index Bloomberg Barclays U.S. Aggregate Index Calendar Year Performance 12.0 Risk/Return - Since Inception 5.6 Return Return (%) Risk (Standard Deviation %) Return Standard Deviation CS McKee CS McKee Bloomberg Barclays U.S. Aggregate Index pr Bloomberg Barclays U.S. Aggregate Index ¾ Median East Bay Municipal Utility District 35
193 Western Asset - Bank Loans - gross of fees As of September 30, 2017 Alpha Beta Information Ratio Sharpe Ratio Tracking Error R-Squared Up Market Capture Down Market Capture Inception Date Western Asset - Bank Loans /01/2014 S&P/LSTA Performing Loans Index /01/1999 Trailing Period Performance 8.0 Growth of $1 - Since Inception $1.4 Return $1.2 $1.2 $ $ Quarter 1 Year 3 Years $0.8 Western Asset - Bank Loans 2/14 8/14 2/15 8/15 2/16 8/16 2/17 9/17 S&P/LSTA Performing Loans Index Western Asset - Bank Loans S&P/LSTA Performing Loans Index Calendar Year Performance 18.0 Risk/Return - Since Inception 5.4 Return Return (%) Risk (Standard Deviation %) Return Standard Deviation Western Asset - Bank Loans Western Asset - Bank Loans S&P/LSTA Performing Loans Index pr S&P/LSTA Performing Loans Index ¾ Median East Bay Municipal Utility District 36
194 Western Asset - Short-Term HY - gross of fees As of September 30, 2017 Alpha Beta Information Ratio Sharpe Ratio Tracking Error R-Squared Up Market Capture Down Market Capture Inception Date Western Asset - Short-Term HY /01/2014 Bbg BC U.S. High Yield 1-5 Yr Cash Pay 2% /01/1993 Trailing Period Performance 12.0 Growth of $1 - Since Inception $1.4 Return $1.2 $1.0 $1.2 $ Quarter 1 Year Years $0.8 $0.6 2/14 8/14 2/15 8/15 2/16 8/16 2/17 9/17 Western Asset - Short-Term HY Bbg BC U.S. High Yield 1-5 Yr Cash Pay 2% Western Asset - Short-Term HY Bbg BC U.S. High Yield 1-5 Yr Cash Pay 2% Calendar Year Performance 30.0 Risk/Return - Since Inception 9.0 Return Return (%) Risk (Standard Deviation %) Return Standard Deviation Western Asset - Short-Term HY Western Asset - Short-Term HY Bbg BC U.S. High Yield 1-5 Yr Cash Pay 2% pr Bbg BC U.S. High Yield 1-5 Yr Cash Pay 2% ¾ Median East Bay Municipal Utility District 37
195 Western Asset - Short Duration - gross of fees As of September 30, 2017 Alpha Beta Information Ratio Sharpe Ratio Tracking Error R-Squared Up Market Capture Down Market Capture Inception Date Western Asset - Short Duration /01/2014 Bloomberg Barclays 1-3 Year Gov/Credit Index /01/2014 Trailing Period Performance 2.0 Growth of $1 - Since Inception $1.1 Return $1.0 $1.1 $ Quarter 1 Year 3 Years $0.9 3/14 9/14 3/15 9/15 3/16 9/16 3/17 9/17 Western Asset - Short Duration Bloomberg Barclays 1-3 Year Gov/Credit Index Western Asset - Short Duration Bloomberg Barclays 1-3 Year Gov/Credit Index Calendar Year Performance 2.4 Risk/Return - Since Inception 3.2 Return Return (%) Risk (Standard Deviation %) Return Standard Deviation Western Asset - Short Duration Western Asset - Short Duration Bloomberg Barclays 1-3 Year Gov/Credit Index pr Bloomberg Barclays 1-3 Year Gov/Credit Index ¾ Median East Bay Municipal Utility District 38
196 PERFORMANCE MONITORING SUMMARY CURRENT STATUS Portfolio Violation Type (Window)* Date of Initial Violation Correction Action(s) Current Status Est. Beg. Date of Current Status Months Since Est. Beg. Date Performance Since Est. Beg. Date** CenterSquare Org. N/A Placed on Watch status (Nov-17) Watch 12/01/ FTSE NAREIT Equity REIT WAMCO-Short-Term HY N/A N/A Placed on Watch (Mar-16) Watch 04/01/ BC 1-5Yr US HY Cash Pay 13.2 WAMCO-Bank Loans N/A N/A Placed on Watch (Mar-16) Watch 04/01/ S&P/LSTA Perf. Loans 7.8 Intech Long-Term 9/30/2014 Placed on Watch (Nov-14) Watch 12/01/ Russell 1000 Growth Opus Short-Term 9/30/2012 Placed on Watch (Nov-12), (Mar-14) Watch 12/01/ Russell 1000 Value *Defined as: Short-Term (12 months), Medium-Term (36 months), Long-Term (60 months) **Annualized for periods greater than 12 months The Board placed the WAMCO Short-Term High Yield account and the WAMCO Bank Loans account on Watch at the March 2016 Board meeting due to performance concerns. Although the accounts had not breached the Manager Watch Criteria at the time, the accounts continued benchmark and peer-relative underperformance since its funding in early 2014 raised concern. The WAMCO Short-Term High Yield portfolio formally breached the short-term relative to benchmark Watch criteria as of the period ended March The portfolio also breached the medium-term relative to benchmark Watch criteria as of the period ended September Since its Watch period began, the portfolio produced a 12.3% 18-month return, which underperformed the benchmark by (90) basis points. Since its Watch period began, the WAMCO Bank Loans account produced an 8.2% return, which outperformed the benchmark by 40 basis points. The Board placed Intech on Watch as of December 2014 due to performance concerns. Since its Watch period began, Intech produced a 12.4% 34-month return, which outperformed the benchmark by 1.2%. The Board placed Opus on Watch as of December 2012 due to performance concerns. Since its Watch period began, Opus produced a 13.3% 58-month return, which underperformed the benchmark by (70) basis points. As of the end of the latest quarter, no new managers are recommended for Watch due to performance concerns (please refer to Section 5). PCA recommended that CenterSquare be placed on Watch status for organizational concerns upon the announcement of the anticipated change in ownership (please refer to Section 6). The Board approved the recommendation at its November Board meeting. 39
197 MANAGER WATCH SCREENS Quantitative Compliance Monitoring per Watch Criteria ACTIVE MANAGEMENT CRITERIA Active investment managers are expected to outperform their respective passive benchmarks related to both their asset class and investment style. Relative excess performance that falls below the red acceptable threshold stated in the Watch Criteria for six consecutive months may be a trigger for Watch status. PASSIVE MANAGEMENT CRITERIA Passive investment managers are expected to track the performance of their respective passive benchmarks related to both their asset class and their investment style. Tracking error is a measure of how closely a portfolio follows the index to which it is benchmarked. For short- and medium-term performance monitoring, a portfolio with tracking error that is above the red acceptable threshold stated in the Watch Criteria for six consecutive months may be a trigger for Watch status. For long-term performance monitoring, relative excess performance that falls below the red acceptable threshold stated in the Watch Criteria for six consecutive months may be a trigger for Watch status. Quantitative Monitoring Results - Overall Status Summary Prior Qtr Status Current Qtr Status Northern Trust R1000 Acceptable Acceptable Intech Acceptable Acceptable T.Rowe Price Acceptable Acceptable Barrow Hanley Acceptable Acceptable Northern Trust R2000G Acceptable Acceptable Opus Caution Acceptable Franklin Templeton Acceptable Acceptable Fisher Investments Acceptable Acceptable Parametric BXM Caution Caution Parametric Delta Shift Acceptable Acceptable Van Hulzen Acceptable Acceptable CS McKee Acceptable Acceptable WAMCO Short Duration Acceptable Acceptable WAMCO Short-Term HY Acceptable Caution WAMCO Bank Loans Acceptable Acceptable 40
198 Investment Performance Criteria by Asset Class Asset Class Short-term (rolling 12-month periods) Medium-term (rolling 36-month periods) Long-term (60+ months) Domestic Equity - Active Fund return < benchmark return - 3.5% Fund annualized return < benchmark annualized return -1.75% for 6 consecutive months Domestic Equity - Passive Tracking error > 0.30% Tracking error > 0.25% for 6 consecutive months International Equity - Active Fund return < benchmark return - 4.5% Fund annualized return < benchmark annualized return -2.0% for 6 consecutive months VRR < 0.97 for 6 consecutive months Fund annualized return < benchmark annualized return -0.40% for 6 consecutive months VRR < 0.97 for 6 consecutive months Covered Calls - Active Fund return < benchmark return - 3.5% Fund annualized return < benchmark annualized return -1.75% for 6 consecutive months VRR < 0.97 for 6 consecutive months Covered Calls - Replication Tracking error > 0.30% Tracking error > 0.25% for 6 consecutive months Fixed Income - Core Active Fund return < benchmark return - 1.5% Fund annualized return < benchmark annualized return -1.0% for 6 consecutive months Fixed Income - Core Passive Tracking error > 0.25% Tracking error > 0.20% for 6 consecutive months Fixed Income - Non-Core Fund return < benchmark return - 4.5% Fund annualized return < benchmark annualized return - 2.0% for 6 consecutive months Fund annualized return < benchmark annualized return % for 6 consecutive months VRR < 0.98 for 6 consecutive months Fund annualized return < benchmark annualized return % for 6 consecutive months VRR < 0.97 for 6 consecutive months All criteria are on an annualized basis. VRR Value Relative Ratio is calculated as: manager cumulative return / benchmark cumulative return. 41
199 Excess Annualized Return, % Tracking Error, % Tracking Error, % Northern R Domestic Equity: Large Cap Core Manager Performance Quarter 1 Year 3 Year 5 Year Northern R Russell Overall Status: Acceptable 0.30 Short-Term Performance Evaluation Short-Term Criteria (rolling 12-month periods) Tracking error > 0.30% for 6 consecutive months Current Status: Acceptable Apr-17 May-17 Jun-17 Jul-17 Aug-17 Sep Medium-Term Performance Evaluation 0.25 Medium-Term Criteria (rolling 36-month periods) 0.20 Tracking error > 0.25% for 6 consecutive months Current Status: Acceptable Apr-17 May-17 Jun-17 Jul-17 Aug-17 Sep-17 Long-Term Criteria (60+ months) Fund annualized return < benchmark annualized return -0.40% for 6 consecutive months Current Status: Acceptable Longer-Term Performance Evaluation Apr-17 May-17 Jun-17 Jul-17 Aug-17 Sep-17 42
200 Total Relative Return Excess Annualized Return, % Excess Annualized Return, % Intech - Domestic Equity: Large Cap Growth Manager Performance 3 Months 1 Year 3 Years 5 Years Watch-34 Months Intech Russell 1000 Grow th Overall Status: Acceptable Short-Term Criteria (rolling 12-month periods) Fund return < benchmark return -3.5% for 6 consecutive months Short-Term Performance Evaluation Current Status: Acceptable -3.5 Apr-17 May-17 Jun-17 Jul-17 Aug-17 Sep Medium-Term Performance Evaluation Medium-Term Criteria (rolling 36-month periods) Fund annualized return < benchmark annualized return -1.75% for 6 consecutive months Current Status: Acceptable Apr-17 May-17 Jun-17 Jul-17 Aug-17 Sep Longer-Term Performance Evaluation Long-Term Criteria (60+ months) VRR < 0.97 for 6 consecutive months Current Status: Acceptable Apr-17 May-17 Jun-17 Jul-17 Aug-17 Sep-17 43
201 Total Relative Return Excess Annualized Return, % Excess Annualized Return, % T. Rowe Price - Domestic Equity: Large Cap Growth Manager Performance Quarter 1 Year 3 Year 5 Year T Rowe Price Russell 1000 Grow th Overall Status: Acceptable Short-Term Criteria (rolling 12-month periods) Fund return < benchmark return -3.5% for 6 consecutive months Current Status: Acceptable Short-Term Performance Evaluation -4.0 Apr-17 May-17 Jun-17 Jul-17 Aug-17 Sep-17 Medium-Term Criteria (rolling 36-month periods) Fund annualized return < benchmark annualized return -1.75% for 6 consecutive months Current Status: Acceptable Medium-Term Performance Evaluation -2.0 Apr-17 May-17 Jun-17 Jul-17 Aug-17 Sep-17 Longer-Term Performance Evaluation Long-Term Criteria (60+ months) VRR < 0.97 for 6 consecutive months Current Status: Acceptable Apr-17 May-17 Jun-17 Jul-17 Aug-17 Sep-17 44
202 Total Relative Return Excess Annualized Return, % Excess Annualized Return, % Barrow Hanley - Domestic Equity: Large Cap Value Manager Performance Quarter 1 Year 3 Year 5 Year Barrow Russell 1000 Value Overall Status: Acceptable Short-Term Criteria (rolling 12-month periods) Fund return < benchmark return -3.5% for 6 consecutive months Current Status: Acceptable Short-Term Performance Evaluation Apr-17 May-17 Jun-17 Jul-17 Aug-17 Sep-17 Medium-Term Criteria (rolling 36-month periods) Fund annualized return < benchmark annualized return -1.75% for 6 consecutive months Current Status: Acceptable Medium-Term Performance Evaluation Apr-17 May-17 Jun-17 Jul-17 Aug-17 Sep Longer-Term Performance Evaluation Long-Term Criteria (60+ months) VRR < 0.97 for 6 consecutive months Current Status: Acceptable Apr-17 May-17 Jun-17 Jul-17 Aug-17 Sep-17 45
203 Excess Annualized Return, % Tracking Error, % Tracking Error, % Northern R Domestic Equity: Small Cap Growth Manager Performance Quarter 1 Year 3 Year 5 Year Northern R Russell 2000 Grow th Overall Status: Acceptable 0.30 Short-Term Performance Evaluation Short-Term Criteria (rolling 12-month periods) Tracking error > 0.30% for 6 consecutive months Current Status: Acceptable Apr-17 May-17 Jun-17 Jul-17 Aug-17 Sep Medium-Term Performance Evaluation Medium-Term Criteria (rolling 36-month periods) Tracking error > 0.25% for 6 consecutive months Current Status: Acceptable Apr-17 May-17 Jun-17 Jul-17 Aug-17 Sep-17 Long-Term Criteria (60+ months) Fund annualized return < benchmark annualized return -0.40% for 6 consecutive months Current Status: Acceptable Longer-Term Performance Evaluation Apr-17 May-17 Jun-17 Jul-17 Aug-17 Sep-17 46
204 Total Relative Return Excess Annualized Return, % Excess Annualized Return, % Opus - Domestic Equity: Small Cap Value Manager Performance 3 Months 1 Year 3 Years 5 Years Watch-58 Months Opus Russell 2000 Value Overall Status: Acceptable Short-Term Criteria (rolling 12-month periods) Fund return < benchmark return -3.5% for 6 consecutive months Current Status: Acceptable Short-Term Performance Evaluation Apr-17 May-17 Jun-17 Jul-17 Aug-17 Sep-17 Medium-Term Criteria (rolling 36-month periods) Fund annualized return < benchmark annualized return -1.75% for 6 consecutive months Current Status: Acceptable Medium-Term Performance Evaluation Apr-17 May-17 Jun-17 Jul-17 Aug-17 Sep Longer-Term Performance Evaluation Long-Term Criteria (60+ months) VRR < 0.97 for 6 consecutive months Current Status: Acceptable Apr-17 May-17 Jun-17 Jul-17 Aug-17 Sep-17 47
205 Total Relative Return Excess Annualized Return, % Excess Annualized Return, % Franklin Templeton - International Equity Manager Performance Quarter 1 Year 3 Year 5 Year Franklin Aggregate EBMUD MSCI ACWI ex US Blend Overall Status: Acceptable Short-Term Criteria (rolling 12-month periods) Fund return < benchmark return -4.5% for 6 consecutive months Current Status: Acceptable Short-Term Performance Evaluation Apr-17 May-17 Jun-17 Jul-17 Aug-17 Sep-17 Medium-Term Criteria (rolling 36-month periods) Fund annualized return < benchmark annualized return -2.0% for 6 consecutive months Current Status: Acceptable Medium-Term Performance Evaluation Apr-17 May-17 Jun-17 Jul-17 Aug-17 Sep-17 Long-Term Criteria (60+ months) VRR < 0.97 for 6 consecutive months Current Status: Acceptable Longer-Term Performance Evaluation Apr-17 May-17 Jun-17 Jul-17 Aug-17 Sep-17 48
206 Total Relative Return Excess Annualized Return, % Excess Annualized Return, % Fisher - International Equity Manager Performance Quarter 1 Year 3 Year 5 Year Fisher EBMUD MSCI ACWI ex US Blend Overall Status: Acceptable Short-Term Criteria (rolling 12-month periods) Fund return < benchmark return -4.5% for 6 consecutive months Current Status: Acceptable Short-Term Performance Evaluation Apr-17 May-17 Jun-17 Jul-17 Aug-17 Sep-17 Medium-Term Criteria (rolling 36-month periods) Fund annualized return < benchmark annualized return -2.0% for 6 consecutive months Current Status: Acceptable Medium-Term Performance Evaluation Apr-17 May-17 Jun-17 Jul-17 Aug-17 Sep-17 Long-Term Criteria (60+ months) VRR < 0.97 for 6 consecutive months Current Status: Acceptable Longer-Term Performance Evaluation Apr-17 May-17 Jun-17 Jul-17 Aug-17 Sep-17 49
207 Tracking Error, % Tracking Error, % Parametric - BXM - Covered Calls: Replication Manager Performance Quarter 1 Year 3 Year 5 Year Parametric BXM NA CBOE BXM Index Overall Status: Caution* Short-Term Criteria (rolling 12-month periods) Tracking error > 0.30% for 6 consecutive months Current Status: Caution* Short-Term Performance Evaluation Apr-17 May-17 Jun-17 Jul-17 Aug-17 Sep-17 Medium-Term Criteria (rolling 36-month periods) Tracking error > 0.25% for 6 consecutive months Current Status: Caution* Medium-Term Performance Evaluation 0.0 Mar-17 Apr-17 May-17 Jun-17 Jul-17 Aug-17 Sep-17 Long-Term Criteria (60+ months) Fund annualized return < benchmark annualized return -0.40% for 6 consecutive months Current Status: N/A (will take effect 3Q 2019) *The Parametric BXM covered calls strategy breached the short-term relative to benchmark Watch Criteria. The strategy is currently monitored utilizing the covered calls replication (passive management) Watch Criteria. Since the strategy is not solely passively managed PCA believes the actively managed covered calls Watch Criteria would be more suitable for monitoring the fund. As such, PCA does not recommend Watch status for this strategy at this time. ^Medium-Term criteria took effect 3Q
208 Excess Annualized Return, % Excess Annualized Return, % Parametric - Delta Shift - Covered Calls: Semi-Active Manager Performance Quarter 1 Year 3 Year 5 Year Parametric Delta NA CBOE BXM Index Overall Status: Acceptable Short-Term Criteria (rolling 12-month periods) Fund return < benchmark return -3.5% for 6 consecutive months Current Status: Acceptable Short-Term Performance Evaluation Apr-17 May-17 Jun-17 Jul-17 Aug-17 Sep-17 Medium-Term Criteria (rolling 36-month periods) Fund annualized return < benchmark annualized return -1.75% for 6 consecutive months Current Status: Acceptable Medium-Term Performance Evaluation Apr-17 May-17 Jun-17 Jul-17 Aug-17 Sep-17 Long-Term Criteria (60+ months) VRR < 0.97 for 6 consecutive months Current Status: N/A (will take effect 3Q 2019) *Medium-Term criteria took effect 3Q
209 Excess Annualized Return, % Excess Annualized Return, % Van Hulzen - Covered Calls: Active Manager Performance Quarter 1 Year 3 Year 5 Year Van Hulzen NA CBOE BXM Index Overall Status: Acceptable Short-Term Criteria (rolling 12-month periods) Fund return < benchmark return -3.5% for 6 consecutive months Current Status: Acceptable Short-Term Performance Evaluation Apr-17 May-17 Jun-17 Jul-17 Aug-17 Sep Medium-Term Performance Evaluation Medium-Term Criteria (rolling 36-month periods) Fund annualized return < benchmark annualized return -1.75% for 6 consecutive months Current Status: Acceptable Apr-17 May-17 Jun-17 Jul-17 Aug-17 Sep-17 Long-Term Criteria (60+ months) VRR < 0.97 for 6 consecutive months Current Status: N/A (will take effect 3Q 2019) *Medium-Term criteria took effect 3Q
210 Total Relative Return Excess Annualized Return, % Excess Annualized Return, % CS McKee - Fixed Income: Core Manager Performance Quarter 1 Year 3 Year 5 Year CS M ckee BC Aggregate Bond Overall Status: Acceptable 2.0 Short-Term Performance Evaluation Short-Term Criteria (rolling 12-month periods) Fund return < benchmark return -1.5% for 6 consecutive months Current Status: Acceptable Apr-17 May-17 Jun-17 Jul-17 Aug-17 Sep-17 Medium-Term Criteria (rolling 36-month periods) Fund annualized return < benchmark annualized return -1.0% for 6 consecutive months Current Status: Acceptable Medium-Term Performance Evaluation Apr-17 May-17 Jun-17 Jul-17 Aug-17 Sep Longer-Term Performance Evaluation Long-Term Criteria (60+ months) VRR < 0.98 for 6 consecutive months Current Status: Acceptable Apr-17 May-17 Jun-17 Jul-17 Aug-17 Sep-17 53
211 Excess Annualized Return, % Excess Annualized Return, % WAMCO - Short Duration - Fixed Income: Non-Core Manager Performance Quarter 1 Year 3 Year 5 Year WAM CO Short Dur NA Barclays 1-3 Yr Gov/Credit Overall Status: Acceptable Short-Term Criteria (rolling 12-month periods) Fund return < benchmark return -4.5% for 6 consecutive months Short-Term Performance Evaluation Current Status: Acceptable -4.5 Apr-17 May-17 Jun-17 Jul-17 Aug-17 Sep-17 Medium-Term Criteria (rolling 36-month periods) Fund annualized return < benchmark annualized return -2.0% for 6 consecutive months Current Status: Acceptable Medium-Term Performance Evaluation Apr-17 May-17 Jun-17 Jul-17 Aug-17 Sep-17 Long-Term Criteria (60+ months) VRR < 0.97 for 6 consecutive months Current Status: N/A (will take effect 3Q 2019) *Medium-Term criteria took effect 3Q
212 Excess Annualized Return, % Excess Annualized Return, % WAMCO - Short-Term High Yield - Fixed Income: Non-Core Manager Performance Quarter 1 Year 3 Year 5 Year Watch - 18 mon WAM CO High Yield NA 12.3 Barclays US High Yield 1-5 Yr Cash Pay 2% Overall Status: Caution Short-Term Criteria (rolling 12-month periods) Fund return < benchmark return -4.5% for 6 consecutive months Short-Term Performance Evaluation Current Status: Acceptable -11 Apr-17 May-17 Jun-17 Jul-17 Aug-17 Sep Medium-Term Performance Evaluation Medium-Term Criteria (rolling 36-month periods) Fund annualized return < benchmark annualized return -2.0% for 6 consecutive months Current Status: Caution Apr-17 May-17 Jun-17 Jul-17 Aug-17 Sep-17 Long-Term Criteria (60+ months) VRR < 0.97 for 6 consecutive months Current Status: N/A (will take effect 3Q 2019) *Medium-Term criteria took effect 3Q
213 Excess Annualized Return, % Excess Annualized Return, % WAMCO - Bank Loans - Fixed Income: Non-Core Manager Performance Quarter 1 Year 3 Year 5 Year Watch - 18 mon WAM CO Bank Loans NA 8.2 S&P/LSTA Performing Loans Index Overall Status: Acceptable Short-Term Criteria (rolling 12-month periods) Fund return < benchmark return -4.5% for 6 consecutive months Short-Term Performance Evaluation Current Status: Acceptable -4.5 Apr-17 May-17 Jun-17 Jul-17 Aug-17 Sep-17 Medium-Term Criteria (rolling 36-month periods) Fund annualized return < benchmark annualized return -2.0% for 6 consecutive months Current Status: Acceptable Medium-Term Performance Evaluation Apr-17 May-17 Jun-17 Jul-17 Aug-17 Sep-17 Long-Term Criteria (60+ months) VRR < 0.97 for 6 consecutive months Current Status: N/A (will take effect 3Q 2019) *Medium-Term criteria took effect 3Q
214 Total Relative Return Excess Annualized Return, % Excess Annualized Return, % CenterSquare - Real Estate: Public REITs Manager Performance Quarter 1 Year 3 Year 5 Year CenterSquare FTSE NAREIT Equity REITS Overall Status: Acceptable Short-Term Criteria (rolling 12-month periods) Fund return < benchmark return -3.5% for 6 consecutive months Current Status: Acceptable Short-Term Performance Evaluation -6.0 Apr-17 May-17 Jun-17 Jul-17 Aug-17 Sep-17 Medium-Term Criteria (rolling 36-month periods) Fund annualized return < benchmark annualized return -1.75% for 6 consecutive months Current Status: Acceptable Medium-Term Performance Evaluation -2.0 Apr-17 May-17 Jun-17 Jul-17 Aug-17 Sep Longer-Term Performance Evaluation Long-Term Criteria (60+ months) VRR < 0.97 for 6 consecutive months Current Status: Acceptable Apr-17 May-17 Jun-17 Jul-17 Aug-17 Sep-17 57
215 MANAGER COMPLIANCE CERTIFCATION RESPONSES Qualitative Compliance Monitoring per EBMUD Investment Policy Each of EBMUD s managers is required to respond to a questionnaire on a quarterly basis to certify their compliance with EBMUD s Investment Policy Statement and provide an update on specific qualitative indicators to be evaluated. These indicators include: Compliance with the guidelines of Eligible Investments for the manager s specific mandate Any litigation or governmental regulatory proceedings involving the firm/manager Changes to the manager s investment outlook, investment strategy, and/or portfolio structure Personnel changes to the investment team responsible for the EBMUD mandate Significant personnel changes at the management level of the firm Material client terminations Compliance with EBMUD s current Investment Policy Statement The manager s responses are rated based on the potential effects these factors could pose to the performance and management of the EBMUD portfolio. Reasons for heightened concern triggering Watch status include, but are not limited to: Instability of key members of the portfolio management team and organization Changes in investment strategy and style Failure to comply with investment guidelines A summary of manager responses as of the latest quarter-end is provided below. 58
216 MANAGER COMPLIANCE CERTIFCATION RESPONSES Manager Northern R1000 Intech Asset Class Domestic Equity LCC Domestic Equity LCG T. Rowe Price Domestic Equity LCG Barrow Hanley Northern R2000G Opus Franklin Templeton Fisher Domestic Equity LCV Domestic Equity SCG Domestic Equity SCV International Equity International Equity Question 1 Question 2 Question 3 Question 4 Question 5 Question 6 Question 7 Question 8 Changes in Compliance with Eligible Investments for mandate Good standing as Registered Investment Advisor Litigation? manager s investment outlook, strategy, structure Investment team personnel changes Management level personnel changes Material business changes Compliance with IPS Yes Yes Yes* No No Yes* No Yes Yes Yes Yes* No No No Yes* Yes Additional Comments Yes Yes Yes* No No No No Yes See below Yes Yes No No No Yes* No Yes Yes Yes Yes* No No Yes* No Yes Yes Yes No No No No Yes* Yes Yes Yes No* No No No No Yes Yes Yes No No No No No Yes Parametric Covered Calls Yes Yes No* No No No No Yes Van Hulzen Covered Calls Yes Yes No No No Yes* No Yes CS McKee Fixed Income Core WAMCO Fixed Income Short Dur. WAMCO Fixed Income Short-term HY WAMCO Fixed Income Bank Loans Yes Yes No No No No No Yes Yes Yes No No Yes* No No Yes Yes Yes No No Yes* No No Yes Yes Yes No No Yes* No No Yes RREEF Real Estate Yes Yes No No No No No Yes CenterSquare Real Estate Yes Yes No No No No Yes* Yes *see detailed manager response below = no concern; = low concern; = high concern (Watch status) 59
217 Northern Trust R1000 and R2000 Growth Question 3: Is there any litigation or governmental regulatory proceedings involving your Firm, the Manager? As one of the world's largest asset managers, Northern Trust Investments, Inc. (NTI) is occasionally named as a defendant in asset management-related litigation. NTI is not currently party to any litigation that has had (or will have) a material effect on its ability to perform services for its clients. At this time, there are no significant pending cases. As one of the world's leading providers of asset servicing, Northern Trust and its subsidiaries occasionally receive requests for information from government and regulatory agencies. Northern Trust frequently does not know if such requests are related to a formal government or regulatory investigations or, assuming an investigation is underway, whether Northern Trust is a target of such investigation or simply thought to be in possession of information pertinent to such investigation. Northern Trust is not currently involved in any government or regulatory investigation or proceeding that would have a material impact on its ability to provide advisory services to its clients. Question 6: Have there been any significant changes at the management level of the Firm during the quarter? Effective January 1, 2018, Frederick Waddell, Chairman and Chief Executive Officer, will be stepping down from his role as Chief Executive Officer. Michael O Grady, will assume the role of Chief Executive Officer, in addition to his current position as President of Northern Trust. Mr. Waddell, who has served as Chief Executive Officer since January 2008, will remain as Chairman of the Board, a position he has held since November In October 2017, Shundrawn Thomas, former Executive Vice President and Head of Funds and Managed Accounts group, was appointed President of Northern Trust Asset Management, reporting to Michael O'Grady, President of Northern Trust. Shundrawn succeeds Steve Potter. Mr. Potter was appointed to a new role as Vice Chairman, responsible for overseeing strategic initiatives and developing relationships with select clients and prospects around the globe and reports directly to the Chief Executive Officer, Rick Waddell. 60
218 Intech Question 3: Is there any litigation or governmental regulatory proceedings involving your Firm, the Manager? INTECH is not currently involved in any litigation that would be considered material. However, in June 2011, INTECH was served with a complaint related to the leveraged buyout ( LBO ) of Tribune Company ( Tribune ) in 2007 (Deutsche Bank Trust Co. Americas, et al. v. Sowood Alpha Fund LP, et al., U.S. District Court, Southern District of New York). On December 8, 2008, one year after completion of the LBO, Tribune and certain of its subsidiaries filed for relief under Chapter 11 of the Bankruptcy Code in the Bankruptcy Court for the District of Delaware. INTECH believes it was improperly named in this lawsuit as it never owned the stock at issue. INTECH intends to defend the action once the stay is lifted. Question 7: Have there been any material changes in your firm s business during the quarter, including but not limited to: a. any client(s) that terminated its relationship whose terminated portfolio account represents > 1% of the Manager s aggregate portfolio on the day of notice of termination, and/or b. any client(s) that terminates its relationship when the cumulative terminations for a calendar month is > 1% of the Manager s aggregate portfolio as of the first business day of the month. During the month of July 2017, approximately $535 million cumulative assets (representing approximately 1.15% of Intech s total AUM as of July 1 st ) terminated from Intech s US and Global Products. The terminations were primarily related to asset allocation to other strategies. 61
219 T. Rowe Price Question 3: Is there any litigation or governmental regulatory proceedings involving your Firm, the Manager? T. Rowe Price Associates, Inc., its subsidiaries, affiliates, officers, and employees (collectively the Company ) has not been involved as a defendant in any notable litigation matter relating to any business practice or relating to services rendered to the firm s clients, with the exceptions of the cases noted below. At times, the Company may be a claimant or a plaintiff in various matters involving portfolio company investments. Additionally, from time to time in the normal course of business, the Company is named as a party to minor litigation matters involving the accounts of Price mutual fund shareholders, retirement plan participants, or of retail customers in the Company s brokerage unit. Often, the Company is named as a stakeholder. These minor litigation matters are not disclosed here. Tribune Company Bankruptcy Proceeding: Several of the T. Rowe Price Funds, sub advised clients, and institutional clients are included in a class of defendants in connection with a fraudulent transfer lawsuit that the Unsecured Creditors Committee (the Committee ) of the Tribune Company filed in Delaware bankruptcy court. In addition, various T. Rowe Price entities and certain of the T. Rowe Price Funds, institutional clients, and sub advised clients were sued in a number of federal and state courts in various states in connection with receipt of proceeds from a leveraged buyout ( LBO ) through which Tribune converted to a privately owned company in These lawsuits alleged constructive fraudulent transfer claims in an attempt to recover payments made to shareholders at the time of the LBO. The lawsuits did not allege that any of the T. Rowe Price defendants engaged in wrongful conduct. The lawsuits were consolidated by the Multidistrict Litigation Panel for purposes of all pretrial proceedings. On September 23, 2013, the court in the consolidated cases granted a motion to dismiss those cases. The judge ruled that the plaintiff investors may not pursue the constructive fraudulent transfer lawsuits against Tribune s former shareholders while the Litigation Trustee in the bankruptcy case also pursues his intentional fraudulent transfer claims against the same shareholders. The dismissal of the consolidated cases was appealed, and on March 29, 2016, the Second Circuit Court of Appeals affirmed the dismissal. The plaintiffs have filed a petition for a writ of certiorari with the Supreme Court. The Supreme Court removed the petition from its December 9, 2016, calendar, and the matter has not yet been rescheduled. On January 9, 2017, the district court granted the motion to dismiss the intentional fraudulent transfer case brought by the bankruptcy trustee. On December 19, 2011, Sam Zell, through various entities, filed two lawsuits in Cook County, Illinois naming the other shareholder defendants as a means of preserving any rights of recovery the Zell entities may have against former shareholders related to the LBO in the event that the LBO is found to have been a fraudulent conveyance. Christopher Zoidis, et al. v. T. Rowe Price Associates, Inc.: On April 27, 2016 a lawsuit was filed by Christopher Zoidis, et al. against T. Rowe Price Associates, Inc. in the United States District Court for the Northern District of California, alleging breach of fiduciary duty under Section 36(b) of the Investment Company Act of The Complaint was served on April 28, 2016, and T. Rowe is defending the case. On August 4, 2016, the court granted a motion to transfer the case to the District of Maryland. The Court denied the motion to dismiss on March 31, T. Rowe filed an answer to the complaint on April 17, 2017, and is in the discovery phase of the litigation. 62
220 David G. Feinberg v. T Rowe Price Group, Inc., et al. T. Rowe Price Group, Inc., two of its subsidiaries, current and former members of its management committee, and trustees of the T. Rowe Price U.S. Retirement Program are named as defendants in a lawsuit filed on February 14, 2017 in the United States District Court for the District of Maryland. The T. Rowe Price U.S. Retirement Program is a retirement plan offered to T. Rowe Price employees. The plaintiff is a former employee who alleges breaches of fiduciary duty under ERISA with regard to the retirement plan. After T.Rowe filed a motion to dismiss, an amended complaint was filed on July 20, 2017, which included additional plaintiffs (current and former employees) and added additional detail concerning certain allegations. T.Rowe believes the complaint is without merit, and are vigorously defending the case. T.Rowe filed a motion to dismiss the amended complaint on September 12, Additional Disclosures In August 2017, T. Rowe Price Associates, Inc. ( TRPA ) was notified that the SEC is conducting an examination of TRPA and certain Price Funds to assess compliance with Investment Advisers Act and Investment Company Act rules pertaining to target date funds. T.Rowe has produced all documentation requested to date in response to this sweep examination. In July 2017, T. Rowe Price Associates, Inc. ( TRPA ) was notified that the SEC is conducting an examination of TRPA and certain Price Funds to assess compliance with Investment Advisers Act and Investment Company Act rules pertaining to money market funds. T.Rowe has produced all documentation requested to date in response to this sweep examination. Additional Comments With regards to Questions 1 and 8, T. Rowe Price is in compliance with Exhibit A of the Investment Advisory Agreement between The East Bay Municipal Utility District and T. Rowe Price Associates, Inc. ( TRPA ) dated February 21, 2007, which they generally believe complies with EBMUD s Statement of Investment Policy and Procedures. 63
221 Barrow Hanley Question 6: Have there been any significant changes at the management level of the Firm during the quarter? Cory Martin became an Executive Director (previously Managing Director. 64
222 Opus Question 7: Have there been any material changes in your firm s business during the quarter, including but not limited to: a. any client(s) that terminated its relationship whose terminated portfolio account represents > 1% of the Manager s aggregate portfolio on the day of notice of termination, and/or b. any client(s) that terminates its relationship when the cumulative terminations for a calendar month is > 1% of the Manager s aggregate portfolio as of the first business day of the month. Yes; Opus was terminated by a corporate client that is changing their asset allocation. Small Cap Value Strategy. That account was roughly 25% of the 65
223 Franklin Templeton Question 3: Is there any litigation or governmental regulatory proceedings involving your Firm, the Manager? This response is made on behalf of Templeton Investment Counsel, LLC (TIC) and is limited in scope to material, investmentmanagement-related private litigation that has been pending at any time during the last five years ended June 30, 2017, in which TIC or any of its advisory affiliates has been named as a defendant. This response does not include employment-related litigation, litigation arising in the ordinary course of business, litigation in which TIC or any of its advisory affiliates may be a plaintiff, or any regulatory proceedings. (Italicized terms are as defined on U.S. Securities and Exchange Commission Form ADV.) Other Litigation Involving an TIC Advisory Affiliate In July 2016, a former employee filed a putative class action lawsuit against Franklin, the Franklin Templeton 401(k) Retirement Plan (Plan) Investment Committee, and unnamed Investment Committee members. The plaintiff asserts a claim for breach of fiduciary duty under the Employee Retirement Income Security Act, alleging that the defendants selected mutual funds sponsored and managed by the Franklin organization (the Funds) as investment options for the Plan when allegedly lower-cost and better performing non-proprietary investment vehicles were available. The plaintiff also claims that the total Plan costs, inclusive of investment management and administrative fees, are excessive. The plaintiff alleges that Plan losses exceed $79.0 million and seeks, among other things, damages, disgorgement, rescission of the Plan s investments in the Funds, attorneys fees and costs, and pre- and post- judgement interest. Franklin s motion to dismiss and motion for summary adjudication were denied on January 17, On July 26, 2017, the court certified a class of Plan participants. Franklin s management strongly believes that the claims made in the lawsuit are without merit and Franklin is continuing to defend against them vigorously. Discovery is continuing and, at this stage of the litigation, Franklin cannot currently predict the eventual outcome of the lawsuit or whether it will have a material negative impact on Franklin, however TIC is not named as a defendant in the lawsuit and as of June 30, 2017, the litigation is not reasonably expected to have a material adverse effect on TIC s financial condition or its ability to provide investment management services. 66
224 Parametric Question 3: Is there any litigation or governmental regulatory proceedings involving your Firm, the Manager? Parametric is not currently a plaintiff or defendant in any lawsuits or arbitration proceedings related to its investment management services, nor have there been any such lawsuits or arbitration proceedings in the last quarter, against Parametric or any affiliate of Parametric controlled by it. From time to time, Parametric receives subpoenas and/or information requests relating to lawsuits to which Parametric is not a party. These subpoenas and/or information request were/are incidental to Parametric s business and were/are handled in the ordinary course of business. From time to time, Eaton Vance Corp., Parametric s ultimate parent company, and its subsidiaries or employees are and have been plaintiffs or defendants in various lawsuits that are incidental to their businesses and are or were handled in the ordinary course of business. We believe that these actions have not and will not have a material adverse effect on Parametric s ability to manage the accounts in question. 67
225 Van Hulzen Question 6: Have there been any significant changes at the management level of the Firm during the quarter? Van Hulzen added Sean Sowers to strengthen the back office. Mr. Sowers is a Client Advisory Services Associate. Under supervision of Rhett Beal, he is responsible for data management of the portfolio management software and is in a supportive role to the client service team. 68
226 WAMCO Question 5: Have there been any personnel changes to the investment team responsible for the EBMUD portfolio during the quarter? Yes. During the third quarter of 2017, Western Asset hired no new investment professionals while losing one Mr. Gerry Rawcliffe (Research Analyst, London office). 69
227 CenterSquare Question 7: Have there been any material changes in your firm s business during the quarter, including but not limited to: a. any client(s) that terminated its relationship whose terminated portfolio account represents > 1% of the Manager s aggregate portfolio on the day of notice of termination, and/or b. any client(s) that terminates its relationship when the cumulative terminations for a calendar month is > 1% of the Manager s aggregate portfolio as of the first business day of the month. On September 20, 2017, BNY Mellon announced the sale of CenterSquare to management of CenterSquare and private equity firm Lovell Minnick. The new entity, CSIM Investment Management LLC, will purchase the assets of the predecessor CenterSquare companies. Closing is expected by year-end 2017 upon completion of the client assignment and consent process. CenterSquare Investment Management and a private equity fund managed by Lovell Minnick will have ownership in the new entity. Once the transaction closes, CSIM Investment Management LLC will be renamed CenterSquare Investment Management LLC. The Management of CenterSquare expects to continue to provide autonomous real asset investment advisory services to clients. The new governance structure will include a Board of Directors consisting of two members appointed by Lovell Minnick, two members appointed by CenterSquare, and appointment of an independent director by Lovell Minnick. All other CenterSquare firm level and departmental committees will remain in place under new ownership. BNY Mellon will provide IT transitional services until the new entity establishes its new IT platform. The new IT platform will consist of a robust IT Cloud environment hosting all current business applications along with comprehensive Business Continuity and Cybersecurity processes and protections. 70
228 EBMUD PERFORMANCE Net of Fees Manager Mandate Estimated Annual Fee (bps)* Northern Trust R1000 Passive Large Cap Core 3 Intech Active Large Cap Growth 5 bps % on excess returns T. Rowe Price Active Large Cap Growth 49 Barrow Hanley Active Large Cap Value 30 Northern Trust R2000G Passive Small Cap Growth 8 Opus Active Small Cap Value 5 bps + 25% on excess returns Franklin Templeton Active International Equity 57 Fisher Active International Equity 64 Parametric BXM Replication Covered Calls 19 Parametric Delta Shift Semi-Active Covered Calls 33 Van Hulzen Active Covered Calls 25 CS McKee Active Core Fixed Income 20 WAMCO Short Duration Active Non-Core Fixed Income 16 WAMCO Short-Term High Yield Active Non-Core Fixed Income 40 WAMCO Bank Loans Active Non-Core Fixed Income 45 RREEF Real Estate 95 CenterSquare Real Estate 27.5 bps + 15% on excess returns *as of 6/30/
229 Asset Class and Manager Performance (Net of Fees)^ As of September 30, 2017 Asset Class Quarter 1 Year 3 Years 5 Years EBMUD Total Plan Policy Benchmark^^ Domestic Equity Russell 3000* International Equity MSCI ACWI x US (blend)** Covered Calls CBOE BXM Fixed Income Fixed Income benchmark (blend)*** Real Estate NCREIF/NAREIT (blend)**** Cash Citigroup 3 Month T-Bill Index ^Historical net returns for the Total Portfolio aggregate is currently available from 2Q 2011 ^^ Policy Benchmark consists of 40% Russell 3000 (blend), 15% MSCI ACWIxU.S. (blend), 20% CBOE BXM, 10% BC Aggregate, 5% BC US 1-3 Year Government/Credit, 2.5% BC 1-5 Year U.S. High Yield Cash Pay, 2.5% S&P/LSTA Performing Loans, 2.5% NCREIF (lagged), and 2.5% FTSE NAREIT Equity REITs index 4/1/14-present; see Appendix for historical Policy Benchmark composition. *Russell 3000 as of 10/1/05. Prior: 30% S&P500, 10% S&P400, 10% Russell 2000 (4/1/05-9/30/05); 33% S&P500, 10% S&P400, 10% Russell 2000 (9/1/98-3/31/05); 30% S&P500, 15% Wilshire 5000 (4/1/96-8/31/98) **MSCI ACWIxU.S. as of 1/1/07; MSCI EAFE ND thru 12/31/06 ***50% BC Aggregate, 25% BC US 1-3 Year Government/Credit, 12.5% BC 1-5 Year U.S. High Yield Cash Pay, and 12.5% S&P/LSTA Performing Loans index 4/1/14-present; 75% BC Aggregate, 12.5% BC 1-5 Year U.S. High Yield Cash Pay, and 12.5% S&P/LSTA Performing Loans index 3/1/14-3/31/14; BC Universal 1/1/08-2/28/14; BC Aggregate thru 12/31/07 ****50% NCREIF (lagged), 50% FTSE NAREIT Equity REITs Index as of 11/1/11; NCREIF (lagged) thru 10/31/11 East Bay Municipal Utility District 72
230 Manager Performance (Net of Fees) As of September 30, 2017 Manager - Style Domestic Equity Large Cap Core Mkt Value ($000) *On watch as of 12/2014 **On watch as of 12/2012 *** Franklin Templeton s historical returns are reported net of fees (inception-6/30/2011). The Franklin Templeton institutional mutual fund account was liquidated in June 2011 and moved to a transition account which later funded the Franklin Templeton separate account in the same month. The Q return is an aggregate of the institutional mutual fund account, Franklin transition account, and separate account. **** As of January 1, 2007, the benchmark changed from MSCI EAFE to MSCI ACWI x U.S. 1 Quarter Northern Trust Co. - Passive 284, Russell 1000 Index Large Cap Growth Intech - Active* 88, T.Rowe Price - Active 89, Russell 1000 Growth Index Large Cap Value Barrow Hanley - Active 187, Russell 1000 Value Index Small Cap Growth Northern Trust Co. - Passive 31, Russell 2000 Growth Index Small Cap Value Opus - Active** 38, Russell 2000 Value Index International Equity Fisher Investments - Active 120, Franklin Templeton - Active*** 106, MSCI ACWI xus (blend)**** Year 3 Years 5 Years East Bay Municipal Utility District 73
231 Manager Performance (Net of Fees) As of September 30, 2017 Manager - Style Covered Calls *Results are lagged one quarter. **On watch as of 4/2016 ***On watch as of 4/2016 Mkt Value ($000) 1 Quarter Parametric BXM - Replication 117, Parametric Delta Shift - Semi-active 123, Van Hulzen 107, CBOE BXM Real Estate RREEF America II (Lag)* 34, NCREIF NPI (Lag)* CenterSquare 50, FTSE NAREIT Equity REIT Index Total Fixed Income Core Fixed Income CS McKee - Active 141, Bloomberg BC U.S. Aggregate Index Non-Core Fixed Income Western Asset - Bank Loans** - Active 34, S&P/LSTA Performing Loans Index Western Asset - Short-Term HY*** - Active 31, Bloomberg BC US High Yield 1-5 Yr Cash Pay 2% Western Asset - Short Duration - Active 66, Bloomberg BC 1-3 Year Gov/Credit Index Year 3 Years 5 Years East Bay Municipal Utility District 74
232 GLOSSARY OF TERMS Alpha: The premium an investment earns above a set standard. This is usually measured in terms of a common index (i.e., how the stock performs independent of the market). An Alpha is usually generated by regressing a security s excess return on the S&P 500 excess return. Annualized Performance: The annual rate of return that when compounded t times generates the same t-period holding return as actually occurred from period 1 to period t. Batting Average: Percentage of periods a portfolio outperforms a given index. Beta: The measure of an asset s risk in relation to the Market (for example, the S&P 500) or to an alternative benchmark or factors. Roughly speaking, a security with a Beta of 1.5 will have moved, on average, 1.5 times the market return. Bottom-up: A management style that de-emphasizes the significance of economic and market cycles, focusing instead on the analysis of individual stocks. Dividend Discount Model: A method to value the common stock of a company that is based on the present value of the expected future dividends. Growth Stocks: Common stock of a company that has an opportunity to invest money and earn more than the opportunity cost of capital. Information Ratio: The ratio of annualized expected residual return to residual risk. A central measurement for active management, value added is proportional to the square of the information ratio. R-Squared: Square of the correlation coefficient. The proportion of the variability in one series that can be explained by the variability of one or more other series a regression model. A measure of the quality of fit. 100% R-square means perfect predictability. Standard Deviation: The square root of the variance. A measure of dispersion of a set of data from its mean. Sharpe Ratio: A measure of a portfolio s excess return relative to the total variability of the portfolio. Style Analysis: A returns-based analysis using a multi-factor attribution model. The model calculates a product s average exposure to particular investment styles over time (i.e., the product s normal style benchmark). Top-down: Investment style that begins with an assessment of the overall economic environment and makes a general asset allocation decision regarding various sectors of the financial markets and various industries. Tracking Error: The standard deviation of the difference between the performance of a portfolio and an appropriate benchmark. Turnover: For mutual funds, a measure of trading activity during the previous year, expressed as a percentage of the average total assets of the fund. A turnover rate of 25% means that the value of trades represented one-fourth of the assets of the fund. Value Stocks: Stocks with low price/book ratios or price/earnings ratios. Historically, value stocks have enjoyed higher average returns than growth stocks (stocks with high price/book or P/E ratios) in a variety of countries. 75
233 EBMUD POLICY BENCHMARK COMPOSITION Time Period EBMUD Total Fund Policy Benchmark 4/1/2005 9/30/ % S&P 500, 10% S&P Midcap, 10% Russell 2000, 20% MSCI EAFE ND, 25% BC Aggregate, 5% NCREIF (lagged) 10/1/ /31/ % Russell 3000, 20% MSCI EAFE ND, 25% BC Aggregate, 5% NCREIF (lagged) 1/1/ /31/ % Russell 3000, 20% MSCI ACWI x U.S. GD, 25% BC Aggregate, 5% NCREIF (lagged) 1/1/ /31/ % Russell 3000, 20% MSCI ACWI x U.S. GD, 25% BC Universal, 5% NCREIF (lagged) 11/1/2011 2/28/ % Russell 3000, 20% MSCI ACWI x U.S. GD, 25% BC Universal, 2.5% NCREIF (lagged), and 2.5% FTSE NAREIT Equity REITs 3/1/2014 3/31/ % Russell 3000, 20% CBOE BXM, 15% MSCI ACWI x U.S. GD, 15% BC Aggregate, 2.5% BC 1-5 Year U.S. High Yield Cash Pay, 2.5% S&P/LSTA Performing Loans, 2.5% NCREIF (lagged), 2.5% FTSE NAREIT Equity REITs 4/1/2014 present 40% Russell 3000, 20% CBOE BXM, 15% MSCI ACWI x U.S. GD, 10% BC Aggregate, 5% BC US 1-3 Year Government/Credit, 2.5% BC 1-5 Year U.S. High Yield Cash Pay, 2.5% S&P/LSTA Performing Loans, 2.5% NCREIF (lagged), 2.5% FTSE NAREIT Equity REITs 76
234 DEFINITION OF BENCHMARKS BC Aggregate: an index comprised of approximately 6,000 publicly traded investment-grade bonds including U.S. Government, mortgage-backed, corporate, and yankee bonds with an approximate average maturity of 10 years. BC High Yield: covers the universe of fixed rate, non-investment grade debt. Eurobonds and debt issues from countries designated as emerging markets (e.g., Argentina, Brazil, Venezuela, etc.) are excluded, but Canadian and global bonds (SEC registered) of issuers in non-emg countries are included. Original issue zeroes, step-up coupon structures, 144-As and pay-in-kind bonds (PIKs, as of October 1, 2009) are also included. Must be rated high-yield (Ba1/BB+ or lower) by at least two of the following ratings agencies: Moody's, S&P, Fitch. If only two of the three agencies rate the security, the lower rating is used to determine index eligibility. All issues must have at least one year to final maturity regardless of call features and have at least $150 million par amount outstanding. BC Multiverse Non-US Hedged: provides a broad-based measure of the international fixed-income bond market. The index represents the union of the BC Global Aggregate Index and the BC Global High Yield Index. In this sense, the term Multiverse refers to the concept of multiple universes in a single macro index. BC US Credit: includes publicly issued U.S. corporate and foreign debentures and secured notes that which are rated investment grade or higher by Moody s Investor Services, Standard and Poor s Corporation, or Fitch Investor s Service, with all issues having at least one year to maturity and an outstanding par value of at least $250 million. Issues must be publicly issued, dollar-denominated and nonconvertible. BC US Government: includes treasuries (i.e., public obligations of the U.S. Treasury that have remaining maturities of more than one year) and agencies (i.e., publicly issued debt of U.S. Government agencies, quasi-federal corporations, and corporate or foreign debt guaranteed by the U.S. Government). BC Universal: includes market coverage by the Aggregate Bond Index fixed rate debt issues, which are rated investment grade or higher by Moody s Investor Services, Standard and Poor s Corporation, or Fitch Investor s Service, with all issues having at least one year to maturity and an outstanding par value of at least $100 million) and includes exposures to high yield CMBS securities. All returns are market value weighted inclusive of accrued interest. Citigroup 3-Month Treasury Bills (T-bills): tracks the performance of U.S. Treasury bills with 3-month maturity. MSCI ACWI x US ND: comprises both developed and emerging markets less the United States. As of August 2008, the index consisted of 23 counties classified as developed markets and 25 classified as emerging markets. This series approximates the minimum possible dividend reinvestment. The dividend is reinvested after deduction of withholding tax, applying the rate to non-resident individuals who do not benefit from double taxation treaties. MSCI Barra uses withholding tax rates applicable to Luxembourg holding companies, as Luxembourg applies the highest rates. MSCI EAFE Free (Europe, Australasia, Far East) ND: is a free float-adjusted market capitalization index that is designed to measure developed market equity performance, excluding the US & Canada. This series approximates the minimum possible dividend reinvestment. The dividend is reinvested after deduction of withholding tax, applying the rate to non-resident individuals who do not benefit from double taxation treaties. MSCI Barra uses withholding tax rates applicable to Luxembourg holding companies, as Luxembourg applies the highest rates. 77
235 MSCI EM (Emerging Markets) GD: is a free float-adjusted market capitalization index that is designed to measure equity market performance in the global emerging markets. This series approximates the maximum possible dividend reinvestment. The amount reinvested is the entire dividend distributed to individuals resident in the country of the company, but does not include tax credits. MSCI Europe is a free float-adjusted market capitalization weighted index that is designed to measure the equity market performance of the developed markets in Europe. As of June 2007, this index consisted of the following 16 developed market country indices: Austria, Belgium, Denmark, Finland, France, Germany, Greece, Ireland, Italy, the Netherlands, Norway, Portugal, Spain, Sweden, Switzerland, and the United Kingdom. MSCI Pacific is a free float-adjusted market capitalization weighted index that is designed to measure the equity market performance of the developed markets in the Pacific region. As of June 2007, this index consisted of the following 5 Developed Market countries: Australia, Hong Kong, Japan, New Zealand, and Singapore. NAREIT Index: consists of all tax-qualified REITs listed on the New York Stock Exchange, American Stock Exchange, and the NASDAQ National Market System. The data is market weighted. NCREIF Property Index: the NPI contains investment-grade, non-agricultural, income-producing properties which may be financed in excess of 5% gross market value; were acquired on behalf of tax exempt institutions; and are held in a fiduciary environment. Returns are gross of fees; including income, realized gains/losses, and appreciation/depreciation; and are market value weighted. Index is lagged one quarter. Russell 1000: measures the performance of the 1,000 largest securities in the Russell 3000 Index. Russell 1000 is highly correlated with the S&P 500 Index and capitalization-weighted. Russell 1000 Growth: measures the performance of those Russell 1000 securities with a greater-than-average growth orientation. Securities in this index tend to exhibit higher price-to-book and price-earnings ratios, lower dividend yields and higher forecasted growth values than the Value universe. Russell 1000 Value: measures the performance of those Russell 1000 securities with a less-than-average growth orientation. Securities in this index tend to exhibit lower price-to-book and price-earnings ratios, higher dividend yields and lower forecasted growth values than the Growth universe. Russell 2000: measures the performance of the 2,000 smallest companies in the Russell 3000 Index, which represents approximately 8% of the total market capitalization of the Russell 3000 Index. Russell 2000 Growth: measures the performance of those Russell 2000 securities with a greater-than-average growth orientation. Securities in this index tend to exhibit higher price-to-book and price-to-earnings ratios. Russell 2000 Value: measures the performance of those Russell 2000 securities with a less-than-average growth orientation. Securities in this index tend to exhibit lower price-to-book and price-to-earnings ratios. Russell 3000: represents the largest 3,000 US companies based on total market capitalization, representing approximately 98% of the investable US equity market. 78
236 RISK METRIC DESCRIPTION Rationale for selection and calculation methodology US Equity Markets Metric: P/E ratio = Price / Normalized earnings for the S&P 500 Index To represent the price of US equity markets, we have chosen the S&P 500 index. This index has the longest published history of price, is well known, and also has reliable, long-term, published quarterly earnings. The price=p of the P/E ratio is the current price of the market index (the average daily price of the most recent full month for the S&P 500 index). Equity markets are very volatile. Prices fluctuate significantly during normal times and extremely during periods of market stress or euphoria. Therefore, developing a measure of earnings power (E) which is stable is vitally important, if the measure is to provide insight. While equity prices can and do double, or get cut in half, real earnings power does not change nearly as much. Therefore, we have selected a well known measure of real, stable earnings power developed by Yale Professor Robert Shiller known as the Shiller E-10. The calculation of E-10 is simply the average real annual earnings over the past 10 years. Over 10 years, the earnings shenanigans and boom and bust levels of earnings tend to even out (and often times get restated). Therefore, this earnings statistic gives a reasonably stable, slow-to-change estimate of average real earnings power for the index. Professor Shiller s data and calculation of the E-10 are available on his website at We have used his data as the base for our calculations. Details of the theoretical justification behind the measure can be found in his book Irrational Exuberance [Princeton University Press 2000, Broadway Books 2001, 2nd ed., 2005]. Developed Equity Markets Excluding the US Metric: P/E ratio = Price / Normalized earnings for the MSCI EAFE Index To represent the price of non-us developed equity markets, we have chosen the MSCI EAFE index. This index has the longest published history of price for non-us developed equities. The price=p of the P/E ratio is the current price of the market index (the average daily price of the most recent full month for the MSCI EAFE index). The price level of this index is available starting in December Again, for the reasons described above, we elected to use the Shiller E-10 as our measure of earnings (E). Since 12/1972, a monthly price earnings ratio is available from MSCI. Using this quoted ratio, we have backed out the implied trailing-twelve month earnings of the EAFE index for each month from 12/1972 to the present. These annualized earnings are then inflation adjusted using CPI-U to represent real earnings in US dollar terms for each time period. The Shiller E-10 for the EAFE index (10 year average real earnings) is calculated in the same manner as detailed above. However, we do not believe that the pricing and earnings history of the EAFE markets are long enough to be a reliable representation of pricing history for developed market equities outside of the US. Therefore, in constructing the Long-Term Average Historical P/E for developed ex-us equities for comparison purposes, we have elected to use the US equity market as a developed market proxy, from 1881 to This lowers the Long-Term Average Historical P/E considerably. We believe this methodology provides a more realistic historical comparison for a market with a relatively short history. 79
237 Emerging Market Equity Markets Metric: Ratio of Emerging Market P/E Ratio to Developed Market P/E Ratio To represent the Emerging Markets P/E Ratio, we have chosen the MSCI Emerging Market Free Index, which has P/E data back to January 1995 on Bloomberg. To represent the Developed Markets PE Ratio, we have chosen the MSCI World Index, which also has data back to January 1995 on Bloomberg. Although there are issues with published, single time period P/E ratios, in which the denominator effect can cause large movements, we feel that the information contained in such movements will alert investors to market activity that they will want to interpret. US Private Equity Markets Metrics: S&P LCD Average EBITDA Multiples Paid in LBOs and US Quarterly Deal Volume The Average Purchase Price to EBITDA multiples paid in LBOs is published quarterly by S&P in their LCD study. This is the total price paid (both equity and debt) over the trailing-twelve month EBITDA (earnings before interest, taxes, depreciation and amortization) as calculated by S&P LCD. This is the relevant, high-level pricing metric that private equity managers use in assessing deals. Data is published monthly. US quarterly deal volume for private equity is the total deal volume in $ billions (both equity and debt) reported in the quarter by Thomson Reuters Buyouts. This metric gives a measure of the level of activity in the market. Data is published quarterly. US Private Real Estate Markets Metrics: US Cap Rates, Cap Rate Spreads, and Transactions as a % of Market Value Real estate cap rates are a measure of the price paid in the market to acquire properties versus their annualized income generation before financing costs (NOI=net operating income). The data, published by NCREIF, describes completed and leased properties (core) on an unleveraged basis. We chose to use current value cap rates. These are capitalization rates from properties that were revalued during the quarter. This data relies on estimates of value and therefore tends to be lagging (estimated prices are slower to rise and slower to fall than transaction prices). The data is published quarterly. Spreads between the cap rate (described above) and the 10-year nominal Treasury yield, indicate a measure of the cost of properties versus a current measure of the cost of financing. Transactions as a % of Market Value Trailing-Four Quarters is a measure of property turnover activity in the NCREIF Universe. This quarterly metric is a measure of activity in the market. 80
238 Credit Markets Fixed Income Metric: Spreads The absolute level of spreads over treasuries and spread trends (widening / narrowing) are good indicators of credit risk in the fixed income markets. Spreads incorporate estimates of future default, but can also be driven by technical dislocations in the fixed income markets. Abnormally narrow spreads (relative to historical levels) indicate higher levels of valuation risk, wide spreads indicate lower levels of valuation risk and / or elevated default fears. Investment grade bond spreads are represented by the Barclays Capital US Corporate Investment Grade Index Intermediate Component. The high yield corporate bond spreads are represented by the Barclays Capital US Corporate High Yield Index. Measure of Equity Market Fear / Uncertainty Metric: VIX Measure of implied option volatility for US equity markets The VIX is a key measure of near-term volatility conveyed by implied volatility of S&P 500 index option prices. VIX increases with uncertainty and fear. Stocks and the VIX are negatively correlated. Volatility tends to spike when equity markets fall. Measure of Monetary Policy Metric: Yield Curve Slope We calculate the yield curve slope as the 10 year treasury yield minus the 1 year treasury yield. When the yield curve slope is zero or negative, this is a signal to pay attention. A negative yield curve slope signals lower rates in the future, caused by a contraction in economic activity. Recessions are typically preceded by an inverted (negatively sloped) yield curve. A very steep yield curve (2 or greater) indicates a large difference between shorter-term interest rates (the 1 year rate) and longer-term rates (the 10 year rate). This can signal expansion in economic activity in the future, or merely higher future interest rates. Measures of US Inflation Expectations Metrics: Breakeven Inflation and Inflation Adjusted Commodity Prices Inflation is a very important indicator impacting all assets and financial instruments. Breakeven inflation is calculated as the 10 year nominal treasury yield minus the 10 year real yield on US TIPS (treasury inflation protected securities). Abnormally low long-term inflation expectations are indicative of deflationary fears. A rapid rise in breakeven inflation indicates an acceleration in inflationary expectations as market participants sell nominal treasuries and buy TIPs. If breakeven inflation continues to rise quarter over quarter, this is a signal of inflationary worries rising, which may cause Fed action and / or dollar decline. Commodity price movement (above the rate of inflation) is an indication of anticipated inflation caused by real global economic activity putting pressure on resource prices. We calculate this metric by adjusted in the Dow Jones UBS Commodity Index (formerly Dow Jones AIG Commodity Index) by US CPI-U. While rising commodity prices will not necessarily translate to higher US inflation, higher US inflation will likely show up in higher commodity prices, particularly if world economic activity is robust. These two measures of anticipated inflation can, and often are, conflicting. 81
239 Measures of US Treasury Bond Interest Rate Risk Metrics: 10-Year Treasury Forward-Looking Real Yield and 10-Year Treasury Duration The expected annualized real yield of the 10 year US Treasury Bond is a measure of valuation risk for US Treasuries. A low real yield means investors will accept a low rate of expected return for the certainly of receiving their nominal cash flows. PCA estimates the expected annualized real yield by subtracting an estimate of expected 10 year inflation (produced by the Survey of Professional Forecasters as collected by the Federal Reserve Bank of Philadelphia), from the 10 year Treasury constant maturity interest rate. Duration for the 10-Year Treasury Bond is calculated based on the current yield and a price of 100. This is a measure of expected percentage movements in the price of the bond based on small movements in percentage yield. We make no attempt to account for convexity. Definition of Extreme Metric Readings A metric reading is defined as extreme if the metric reading is in the top or bottom decile of its historical readings. These extreme reading should cause the reader to pay attention. These metrics have reverted toward their mean values in the past. 82
240 RISK METRICS DESCRIPTION PCA Market Sentiment Indicator What is the PCA Market Sentiment Indicator (PMSI)? The PMSI is a measure meant to gauge the market s sentiment regarding economic growth risk. Growth risk cuts across most financial assets, and is the largest risk exposure that most portfolios bear. The PMSI takes into account the momentum17 (trend over time, positive or negative) of the economic growth risk exposure of publicly traded stocks and bonds, as a signal of the future direction of growth risk returns; either positive (risk seeking market sentiment), or negative (risk averse market sentiment). How do I read the PCA Market Sentiment Indicator (PMSI) graph? Simply put, the PMSI is a color coded indicator that signals the market s sentiment regarding economic growth risk. It is read left to right chronologically. A green indicator on the PMSI indicates that the market s sentiment towards growth risk is positive. A gray indicator indicates that the market s sentiment towards growth risk is neutral or inconclusive. A red indicator indicates that the market s sentiment towards growth risk is negative. The black line on the graph is the level of the PMSI. The degree of the signal above or below the neutral reading is an indication the signal s current strength. How is the PCA Market Sentiment Indicator (PMSI) Constructed? The PMSI is constructed from two sub-elements representing investor sentiment in stocks and bonds: 1. Stock return momentum: Return momentum for the S&P 500 Equity Index (trailing 12-months) 2. Bond yield spread momentum: Momentum of bond yield spreads (excess of the measured bond yield over the identical duration U.S. Treasury bond yield) for corporate bonds (trailing 12-months) for both investment grade bonds (75% weight) and high yield bonds (25% weight). The scale of this measure is adjusted to match that of the stock return momentum measure. The black line reading on the graph is calculated as the average of the stock return momentum measure and the bonds spread momentum measure. The color reading on the graph is determined as follows: 1. If both stock return momentum and bond spread momentum are positive = GREEN (positive) 2. If one of the momentum indicators is positive, and the other negative = GRAY (inconclusive) 3. If both stock return momentum and bond spread momentum are negative = RED (negative) What does the PCA Market Sentiment Indicator (PMSI) mean? Why might it be useful? There is strong evidence that time series momentum is significant and persistent.18 In particular, across an extensive array of asset classes, the sign of the trailing 12-month return (positive or negative) is indicative of future returns (positive or negative) over the next 12 month period. The PMSI is constructed to measure this momentum in stocks and corporate bond spreads. A reading of green or red is agreement of both the equity and bond measures, indicating that it is likely that this trend (positive or negative) will continue over the next 12 months. When the measures disagree, the indicator turns gray. A gray reading does not necessarily mean a new trend is occurring, as the indicator may move back to green, or into the red from there. The level of the reading (black line) and the number of months at the red or green reading, gives the user additional information on which to form an opinion, and potentially take action. 17 Momentum is defined as the persistence of relative performance. There is a significant amount of academic evidence indicating that positive momentum (e.g., strong performing stocks over the recent past continue to post strong performance into the near future) exists over near-to-intermediate holding periods. See, for example, Understanding Momentum, Financial Analysts Journal, Scowcroft, Sefton, March, Time Series Momentum Moskowitz, Ooi, Pedersen, August
241 DISCLOSURES: This document is provided for informational purposes only. It does not constitute an offer of securities of any of the issuers that may be described herein. Information contained herein may have been provided by third parties, including investment firms providing information on returns and assets under management, and may not have been independently verified. The past performance information contained in this report is not necessarily indicative of future results and there is no assurance that the investment in question will achieve comparable results or that the Firm will be able to implement its investment strategy or achieve its investment objectives. The actual realized value of currently unrealized investments (if any) will depend on a variety of factors, including future operating results, the value of the assets and market conditions at the time of disposition, any related transaction costs and the timing and manner of sale, all of which may differ from the assumptions and circumstances on which any current unrealized valuations are based. Neither PCA nor PCA s officers, employees or agents, make any representation or warranty, express or implied, in relation to the accuracy or completeness of the information contained in this document or any oral information provided in connection herewith, or any data subsequently generated herefrom, and accept no responsibility, obligation or liability (whether direct or indirect, in contract, tort or otherwise) in relation to any of such information. PCA and PCA s officers, employees and agents expressly disclaim any and all liability that may be based on this document and any errors therein or omissions therefrom. Neither PCA nor any of PCA s officers, employees or agents, make any representation of warranty, express or implied, that any transaction has been or may be effected on the terms or in the manner stated in this document, or as to the achievement or reasonableness of future projections, management targets, estimates, prospects or returns, if any. Any views or terms contained herein are preliminary only, and are based on financial, economic, market and other conditions prevailing as of the date of this document and are therefore subject to change. The information contained in this report may include forward-looking statements. Forward-looking statements include a number of risks, uncertainties and other factors beyond the control of the Firm, which may result in material differences in actual results, performance or other expectations. The opinions, estimates and analyses reflect PCA s current judgment, which may change in the future. Any tables, graphs or charts relating to past performance included in this report are intended only to illustrate investment performance for the historical periods shown. Such tables, graphs and charts are not intended to predict future performance and should not be used as the basis for an investment decision. All trademarks or product names mentioned herein are the property of their respective owners. Indices are unmanaged and one cannot invest directly in an index. The index data provided is on an as is basis. In no event shall the index providers or its affiliates have any liability of any kind in connection with the index data or the portfolio described herein. Copying or redistributing the index data is strictly prohibited. The Russell indices are either registered trademarks or tradenames of Frank Russell Company in the U.S. and/or other countries. The MSCI indices are trademarks and service marks of MSCI or its subsidiaries. Standard and Poor s (S&P) is a division of The McGraw-Hill Companies, Inc. S&P indices, including the S&P 500, are a registered trademark of The McGraw-Hill Companies, Inc. CBOE, not S&P, calculates and disseminates the BXM Index. The CBOE has a business relationship with Standard & Poor's on the BXM. CBOE and Chicago Board Options Exchange are registered trademarks of the CBOE, and SPX, and CBOE S&P 500 BuyWrite Index BXM are servicemarks of the CBOE. The methodology of the CBOE S&P 500 BuyWrite Index is owned by CBOE and may be covered by one or more patents or pending patent applications. FTSE is a trademark of the London Stock Exchange Group companies and is used by FTSE under license. All rights in the FTSE indices and/or FTSE ratings vest in FTSE and/or its licensors. No further distribution of FTSE data is permitted with FTSE s express written consent. The Barclays Capital indices (formerly known as the Lehman indices) are trademarks of Barclays Capital, Inc. The Citigroup indices are trademarks of Citicorp or its affiliates. The Merrill Lynch indices are trademarks of Merrill Lynch & Co. or its affiliates. 84

242 EBMUDERS 2018 ASSET LIABILITY STUDY DISCUSSION OF RISK PHILOSOPHY AND DECISION FACTORS January 2018
243 Risk Philosophy Concept Risk tolerance (or Risk Philosophy ): one of the most important inputs in Asset- Liability Modeling A Risk Philosophy encapsulates the Board s priorities regarding overall Plan risk A Risk Philosophy is a specific combination of weighted Decision Factors Once a Risk Philosophy is expressed, portfolio selection can be a mechanical exercise EBMUDERS Risk Philosophy and Decision Factors 2
244 Risk Philosophy Concept - Definitions Definition: Risk Philosophies are a weighted combination of Decision Factors: (i) Certain sets of decision factors reflect specific sensitivities (ii) Weightings of decision factors reflect priorities unique to EBMUDERS Purpose: Pre-established risk philosophies allow decision makers to rapidly establish their risk tolerance and, in turn, select an appropriate policy portfolio EBMUDERS Risk Philosophy and Decision Factors 3
245 Risk Philosophy Concept - Definitions Definition: A Decision Factor is a combination of two components: (i) a variable that describes the financial condition of the System and (ii) an established threshold level (or goal) for that variable Purpose: Decision Factors allow decision makers to define and quantify their tolerance for risk using intuitive metrics, allowing the Board to easily establish a consensus risk tolerance EBMUDERS Risk Philosophy and Decision Factors 4
246 Risk Philosophy Considerations In general terms, specific decision factors might be characterized as follows: Minimize Contributions over the next several years Avoid Contribution Surprises (i.e., manage contribution volatility) for the next several years Achieve a Funding Goal within a certain number of years Avoid a Funding Shortfall for next several years Etc. EBMUDERS Risk Philosophy and Decision Factors 5
247 Decision Factors Examples Common Decision Factors Utilized by PCA Clients Financial Objective Risk Measure (Threshold) Maximize Average Funded Ratio Sustain Long-term Funding Progress Minimize Funded Ratio Volatility Achieve Actuarial Rate Maximize Long-term Compound Return Minimize Compound Return Volatility Manage Funding Costs Minimize Average Employer Contribution Level Minimize Employer Contribution Volatility Avoid Employer Contribution Spikes Mitigate Severe Downside Event Avoid Severe Low Funded Ratio Minimize Rebalancing Stress EBMUDERS Risk Philosophy and Decision Factors 6

248 Decision Framework EBMUDERS Risk Philosophy and Decision Factors 7
249 Selection of Decision Factors Goal : Select a set of decision factors that will quantify the Board s risk philosophy o o o o o o A risk factor is a mechanism for quantifying the Board s objectives and concerns about the retirement funds role in the broader retirement system throughout the asset allocation modeling process The Board should periodically review and select the decision factors for the asset allocation studies Thresholds should be designed for the factors to reflect the Board s objectives and concerns The Board will determine its risk philosophy by weighting key decision factors that respond differently to a range of portfolios In practice, portfolios are ranked based upon ability to meet threshold(s) Achieving one objective or concern may result in others not being met EBMUDERS Risk Philosophy and Decision Factors 8
250 Risk Philosophy Considerations Decision factors can then be grouped into risk philosophies having different emphases: Risk Tolerance Philosophy Funding improvement/return-oriented Funding-oriented Funding protection/downside-oriented Return/funding protection-oriented Return/cost management-oriented Cost management/funding protection-oriented Return space only Equal Weight All Risk Factors Description of Risk Variable and Decision Factors Places a high priority on improving the funded status of the plan, particularly through seeking to maximize investment returns. Specifically, a high weight is placed on portfolios that score high with respect to the plan improving its funded ratio over the next 25 years and on portfolios that score high with respect to producing the highest possible long-term compounded return. Places a high priority on improving and protecting the funded status of the plan. Specifically, a high weight is placed on portfolios that score well with respect to the plan improving its funded ratio over the next 25 years and on portfolios that score high with respect to keeping the plan s funded ratio above a minimum threshold level of 50%. Places a high priority on protecting the funded status of the plan and avoiding poorly performing investment results. Specifically, a high weight is placed on portfolios that score well with respect to keeping the plan s funded ratio above a minimum threshold level of 50% and on portfolios that score high with respect to avoiding long-term returns below EBMUDERS assumed rate of return. Places a high priority on achieving a favorable long-term investment return while also acknowledging the importance of avoiding a funding catastrophe. Specifically, high weight is assigned to the score relating to the portfolio s ability to produce strong investment returns. The higher the real return, the higher the score. Places a high priority on achieving a favorable long-term investment return while also acknowledging the importance of managing plan costs. Specifically, high weight is assigned to the score relating to the portfolio s ability to produce strong investment returns and on portfolios that score high with respect to the plan being able to keep its overall actuarial costs close to statutory levels. Places a high priority on managing plan cost levels and minimizing periodic cost surprises while also recognizing the importance of maintaining a minimum funding threshold. Specifically, a high weight is assigned to the score relating to the frequency of periods when actuarial costs exceed statutory costs by 2%-of-pay or more and on portfolios that score high with respect to keeping the plan s funded ratio above the minimum 50% threshold level. The fewer cost surprises, the higher the score. Places a high priority on achieving a favorable long-term investment return while also avoiding poorly performing investment results. This risk philosophy is analogous to finding the most optimal portfolio on the traditional mean-variance efficient frontier, which assesses portfolios only by their investment return prospects. Specifically, half weight is assigned to the score relating to the portfolio s ability to produce strong investment returns. The higher the real return, the higher the score. The remaining half weight is placed on portfolios that score high with respect to avoiding long-term returns below EBMUDERS assumed rate of return (i.e., exhibit higher levels of downside return outcomes). Includes all Decision Factor groups. All Decision Factors are weighted equally when screening for asset allocation policies. This risk tolerance philosophy represents a neutral position from which to assess the other philosophies. EBMUDERS Risk Philosophy and Decision Factors 9
251 Decision Factors Portfolios should be ranked on their ability to accomplish the goal laid out in a specific Decision Factor While each Decision Factor has its merits, they cannot be accomplished simultaneously they compete against each other; the Board must prioritize them The factors should be understandable and intuitive, reflecting core objectives and concerns The prioritization process takes place through a voting process among Board members For example, there are four major liability-oriented Decision Factors (goals): Achieve Full Funding within a certain number of years Avoid a Funding Shortfall catastrophe for next number of years Minimize Contributions over the next number of years Avoid Contribution Spikes (i.e., manage contribution volatility) for the next number of years EBMUDERS Risk Philosophy and Decision Factors 10
252 Decision Factor Examples Decision Factor: Achieve Higher Funding Goal: Seek to achieve fully funded status (i.e., assets = liabilities). Stated as a funded ratio. A funded ratio progressing toward 100% means that assets = liabilities (Good). A lower funded ratio means that assets < liabilities (Not Good). Ideally, a funded ratio >100% means assets > liabilities (Good). Tradeoff 1: Since the current funded ratio is significantly <100%, to get to 100% will require either higher actuarial contributions (Not Good), or that risk be taken in the portfolio. The more risk taken, the higher the likelihood that the funded ratio will fluctuate before the end of the horizon (Not Good). Tradeoff 2: If the funded ratio fluctuates before the end of the horizon, then actuarial contributions may also fluctuate and/or increase dramatically (Not Good). EBMUDERS Risk Philosophy and Decision Factors 11
253 Decision Factor Examples Decision Factor: Avoid a Low Funding Ratio Goal: Protect the funded status of the Plan. EBMUDERS may desire to avoid a funded ratio below a certain level. This threshold, to be established by the Board, ensures that EBMUDERS will always be considered a going concern (Good). Tradeoff 1: Protecting the funded ratio from falling below a certain threshold may reduce the potential upside gains that the investment portfolio might produce (Not Good). Tradeoff 2: Protecting the funding ratio may also put upward pressure on actuarial contribution rates which may, in turn, exceed statutory rates (Not Good). EBMUDERS Risk Philosophy and Decision Factors 12
254 Decision Factor Examples Decision Factor: Minimize Contributions Goal: Seek to keep average contributions as low as possible. Lower cost provides one form of relief to both active employees and the District. Lower contributions means that employees and the District, over the long term, can redirect their resources to other areas (Good). Tradeoff 1: Seeking to minimize average contributions may lead EBMUDERS to take on a more risky investment strategy to maximize returns. This step, in turn, may threaten EBMUDERS funded ratio/status (Not Good). Tradeoff 2: Seeking to minimize average contributions may lead EBMUDERS to take on a more risky investment strategy. This may increase the yearly fluctuation in employer contribution rates, making budgeting difficult (Not Good). EBMUDERS Risk Philosophy and Decision Factors 13
255 Decision Factor Examples Decision Factor: Avoid Contribution Spikes Goal: Avoid unplanned contribution spikes. Contribution management is difficult and keeping contributions over time within a manageable band is reasonable. Well managed contributions over time means less surprises for decision making groups and easier budgeting (Good). Tradeoff 1: Avoiding portfolios that lead to contribution spikes may force EBMUDERS to accept portfolios that are too geared to asset safety. As a result, the Plan may see its funded ratio deteriorate over time (Not Good). Tradeoff 2: Avoiding contribution spikes may actually lead to portfolios that have higher-than-average contribution levels (Not Good). EBMUDERS Risk Philosophy and Decision Factors 14

256 DISCLOSURES: This document is provided for informational purposes only. It does not constitute an offer of securities of any of the issuers that may be described herein. Information contained herein may have been provided by third parties, including investment firms providing information on returns and assets under management, and may not have been independently verified. The past performance information contained in this report is not necessarily indicative of future results and there is no assurance that the investment in question will achieve comparable results or that the Firm will be able to implement its investment strategy or achieve its investment objectives. The actual realized value of currently unrealized investments (if any) will depend on a variety of factors, including future operating results, the value of the assets and market conditions at the time of disposition, any related transaction costs and the timing and manner of sale, all of which may differ from the assumptions and circumstances on which any current unrealized valuations are based. Neither PCA nor PCA s officers, employees or agents, make any representation or warranty, express or implied, in relation to the accuracy or completeness of the information contained in this document or any oral information provided in connection herewith, or any data subsequently generated herefrom, and accept no responsibility, obligation or liability (whether direct or indirect, in contract, tort or otherwise) in relation to any of such information. PCA and PCA s officers, employees and agents expressly disclaim any and all liability that may be based on this document and any errors therein or omissions therefrom. Neither PCA nor any of PCA s officers, employees or agents, make any representation of warranty, express or implied, that any transaction has been or may be effected on the terms or in the manner stated in this document, or as to the achievement or reasonableness of future projections, management targets, estimates, prospects or returns, if any. Any views or terms contained herein are preliminary only, and are based on financial, economic, market and other conditions prevailing as of the date of this document and are therefore subject to change. The information contained in this report may include forward-looking statements. Forward-looking statements include a number of risks, uncertainties and other factors beyond the control of the Firm, which may result in material differences in actual results, performance or other expectations. The opinions, estimates and analyses reflect PCA s current judgment, which may change in the future. Any tables, graphs or charts relating to past performance included in this report are intended only to illustrate investment performance for the historical periods shown. Such tables, graphs and charts are not intended to predict future performance and should not be used as the basis for an investment decision. All trademarks or product names mentioned herein are the property of their respective owners. Indices are unmanaged and one cannot invest directly in an index. The index data provided is on an as is basis. In no event shall the index providers or its affiliates have any liability of any kind in connection with the index data or the portfolio described herein. Copying or redistributing the index data is strictly prohibited. The Russell indices are either registered trademarks or trade names of Frank Russell Company in the U.S. and/or other countries. The MSCI indices are trademarks and service marks of MSCI or its subsidiaries. Standard and Poor s (S&P) is a division of The McGraw-Hill Companies, Inc. S&P indices, including the S&P 500, are a registered trademark of The McGraw-Hill Companies, Inc. CBOE, not S&P, calculates and disseminates the BXM Index. The CBOE has a business relationship with Standard & Poor's on the BXM. CBOE and Chicago Board Options Exchange are registered trademarks of the CBOE, and SPX, and CBOE S&P 500 BuyWrite Index BXM are servicemarks of the CBOE. The methodology of the CBOE S&P 500 BuyWrite Index is owned by CBOE and may be covered by one or more patents or pending patent applications. The Barclays Capital indices (formerly known as the Lehman indices) are trademarks of Barclays Capital, Inc. The Citigroup indices are trademarks of Citicorp or its affiliates. The Merrill Lynch indices are trademarks of Merrill Lynch & Co. or its affiliates. FTSE is a trademark of the London Stock Exchange Group companies and is used by FTSE under license. All rights in the FTSE indices and/or FTSE ratings vest in FTSE and/or its licensors. No further distribution of FTSE data is permitted with FTSE s express written consent. EBMUDERS Risk Philosophy and Decision Factors 15
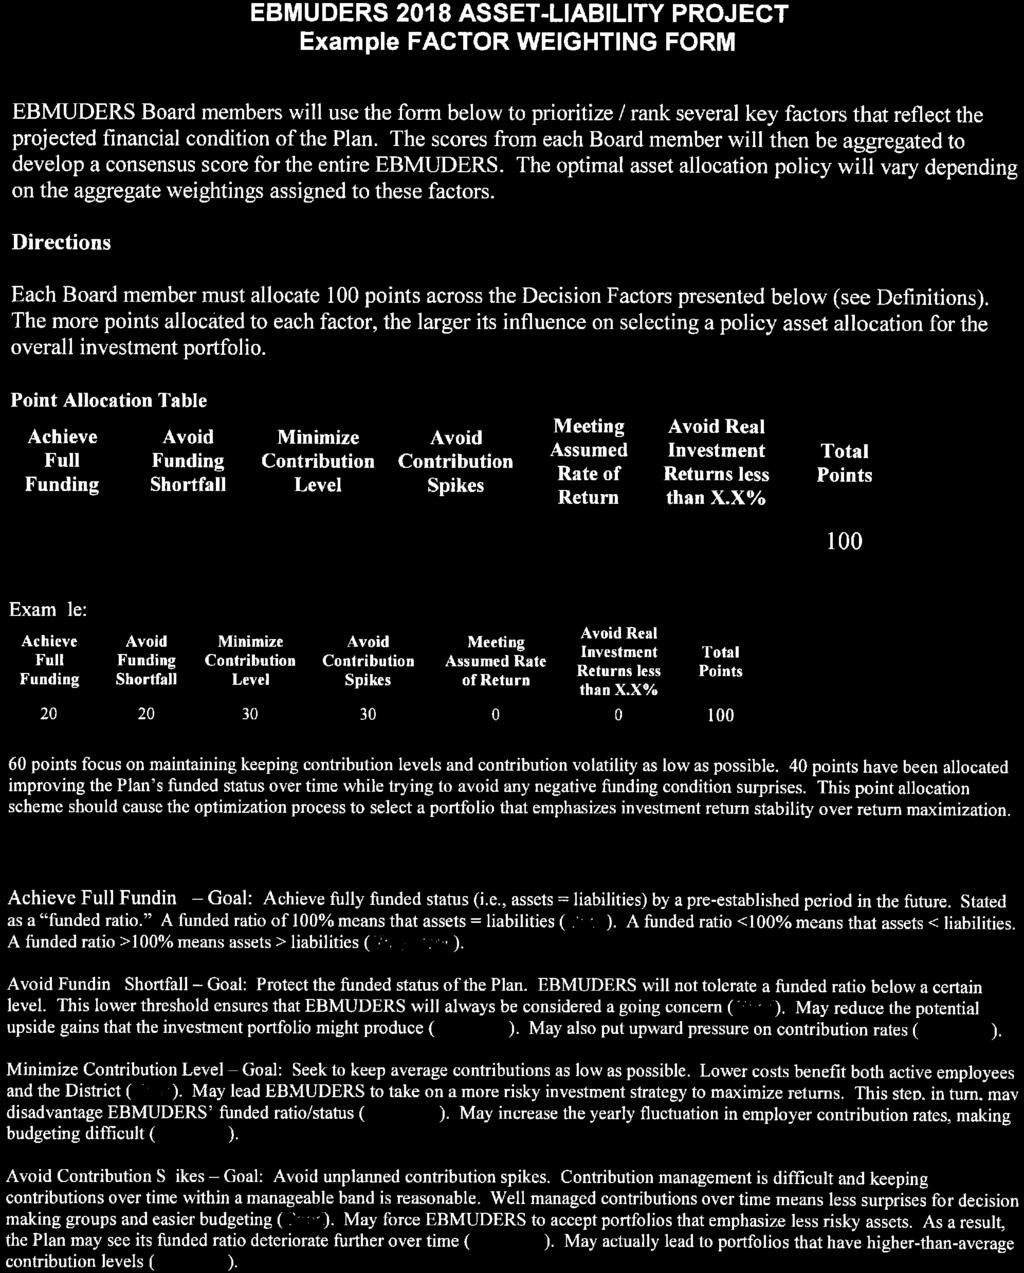
257
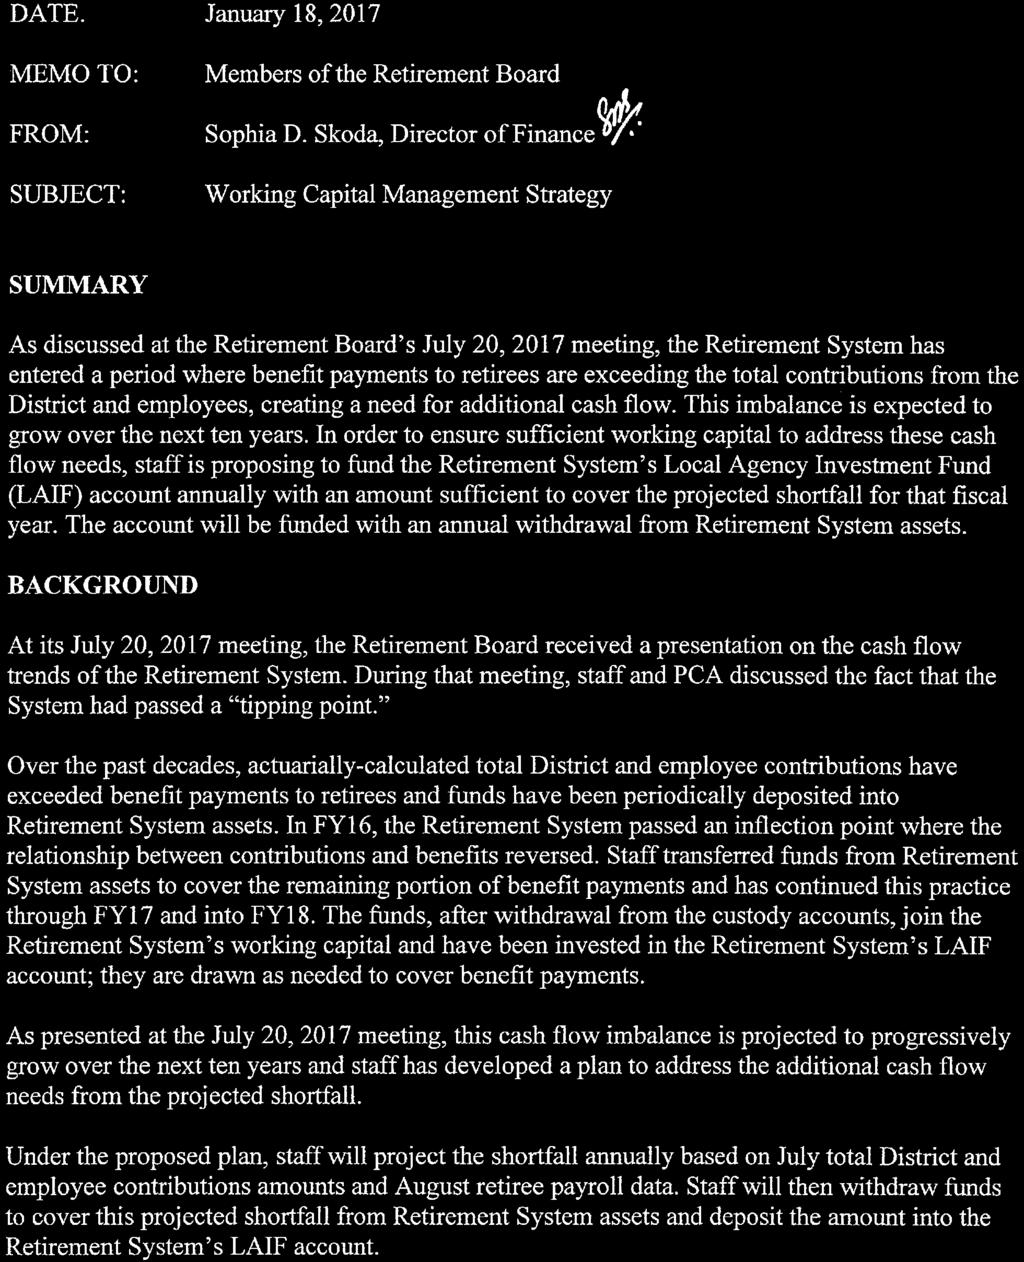
258
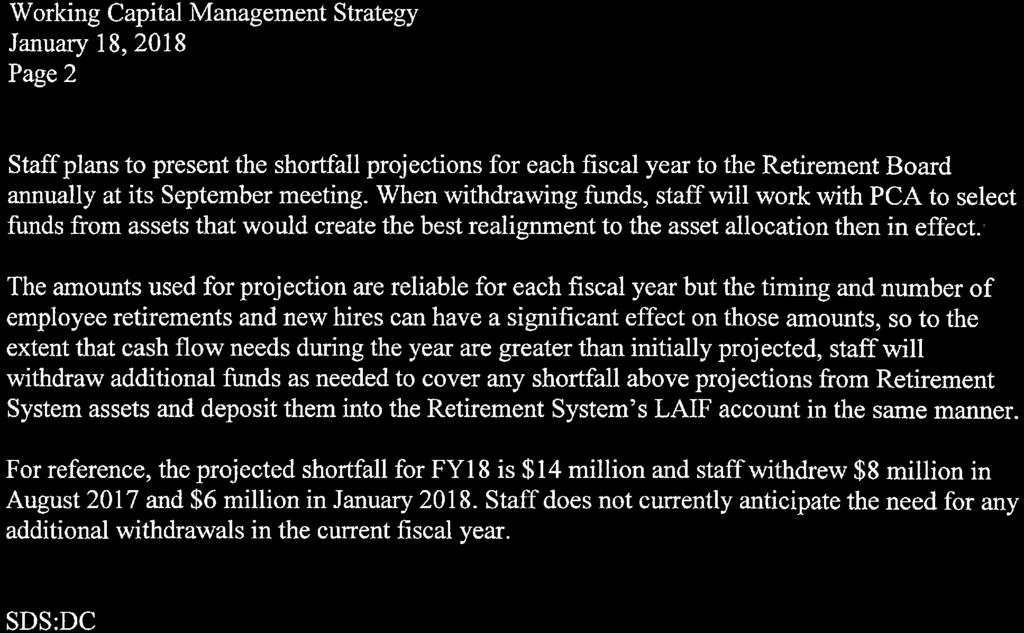
259
260
261 Retirement Board Member Training Requirement is 24 hours in two years. 3/1/ /31/2016 Budgeted amount is $2,500 per a year/per Member. Pursuant to RB Rule C-23 Board Member Date of Training Provider/Topic Hours of training Cost Doug Higashi 3/7/2015 CALAPRS General Assembly 12 $ /19/2016 Mercer ESG Seminar 2.5 $ - Ethics training 2 Hours at Board Meetings 0 Subtotal (24 months) Total 16.5 $ Board Member Date of Training Provider/Topic Hours of training Cost Frank Mellon October 22-25, 2016 International Foundation Conference 13 $ 1, /26-27/2017 CERES 2017 Conference 16 $ Ethics Training 2 Hours at Board Meetings 0 Subtotal (24 months) $ Total 31 $ 3, Board Member Date of Training Provider/Topic Hours of training Cost Tim McGowan 1/27-1/29/2015 CALAPRS Advanced Principals for Trustees 12 $ 3, /10/2016 CALAPRS Trustee Roundtable 6 $ Ethics training 2 3/5/2017 CALAPRS General Assembly 24 $ /24-26/2017 SACRS (Modern Investment Ret. Systems) 24 $ 2, /15/2017 SACRS (Fall Conference) 8 $ /15-7/18/2018 Investment Models & Strategies 32 $ 2, Hours at Board Meetings 0 Subtotal (24 months) $ 5, Total 108 $ 13, Board Member Date of Training Provider/Topic Hours of training Cost Alex Coate 9/18/2015 CALAPRS RoundTable 6 $ /10/2016 CALAPRS RoundTable 6 $ Ethics training 2 2/28/2018 Green Bonds Symposium 8 Hours at Board Meetings Subtotal (24 months) 0 Total 22 $ Board Member Date of Training Provider/Topic Hours of training Cost Marguerite Young Ethics training 2 $ - 10/19/2016 CalSTRS ESG 6 $ - 11/9 and 11/10 UNPRI 6 4/26-27/2017 CERES 2017 Conference 16 $ Hours at Board Meetings Subtotal (24 months) 0 $ Total 30 $ 1, Board Member Date of Training Provider/Topic Hours of training Cost Lisa Ricketts-Mann 8/9/16-8/12/16 CALAPRS TRUSTEE Training 20 $ 2, Ethics training 2 Hours at Board Meetings Subtotal (24 months) 0 Total 22 $ 2, Grand Total $ 22, /11/2018 W:\ES\RETIREMENT SYSTEM - ORG 366 FILES\RETIREMENT BOARD MEETINGS\2018\January \Retirement Board Training 2018 updated
262 Name Dates 30 minutes per a training 3/19/2015 5/21/2015 7/16/2015 9/17/ /19/2015 Total for 2015 Topic Domestic Equities Capital Markets Covered Calls Real Estate ESG Considerations Members in Attendance Higashi Mellon McGowan Coate Young Absent Ricketts -Mann /21/2016 3/17/2016 5/19/2016 7/21/2016 9/15/ /17/2016 Total for 2016 Two - Year Total Topic Proxy voting and ESG UC's Experience w/esg Active and Passive Investing ESG & Passive Inv. Pushed out/ Climate change exp. SASB Members in Attendance Higashi Mellon McGowan Coate Young 1 Absent Ricketts -Mann /19/2017 3/15/2017 5/18/2017 7/20/2017 9/21/ /16/2017 Total for 2017 Three - Year Total Topic INCR Speaker Crisis/Risk Offset Strategic vs. Traditional Asset Allocation N/A N/A ESG Members in Attendance Higashi Mellon McGowan 1 1 absent Coate Young Ricketts -Mann /18/2018 3/15/2018 5/17/2018 7/19/2018 9/20/ /15/2018 Total for 2018 Four - Year Total Topic Members in Attendance Higashi Mellon McGowan Coate Young Ricketts -Mann

263
264
AGENDA EBMUD EMPLOYEES RETIREMENT SYSTEM January 17, 2013 Training Resource Center (TRC1) 8:30 a.m.
 8:30 a.m.") AGENDA EBMUD EMPLOYEES RETIREMENT SYSTEM January 17, 2013 Training Resource Center (TRC1) 8:30 a.m. ROLL CALL: PUBLIC COMMENT: The Retirement Board is limited by State Law to providing a brief response,
AGENDA EBMUD EMPLOYEES RETIREMENT SYSTEM January 17, 2013 Training Resource Center (TRC1) 8:30 a.m. ROLL CALL: PUBLIC COMMENT: The Retirement Board is limited by State Law to providing a brief response,
The Water and Power Employees' Retirement Plan of the City of Los Angeles Actuarial Valuation and Review as of July 1, 2017
 The Water and Power Employees' Retirement Plan of the City of Los Angeles Actuarial Valuation and Review as of July 1, 2017 This report has been prepared at the request of the Board of Administration to
Fresno County Employees Retirement Association
 Fresno County Employees Retirement Association Actuarial Valuation and Review as of June 30, 2013 This report has been prepared at the request of the Board of Retirement to assist in administering the
Ventura County Employees Retirement Association
 Ventura County Employees Retirement Association Actuarial Valuation and Review as of June 30, 2016 This report has been prepared at the request of the Board of Retirement to assist in administering the
City of Los Angeles Fire and Police Pension Plan
 City of Los Angeles Fire and Police Pension Plan Actuarial Valuation and Review Of Retirement and Other Postemployment Benefits (OPEB) as of June 30, 2017 This report has been prepared at the request of
Imperial County Employees Retirement System
 Imperial County Employees Retirement System Actuarial Valuation and Review as of June 30, 2014 This report has been prepared at the request of the Board of Retirement to assist in administering the Fund.
Orange County Employees Retirement System
 Orange County Employees Retirement System Actuarial Valuation and Review as of December 31, 2016 This report has been prepared at the request of the Board of Retirement to assist in administering the Fund.
Orange County Employees Retirement System
 Orange County Employees Retirement System Actuarial Valuation and Review as of December 31, 2017 This report has been prepared at the request of the Board of Retirement to assist in administering the Fund.
San Bernardino County Employees Retirement Association
 San Bernardino County Employees Retirement Association Actuarial Valuation and Review as of June 30, 2017 This report has been prepared at the request of the Board of Retirement to assist in administering
Actuarial Valuation and Review as of June 30, 2009
 Fresno County Employees' Retirement Association Actuarial Valuation and Review as of June 30, 2009 Copyright 2010 THE SEGAL GROUP, INC., THE PARENT OF THE SEGAL COMPANY ALL RIGHTS RESERVED The Segal Company
Orange County Employees Retirement System
 Orange County Employees Retirement System Actuarial Valuation and Review as of December 31, 2014 This report has been prepared at the request of the Board of Retirement to assist in administering the Fund.
The Water and Power Employees' Retirement Plan of the City of Los Angeles Actuarial Valuation and Review as of July 1, 2014
 The Water and Power Employees' Retirement Plan of the City of Los Angeles Actuarial Valuation and Review as of July 1, 2014 This report has been prepared at the request of the Board of Administration to
Fire and Police Pension Fund, San Antonio Actuarial Valuation and Review as of January 1, 2017
 Fire and Police Pension Fund, San Antonio Actuarial Valuation and Review as of January 1, 2017 Copyright 2017 by The Segal Group, Inc. All rights reserved. 2018 Powers Ferry Road, Suite 850 Atlanta, GA
University of California Retirement Plan
 Attachment 1 University of California Retirement Plan ACTUARIAL VALUATION REPORT AS OF JULY 1, 2016 Copyright 2016 by The Segal Group, Inc. All rights reserved. 100 Montgomery Street, SUITE 500 San Francisco,
Fire and Police Pension Fund, San Antonio
 Fire and Police Pension Fund, San Actuarial Valuation and Review as of January 1, 2018 This report has been prepared at the request of the Board of Trustees to assist in administering the Pension Fund.
City of Jacksonville General Employees Retirement Plan
 City of Jacksonville General Actuarial Valuation and Review as of October 1, 2017 This report has been prepared at the request of the Board of Trustees to assist in administering the Plan. This valuation
Actuarial Valuation and Review as of June 30, 2009
 City of Fresno Fire and Police Retirement System Actuarial Valuation and Review as of June 30, 2009 Copyright 2010 THE SEGAL GROUP, INC., THE PARENT OF THE SEGAL COMPANY ALL RIGHTS RESERVED The Segal Company
City of Orlando Police Officers' Pension Fund
 City of Orlando Police Officers' Actuarial Valuation and Review as of October 1, 2017 This report has been prepared at the request of the Board of Trustees to assist in administering the Fund. This valuation
City of Jacksonville General Employees Retirement Plan Actuarial Valuation and Review as of October 1, 2016
 City of Jacksonville General Employees Retirement Plan Actuarial Valuation and Review as of October 1, 2016 Copyright 2017 by The Segal Group, Inc. All rights reserved. 2018 Powers Ferry Road, Suite 850
AGENDA BOARD OF FIRE AND POLICE PENSION COMMISSIONERS. December 1, :30 a.m.
 AGENDA BOARD OF FIRE AND POLICE PENSION COMMISSIONERS December 1, 2016 8:30 a.m. Sam Diannitto Boardroom Los Angeles Fire and Police Pensions Building 701 East Third Street, Suite 400 Los Angeles, CA 90013
Copyright 2016 by The Segal Group, Inc. All rights reserved.
 Sacramento County Employees Retirement System (SCERS) Governmental Accounting Standards Board Statement 67 (GASBS 67) Actuarial Valuation as of June 30, 2016 This report has been prepared at the request
Actuarial Valuation and Review as of December 31, 2010
 Orange County Employees Retirement System Actuarial Valuation and Review as of December 31, 2010 Copyright 2011 THE SEGAL GROUP, INC., THE PARENT OF THE SEGAL COMPANY ALL RIGHTS RESERVED The Segal Company
City of Holyoke Retirement System Actuarial Valuation and Review as of January 1, 2016
 City of Holyoke Retirement System Actuarial Valuation and Review as of January 1, 2016 Copyright 2016 by The Segal Group, Inc. All rights reserved. 116 Huntington Ave., 8th Floor Boston, MA 02116 T 617.424.7300
Massachusetts Water Resources Authority Employees Retirement System
 Massachusetts Water Resources Authority Employees Retirement System Actuarial Valuation and Review as of January 1, 2018 This report has been prepared at the request of the Retirement Board to assist in
Employees' Retirement Fund of the City of Fort Worth Revised Actuarial Valuation and Review as of January 1, 2014
 Employees' Retirement Fund of the City of Fort Worth Revised Actuarial Valuation and Review as of January 1, 2014 Copyright 2014 by The Segal Group, Inc. All rights reserved. 2018 Powers Ferry Road, Suite
The Water and Power Employees' Retirement Plan of the City of Los Angeles Actuarial Valuation and Review as of July 1, 2012
 The Water and Power Employees' Retirement Plan of the City of Los Angeles Actuarial Valuation and Review as of July 1, 2012 Copyright 2012 by The Segal Group, Inc., parent of The Segal Company. All rights
Copyright 2016 by The Segal Group, Inc. All rights reserved.
 The Water and Power Employees Retirement Plan of the City of Governmental Accounting Standards (GAS) 67 Actuarial Valuation as of June 30, 2016 This report has been prepared at the request of the Board
City of Los Angeles Department of Water and Power
 City of Los Angeles Department of Water and Power Actuarial Valuation and Review of Other Postemployment Benefits (OPEB) as of June 30, 2017 In accordance with GASB Statement No. 45 This report has been
Actuarial Valuation and Review as of July 1, 2005
 The Water and Power Employees' Retirement Plan of the City of Los Angeles Actuarial Valuation and Review as of July 1, 2005 Copyright 2005 THE SEGAL GROUP, INC., THE PARENT OF THE SEGAL COMPANY ALL RIGHTS
ACTUARIAL VALUATION REPOR
 University of California Retirement Plan ACTUARIAL VALUATION REPORT AS OF JULY 1, 2013 Copyright 2013 by The Segal Group, Inc. All rights reserved. 100 Montgomery Street, SUITE 500 San Francisco, CA 941044
The Water and Power Employees Retirement Plan of the City of Los Angeles
 The Water and Power Employees Retirement Plan of the City of Los Angeles Governmental Accounting Standards (GAS) 74 Actuarial Valuation for the Death Benefit Fund as of June 30, 2017 Family Death Benefit
Government Employees' Retirement System of the Virgin Islands
 Government Employees' Retirement System of the Virgin Islands Actuarial Valuation and Review as of October 1, 2017 This report has been prepared at the request of the Board of Trustees to assist in administering
August 13, Segal Consulting, a Member of The Segal Group, Inc. By: JB/hy
 Alameda County Employees Retirement Association Governmental Accounting Standards Board (GASB) Statement 68 Actuarial Valuation Based on December 31, 2014 Measurement Date for Employer Reporting as of
Sacramento County Employees Retirement System (SCERS)
") Sacramento County Employees Retirement System (SCERS) Governmental Accounting Standards Board Statement 68 (GASBS 68) Actuarial Valuation Based on June 30, 2017 Measurement Date for Employer Reporting
Sacramento County Employees Retirement System (SCERS) Governmental Accounting Standards Board Statement 68 (GASBS 68) Actuarial Valuation Based on June 30, 2017 Measurement Date for Employer Reporting
The Water and Power Employees Retirement, Disability and Death Benefit Insurance Plan
 The Water and Power Employees Retirement, Disability and Death Benefit Insurance Plan Review of the Disability Fund as of July 1, 2015 This report has been prepared at the request of the Board of Administration
Alameda County Employees Retirement Association
 Alameda County Employees Retirement Association GASB Statement No. 43 (OPEB) and non-opeb Actuarial Valuation of the Benefits Provided by the Supplemental Retiree, Including Sufficiency of Funds, as of
100 Montgomery Street Suite 500 San Francisco, CA T
 Orange County Employees Retirement System Governmental Accounting Standards Board (GASB) Statement 68 Actuarial Valuation Based on December 31, 2015 Measurement Date for Employer Reporting as of June 30,
International Union of Operating Engineers Local 487 Pension Trust Fund Actuarial Valuation and Review as of April 1, 2014
 International Union of Operating Engineers Local 487 Pension Trust Fund Actuarial Valuation and Review as of April 1, 2014 This report has been prepared at the request of the Board of Trustees to assist
Kern County Employees Retirement Association
 Kern County Employees Retirement Association Governmental Accounting Standard (GAS) 68 Actuarial Valuation Based on June 30, 2017 Measurement Date for Employer Reporting as of June 30, 2018 This report
State Teachers Retirement System of Ohio Actuarial Valuation and Review as of July 1, 2017
 State Teachers Retirement System of Ohio Actuarial Valuation and Review as of July 1, 2017 Copyright 2017 by The Segal Group, Inc. All rights reserved. 101 NORTH WACKER DRIVE, SUITE 500 CHICAGO, IL 60606
State Teachers Retirement System of Ohio Actuarial Valuation and Review as of July 1, 2016
 State Teachers Retirement System of Ohio Actuarial Valuation and Review as of July 1, 2016 Copyright 2016 by The Segal Group, Inc. All rights reserved. 101 NORTH WACKER DRIVE, SUITE 500 CHICAGO, IL 60606
Alameda County Employees Retirement Association
 Alameda County Employees Retirement Association Governmental Accounting Standards Board (GASB) 74 Actuarial Valuation and Review of the Benefits Provided by the Supplemental Retiree Benefits Reserve Other
Special Study to Provide Adopted Retirement Benefits for County General Tier 4 and County Safety Tier 4 Employees. Copyright 2012
 FRESNO COUNTY EMPLOYEES RETIREMENT ASSOCIATION Special Study to Provide Adopted Retirement Benefits for County General Tier 4 and County Safety Tier 4 Employees Copyright 2012 THE SEGAL COMPANY, INC. THE
Sheet Metal Workers' National Pension Fund
 Sheet Metal Workers' National Actuarial Valuation and Review as of January 1, 2018 This report has been prepared at the request of the Board of Trustees to assist in administering the Fund and meeting
SEIU Affiliates Officers and Employees Pension Plan
 SEIU Affiliates Officers and Employees Pension Plan Actuarial Valuation and Review as of January 1, 2016 This report has been prepared at the request of the Board of Trustees to assist in administering
New Mexico Retiree Health Care Authority
 New Mexico Retiree Health Care Authority Actuarial Valuation and Review of Other Postemployment Benefits (OPEB) as of June 30, 2016 In accordance with GASB Statement No. 43 This report has been prepared
Minneapolis Employees Retirement Fund. Actuarial Valuation and Review as of July 1, Copyright 2004
 Minneapolis Employees Retirement Fund Actuarial Valuation and Review as of July 1, 2004 Copyright 2004 THE SEGAL GROUP, INC., THE PARENT OF THE SEGAL COMPANY ALL RIGHTS RESERVED The Segal Company 6300
Sheet Metal Workers' National Pension Fund
 Sheet Metal Workers' National Actuarial Valuation and Review as of January 1, 2015 This report has been prepared at the request of the Board of Trustees to assist in administering the Fund and meeting
Actuarial Valuation and Review as of July 1, 2004
 The Water and Power Employees' Retirement Plan of the City of Los Angeles Actuarial Valuation and Review as of July 1, 2004 Copyright 2004 THE SEGAL GROUP, INC., THE PARENT OF THE SEGAL COMPANY ALL RIGHTS
Laborers Pension Trust Fund for Northern California
 Laborers Pension Trust Fund for Actuarial Valuation and Review as of June 1, 2016 This report has been prepared at the request of the Board of Trustees to assist in administering the Fund and meeting filing
Teachers Retirement System of the State of Illinois
 Teachers Retirement System of the State of Illinois Preliminary Actuarial Valuation and Review of Pension Benefits as of June 30, 2018 October 16, 2018 Copyright 2018 by The Segal Group, Inc. All rights
Sheet Metal Workers' National Pension Fund Actuarial Valuation and Review as of January 1, 2012
 Sheet Metal Workers' National Pension Fund Actuarial Valuation and Review as of January 1, 2012 This report has been prepared at the request of the Board of Trustees to assist in administering the Fund
The Water and Power Employees' Retirement Plan of the City of Los Angeles Insured Lives Death Benefit Fund
 The Water and Power Employees' Retirement Plan of the City of Los Angeles Insured Lives Death Benefit Fund GASB Actuarial Valuation and Review as of July 1, 2008 Copyright 2008 THE SEGAL GROUP, INC., THE
Automotive Industries Pension Plan
 Automotive Industries Actuarial Valuation and Review as of January 1, 2016 This report has been prepared at the request of the Board of Trustees to assist in administering the Fund and meeting filing requirements
The Water and Power Employees' Retirement Plan of the City of Los Angeles Insured Lives Death Benefit Fund for Noncontributing Members
 The Water and Power Employees' Retirement Plan of the City of Los Angeles Insured Lives Death Benefit Fund for Noncontributing Members GASB Actuarial Valuation and Review as of July 1, 2009 Copyright 2009
CITY OF SAN JOSE FEDERATED CITY EMPLOYEES RETIREMENT SYSTEM POSTEMPLOYMENT HEALTHCARE PLAN. Audit of June 30, 2016 OPEB Actuarial Valuation
 CITY OF SAN JOSE FEDERATED CITY EMPLOYEES RETIREMENT SYSTEM POSTEMPLOYMENT HEALTHCARE PLAN Audit of June 30, 2016 OPEB Actuarial Valuation 100 Montgomery Street, Suite 500 San Francisco, CA 94104 COPYRIGHT
Sheet Metal Workers' National Pension Fund. Actuarial Valuation and Review as of January 1, Copyright 2009
 Sheet Metal Workers' National Pension Fund Actuarial Valuation and Review as of January 1, 2009 Copyright 2009 THE SEGAL GROUP, INC., THE PARENT OF THE SEGAL COMPANY ALL RIGHTS RESERVED THE SEGAL COMPANY
The Water and Power Employees Retirement, Disability and Death Benefit Insurance Plan
 The Water and Power Employees Retirement, Disability and Death Benefit Insurance Plan Review of the as of July 1, 2013 This report has been prepared at the request of the Board of Administration to assist
The Water and Power Employees Retirement, Disability and Death Benefit Insurance Plan
 The Water and Power Employees Retirement, Disability and Death Benefit Insurance Plan Review of the Disability Fund as of July 1, 2014 This report has been prepared at the request of the Board of Administration
as of July 1, 2006 Copyright October 2006 THE SEGAL GROUP, INC., THE PARENT OF THE SEGAL COMPANY ALL RIGHTS RESERVED Actuarial Valuation Report
 Benefits, Compensation and HR Consulting University of California Retirement Plan Actuarial Valuation Report as of July 1, 2006 Copyright October 2006 THE SEGAL GROUP, INC., THE PARENT OF THE SEGAL COMPANY
Sheet Metal Workers' National Pension Fund Actuarial Valuation and Review as of January 1, 2010
 Sheet Metal Workers' National Pension Fund Actuarial Valuation and Review as of January 1, 2010 Copyright 2010 by The Segal Group, Inc., parent of The Segal Company. All rights reserved. THE SEGAL COMPANY
Minneapolis Employees Retirement Fund. Actuarial Valuation and Review as of July 1, Copyright 2007
 Minneapolis Employees Retirement Fund Actuarial Valuation and Review as of July 1, 2007 Copyright 2007 THE SEGAL GROUP, INC., THE PARENT OF THE SEGAL COMPANY ALL RIGHTS RESERVED The Segal Company 101 North
Proposed New Tiers of Benefit for New Entrants Based on Proposals from the City (Pension Plan and Retiree Medical Plan) Copyright 2011
 Copyright 2011") LOS ANGELES CITY EMPLOYEES RETIREMENT SYSTEM Proposed New Tiers of Benefit for New Entrants Based on Proposals from the City (Pension Plan and Retiree Medical Plan) Copyright 2011 THE SEGAL COMPANY, INC.
LOS ANGELES CITY EMPLOYEES RETIREMENT SYSTEM Proposed New Tiers of Benefit for New Entrants Based on Proposals from the City (Pension Plan and Retiree Medical Plan) Copyright 2011 THE SEGAL COMPANY, INC.
Actuarial Valuation and Review as of July 1, 2002
 The Water and Power Employees' Retirement Plan of the City of Los Angeles Actuarial Valuation and Review as of July 1, 2002 Copyright 2002 THE SEGAL GROUP, INC., THE PARENT OF THE SEGAL COMPANY ALL RIGHTS
Proposed New Tier of Benefit for New Entrants Based on Union Proposal (Pension Plan and Retiree Medical Plan) Copyright 2011
 Copyright 2011") LOS ANGELES CITY EMPLOYEES RETIREMENT SYSTEM Proposed New Tier of Benefit for New Entrants Based on Union Proposal (Pension Plan and Retiree Medical Plan) Copyright 2011 THE SEGAL COMPANY, INC. THE PARENT
LOS ANGELES CITY EMPLOYEES RETIREMENT SYSTEM Proposed New Tier of Benefit for New Entrants Based on Union Proposal (Pension Plan and Retiree Medical Plan) Copyright 2011 THE SEGAL COMPANY, INC. THE PARENT
100 Montgomery Street, Suite 500 San Francisco, CA 94104
 City of Los Angeles Fire and Police Pension Plan ACTUARIAL EXPERIENCE STUDY Analysis of Actuarial Experience During the Period July 1, 2010 through June 30, 2013 100 Montgomery Street, Suite 500 San Francisco,
Proposed New Tier of Benefit for New Entrants Based on Union Proposal (Pension Plan and Retiree Medical Plan) Copyright 2011
 Copyright 2011") LOS ANGELES CITY EMPLOYEES RETIREMENT SYSTEM Proposed New Tier of Benefit for New Entrants Based on Union Proposal (Pension Plan and Retiree Medical Plan) Copyright 2011 THE SEGAL COMPANY, INC. THE PARENT
LOS ANGELES CITY EMPLOYEES RETIREMENT SYSTEM Proposed New Tier of Benefit for New Entrants Based on Union Proposal (Pension Plan and Retiree Medical Plan) Copyright 2011 THE SEGAL COMPANY, INC. THE PARENT
Review of October 1, 2017 Actuarial Valuation Results
 SEIU Local 1 & Participating Employers Pension Trust Review of October 1, 2017 Actuarial Valuation Results Presented by: Jessica A. Streit Vice President and Benefits Consultant John Redmond, ASA, MAAA,
City of Fort Pierce Retirement and Benefit System Fifty-Ninth Annual Actuarial Valuation Report for the Year Ending September 30, 2017 GRS
 City of Fort Pierce and Benefit System Fifty-Ninth Annual Actuarial Valuation Report for the Year Ending September 30, 2017 GRS Outline of Contents Report of September 30, 2017 Actuarial Valuation Pages
Massachusetts Water Resources Authority
 Massachusetts Water Resources Authority Actuarial Valuation and Review of Other Postemployment Benefits (OPEB) as of This report has been prepared at the request of the Massachusetts Water Resources Authority
Public Employees Retirement Association of Minnesota. Actuarial Valuation and Review as of July 1, Copyright 2004
 Public Employees Retirement Association of Minnesota Actuarial Valuation and Review as of July 1, 2004 Copyright 2004 THE SEGAL GROUP, INC., THE PARENT OF THE SEGAL COMPANY ALL RIGHTS RESERVED The Segal
C I T Y O F F O R T P I E R C E R E T I R E M E N T A N D B E N E F I T S Y S T E M
 C I T Y O F F O R T P I E R C E R E T I R E M E N T A N D B E N E F I T S Y S T E M F I F T Y - S E V E N T H ANNUAL ACTUARIAL VALU A T I O N R E P O R T FOR THE YEAR ENDING S E P T E M B E R 3 0, 2 0
AGENDA BOARD OF FIRE AND POLICE PENSION COMMISSIONERS. September 3, :30 a.m.
 AGENDA BOARD OF FIRE AND POLICE PENSION COMMISSIONERS September 3, 2015 8:30 a.m. Los Angeles Times Building 202 W. First Street, Suite 500 Los Angeles, CA 90012 Commissioner Diannitto will participate
As requested, we are providing the following information regarding the December 31, 2015 valuation.
 100 Montgomery Street Suite 500 San Francisco, CA 94104-4308 T 415.263.8260 www.segalco.com John W. Monroe, ASA, MAAA, EA Vice President & Actuary jmonroe@segalco.com Ms. Gail Strohl Chief Executive Officer
Re: City of Sarasota General Employees Pension Fund Lower Investment Return to 6.9%
 Item No. 8.2. Ms. Cynthia Akersloot, CPA Pension Plans Administrator City of Sarasota General Employees Pension Fund City of Sarasota 1565 First Street, Room 110 Sarasota, Florida 34236 Re: City of Sarasota
University of California Retirement Plan. Actuarial Valuation Report as of July 1, Copyright October 2005
 Benefits, Compensation and HR Consulting University of California Retirement Plan Actuarial Valuation Report as of July 1, 2005 Copyright October 2005 THE SEGAL GROUP, INC., THE PARENT OF THE SEGAL COMPANY
Teachers Retirement Association of Minnesota
 Teachers Retirement Association of Minnesota Actuarial Valuation Report For Funding Purposes As of July 1, 2017 This page is intentionally left blank Cavanaugh Macdonald C O N S U L T I N G, L L C The
CITY OF DEARBORN CHAPTER 22 RETIREMENT SYSTEM
 CITY OF DEARBORN CHAPTER 22 RETIREMENT SYSTEM 50 TH ANNUAL ACTUARIAL VALUATION JUNE 30, 2016 January 31, 2017 Board of Trustees City of Dearborn Chapter 22 Retirement System Dearborn, Michigan Re: City
Monroe County Employees Retirement System
 BUCK Monroe County Employees Retirement System Actuarial Valuation Report Plan Year as of December 31, 2017 August 2018 9401 James Avenue, Suite 140 Bloomington, MN 55431 August 22, 2018 Board of Trustees
CITY OF TALLAHASSEE PENSION PLANS ACTUARIAL VALUATION REPORT AS OF OCTOBER 1, 2016
 CITY OF TALLAHASSEE PENSION PLANS ACTUARIAL VALUATION REPORT AS OF OCTOBER 1, 2016 ANNUAL EMPLOYER CONTRIBUTION FOR THE FISCAL YEAR ENDING SEPTEMBER 30, 2018 AND SEPTEMBER 30, 2019 March 13, 2017 Board
City of Fort Pierce Retirement and Benefit System Sixtieth Annual Actuarial Valuation Report for the Year Ending September 30, 2018
 City of Fort Pierce Retirement and Benefit System Sixtieth Annual Actuarial Valuation Report for the Year Ending September 30, 2018 Outline of Contents Report of September 30, 2018 Actuarial Valuation
Los Angeles County Employees Retirement Association. ACTUARIAL VALUATION June 30, 2003
 ACTUARIAL VALUATION June 30, 2003 By Karen I. Steffen Fellow, Society of Actuaries Member, American Academy of Actuaries and Nick J. Collier Associate, Society of Actuaries Member, American Academy of
Automotive Industries Pension Plan Actuarial Valuation and Review as of January 1, 2010
 Automotive Industries Pension Plan Actuarial Valuation and Review as of January 1, 2010 Copyright 2010 by The Segal Group, Inc., parent of The Segal Company. All rights reserved. SECTION 1 SECTION 2 SECTION
Central States, Southeast and Southwest Areas Pension Plan
 Central States, Southeast and Southwest Areas Pension Plan Withdrawal Liability Valuation as of December 31, 2015 This report has been prepared at the request of the Board of Trustees for the purposes
FRESNO COUNTY EMPLOYEES RETIREMENT ASSOCIATION
 FRESNO COUNTY EMPLOYEES RETIREMENT ASSOCIATION Audit of Valuation Results for June 30, 2005 Copyright 2006 THE SEGAL GROUP, INC., THE PARENT OF THE SEGAL COMPANY ALL RIGHTS RESERVED THE SEGAL COMPANY 120
Teachers Retirement Association of Minnesota
 Teachers Retirement Association of Minnesota Actuarial Valuation Report For Funding Purposes As of July 1, 2016 This page is intentionally left blank Cavanaugh Macdonald C O N S U L T I N G, L L C The
Proposed New Tiers of Benefit for New Entrants (Pension Plan and Retiree Medical Plan) Copyright 2010
 Copyright 2010") LOS ANGELES CITY EMPLOYEES RETIREMENT SYSTEM Proposed New Tiers of Benefit for New Entrants (Pension Plan and Retiree Medical Plan) Copyright 2010 THE SEGAL COMPANY, INC. THE PARENT OF THE SEGAL COMPANY
LOS ANGELES CITY EMPLOYEES RETIREMENT SYSTEM Proposed New Tiers of Benefit for New Entrants (Pension Plan and Retiree Medical Plan) Copyright 2010 THE SEGAL COMPANY, INC. THE PARENT OF THE SEGAL COMPANY
The City of Omaha Police & Fire Retirement System
 The City of Omaha Police & Fire Retirement System Actuarial Valuation as of January 1, 2014 Cavanaugh Macdonald C O N S U L T I N G, L L C The experience and dedication you deserve July 10, 2014 Board
IOWA PUBLIC EMPLOYEES RETIREMENT SYSTEM
 IOWA PUBLIC EMPLOYEES RETIREMENT SYSTEM Actuarial Valuation Report as of June 30, 2015 This page intentionally left blank TABLE OF CONTENTS Section Page Certification Letter I Executive Summary... 1 II
Minnesota State Retiement System Legislators Retirement Fund. Actuarial Valuation and Review as of July 1, 2006
 Minnesota State Retiement System Legislators Retirement Fund Actuarial Valuation and Review as of July 1, 2006 Copyright 2006 THE SEGAL GROUP, INC., THE PARENT OF THE SEGAL COMPANY ALL RIGHTS RESERVED
Florida Retirement System Pension Plan
 Milliman Actuarial Valuation Actuarial Valuation as of July 1, 2017 Prepared by: Matt Larrabee, FSA, EA, MAAA Principal and Consulting Actuary Daniel Wade, FSA, EA, MAAA Principal and Consulting Actuary
Santa Barbara County Employees Retirement System. Actuarial Valuation as of June 30, Produced by Cheiron
 Santa Barbara County Employees Retirement System Actuarial Valuation as of June 30, 2013 Produced by Cheiron December 11, 2013 TABLE OF CONTENTS Letter of Transmittal... i Foreword... ii Section I Executive
Items. - - Introduction. 1-8 Executive Summary Section General. Police Officers. Firefighters
 T O W N O F P A L M B E A C H R E T I R E M E N T S Y S T E M COMBINED ACTUARIAL VA L U A T I O N R E P O R T F O R GENERAL EMPLOYEES INC L U D I N G O C E A N R E S C U E, P O L I C E O F F I C E R S
ACTUARIAL VALUATION REPORT AS OF OCTOBER 1, City of Plantation General Employees Retirement System
 ACTUARIAL VALUATION REPORT AS OF OCTOBER 1, 2014 City of Plantation General Employees Retirement System ANNUAL EMPLOYER CONTRIBUTION IS DETERMINED BY THIS VALUATION FOR THE FISCAL YEAR ENDING SEPTEMBER
ORANGE COUNTY EMPLOYEES RETIREMENT SYSTEM MEMORANDUM. DATE: June 3, Audit Oversight Committee Members
 ORANGE COUNTY EMPLOYEES RETIREMENT SYSTEM MEMORANDUM DATE: June 3, 2015 TO: FROM: SUBJECT: Audit Oversight Committee Members Brenda Shott, Assistant CEO, Finance and Internal Operations Tracy Bowman, Director
Jackson County State of Michigan. Amended and Restated Comprehensive Financial Plan For Pension and Other Post-Employment Benefits
 Jackson County State of Michigan Amended and Restated Comprehensive Financial Plan For Pension and Other Post-Employment Benefits October 17, 2017 T A B L E O F C O N T E N T S Section Pages Comprehensive
Middlesex County Retirement System
 Middlesex County Retirement System Governmental Accounting Standards Board (GASB) Statements No. 67 and 68 Accounting Valuation Report as of December 31, 2017 This report has been prepared at the request
L A B O R E R S A N D R E T I R E M E N T B O A R D E M P L O Y E E S A N N U I T Y A N D B E N E F I T F U N D O F C H I C A G O ACTUARIAL VALUATION
 L A B O R E R S A N D R E T I R E M E N T B O A R D E M P L O Y E E S A N N U I T Y A N D B E N E F I T F U N D O F C H I C A G O ACTUARIAL VALUATION R E P O R T FOR THE YEAR ENDING D E C E M B E R 3 1,
IOWA PUBLIC EMPLOYEES RETIREMENT SYSTEM
 IOWA PUBLIC EMPLOYEES RETIREMENT SYSTEM Actuarial Valuation Report as of June 30, 2018 This page intentionally left blank TABLE OF CONTENTS Section Page Certification Letter I Executive Summary... 1 II
ACTUARIAL SECTION (UNAUDITED)
") ACTUARIAL SECTION (UNAUDITED) Actuary s Letter To The Board of Trustees November 16, 2017 Board of Trustees Houston Municipal Employees Pension System 1201 Louisiana Suite 900 Houston, TX 77002 Subject:
ACTUARIAL SECTION (UNAUDITED) Actuary s Letter To The Board of Trustees November 16, 2017 Board of Trustees Houston Municipal Employees Pension System 1201 Louisiana Suite 900 Houston, TX 77002 Subject: