MONITORING POVERTY AND SOCIAL EXCLUSION Tom MacInnes, Hannah Aldridge, Sabrina Bushe, Peter Kenway and Adam Tinson
|
|
|
- Ashley Douglas
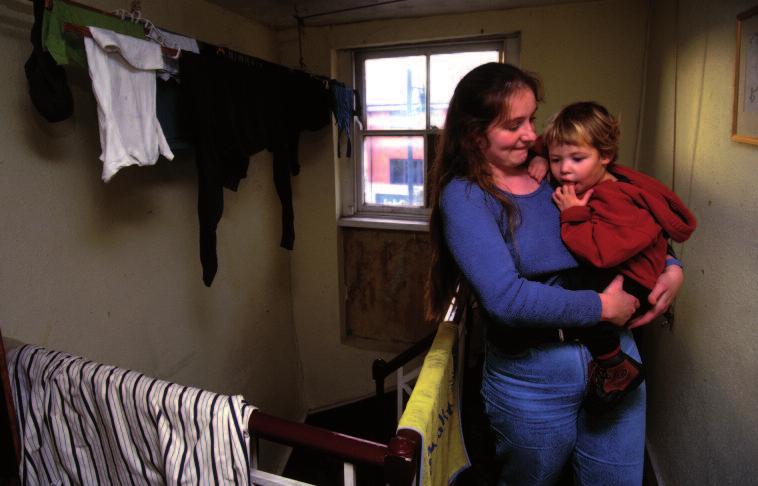
- 6 years ago
- Views:
Transcription

1 MONITORING POVERTY AND SOCIAL EXCLUSION 213 Tom MacInnes, Hannah Aldridge, Sabrina Bushe, Peter Kenway and Adam Tinson
2 MONITORING POVERTY AND SOCIAL EXCLUSION 213
3 This publication can be provided in alternative formats, such as large print, Braille, audiotape and on disk. Please contact: Communications Department Joseph Rowntree Foundation The Homestead 4 Water End York YO3 6WP Tel: info@jrf.org.uk
4 MONITORING POVERTY AND SOCIAL EXCLUSION 213 Tom MacInnes, Hannah Aldridge, Sabrina Bushe, Peter Kenway and Adam Tinson
5 Cover image credits (from top left, left to right): Liz Hingley; Liz Hingley; Tim Smith; The Joseph Rowntree Foundation has supported this project as part of its programme of research and innovative development projects, which it hopes will be of value to policy-makers, practitioners and service users. The facts presented and views expressed in this report are, however, those of the author(s) and not necessarily those of the Foundation. Joseph Rowntree Foundation The Homestead 4 Water End York YO3 6WP Website: New Policy Institute, 213 First published 213 by the Joseph Rowntree Foundation All rights reserved. Reproduction of this report by photocopying or electronic means for non-commercial purposes is permitted. Otherwise, no part of this report may be reproduced, adapted, stored in a retrieval system or transmitted by any means, electronic, mechanical, photocopying, or otherwise without the prior written permission of the Joseph Rowntree Foundation. ISBN: (paperback) A pdf version of this publication is available from the JRF website or from the poverty statistics website ( Further copies of this report, or any other JRF publication, can be obtained from the JRF website ( or from our distributor, York Publishing Services (Tel: ). A CIP catalogue record for this report is available from the British Library. Designed and produced by Pinnacle Graphic Design Ltd.
6 Contents Acknowledgements 3 Summary of trends over the last five and ten years 4 Commentary 6 Chapter 1 Income and low income 11 Introduction 12 Choice of indicators 13 1 Change in incomes over time 14 2 Poverty and age 16 3 The child poverty targets 18 4 Poverty before and after housing costs 2 5 Food costs and food banks 22 6 The Minimum Income Standard (MIS) 24 7 In-work poverty 26 8 Disability and poverty 28 9 Child poverty in local areas 3 Commentary 32 Chapter 2 Work 33 Introduction 34 Choice of indicators 35 1 Underemployment Unemployment by age Disability and the labour market 4 13 Workless households Low pay Pay inequalities Low pay and household income In-work training 5 18 Insecure work Unemployment by local authority 54 Commentary 56 Chapter 3 Education 57 Introduction 58 Choice of indicators 59 2 Attainment at age Attainment at age School performance at GCSE Looked-after children Attainment at age Qualifications and employment 7 26 Attainment among disadvantaged students by local authority 72 Commentary 74 Monitoring poverty and social exclusion 213 1
7 Contents Chapter 4 Social security and welfare reform 75 Introduction 76 Choice of indicators Value of benefits Out-of-work benefits 8 29 Claimant counts and flows 82 3 Interval between JSA claims Disability benefits Tax credits Changes to benefits in JSA sanctions The Work Programme Out-of-work benefits across the UK 96 Commentary 98 Chapter 5 Housing 99 Introduction 1 Choice of indicators Poverty and tenure Affordability Housing benefit claims 16 4 Housing benefit values Repossessions Overcrowding Homelessness Housing benefits across Great Britain 116 Commentary 118 Chapter 6 Health 119 Introduction 12 Choice of indicators Infant mortality Childhood obesity Under-age pregnancy Premature death Unpaid caring responsibilities 13 5 Life expectancy by local authority 132 Commentary 134 Appendix 135 Glossary Monitoring poverty and social exclusion 213
8 Acknowledgements Intro This report has benefited hugely from the support we have received from many different people and organisations. In particular, our advisory group has helped immeasurably in determining the focus of this year s report. Our advisory group was Ellie Brawn from Scope, Declan Gaffney, Becky Tunstall from York University, Geoff Fimister from the Citizens Advice Bureau, Joanna Littlechild from the Department for Work and Pensions, Marcus Green from Age UK, Rob Tabb from Knowsley Council, Romin Sutherland from Zacchaeus 2 Trust, Tom Wardle from the Centre for Social Justice, Guy Parckar from Leonard Cheshire Disability, Rowan Foster from the Centre for Economic and Social Inclusion, Kate Bell from the Child Poverty Action Group, Ruth Lupton from the London School of Economics, Nicola Morton from the Local Government Association, Lan-ho Man from the Department for Communities and Local Government, and John Philpott. Finally we would like to thank Aleks Collingwood of JRF and Edwina Rowling for their advice and support. The responsibility for the accuracy of the report, any errors, misrepresentation or misunderstandings, lies with the authors alone. Monitoring poverty and social exclusion 213 3
9 Summary of trends Summary of trends over the last five and ten years Table 1 presents a summary of the indicators in the report. Where possible, it looks at changes over the last five and ten years, though the data does not always allow for this. The assessment of whether an indicator is better or worse is in part a statistical judgement. When the choice is unclear, we err on the side of caution and label it unchanged. Overall, 15 of 37 indicators have improved over the last five years and 15 have got worse. Many of the improvements are found in the health and education sections. Many of the deteriorations are in the work and benefits sections. Going back five years means we are comparing current data with the eve of the recession; many of the economic indicators have deteriorated markedly since. Over the longer term, the picture is similar. Of 34 available indicators 16 have improved and 13 have got worse. 4 Monitoring poverty and social exclusion 213
10 Summary of trends over the last five and ten years continued Summary of trends Table 1: Summary of trends over the last five and ten years Topic Low income Indicator 1-year change 5-year change Median incomes Worse Worse Child poverty rate Better Better Pensioner poverty rate Better Better Working-age adults with children poverty rate Better No change Working-age adults without children poverty rate Worse Worse Number of people in poverty in working families Worse Worse Number of people in poverty in workless or retired families Better Better Work Number of people underemployed Worse Worse Young adult unemployment rate Worse Worse Proportion of workless households No change No change Proportion of men that are low paid No change Worse Proportion of women that are low paid Better No change Male median full-time earnings Better Worse Female median full-time earnings Better Worse Proportion of people with qualifications receiving in-work training Worse Worse Proportion of people without qualifications receiving in-work training Worse No change Education Proportion of children not reaching expected standard at age 11 Better Better Proportion of children not reaching expected standard at age 16 Not in report Better FSM gap at age 16 Not in report No change Proportion of looked-after children not reaching expected standard at age 16 Not in report Better Proportion of care leavers not in education or training or contact with social services No change No change FSM gap at age 19 for Level 3 qualifications Not in report Better Benefits Number claiming a key out-of-work benefit No change Worse Stock of people claiming JSA Worse Worse On-flows of people claiming JSA Worse Worse Number of sanctions among JSA claimants Worse Worse Housing Social rent poverty risk Better Better Private rent poverty risk Better Better Number of people claiming housing benefit Worse Worse Number of mortgage repossessions Worse Better Number of landlord orders made for repossession No change No change Rate of overcrowding in rented accommodation Worse No change Number of homelessness acceptances Better Better Health Infant mortality rate Better Not in report Obesity levels among Year 6 pupils Not in report Worse Under-age pregnancy rate Better Better Risk of premature mortality (men) Better Better Risk of premature mortality (women) Better Better Monitoring poverty and social exclusion 213 5
11 Commentary Commentary Key stats 13 million people were in poverty in 211/12. Average incomes fell by 8 per cent between 28 and 212. Poverty in 211/12: falling numbers but not good news 13 million people in the UK were in poverty in 211/12, the most recent year for which there is data. Poverty is measured by net household income, adjusted for size (bigger ones need more money to reach a given standard of living than smaller ones) and after housing costs have been deducted. People are counted as being in poverty if their household income is below 6 per cent of the median (mid-point) income for all UK households. In 211/12, this poverty threshold for a single adult was 128. For a couple with two children it was 357. Obviously 13 million is far too high. Yet expressed as a proportion of the population, this 21 per cent poverty rate is the lowest since 24/5, which itself was the lowest for more than a decade. This year s rate is the second lowest since more reliable official statistics began to be collected in the mid-199s. But this is little comfort for two reasons. First, the latest poverty statistics are two years old. For many children and working-age adults with low household incomes, the ongoing squeeze on incomes of the last two years can only have increased both the extent of poverty (the numbers affected) and its depth (how far their household incomes are below the poverty line). This is true for both children and adults and for those both in working and non-working families. Pensioners have been spared most of this. The 14 per cent pensioner poverty rate is half what it was 2 years ago and one-third of what it was in the 196s. Apart from a blip 3 years ago when the rate fell sharply then jumped back up, it is quite possible that the pensioner poverty rate is now the lowest it has ever been. Just one in eight of all those in poverty in the UK are pensioners. Second, the headline poverty rate understates the squeeze there has been on those with low incomes. That is because the extent of poverty in any year is measured relative to median incomes in the same year. Over the four years to 211/12 median income fell by an unprecedented 8 per cent. The effect of this is that the threshold against which poverty is measured also fell. A family could be in poverty in 28, see no rise in their income over four years, and yet not be in poverty by 212 simply because the median had fallen. We have always said in these reports that proper interpretation of the statistics means looking at what is happening in relation to both the contemporary (same-year) and fixed-year poverty thresholds. The same-year threshold is the more important (poverty is, by its very nature, relative). However, a fall in this relative poverty can only be a good thing if the number below the fixed threshold falls too. The fixed threshold is a matter of choice; the DWP use 21/11 as a staging post towards the 22 Child Poverty Act targets. But to fully examine the impact of the falling median, the obvious one to take here is the 27/8 high point. Choosing our words carefully, we find that alongside the 13 million people in poverty in 211/12 are a further two million with incomes that would have been low enough to count as poverty in 27/8. That is the effect of the recession and its prolonged aftermath. 6 Monitoring poverty and social exclusion 213
12 Commentary For both children and pensioners, the numbers below the 27/8 threshold are little different in the latest year. By contrast, the number of working-age adults with household incomes below this threshold has jumped by a fifth, 1.5 million, in four years. Changes since 211/12: social security and tax credits The effect of welfare reforms that were introduced in April 211 are reflected in the latest poverty statistics. They include the more severe limits on the Local Housing Allowance payable to private sector tenants, the reduction in the share of childcare costs met by Working Tax Credit and the restriction or abolition of benefits payable to pregnant mothers or for newborn babies. The switch from Incapacity Benefit to Employment and Support Allowance was also well underway. But most changes have only come in since April 212; their effect is not in these figures. These changes include: an increase in the number of hours people must work to be entitled to Working Tax Credit and the restriction on eligibility for the contribution-based Employment Support Allowance (both 212). Changes which only took effect in April 213 include: the under-occupancy penalty in social housing; the replacement of Council Tax Benefit (in England) by Council Tax Support; the 5 a week household benefit cap ( 35 for single people without children); the uprating of benefits by only 1 per cent; and the start of the process of replacing Disability Living Allowance by the Personal Independence Payment. Several things can be said about the impact of these changes. Although there are exceptions (e.g. the withdrawal of some child benefits from higher income families) most affect those with low or near low incomes. Almost all affect working families as well as non-working ones. The scale and depth of the impacts vary greatly. Many families have been hit by more than one benefit change. The replacement of Council Tax Benefit by Council Tax Support in April 213 illustrates these points. The change left around 2.4 million families facing an increase in Council Tax (usually after having had a full rebate up until that point). Two million of them are estimated to be in poverty three-quarters in deep poverty (less than 5 per cent of median income). 2 per cent of these are in working families. Impacts vary, from around 1 a week and with an average 2.6. And 44, were hit by the under-occupancy penalty (with a combined weekly impact of 16.9 on average). The biggest impacts an estimated 93 a week on average fell on 4, families as a result of the household benefit cap. To lose a sum of money this large must require a drastic change in the way a family lives. But what about those losing small sums, for example around nine million families will on average be 2 per cent worse off by April 214 as a result of benefits being uprated by just 1 per cent. Do these small sums of money really matter that much? First, as already noted, many are hit by more than one of these changes. Second, the incomes derived from the main out-of-work means-tested benefits were already very low, being worth 6 per cent of the Minimum Income Standard for families with children or just 4 per cent for single working-age adults. The amounts for single adults only cover what the public believes to be the minimum necessary for food, fuel and water. Monitoring poverty and social exclusion 213 7
13 Commentary Key stats 2 million families in poverty are no longer exempt from paying Council Tax. Out-of-work benefits are worth less than 4 per cent of Minimum Income Standard for single adults. Third, restrictions on housing benefits and Council Tax Benefit mean that many people now have to pay towards both rent and tax from this income where previously they did not. Finally, a much tougher sanctions regime has seen many more lose benefit as a punishment for infringing the rules. Both of these last two factors were already evident in 211/12 and therefore reflected in the headline statistics. But both, too, have continued to grow since then. In short, most of the changes to social security and tax credits brought in by this government are now operating but are not reflected in the latest poverty statistics. They will, in all cases, leave people worse off than they would otherwise have been. This is as true for people in work as for those out of work. The main exception to this is Universal Credit but this has only just begun to be introduced. From October 213, it will still only cover single adults applying for what would previously have been Jobseeker s Allowance, within a handful of pilot areas. It is likely to be a year into the life of the next parliament before the impact of this reform, which does have some positive effects, can be expected to begin to show in the poverty statistics. Changes since 211/12: employment and earnings The story with the labour market is different. On a range of indicators to do with work and jobs, all (by the first half of 213) were past their worst. Workless households peaked in 21. The unemployment rate peaked in 211. The wider measure of underemployment peaked in 212. The number of people on a temporary work contract because they could not find a permanent one also peaked in 212. This means that the latest available poverty statistics may reflect the labour market at its weakest. On these measures, the labour market has now turned. This is very different from what happened after the last recession 2 years ago. The rise in the unemployment rate during and immediately after that recession was similar to that seen in 28 and 29 but the fall from the peak was rapid. Although the fall in underemployment after 1993 was more muted, it began almost as soon as the recession ended. This time, it has only just begun. What has made the difference is the number in part-time work but wanting full-time work. Although its rise has slowed it hasn t stopped, the 1.42 million people in this situation in the first half of 213 being a new record, up 15, on 211. But the turn of the tide for jobs has not been matched by a turn on pay which continues to fall after allowing for inflation. One sign of this is the numbers paid at or below the living wage. In 212, 4.9 million people were paid below the living wage of 7.45 an hour. A year earlier, 4.6 million were paid below the living wage of 7.2. This 3, increase reflects the fact that prices (which feed into the calculation of the living wage) were still growing faster than wages in 212. Median hourly pay (the rate below which exactly half of all those employed are paid) grew 1 per cent in 212. Over the same period, the consumer price index rose by nearly 3 per cent. One factor pushing the other way is the increase in the personal tax allowance, by 63 in 212/13 and 1,335 in 213/14. This combined increase of nearly 2, is very big and pushes up weekly net earnings by up to 8 per week. But someone paid the minimum wage ( 6.31 an hour from October 213) only gets the 8 Monitoring poverty and social exclusion 213
14 Commentary Key stats Almost 5 million people were paid less than the living wage in million people in part-time work want but cannot find a full-time job. full 8 if they average at least 29 hours of work a week. If they average less than 25 hours a week the 213/14 increase is worth nothing, as they are not paying income tax anyway. A recipient of housing benefit will find that benefit reduced by 65 per cent of any increase in net earnings. As a result, a housing benefit recipient working full-time at 6.31 an hour could end up just 3 a week better off. If the judgement on the paths of employment and earnings since early 212 can be no better than that the worst is past, this is still far more positive than the judgement on recent changes to the benefit system. Should this be seen as some reward for a deserving group and some further penalty for an undeserving one? The answer to this is no. For one thing, as noted above, most of the adverse changes to benefits and tax credits impact those in work too. More fundamentally, attempts to portray the workless as a breed apart are quite at odds with the evidence. For example, claims for Jobseeker s Allowance shows how much movement there is between work and unemployment. Although the number claiming this benefit at any one time has been around 1.5 million since 29, 4.8 million different people have claimed it at some point in the last two years. This is equivalent to almost one in six of those in work. Neither is disability a sign of detachment from the world of work. For example, among those aged 25 to 5, half of those who report a disability are in work while a further quarter wants work. As for households who have never worked, a majority are made up of people aged under 25, reflecting the persistently high rates of young adult unemployment as well as the fact that many in this group are, or have until recently been, students. Poverty now: counting the pennies The calm surface of the poverty statistics for 211/12 hides a sharp shift downwards. Looking forward into the recent past shows this has continued. Although the labour market has now turned, pay is still falling relative to prices. The real value of benefits will fall further in 214. The danger is that this downward shift is becoming a downward spiral. Our reading of where this is heading is bleak. For those not working, the price of state financial support is discipline and demonisation. The real value of that support, already low (especially for those without dependent children), continues to fall. Restrictions on housing and council tax benefits also mean it has to go further than ever. For some, state support no longer even stops people from going hungry. This is the significance of food banks. It s not so much the number of people having to turn to them (35, in 212/13, even before the deepest of the cuts) as the reasons for the referrals, almost half arising directly from problems with the benefit system. If this system were doing its job, that proportion would be all but zero. Those who are poor but in work (with their families, now a majority of all those in poverty across the UK) enjoy more political sympathy, but they still face the prospect of more stringent conditions attached to the receipt of in-work benefits under Universal Credit aimed at getting them to work longer. Yet the main financial beneficiary of any extra Monitoring poverty and social exclusion 213 9
15 Commentary Key stats Almost 5 million people claimed JSA over the last two years. The majority of people in households where no adult has ever worked are aged under 25. work is not the worker and their family but the state. For example, someone receiving tax credits but also paying national insurance and income tax keeps 27 pence of every extra pound earned; the other 73 pence goes to the Treasury. In this situation, a day s work at the minimum wage puts 11.9 in the pocket. With housing benefit adjusted (reduced if earnings rise), the net return for the day s work falls to just 4.2. Universal Credit will help if there is housing in the claim but will make it worse if there isn t (by 1.6 in both cases). Those in in-work poverty are ever more trapped. The pressure now being applied to the poorest quarter of society has not been seen since before the birth of the welfare state in the 194s. Some local charities and advice services have told us about families now counting pennies. Given the evidence in this report, this is not surprising. The problems that this government and the last see themselves as addressing through their welfare reforms a soaring benefit bill, worklessness, poverty are serious indeed. But their roots do not lie in the people caught up in them. Instead they lie elsewhere, in the behaviour of both financial and non-financial corporations, in the laxity of regulators, in an unwillingness to contemplate a low-cost, good-quality alternative to private rented homes, in confused thinking that treats valid answers to questions about individuals (why this person is unemployed rather than that) as if they were valid answers for social ones too (why there is unemployment at all). If poverty is really to be tackled (as the euphemism goes), it is the shortcomings of powerful institutions and ideas that must be the object of relentless attention, not the poor themselves. 1 Monitoring poverty and social exclusion 213
16 Chapter 1 Income and low income Introduction 12 Choice of indicators 13 1 Change in incomes over time 14 2 Poverty and age 16 3 The child poverty targets 18 4 Poverty before and after housing costs 2 5 Food costs and food banks 22 6 The Minimum Income Standard (MIS) 24 7 In-work poverty 26 8 Disability and poverty 28 9 Child poverty in local areas 3 Commentary 32
17 Chapter 1 Income and low income Introduction Income, and low income in particular, is at the heart of our analysis of poverty. The main indicators of poverty in this series of reports use household income as the measure. When we look at disadvantage in other areas of the report, such as health or education, we try to analyse differences by income, or some proxy of income. The reason for this is that in a market economy such as ours, the ability to participate, or take control of one s own life, is heavily dependent on having the income to do so. If poverty is about lacking the resources to attain the norms of contemporary society and no one has come up with a better definition then income is clearly central. In previous years, the implications of this approach for a study like this were clear enough. As average (median) incomes rose, the standards that were considered the norm rose too. We would look at incomes relative to the average for that year. Table 2 shows the values of this threshold, measured both before and after housing costs are taken into account. Table 2: The poverty threshold in 211/12, per week Single adult Couple, no children Lone parent, one young child Couple, two children aged 6 and 14 Before housing costs After housing costs But in the last two years, median incomes have fallen by an unprecedented degree. This means the poverty threshold itself is lower. This gives rise to a situation where a family in poverty one year can be lifted out the next without their income rising at all. Clearly such a change is meaningless, and as a result a greater focus is given to the absolute measure of poverty. This measure fixes the poverty threshold at its 21/11 level, adjusting only for inflation in later years. This fixed measure is used in the child poverty targets, and in our analysis of those targets in graph 2A. But the choice of year is arbitrary and the coincidental point that it happens to be last year is not especially helpful, given that incomes had already started falling by then. To fully look at how falling incomes impact on the measure of poverty we need to go back further than one year, to the middle of the last decade when incomes were at their peak. This is where our analysis begins. 12 Monitoring poverty and social exclusion 213
18 Income and low income Choice of indicators The first indicator looks at how incomes have changed at different points in the distribution and for different family types. Setting out this change helps us better understand the analysis of low income that follows. We then look at the long-term pattern of poverty across age groups. The changes in risk and composition of poverty have been substantial and going back to the 198s gives us an opportunity to look at what happened to poverty following previous recessions. The next indicator covers the child poverty targets. They include both a relative and fixed measure of poverty, and we look more closely at the material deprivation measure in the second graph. Following this analysis of different measures of poverty, we look at the differences before and after housing costs. This analysis considers both the differing proportions considered to be in poverty under each measure and the effect of housing benefits on the calculations. We then have two indicators on costs one looking at inflation in the price of food and other essentials and the other comparing the minimum income standard to the poverty threshold and levels of out-of-work benefits. When incomes rise more slowly than prices, the cost of goods becomes an ever more important part of our understanding of poverty. This is followed by an analysis of in-work poverty. The numbers of people in poverty who live in working families has been rising in recent years. For the first time, this report also looks at the numbers of working people in poverty. The final indicator looks at levels of poverty among disabled people. Not only do disabled people have higher rates of poverty than the population average, but this rate is also likely to be an underestimate. This indicator looks at both of these aspects. Chapter 1 Monitoring poverty and social exclusion
19 Chapter 1 Income and low income 1 Change in incomes over time Incomes at all levels fell in the last two years. The fall in median incomes lowered the estimate of the number of people in relative poverty. Following two consecutive annual falls, median incomes in 211/12 were below where they were a decade earlier. The actual value was 367 per week, compared with 368 in 21/2 (equivalised values adjusted for inflation). As recently as 29/1, median household income had been 7 per cent above its 21/2 level, although it actually peaked two years earlier. The total fall from its 27/8 peak was 8 per cent. At different ends of the distribution, incomes behaved rather differently. For those with the highest 1 per cent of incomes (the 9th percentile), incomes carried on rising until 29/1, well after the recession began. The fall since then has been steep, however, meaning that the top 1 per cent of incomes are now roughly where they were a decade ago. The data also shows a fall in the incomes of the bottom tenth beginning well before the fall in the median. Incomes at the 1th percentile peaked in 24/5, at around 6 per cent above their 21/2 level ( 171). Up to that point, the growth in incomes at the bottom had been in line with the growth in the median. After 24/5, however, they fell for seven of the next nine years. By 211/12 they were 5 per cent lower than a decade earlier. The falling median impacts on the measurement of poverty as it lowers the poverty threshold by a corresponding amount. The effect of this 8 per cent fall is shown in the second graph. In total, 2.2 million people were above the 211/12 poverty threshold but below the threshold for 27/8. Between 27/8 and 211/12, the number of children in poverty on the relative measure fell by around 5,. But around 6, children lived in households whose income, while above the 211/12 poverty threshold, would have been below the 27/8 threshold. For pensioners, the story is similar. Pensioner poverty fell by 4,, but in 211/12, a further 5, pensioners lived in households whose incomes were below the 27/8 poverty threshold. Poverty among working-age adults, however, had risen from 7.5 million in 27/8 to 7.9 million in 211/12. On top of this, some 1.1 million working-age adults lived in households whose income was above the 211/12 threshold but below the threshold for 27/8. 14 Monitoring poverty and social exclusion 213
20 Income and low income Change in incomes over time Chapter 1 Indicator: 1A The fall in median incomes over the last two years wiped out all the gains of the previous decade. Incomes at the bottom have fallen further still, and for longer. 9th percentile Median 3th percentile 1th percentile Change in weekly equivalised After Housing Costs income since 21/2 (per cent) /2 22/3 23/4 24/5 25/6 26/7 27/8 28/9 29/1 21/11 211/12 Source: Households Below Average Income, DWP; the data is for the UK Indicator: 1B The fall in median incomes since 27/8 means that around two million people, mainly working age adults, are not now considered to be in poverty although their incomes are low enough to have been below the poverty threshold four years earlier. Not in poverty but below 27/8 poverty threshold In poverty After Housing Costs Number of people (millions) /8 211/12 27/8 211/12 27/8 211/12 Children Working-age Pensioners Source: Households Below Average Income, DWP; the data is for the UK The first graph shows the change in incomes at the 1th, 3th and 9th percentile points as well as at the median over the last decade. Income is measured after housing costs have been deducted and is adjusted (equivalised) for household size and composition. All values are given in 211/12 prices, so adjusted for inflation. The second graph shows the number of people in poverty in 211/12 on the relative after housing costs measure. In addition, it shows the number of people who are not in poverty in 211/12 but have incomes below 6 per cent of the 27/8 median (after housing costs and adjusting for inflation). As the first graph shows, median income in 211/12 is 8 per cent lower than in 27/8. So these additional people in poverty are those whose household income is between 6 per cent and 64.8 per cent (6 per cent + 8 per cent of 6 per cent) of the 211/12 median. Monitoring poverty and social exclusion
21 Chapter 1 Income and low income 2 Poverty and age The age distribution of people in poverty has changed radically over the last few decades. Falls in pensioner and, to a lesser extent, child poverty contrast with a steady rise in poverty among working-age adults without children. In 211/12, the proportion of pensioners living in poverty had fallen to 14 per cent, its lowest rate for almost 3 years. Child poverty has fallen to 27 per cent, its lowest rate for almost 25 years. At the same time, poverty among working-age adults with children remains at 23 per cent, a similar level to that in the last MPSE report. Among working-age adults without dependent children, the proportion living in poverty is now 2 per cent. This is the highest in at least 3 years, having risen quite steadily over that period. Uniquely, poverty among this group did not fall when median incomes, against which the poverty threshold is measured, fell. The changes in the 198s are worth drawing attention to. In that decade, pensioner poverty more than doubled before beginning to fall again. Poverty among children began rising in the early 198s, and peaked in the early 199s some 17 percentage points higher. Among working-age parents, the rise was slightly smaller, at around 13 percentage points and around 5 percentage points for working-age adults without children. Since then, the overall fall in child poverty, from its peak in the mid-199s to today, is around 7 percentage points. The fall in pensioner poverty has been much sharper from more than 4 per cent in the late 198s to 14 per cent today, a fall of roughly two-thirds. These changes become even more apparent when we consider the composition of those in poverty. In 1982, there were 2.3 million children and 1.6 million pensioners in poverty, making up between them around half of those in poverty. Even as poverty rose over the decade, from 7.8 million to 13.5 million, children and pensioners combined still made up just over half of the total. By 212, however, this had changed completely. There are now around 3.5 million children in poverty, 3.2 million parents, 1.6 million pensioners and 4.7 million working-age adults without children. Working-age adults now make up the majority (6 per cent) of all those in poverty. So despite parents having a greater risk of poverty (see graph 2A), there are many more non-parents living in poverty. 16 Monitoring poverty and social exclusion 213
22 Income and low income Poverty and age Chapter 1 Indicator: 2A Pensioner poverty is now at one third of its level in the late 198s. Poverty among all other adults has risen over that period, while the level for children has fallen back to where it was 25 years ago. Pensioners Children Working-age with children Working-age without children /97 Proportion of people in poverty After Housing Costs (per cent) 1999/ 22/3 25/6 28/9 211/12 Source: Family Resources Survey and Households Below Average Income, DWP, via the IFS; the data is for Great Britain to 21/2 and for the UK thereafter Indicator: 2B Since the early 199s, the total number of people in poverty has barely changed, but within that number the mix of pensioners, working-age adults and children has changed a lot. Pensioners Working-age without children Working-age with children Children People in poverty After Housing Costs (millions) /2 211/12 Source: Family Resources Survey and Households Below Average Income, DWP, via IFS; the data is for the UK The first graph shows the proportion of people of different age groups in poverty over the last three decades. The second graph shows the number at four points in time. In both, poverty is measured after housing costs have been deducted. In the second graph, the numbers in 1982, 1991 and 21/2 are originally for Great Britain, and uplifted by 3 per cent to cover the whole UK. Monitoring poverty and social exclusion
23 Chapter 1 Income and low income 3 The child poverty targets Progress in reducing child poverty stalled in the middle of the last decade. In recent years, the deterioration in average incomes means fewer children are in relative poverty, but more are in absolute poverty. The first graph shows the medium term trends in child poverty, on three of the measures used in the Child Poverty Act. On all measures, child poverty is slightly lower than five or ten years ago, and much lower than fifteen years ago. The changes in the last two years, while small, are worth closer inspection. Relative child poverty fell from 22 per cent in 28/9 to 17 per cent in 21/11, and then remained unchanged in the most recent year. The fall on the absolute measure was lower, however, and in 211/12, the proportion of children in poverty on this measure actually rose. What this means is that between the start of the recession and 21/11, the incomes of families with children at the bottom of the distribution rose both relative to the average and relative to previous years. In the last year, however, these incomes fell compared with the year before, but at the same rate as the fall in median incomes. It is interesting to note that the proportion of children who are materially deprived has fallen in the last two years. In 211/12, this figure stood at 12 per cent, down from 17 per cent three years earlier. This is a bigger fall than the low-income measure, implying that fewer children than previously are going without these everyday items. The second graph unpacks the material deprivation measure a little more. The everyday items are divided into items for children and items for adults. Children are much less likely to go without everyday items for reasons of cost than their parents. Essentially, parents prioritise their children s needs above their own. No more than 18 per cent of children in households in the bottom fifth of the income distribution go without any of the seven items we can analyse for reasons of cost. This is lower than any adult item. Fewer children in lower income households now lack everyday items for reasons of cost than six years ago. This is true for all seven items, from sports equipment, to school trips, for which we can make comparisons over time. Adults in lower income households, however, are now more likely to lack seven of the eight items for which we can make comparisons. 18 Monitoring poverty and social exclusion 213
24 Income and low income The child poverty targets Chapter 1 Indicator: 3A As average incomes fell in the last year, child poverty rose on the fixed measure and fell on the relative measure. 6% of contemporary median 6% of 21/11 Low income and material deprivation Persistent poverty / / / / 2/1 21/2 22/3 23/4 24/5 25/6 Proportion of children below relevant income thresholds (per cent) 26/7 27/8 28/9 29/1 21/11 211/12 Source: Households Below Average Income, DWP publication and IFS analysis; the data is for Great Britain to 22/3 and for the UK thereafter Indicator: 3B In the last six years, children in low-income families have become less likely to lack everyday items for reasons of cost. Parents in low income families have become more likely to lack such items. 25/6 Bottom quintile 211/12 Bottom quintile Middle quintile 211/12 Enough bedrooms for every child 1 years or over and of a different gender Have friends round for tea or a snack once a fortnight Leisure equipment such as sports equipment or a bicycle Hobby or leisure activity Go on a school trip at least once a term Go to a playgroup at least once a week Celebrations on special occasions Money to decorate home Holiday away from home one week a year not with relatives Home contents insurance Make savings of 1 a month or more Replace worn out furniture Replace broken electrical goods Money to spend on self each week Keep house warm Proportion of people who are materially deprived (per cent) Children go without Adults go without Source: Households Below Average Income, DWP; the data is for the UK The first graph shows the proportion of people in poverty on each of the four measures included in the 21 Child Poverty Act relative low income, absolute low income, persistent poverty and low income and material deprivation. Data for the latter two measures are not available for the full-time series. The second graph concerns material deprivation, the measure of which is based on a series of questions on whether families have a range of everyday items and if not, whether this is for reasons of choice or cost. These items are both child items and adult items though in reality many of the latter are actually items for the whole household. Some of the actual items making up the score have changed over time; comparison is only made for those items that have been included throughout. Monitoring poverty and social exclusion
25 Chapter 1 Income and low income 4 Poverty before and after housing costs The choice of poverty measure matters poverty is higher on the after housing costs measure, and the gap between the two measures is the widest it has been in a decade. The poverty rate for the whole population was 21 per cent measured after housing costs (AHC) and 16 per cent measured before housing costs (BHC) are deducted. This gap of 5 percentage points is the highest it has been for a decade, and has been growing, although slowly, since the middle of the last decade. The BHC measure is used in the child poverty target, and is the measure generally used for international comparisons. But the way the two measures have grown apart are a cause for concern, suggesting some changes in the nature of poverty. Indicator 4A shows how housing costs have grown for low-income households and the growing gap between the two measures suggests a growing impact of housing costs on poverty. It is not, though, a change the BHC measure can pick up. Given that housing costs are unavoidable, and difficult to lower in the immediate term, a poverty measure that cannot reflect the way they are rising relative to incomes is increasingly limited. We prefer the AHC measure and use it throughout this report as it better reflects the reality of low income, especially when housing costs rise. The second reason for preferring the AHC measure is that the BHC measure includes housing benefits as household income. In reality, housing benefits go to the landlord, not the tenant they can only be spent on rent. The second graph shows the breakdown of people in poverty on the two measures. It also shows whether or not they were in a family receiving housing benefits. In 21/11, there were 9.8 million people in poverty on the BHC measure. Only 1 million of these were not also in poverty on the AHC measure. Around 13 million people were in poverty in the AHC measure, of which 4.2 million were not in poverty on the BHC measure. So around one-third of those in poverty AHC were not in poverty BHC. Included in this 4.2 million are 2 million people in families receiving housing benefits. This benefit would have been counted as income on the BHC measure, helping raise that family s income above the BHC poverty threshold. 2 Monitoring poverty and social exclusion 213
26 Income and low income Poverty before and after housing costs Chapter 1 Indicator: 4A More people are in poverty when measured AHC than BHC. The gap between the two measures is at its widest for over a decade. In poverty After Housing Costs In poverty Before Housing Costs Proportion of people in poverty on different measures (per cent) / / / / 2/1 21/2 22/3 23/4 24/5 25/6 26/7 27/8 28/9 29/1 21/11 211/12 Source: Households Below Average Income, DWP; the data is for the UK Indicator: 4B Most people in poverty are in poverty on both the AHC and BHC measures. Housing benefit payments contribute to two million people being in poverty on the AHC but not the BHC basis. In poverty only after housing costs (AHC) In poverty both before and after housing costs In poverty only before housing costs (BHC) No HB 2.2m Receiving HB 2.m No HB 6.4m Receiving HB 2.4m No HB 1.m 13 million people in poverty AHC 9.8 million people in poverty BHC Source: Households Below Average Income, DWP; the data is for 21/11, for the UK The first graph shows the proportion of people in poverty i.e. those living in households below 6 per cent of the contemporary median household income. It compares the poverty rate for two different measures of income, after housing costs and before housing costs. Income is disposable household income either before housing costs or after housing costs. All data is equivalised (adjusted) to account for differences in household size and composition. The second graph shows the number of people that are in each of the following three groups: in AHC poverty and not BHC poverty, in BHC poverty and not AHC poverty and in both AHC and BHC poverty. Households are further broken down to show whether or not they receive housing benefits. The housing benefits received need not necessarily completely cover a household s housing costs. Monitoring poverty and social exclusion
27 Chapter 1 Income and low income 5 Food costs and food banks Prices of food have risen faster than the rate of inflation over the last decade but utility bills have risen more quickly. Food banks, providing free food to people on low incomes, get almost half of their referrals due to changes or faults in the benefit system. Between 22 and 212, the consumer price index (CPI) rose by 29 per cent. That means that on average consumer items cost just under one-third more in 212 than 22. Within this average, though, there is substantial variation between different items. The largest rise in prices comes from utility bills and transport. Over that decade, the cost of electricity, gas and other fuels more than doubled, rising by 14 per cent. Domestic water charges rose by 69 per cent. The cost of personal transport (not including the purchase cost of vehicles) rose by 71 per cent, while the cost of public transport rose by 87 per cent. So over the last decade, public transport became more expensive relative to private transport. The costs of food also rose faster than inflation, but this change happened only in the last five years. So until 27, food prices were rising with CPI inflation. Since then, food prices have risen more quickly, meaning that in total they are 41 per cent higher than in 22. But even over the last five years, fuel bills and transport costs have increased by more than food prices. The cost of food and the number of people using food banks has become one of the most powerful stories of the current period of austerity. Making comparisons of people using food banks over time is not easy, as there simply are more food banks now than five years ago. They may well be meeting need that was previously going unmet. But looking at why people use food banks is instructive, as it tells us about the reasons people lack money. The Trussell Trust runs a network of food banks, to which statutory agencies refer people in need and the reasons for those referrals are recorded. Almost half of referrals come because of the operation of the benefits system either due to a delay in payment (3 per cent) or a change in the amount paid (15 per cent). Clearly there have been many changes to the benefits system in recent years, but it is interesting to note that, in 212/13 at least, delays in the system were responsible for twice as many referrals as the changes. 22 Monitoring poverty and social exclusion 213
28 Income and low income Food costs and food banks Chapter 1 Indicator: 5A Over the last decade the cost of utilities and transport has risen much faster than the overall rate of consumer price inflation. Electricity, gas and other fuels Water supply and miscellaneous services for the dwelling Personal transport Transport services Actual rentals for housing CPI (overall index) Food and non-alcoholic beverages Clothing and footwear Increase in prices since 22 (per cent) Source: Consumer Price Inflation Indices, ONS; the data is for the UK Indicator: 5B Almost half of referrals to food banks are related to benefit delays or changes. Other 23% Benefit delays 3% Unemployment 4% Debt 1% Benefit changes 15% Low income 18% Source: Trussell Trust; the data is for 212/13 The first graph shows how the prices of a range of essential goods have risen since 22. The goods shown are a selection of the overall Consumer Prices Index, which is also shown. For reasons of space, not all the components of the index are included. The second graph shows the reasons given for referrals to food banks run by the Trussell Trust. The Trust provides food to people who have been referred by a statutory agency or care professional such as a doctor or teacher. The reasons for referral are recorded as shown in this graph. Monitoring poverty and social exclusion
29 Chapter 1 Income and low income 6 The Minimum Income Standard (MIS) Income sufficient for a family to be deemed not in poverty is increasingly unable to provide a minimum standard of living. Levels of means-tested benefits leave working-age families having to go without some items considered essential in order to afford other items. In 212, the poverty threshold for single adults and couples with children was around one-third lower than the minimum income standard (MIS) for those groups. For a lone parent, it was lower still, at 37 per cent. Three years ago, the poverty threshold was 2 per cent lower than the MIS for all three groups, so a poverty-level income is even less sufficient now than three years ago. For pensioners, the situation is somewhat different. Pensioners themselves think that they need a lower income to attain the minimum standard than working-age adults do. As a result, the MIS for pensioners is below the poverty threshold a poverty level income is deemed sufficient to attain a minimum standard of living for a pensioner couple. However, whereas the threshold was 12 per cent above the MIS in 28/9, by 211/12 it was only 6 per cent above. The MIS is made up of different categories of goods and services. The second graph looks at how far means-tested benefits cover these items, and the extent to which some of them are affordable only by forgoing others. Pensioner couples reliant on means-tested benefits have sufficient income to afford all the items that comprise their MIS. This is both because their benefits are more generous (see indicator 27 on values of benefits) and because their MIS is lower. Working-age families reliant on out-of-work benefits can only afford part of their MIS. Out-of-work benefits for single working-age adults cover only 38 per cent of the MIS. For couples with children and lone parents, this figure is 58 per cent and 57 per cent respectively. This means that single working-age adults on means-tested benefits can only afford the minimum required amount of food, water and fuel by forgoing all the other items that comprise the MIS. In reality, people may choose not to prioritise in this way, going without some food items in order to afford, for example, some clothing items. But items considered an essential part of modern life are only affordable by forgoing other, equally essential items. 24 Monitoring poverty and social exclusion 213
30 Income and low income The Minimum Income Standard (MIS) Chapter 1 Indicator: 6A The poverty line for working-age families is at least 3 per cent lower than the minimum income standard. This shortfall has grown in recent years. 28/9 211/12 Gap between the poverty line and the Minimum Income Standard for each family type (per cent) Pensioner couple Single adults Couple with 2 children Lone parent with 1 child Source: A Minimum Income Standard for the UK in 212, JRF; the data is for the UK Indicator: 6B Out-of-work benefits for single adults are only sufficient for the essential costs of food, fuel and water rates. For families with children, benefits are also sufficient for clothing and some goods and services, but not social participation. Alcohol Social and cultural participation Household goods and services Clothing Personal goods and services Fuel Travel costs Water rates Food Benefits as % of Minimum Income Standard Proportion of Minimum Income Standard covered by the poverty threshold and means-tested benefits for each group (per cent) Pensioner couple Working-age single Couple, 2 children Lone parent, 1 child Source: A Minimum Income Standard for the UK in 212, JRF, and Households Below Average Income, DWP; the data is for 211/12 for the UK The first graph shows the difference between the Minimum Income Standard (MIS) and the poverty threshold, as a proportion of the poverty threshold for different family types. The second graph is based on NPI analysis of MIS the income needed to reach a minimum socially acceptable standard of living. Individual items deemed necessary are costed and grouped into categories for the analysis. The categories are food; alcohol; clothing; water rates; household insurance, household goods and other housing goods (which we group together as household goods and services); personal goods and services; travel costs; social and cultural participation. Childcare and Council Tax are not included in the analysis. The graph implies a hierarchy of categories with food considered to be the most important. This is not the approach taken in the MIS report, which considers the total to be the minimum standard. Research forming part of the MIS project does show, however, that low income households spend a greater proportion of their income on food than other households do, indicating that food is given a priority. Monitoring poverty and social exclusion
31 Chapter 1 Income and low income 7 In-work poverty For the first time on record, the majority of people in poverty are in working families. Two-thirds of adults in these families are in work. In 211/12, there were around 13 million people in poverty in the UK. Of these, around 6.7 million were in a family where someone worked. The remaining 6.3 million were in workless working-age families or families where the adults were retired. This is the first time in the history of this data series where in-work poverty has made up the majority of poverty. This change is a result of both falling workless poverty and rising in-work poverty. Going back 15 years, in-work poverty was only one-third of all poverty in Britain. Around 5.1 million people lived in low-income, working families and 9.3 million lived in low-income workless or retired families. Since then, the number of people in workless poverty has fallen by 3 million, and the number in working poverty has risen by 1.6 million. What is noticeable about in-work poverty is how it began to rise around 23/4, after being fairly static for the previous five or so years. We saw earlier that overall poverty fell until this point, with progress much slower thereafter. It was this rise in poverty in working families that halted the progress in reducing poverty overall. The fall in poverty among those in workless and retired families is obviously related to the fall in pensioner poverty. But even among workless, working-age families, the proportion of people in poverty has fallen over the last 15 years. In 1996/97 7 per cent of people in workless working-age families were in poverty. Today, that figure is 6 per cent. The second graph looks more closely at the population of children and working-age adults living in low-income working families. In 21/11 there were 2 million children living in low-income working families. Around one-fifth (41,) lived in a family where all the adults were working full-time. The majority lived in a family where one adult was not working, or the only work was part-time. Among working-age adults in low-income working families, three-quarters (3 million working-age adults) are themselves in work. The remaining quarter (1.1 million) are not themselves working but live with a working partner. 26 Monitoring poverty and social exclusion 213
32 Income and low income In-work poverty Chapter 1 Indicator: 7A There are now more people in poverty in working families than in workless or retired families combined. Workless working-age or retired Working 1996/ / /99 People in low-income households After Housing Costs (millions) / 2/1 21/2 22/3 23/4 24/5 25/6 26/7 27/8 28/9 29/1 21/11 211/12 Source: Households Below Average Income, DWP; the data is for the UK Indicator: 7B Around three quarters of working-age adults in low-income working families are themselves in paid work. Children in full-working families 41, Children in part-working families 1,6, Working adults 3,6, Adults not working but with a working partner 1,1, Source: Family Resources Survey, DWP; the data is for 21/11 for the UK The first graph shows the numbers of people in poverty (after housing costs) who live in working and workless or retired families. A family is classed as working if any adult member is in paid work, full-time or part-time, including self-employment. The figures shown are totals, including children, working-age adults and pensioners. The second graph shows the breakdown of working-age adults and children in low-income working families. Due to data availability it covers 21/11, whereas 7A covers 211/12. Monitoring poverty and social exclusion
33 Chapter 1 Income and low income 8 Disability and poverty Families that include disabled people are more likely to be in poverty than other families, although the proportion in poverty has declined over the last decade. But the inclusion of particular disability benefits as income artificially lowers this poverty rate. In 211/12, 24 per cent of people in families with a disabled person were in poverty. This is the same as the year before, and compares with 3 per cent a decade ago. Around 2 per cent of people in families with no disabled person are in poverty, so there is a 4 percentage point gap between families with and without disabled people. This is the lowest gap in the 15 years that this statistic has been published. We can further analyse poverty among disabled people and their families by looking at whether or not they receive a disability-related benefit. In families that do not receive a disability benefit, 28 per cent of people are in poverty. In families that do, 14 per cent are in poverty. So families with a disabled person who receive a disability-related benefit are less likely to be in poverty than the national average. To a certain extent this is understandable this group by definition receives an income that other families do not. But it is also misleading. Disability Living Allowance (DLA) and Attendance Allowance (AA) are intended to meet the specific costs of disabilities so the incomes of these families are higher because their costs are higher. In that regard, the poverty rate for disabled people may be underestimated. The second graph removes DLA and AA from household income, to further analyse this impact. DLA and AA are paid to almost 5 million people; a large enough number to raise the national median income. When analysing poverty rates with and without DLA and AA, the median is adjusted to account for this. The effect of removing DLA and AA from incomes is to double the number of people in poverty who receive these benefits. For children, the number rises to 39, from 24,. For working-age adults there is an increase from 73, to 1,3,. The largest proportional increase is for pensioners, where the number in poverty trebles, from 18, to 56,. 28 Monitoring poverty and social exclusion 213
34 Income and low income Disability and poverty Chapter 1 Indicator: 8A The proportion of people living in a family with a disabled person who lives in poverty has fallen in the last decade. While still lower, the proportion of people in families with no disabled person who live in poverty has not changed. People in families where someone is disabled and not in receipt of disability benefits People in families where someone is disabled People in families where no one is disabled People in families where someone is disabled and in receipt of disability benefits Proportion of people in poverty after housing costs (per cent) / / / / 2/1 21/2 22/3 23/4 24/5 25/6 26/7 27/8 28/9 29/1 21/11 211/12 Source: Households Below Average Income, DWP, 211/12; the data is for the UK Indicator: 8B The number of people in poverty living in a household receiving Disability Living Allowance or Attendance Allowance would be around double if these benefits were not counted as income. Including DLA and AA Excluding DLA and AA Number of people in households receiving DLA or AA who are or would be in poverty (thousands) 1,4 1,2 1, Children Pensioners Working-age adults Source: Family Resources Survey 28/9 to 21/11; the data is for the UK The first graph shows the proportion of people in poverty according to whether they live with a disabled person. It is not in itself a measure of the number of disabled people in poverty. Those who do live with a disabled person are further broken down by families receiving disability-related benefits and families that receive no such benefit. The second graph looks at the effects of these benefits in lifting people out of poverty. The graph shows the number of people in poverty who live in families receiving Disability Living Allowance or Attendance Allowance, two benefits that are intended to meet the costs of disability. It then looks at how many would be in poverty if they did not receive these benefits. In the calculation, these benefits are deducted from the families incomes. Doing so actually lowers the national median income, so a new poverty threshold is calculated at 6 per cent of this new median. The second set of columns in the graph shows the number of people below this new threshold. Monitoring poverty and social exclusion
35 Chapter 1 Income and low income 9 Child poverty in local areas While scattered across the country, child poverty is clearly concentrated in urban areas. This is the case for urban areas of all sizes. The lowest levels of child poverty can typically be found in rural areas. The map of child poverty across the UK shows a very high proportion of children in poverty in the major cities. Manchester, Liverpool, Glasgow, Newcastle and parts of London are all in the ten areas with the highest rates of poverty. Tower Hamlets in East London has the highest rate of child poverty in the country, at 42 per cent, ahead of Manchester at 38 per cent. Not all of the areas with high levels of poverty are big cities, however. Blaenau Gwent has the highest level in Wales, and places such as Strabane, Hastings and Redcar are also in the 3 areas with the highest rates. So poverty is not just a problem for large urban areas so much as urban areas of all sizes. The areas with the lowest levels of poverty are similarly scattered across the country. Richmond upon Thames, Harrogate, the Shetland Isles and Rutland are all in the 2 areas with the lowest levels of child poverty. The map shows the proportion of children in poverty in each local authority in the UK. It is based on numbers calculated for End Child Poverty. This is based on local estimates from 21 published by HMRC. These figures draw together data on out-of-work and in-work benefits. Those children in families receiving out-of-work benefits are considered to be in poverty, as are those in families receiving in-work benefits where household income is still below 6 per cent of the national median. These figures are then adjusted for changes in the labour market since 21. More up-to-date data, from mid-212, on the number of children in working and workless households is used to adjust the totals in each region. These changes are then applied to the local level data. 3 Monitoring poverty and social exclusion 213


36 Income and low income Child poverty in local areas Chapter 1 Indicator: 9 Orkney Islands Shetland Islands Greater London 3% and over 25% 29% 2% 24% 15% 19% Less than 15% Source: End Child Poverty Monitoring poverty and social exclusion
37 Chapter 1 Income and low income Commentary When last year s report was written, the Department for Work and Pensions was in the middle of a consultation on a better measure of child poverty. At the time of writing, nothing has emerged from the consultation and it s not clear whether there will be a new measure. In the meantime, the most recent set of poverty statistics shows a fall in relative poverty, at the same time as an unprecedented drop in median incomes. The two are related, and the change casts doubt on the usefulness of a relative measure when medians are falling. These doubts are legitimate, and we believe the relative measure should be used in conjunction with some fixed measure until such time as average incomes start to rise again. As the relative figures for poverty are seen as unreliable, or missing an important point, so other concepts have emerged that try and capture the experiences of those on low incomes. One of these is food poverty, the inability to afford, or to have access to, food to make up a healthy diet. It is obviously a powerful concept, and it s true that many people, and many more people than five years ago, are struggling to make ends meet. Costs of essentials have risen in recent years, and incomes have not. Food prices may have risen less steeply than utility prices, but a rise of one quarter in four years will still make an impact. But this does not mean that there is something called food poverty that is distinct from poverty. In fact the inability to afford items as essential as food is the essence of poverty. The reason people cannot afford food, or have to rely on food banks to provide it, is because their incomes are low. The reasons people are referred to food banks delays in benefits, cuts in benefits are about falling incomes. Rising food prices compound the problem, but poverty would exist anyway. The recent focus by bloggers, newspapers and celebrity chefs on how to eat for less is probably welcome money-saving tips always are, regardless of income. But the Minimum Income Standard shows that it s not just food that is considered an essential item there is also clothing, transport, utility bills and rent. If people cannot afford to eat, then they surely cannot afford the other items either. And this is what is called poverty. 32 Monitoring poverty and social exclusion 213
38 Chapter 2 Work Introduction 34 Choice of indicators 35 1 Underemployment Unemployment by age Disability and the labour market 4 13 Workless households Low pay Pay inequalities Low pay and household income In-work training 5 18 Insecure work Unemployment by local authority 54 Commentary 56
39 Chapter 2 Work Introduction The unemployment rate is the most cited labour market statistic. Although it does not convey the entire experience of the labour market, it is worth comparing it with previous recessions. Unemployment did not increase as much in the 28 recession as in previous downturns. Recession Unemployment rate Unemployment rate (per cent of labour force) Source: Labour Market Statistics, ONS; the data is for the UK The unemployment rate reached around 8 per cent following the recession that began in 28. This compares to more than 1 per cent for the early 199s recession and almost 12 per cent in the early 198s recession. However, the number of people becoming unemployed during the recession was higher in 28 than in the previous cases as a result of population growth. Another difference is that the unemployment rate has not continued to increase quite so drastically after the economy has returned to growth as it did in the 198s and 199s. Immediately before the 198 recession the unemployment rate was 5.5 per cent. The economy did not return to that level of the unemployment until the middle of 2: that is, more than 2 years later. It then stayed at or below this level for more than eight years, before the current financial crisis began. The unemployment rate in this recession is comparatively low. However, a corollary of this is that labour market problems are manifesting themselves in different ways: falling real wages, underemployment, and insecure working arrangements. The rest of this chapter examines these issues in more detail. 34 Monitoring poverty and social exclusion 213
40 Work Choice of indicators The precise nature of work and labour market disadvantage is important from a poverty perspective, particularly given that most people in poverty are now in working families (see Chapter 1 Income and Low Income). The first indicator looks at underemployment, which measures those who want to work or want to work more. This includes the unemployed, those who are not immediately available for or actively looking for work but would like it, and those working part-time who want full-time work. The economic downturn has had an uneven affect across age groups, with unemployment for young adults substantially higher than for older adults. Those with disabilities also face disadvantages in the labour market, with higher rates of worklessness and lower rates of pay than non-disabled people with the same level of qualifications. Poverty is measured on the basis of household income, so the level of workless households is an important indicator. However, those in work may be in poverty as a result of working too few hours or having low pay which is another indicator. There are also pay inequalities between genders and those working part-time and full-time. Another indicator looks at how low pay determines household income given the existence of other factors, such as in-work support in the social security system. For poverty to be temporary rather than a permanent part of people s lives, they may need in-work progression to obtain, for example, better hours, job security and satisfaction. Part of this is reliant on in-work training. Finally, the chapter looks at elements of insecurity in the labour market, such as zero-hours and temporary contracts. Chapter 2 Monitoring poverty and social exclusion
41 Chapter 2 Work 1 Underemployment Underemployment has fallen slightly in 213 but remains above 28 levels. The number in part-time work wanting full-time work continues to increase. Underemployment refers to everyone who is not working as much as they want to, not just those who are unemployed. As such, it also includes those working part-time because they could not get full-time work, and those who are not actively looking or available for work but would like it. The number of underemployed people in the UK in the first half of 213 was 6.2 million. This was lower than the year before by around 63, people; the first fall since 23. Of the 6.2 million underemployed, 4 per cent were unemployed (2.5 million), 37 per cent were not in the labour market (2.3 million) and the remaining 23 per cent were working part-time but wanting full-time work (1.4 million). This is a different pattern to 1 or 2 years before. In 23, more than half the underemployed were inactive but wanting work (52 per cent), 35 per cent were unemployed and 13 per cent wanted full-time work. Most of the increase in underemployment since the start of the recession in 28 has come from unemployment and people working part-time who want but can t get full-time work. The number of those wanting but lacking work has increased only slightly. Since 28, the number of people unemployed has increased by 73, (35, women and 39, men); the number of inactive people wanting work has increased by 9, (3, men and 6, women); and there are 7, more part-time workers wanting full-time work (34, men and 37, women). The smaller increase in inactive people wanting work may be as a result of reforms which encourage inactive people to join the labour force; that is, become employed or unemployed rather than inactive. Total underemployment for women is slightly higher than for men at 3.2 million compared with just over 3 million. Within this, male unemployment was higher than female unemployment by 36, in the first half of 213. The number of women lacking but wanting work was 41, higher than for men, and women working part-time but wanting full-time work was 13, higher than for men. All three types have increased for both genders when compared with both 23 and 28. However the increase has been smaller among the inactive population, growing by 4, for men and 5, for women over ten years. 36 Monitoring poverty and social exclusion 213
42 Work Underemployment Chapter 2 Indicator: 1A Underemployment has fallen since 212 but remains at historically high levels. Part-time wanting full-time job Lacking but wanting work Unemployed Number of adults in each group (millions) H1 Source: Labour Market Statistics, ONS; the data is for the UK Indicator: 1B Underemployment for both men and women has increased due to higher unemployment and numbers in part-time work wanting full-time work Number of adults in each group (millions) Male Unemployment Female Male Female Male Female Male Female Lacking but wanting Part-time but wanting full-time Total Source: Labour Market Statistics, ONS; the data is for the UK The first graph shows the number of people either unemployed, lacking but wanting work, or working part-time but wanting a full-time job. The figures for each year are the average of the four quarters, with the exception of 213, where it is the average of the first two quarters. The second graph shows the gender breakdown of the three constituent components of underemployment. It compares the number of men and women in each group in 23, 28, and 213. Monitoring poverty and social exclusion
43 Chapter 2 Work 11 Unemployment by age The unemployment rate for young adults increased by 7 percentage points between 27 and 212, during which time the number of unemployed 18 to 25-year-olds increased by 29,. The unemployment rate for adults aged was 21 per cent in the first half of 213, compared with 6 per cent for those aged between 25 and 64. These figures are almost exactly the same as the two previous years (unemployment for those aged is down.2 per cent from 211, for 16- to 24-year-olds down.1 per cent). This compares with 14 per cent and 4 per cent respectively in 27 before the onset of recession. However, even before then unemployment for under-25s was increasing, from around 12 per cent in 24. The unemployment rate for young adults has been higher than for those over 25 every year for which there is data. However, the gap between the unemployment rates for under- and over-25s has increased compared with the early 199s. In 1992, the under-25s unemployment rate at 17 per cent was around twice as high as the over-25s unemployment rate at 9 per cent. In the first half of 213, it is almost four times higher. Changes in the number of employed and unemployed adults between 27 and 212 have been different for different age groups. Those over 65 are something of an exception: their unemployment rates are low because they can retire and leave the labour market. The young adult unemployment problem is reflected by the fall of more than 5, people under 25 in work and the 29, increase in unemployment. However, many of those in this age group in 27 will be in the next age cohort of 25- to 34-year-olds by 212. There are almost 44, more people aged in employment, though unemployment is also up almost 25, for this group. Those aged 5 64 are in a similar position, with an increase in both the number in employment (up 43,) and unemployment (up 15,). The change for those aged is similar to the under-25s: employment has fallen (by 36,) and unemployment has increased (by 2,). 38 Monitoring poverty and social exclusion 213
44 Work Unemployment by age Chapter 2 Indicator: 11A Youth unemployment is more than three times as high as that for older adults but after rising sharply for several years has changed little in the last two years. Aged 16 to 24 Aged 25 to 64 Proportion of economically active adults who are unemployed (per cent) Source: Labour Market Statistics, ONS; the data is for the UK Indicator: 11B Employed Unemployed Change in levels between 27 and 212 (thousands) Those aged and have seen the largest decreases in employment. 1, Total Source: Labour Market Statistics, ONS; the data is for the UK The first graph shows the unemployment rate for those aged and those aged This is the number of unemployed people as a proportion of the economically active (those either employed or unemployed). The second graph shows the changes in the number of people employed and unemployed by age group between 27 and 212. The figures are an average of the four quarters of data for both years. A total of all age groups is also shown. Monitoring poverty and social exclusion
45 Chapter 2 Work 12 Disability and the labour market Disabled people have higher rates of worklessness than non-disabled people although the gap has been getting smaller. They are also more likely to be low paid when in work. The proportion of disabled men and women that are workless (either unemployed or economically inactive) is around twice the rate of worklessness for non-disabled men and women. In the first half of 213, around 48 per cent of both disabled working-age men and women were workless. For non-disabled men and women, the proportions were 19 per cent and 26 per cent respectively. Over the last 15 years, the general trend has been for worklessness rates among disabled men and women to fall. However, figures before and after 21 are not strictly comparable due to a change in the way information on disability was collected. Worklessness rates for disabled men and women fell between 1998 and 29 from 54 per cent to 49 per cent for men and 58 per cent to 51 per cent for women. Over the same period the rate of worklessness remained around 26 per cent for non-disabled women and increased for non-disabled men from 14 per cent to 18 per cent. Between 211 and 213, all four groups have seen small decreases in worklessness. Levels of worklessness among disabled people have improved relative to non-disabled people, but still remain substantially higher. This remains the case even when qualifications are considered. Among disabled people who have a Level 3 qualification (equivalent to two A Levels or higher) 14 per cent are lacking work but wanting work. For non-disabled people with at least a Level 3 qualification, the figure is only 6 per cent. The disparity between disabled and non-disabled people is more striking for those without a Level 3 qualification, with 26 per cent of disabled people wanting but lacking work compared with 12 per cent for non-disabled people. Some degree of labour market disadvantage is apparent among disabled people in work as well. 16 per cent of disabled people in work who have at least a Level 3 qualification are low paid, compared with a slightly smaller figure of 13 per cent for non-disabled people. The gap is again larger between those without a Level 3 qualification 41 per cent of disabled people in work lacking this qualification level are low paid, compared with 35 per cent of non-disabled people. 4 Monitoring poverty and social exclusion 213
46 Work Disability and the labour market Chapter 2 Indicator: 12A A greater proportion of both men and women with disabilities are workless compared with those without disabilities. Women with a disability Men with a disability Women without a disability Men without a disability Proportion of people aged 16 to 59/64 not working (per cent) Source: Labour Market Statistics, ONS; the data is for the UK Indicator: 12B Disabled adults are more likely to be lacking but wanting work or to be low-paid compared with non-disabled people of the same qualification level. With Level 3 qualification Without Level 3 qualification Proportion of year-olds (per cent) Disabled Not disabled Disabled Not disabled Lacking but wanting work (as a proportion of all in group) Low-paid (as a proportion of all working in group) Source: Labour Force Survey, ONS; the data is an average for for the UK The first graph shows the proportion of men aged and women aged not working between 1998 and 213. The data is shown by gender and disability status. There was a change in the disability definition in 21 that means comparisons before and after should be treated with caution. The second graph shows the proportion of people who are lacking but wanting work and the proportion of working people who are paid less than the UK living wage (deflated by earnings for earlier years). The data is shown separately by disability status and qualification level (with or without a Level 3 qualification). The data is an average for the twelve quarters People lacking but wanting work include those defined as unemployed and those that are economically inactive but want work. The age limit of was used in the second graph to limit the distortions that the low incidence of disability among younger adults and the high incidence in older age groups can cause. Monitoring poverty and social exclusion
47 Chapter 2 Work 13 Workless households Only a small minority of workless households are households where no adult has ever worked, and over half of people in never-worked households are aged under-25. In 213, around 17 per cent of households were workless meaning that none of the working-age adults were in work. This is the lowest proportion of workless households since 1996, when the data series started. Within this 17 per cent, 8 per cent (or 1.5 per cent of all households) were households where no members had ever worked. The proportion of workless households has generally been falling since 1996, when around 21 per cent of households were workless (and 1 per cent had never worked). There was a rise in workless households around 29 as the recession began. Between 28 and 21, the proportion of households that were workless increased from around 17 per cent to 19 per cent, before falling again. Other evidence suggests that workless households were less common in previous decades: for example, in The Labour Market Under New Labour, Dickens, Gregg and Wadsworth (LSE, 23) found only 6.5 per cent of households in 1975 were workless once students and retirees were excluded ( In 213, for the first time in this series of statistics, the total number of households actually fell. This is partly due to greater numbers of children choosing to remain with their parents rather than move out. For example, the number of lone parent households with non-dependent children grew by 39,, and the number of one person households fell by more than 13,. This by itself may explain some of the fall in workless households. People who live in households where no adult has ever worked tend to be much younger than workless households where someone has worked previously. 55 per cent of those people in never-worked households are under 25, compared with 13 per cent in currently workless households. In currently workless households, 54 per cent are over the age of 5, compared with 9 per cent in never-worked households. This largely reflects patterns of study, sickness and disability. Statistics from the workless households data release show that 48 per cent of people living in households where no one has ever worked are students, while in currently workless households, 31 per cent are not working because of illness or disability. 42 Monitoring poverty and social exclusion 213
48 Work Workless households Chapter 2 Indicator: 13A The proportion of working-age households that are workless is lower than at any other time in the series, having fallen for three consecutive years. Households where no adult has ever worked Other currently workless households Proportion of working-age households (per cent) Source: ONS; the data is for the UK Indicator: 13B The majority of people in households where no one has ever worked are under 25; the majority in other workless households are over Proportion of all working-age adults in each type of household (per cent) Households where all members have never worked Currently workless but has worked Source: Labour Force Survey, ONS; the data is for the UK The first graph shows the proportion of households that have at least one working-age member that have no working adult member. They are divided into those where no one has ever worked and those where at least one adult has worked. The second graph shows the number of people in workless households by age. It is divided into those where no one has ever worked and those where at least one adult has worked. The currently workless but has worked figures are the total workless with the never worked subtracted. The data for both graphs comes from the ONS publication Working and Workless Households. A household is counted as workless if none of the working-age members are in work. A household is classed as never having worked if none of the working-age members has ever worked. Monitoring poverty and social exclusion
49 Chapter 2 Work 14 Low pay The proportion of low-paid jobs increased in 212, with two-fifths of them being done by the under 3s. In 212, around 27 per cent of female employees and around 15 per cent of male employees were paid below the UK living wage of 7.45 an hour. This represents an increase on the previous year for women and no change for men. This is the first increase in the proportion of low-paid women since the data series began in 21. Over the decade, the proportion of low-paid female employees has fallen steeply, from more than 35 per cent in 21 to below 25 per cent in 211, before increasing again. The changes for male employees are not as striking; the proportion who are low paid fell from 17 per cent in 21 to a low of 13 per cent in 27, before increasing again to around 15 per cent in 212. This may reflect changes in the minimum wage, which can have ripple effects up the pay distribution to maintain pay differentials in organisations. Between 21 and 24, when the low-paid numbers were falling, the minimum wage increased by 18 per cent. Between 29 and 212, it increased by 7 per cent. This marginal increase reflects concerns over the impact on employment levels of increasing the minimum wage. There were around 4.6 million low-paid jobs in the UK in 212; 1.8 million of them (39 per cent) were done by people aged under 3. Low-paid jobs have a different distribution across age groups. Low-paid jobs for those under 3 are predominantly in the hospitality sector, i.e. restaurants and hotels. The number of low-paid jobs in this sector declines as age increases. Low-paid jobs in the wholesale, retail and transport sectors are more evenly spread, but are still more concentrated amongst those under 3. Low-paid public sector jobs, on the other hand, are more heavily concentrated in older age groups, with 57 per cent (6,) held by employees over 4. Overall, 1.4 million low-paid jobs are in the wholesale, retail and transport sectors (3 per cent of all low-paid jobs), followed by the public sector, which accounts for a further 1 million (24 per cent). Only 43, (9 per cent) of low-paid jobs are in manufacturing, but this is slightly misleading as the overall employment in these sectors varies hugely. 44 Monitoring poverty and social exclusion 213
50 Work Low pay Chapter 2 Indicator: 14A The proportion of employees that are low paid is increasing again after falling in the first half of the last decade. Proportion of men that are low paid Proportion of women that are low paid Proportion of over 22s/over 21s who are paid below the living wage (or equivalent in earlier years) (per cent) Source: Annual Survey of Hours and Earnings, ONS; the data is for UK Indicator: 14B Low-paid jobs in wholesale, retail and transport are spread quite evenly across the age groups, but low-paid work in hotels and restaurants is concentrated among the under-3s. Public sector Hotels and restaurants Manufacturing IT, finance and other services Wholesale, retail, and transport Number of people paid below 7.45 per hour (thousands) 1,2 1, Source: Annual Survey of Hours and Earnings, ONS; the data is for the UK The first graph shows the proportion of men and women paid below a low pay threshold equivalent to 7.45 per hour in 212, deflated by economy-wide earnings for previous years was chosen as it is the 212 living wage for the UK. The data is for people aged 22 and over until 211, then those aged 21 and over. This follows the change to minimum wage legislation, where the full rate now covers 21-year-olds. This could make a difference to the findings, as younger people tend to be lower paid. For this reason, the columns for 211 and 212 are differently coloured. The second graph shows the number of people paid less than 7.45 an hour in 212 by age and industry Monitoring poverty and social exclusion
51 Chapter 2 Work 15 Pay inequalities Despite an overall improvement in the gender pay gap between 27 and 212, men and women across the distribution are paid less now in real terms than five years earlier. Female employees generally earn less than their male counterparts, with the disparity growing higher up the earnings distribution. In 212, full-time earnings at the 1th percentile (that is the level of pay required to earn more than the bottom 1 per cent earn) were 282 per week for men and 254 per week for women. This amounts to a gap of 28 a week. At the median, the gap becomes more pronounced at more than 66 a week ( 498 for men and 431 for women), before growing to a difference of 23 per week at the 9th percentile ( 1,54 for men compared with 824 for women). In the cases of all these groups, real earnings (earnings after inflation) increased in the five years from 22 to 27, but have since declined to just above their 22 levels. The changes have been different across genders and the earnings distribution. Between 22 and 27 all groups saw increases in real earnings; at the 1th percentile and median the increase was greater for women. At the 9th percentile the increase was greater for men at 14 than for women at 85. Much of these gains was subsequently lost between 27 and 212, as a consequence of below inflation pay increases in these years. Comparing 22 and 212, full-time female earners at all three points of the distribution saw a larger increase in real earnings compared with their male counterparts, suggesting a narrowing of the pay gap over time. There are also differences between part-time and full-time staff. There is almost no gender gap between male and female part-time workers at the 25th, median, or 75th percentiles of the earning distribution by hourly pay rates. In fact, female part-time employees at the 25th percentile and the median earn slightly more an hour than their male counterparts at 6.6 and 6.3 respectively. This is not the case among full-time workers; at all three of these points in the distribution men earn more per hour than women. 46 Monitoring poverty and social exclusion 213
52 Work Pay inequalities Chapter 2 Indicator: 15A After adjusting for inflation, full-time earnings are below their 27 levels and only slightly higher than Weekly earnings for full-time employees in 212 prices ( ) 1,2 1, Male 1th percentile Male median Male 9th percentile Female 1th percentile Female median Female 9th percentile Source: Annual Survey of Hours and Earnings, Consumer Price Inflation, ONS; the data is for the UK Indicator: 15B There is almost no hourly pay gap between male and female part-time workers, in contrast to full-time workers where men are paid more than women at all points in the distribution. 25th percentile Median 75th percentile Hourly pay excluding overtime for each group ( ) Male part-time workers Female part-time workers Male full-time workers Female full-time workers Source: Annual Survey of Hours and Earnings, ONS; the data is for the UK The first graph shows the gross weekly earnings of male and female full-time employees over time at the 1th, 5th (median), and 9th percentiles of each earnings distribution. The figures for 22 and 27 are adjusted for inflation using the Consumer Price Index from the ONS data tables in the Consumer Price Inflation publication. The second graph shows hourly pay at the 25th, 5th and 75th percentiles for men and women working full- and part-time. The data comes from the Annual Survey of Hours and Earnings via NOMIS. Monitoring poverty and social exclusion
53 Chapter 2 Work 16 Low pay and household income Being paid the living wage reduces the risk of being in poverty, but still two-fifths of adults in working families and in poverty were in families where the earner was paid over the living wage. On average between 28/9 and 21/11, there were 1.2 million adults paid below the living wage in the bottom 2 per cent of the household income distribution: roughly equivalent to the poverty line. This suggests that low pay alone does not guarantee poverty there are other factors, such as the amount of in-work benefits being received by the family, the income of the spouse, family size, and housing costs. It is also possible to work enough hours at low pay rates to avoid poverty. These factors together explain why, for example, there are around 1.7 million low-paid adults in the top 4 per cent of the income distribution. There are only 63, adults paid above the living wage in households in the bottom fifth of the income distribution, out of a total of 16 million paid above the living wage (4 per cent). This may be because being paid above the living wage correlates with other factors, such as working more hours, rather than specifically being lifted from poverty by higher pay (though this will of course have a role). 46 per cent of adults in working families in poverty are in families where at least one earner is paid below the living wage. This is equivalent to around 1.7 million adults. Many of these (4 per cent or 69,) are in families where all the adults work full-time. There is little scope for these adults to work more hours to escape poverty; they will need higher pay or more generous social security. For those in poverty where all the earners in the family are paid above the living wage (1.3 million adults), almost half are working full-time with a non-working partner. Part of the reason for these people to be in poverty despite above living wage pay rates and full-time hours is that they are supporting a non-working partner. A further 27 per cent only have part-time earners (and may have a non-working partner), while the remainder (35,) are all working full-time at or above the living wage. This shows that even working full-time with a living wage may not be enough to get a family out of poverty. 48 Monitoring poverty and social exclusion 213
54 Work Low pay and household income Chapter 2 Indicator: 16A Low-paid people are spread evenly across the bottom three-fifths of the household income distribution. Very few people who are not low-paid are in the lowest fifth. Paid below the living wage Paid above the living wage Number of employees aged 2 and over (millions) Bottom quintile 2nd 3rd 4th Top quintile Source: Family Resources Survey, DWP; the data is for the UK Indicator: 16B Excluding the self-employed, over half of adults in low-income, working households live in a family where at least one earner is paid below the living wage. All paid above the living wage At least one paid below the living wage Self-employed Adults in low income, working families (thousands) 1,2 1, Self-employed All adults working, at least one full-time One or more part-time One full-time, one not working Source: DWP Family Resources Survey, 28/9 to 21/11; the data is for the UK The first graph shows adult employees (i.e. excluding the self-employed) aged over 19 by their household income quintile after housing costs. The data is an average over three years from 28 9 to The living wage is the 211 living wage deflated by earnings for previous years. The second graph presents the same data according to whether the adult works full-time or part-time. Full-time here is defined as working 24 or more hours a week. Monitoring poverty and social exclusion
55 Chapter 2 Work 17 In-work training People with no qualifications are much less likely to receive in-work training than those with a qualification. Those with qualifications are more than three times as likely to receive in-work training than those without. In 212, 8 per cent of those without qualifications had received training compared with 27 per cent of those with qualifications. The number of both has fallen since 22, when 11 per cent of those without qualifications received training and 32 per cent with qualifications received training. The decline in those receiving training for both levels of qualifications appears to have stabilised since around 29. The ratio of those without qualifications receiving training to those with qualifications receiving training has remained constant over the ten years from 22 to per cent of those with qualifications in the public sector receive training, compared with around 23 per cent of those with qualifications in the private sector. Twice the proportion of those without qualifications in the public sector receives training than in the private sector (16 per cent and 7 per cent respectively). Full-time employees are also more likely to receive training than part-time workers at both qualification levels (28 per cent compared with 25 per cent for those with qualifications, 9 per cent compared with 6 per cent for those without). Women with qualifications are more likely to receive training than men with qualifications (3 per cent of women compared with 25 per cent of men). The difference between the proportion of public and private sector employees receiving training is the largest of the three groups shown and is not substantially different for those men and women without qualifications (at 8 per cent and 9 per cent respectively). These figures matter because training is a key part of career progression. Especially for those with no existing qualifications, in-work training can allow them to progress to better paid and more secure employment. The gender difference can probably be explained by the fact that women are more likely to be in the public sector than men. Given the amount of public sector job cuts and the growth of part-time employment, the prospects for rising in-work training are unsatisfactory. 5 Monitoring poverty and social exclusion 213
56 Work In-work training Chapter 2 Indicator: 17A The proportion of people receiving in-work training has fallen over the last decade for those with and without qualifications. Those with qualifications are still far more likely to receive training than those without. With qualifications No qualifications Proportion of working-age adults in employment who received job-related training in the last three months (per cent) Source: Labour Force Survey, ONS; the data is for the UK Indicator: 17B In-work training rates are higher for full-time employees, public sector employees and female employees regardless of qualification level. No qualifications With qualifications Proportion of working-age adults in employment who received job-related training in the last three months (per cent) Full-time Part-time Private sector Public sector Male Female Source: Labour Force Survey, ONS; the data is for the UK The first graph shows the proportion of employees over time who received in-work training in the three months before the survey broken down by those with and without a qualification. The age groups covered are men aged and women aged until 27. Thereafter, all working men and women aged are included. This makes no discernible difference to the analysis. The second graph shows the proportion of employees who received in-work training in the three months before the 212 survey broken down by those with and without a qualification, public and private sector, full-time and part-time, and male and female. The data includes all people aged in paid work. The training in question is job-related but can be paid for by the employer or the employee. Both graphs cover only people who are in paid work. The data is from the Labour Force Survey dataset. Monitoring poverty and social exclusion
57 Chapter 2 Work 18 Insecure work In 212 an estimated quarter of a million people were employed on a zero-hours contract, an increase of a third since 211. A phenomenon which has attracted a lot of attention recently is that of zero-hours contracts. There are concerns over the accuracy of the statistics for these measures, with the ONS expected to release a new set of estimates in 214. The following figures are therefore only suggestive. On the basis of these estimates, in 212 there were around 25, employees in the UK on zero-hours contracts. The low point was 11, in 24 and the figure had been climbing before the onset of recession. In 2, there were 22, employees on zero-hours contracts. The average number of weekly hours actually worked by those on zero-hours contracts has fallen sharply since 2 from 28 hours per week to 21 hours per week in 212. Over the same period, average weekly hours actually worked by all employees have fallen from around 33 hours to 32 hours. This suggests a much more rapid decline than that experienced by the labour market in general. These figures mask one of the key criticisms of zero-hours contracts, which is the potential for variability week to week. The average of 21 hours per week will vary across people but also across time: some people may have full-time hours one week, but fewer the next. The number of people employed on a temporary contract because they were unable to find a permanent contract has fallen slightly (around 18,) between 212 and the first half of 213 to stand at around 62, people. This is 39 per cent of all those on temporary contracts. Between the low point in 28 and 213 there are over 25, more people employed on temporary contracts but wanting a permanent job. The peak of this measure following the 28 recession in 212 remained lower than the previous peak in 1995, both in terms of numbers (68, compared with 64,) and the proportion of those on temporary contracts (43 per cent compared with 4 per cent). 52 Monitoring poverty and social exclusion 213
58 Work Insecure work Chapter 2 Indicator: 18A As the number of people employed on zero-hours contracts has grown, the average hours worked by those on such contracts has fallen. Average actual weekly hours worked (RH axis) In employment on zero hours contract (LH axis) Thousands of employees Average number of hours worked by those on zero hours contract Source: Additional zero hours contract estimate, ONS; the data is for the UK Indicator: 18B The number of temporary employees who want permanent work has fallen for the first time in six years having risen by a quarter of a million since 28. Employees on temporary contracts who would like permanent work (thousands) Source: Labour Market Statistics, ONS; the data is for the UK The first graph shows the number of employees on a zero hours contract over time on the left hand axis, and the average hours actually worked per week by those on zero hours contracts on the right hand axis. This data is from a special ONS statistical release updating previous estimates. The ONS has commissioned further research into zero hours, as it is feared the current numbers may be an underestimate. The second graph shows the number of people in temporary contracts who would like a permanent contract. Monitoring poverty and social exclusion
59 Chapter 2 Work 19 Unemployment by local authority Local authorities with high unemployment rates tend to be concentrated in big cities. The North East also has a large number of areas with high unemployment rates. Conversely, in the South East and West there are few areas with high unemployment. The map shows the unemployment rate in the local authorities in England, Scotland and Wales. The figure is an average of the last three years, so can be seen as a picture of unemployment across Great Britain after the crash. High rates of unemployment can be found in almost all parts of the country. The five authorities with the highest rates of unemployment are Middlesborough in the North East, Blaenau Gwent in Wales, Newham in London, Hull in Yorkshire and the Humber and Thanet in the South East. But the South East and West have only one authority each with an unemployment rate over 11 per cent far less than other parts of the country. The East of England has two. Scotland (with rather more local authorities), the North East and the West Midlands have five each. Around half of the boroughs in London have an unemployment rate above 9 per cent, compared with around a quarter on average. This is worth bearing in mind when thinking about London as the UK s economic powerhouse it still has high levels of unemployment and poverty. Many of the jobs in London are done by people living outside the 32 boroughs and commuting. So higher unemployment in London is the price of lower unemployment in the South West, but especially the South East and East of England. Still it is the North East that stands out most. Eleven of twelve local authorities have an unemployment rate above 9 per cent. The map shows the unemployment rate in different local authorities in Great Britain. This rate is derived by dividing the number of people who are unemployed by the number who are either employed or unemployed. For greater accuracy, a three-year average is used. 54 Monitoring poverty and social exclusion 213

60 Work Unemployment by local authority Chapter 2 Indicator: 19 Orkney Islands Shetland Islands Greater London Over 11% 9% 11% 7% 9% 5% 7% Under 5% Source: Annual Population Survey via NOMIS Monitoring poverty and social exclusion
61 Chapter 2 Work Commentary It is in some sense the conventional wisdom that the labour market is doing well, or rather doing well given a lack of growth. It certainly no longer appears to be getting worse unemployment and underemployment have both stopped rising, and the number of people in workless households has fallen. Government ministers have referred to the highest ever number of people in employment as evidence of winning the global race for competitiveness (hwww.gov.uk/government/news/welcomefall-in-long-term-unemployment), though the rising population makes this boast rather empty. But it is correct that unemployment has not increased as much as in previous recessions: those in the 198s and early 199s saw unemployment rates frequently over 1 per cent, whereas since 28 they have remained around 8 per cent. Labour market problems are now appearing in different ways, such as the still record high number of people who are underemployed, large levels of youth unemployment, and real wages that have fallen almost every month for over three years. These are essentially problems of inadequate demand. The demand for labour is currently insufficient to reduce unemployment and increase real wages. Numerous researchers have been extolling the benefits of full employment; the idea of an employment rate sufficiently high that effectively everyone who wants a job can get one. The operational definitions of full employment vary between proponents, but some of the possible benefits are increasing real wages (as argued by American economists Jared Bernstein and Dean Baker ( and greater sensitivity to those currently excluded from the labour market such as the disabled (as argued by the IPPR in a recent report ( It might also help resolve other labour market problems; if you want secure employment, why would you take a zero-hours contract when there are alternatives? The current problem is a lack of alternatives. Given that work is an important route out of poverty, and the benefits of higher real wages and employment would be felt by more than just the direct beneficiaries, ensuring the maximum level of employment consistent with non-accelerating inflation should be a much higher if not the highest priority for government. 56 Monitoring poverty and social exclusion 213
62 Chapter 3 Education Introduction 58 Choice of indicators 59 2 Attainment at age Attainment at age School performance at GCSE Looked-after children Attainment at age Qualifications and employment 7 26 Attainment among disadvantaged students by local authority 72 Commentary 74
63 Chapter 3 Education Introduction The background to this chapter is the huge change in the overall level of qualifications in the working-age population. The graph below takes a long-term view, starting in 1981, and looks at how the composition of working-age qualifications has changed over the last 3 years. Due to the type of data available, we can only look at certain types of qualifications from 1981 and What we can say is that in 1981, around 4 per cent of men and 6 per cent of women aged had no qualifications at all. By 1991, this had fallen to 25 per cent and 3 per cent; note the fall in the gap between men and women. If we look over the last ten years, the proportion lacking any qualification fell from 15 per cent for men and 2 per cent for women to around 1 per cent for both. We can break these figures down further, by looking at those who have qualifications of below Level 2 (5 GCSEs) and those above this level. The change there has been just as pronounced, particularly for women. In 22, just over 4 per cent of women had qualifications above Level 2. Now it is just under 6 per cent, a rise of 17 percentage points. Over the same period the level for men rose by 4 percentage points to just over 6 per cent. The proportion of adults lacking qualifications No qualifications Some qualifications Level 2 and below Level 3 and above Proportion of all adults aged 25 to 59 (per cent) Male Female Male Female Male Female Male Female Source: LFS, ONS; the data is for the UK As overall levels of qualifications rise the gaps between those with and without qualifications matter even more. Following on from this, this chapter will focus largely on the persisting gaps in educational attainment. 58 Monitoring poverty and social exclusion 213
64 Education Choice of indicators This chapter focuses on education and qualifications. The links between poverty and educational attainment are clear. A basic level of educational attainment is necessary in order to gain well-paid work, without which one is likely to be at risk of poverty. Meanwhile, growing up in poverty tends to impact negatively upon a child s ability to attain the expected educational standards, which in turn impedes access to well-paid work later in life. In this way, poverty risk is often transferred from one generation to the next. This chapter begins by looking at educational attainment at age 11 and 16. The analysis considers differences in attainment by gender, subject or region and is typically broken down by free school meal (FSM) status. We then go on to analyse the performance of schools with high proportions of FSM students to determine the impact of a higher intake of poor students on overall school results. We also analyse attainment levels of children in the care system, as outcomes among this group are so poor that they merit particular mention. The indicator on qualifications among young adults is especially topical given that young adult unemployment is at a record high. We therefore look at underachievement at age 19 and the breakdown of those going on to higher education following completion of second level education. The final indicator looks at the relationship between the level of qualifications and risk of unemployment and low pay. Chapter 3 Monitoring poverty and social exclusion
65 Chapter 3 Education 2 Attainment at age 11 Following four years of little progress in reducing educational under-attainment at age 11, there have been noticeable decreases in the last year. However, gaps persist between pupils receiving free school meals and other pupils. In 212, 15 per cent of 11-year-olds did not attain Level 4 or above (the expected standard) in English and 16 per cent did not achieve this level in maths. These figures were down 1 and 11 percentage points respectively on ten years earlier. While the proportion of pupils not attaining Level 4 at the end of Key Stage 2 had been steadily decreasing since 22, from 28 onwards this downwards trend stalled. In the case of English the fall reversed as there was a slight increase in the proportion of students not attaining the expected standard. However, between 211 and 212, the proportion of 11-year-olds not attaining these expected standards dropped by 3 percentage points for English and 4 percentage points for maths. These decreases are notable both in that they signal the end of the almost flat trend of the last few years and represent the largest year-on-year decrease in under-attainment at age 11 in the last decade. Those receiving free school meals are twice as likely to lack Level 4 or above in English and maths. This is true for both boys and girls. In 212, 37 per cent of boys in receipt of free school meals did not attain Level 4 or above, compared with 19 per cent for other boys. Similarly, 31 per cent of girls receiving free school meals did not attain Level 4 or above, compared with just 15 per cent for girls not receiving free school meals. The FSM gap is therefore bigger for boys than girls. Indeed, the statistics show a clear gender attainment gap which is apparent among both FSM and non-fsm students: this gap is 6 percentage points among FSM students and 4 percentage points among their non-fsm peers. 6 Monitoring poverty and social exclusion 213
66 Education Attainment at age 11 Chapter 3 Indicator: 2A Following four years of little change, 212 saw the biggest year-on-year decrease in the proportion of 11-year-olds failing to meet the expected standards in the last decade. English Mathematics Proportion of Key Stage 2 pupils not achieving Level 4 or above (per cent) Source: National Student Database, National Curriculum Assessments at Key Stage 2 in England, DFE Indicator: 2B Pupils in receipt of free school meals are twice as likely to not achieve Level 4 or above in English and maths. Free school meals Non-free school meals Proportion not achieving Level 4 or above in both English and maths (per cent) Boys Girls Source: National Student Database, National Curriculum Assessments at Key Stage 2 in England, DFE, 212 The first graph compares the proportion of children failing to reach Level 4 at Key Stage 2 (11-year-olds) for all mainstream schools. Results are shown separately for maths and English. The second graph shows, for the latest year, how the proportion of children failing to achieve Level 4 at Key Stage 2 varies by the gender of the pupil and whether or not the pupil is receiving free school meals. Level 4 is the level that children are expected to reach in the Key Stage 2 tests taken in the final year of primary school (year 6). To receive free school meals, parents have to receive means-tested out-of-work benefits, i.e. they have to be workless. While this is the best available proxy measure, it excludes children in low-income working families around half of the children in low-income households and also excludes those who are eligible for but don t claim free school meals. Monitoring poverty and social exclusion
67 Chapter 3 Education 21 Attainment at age 16 Differences in attainment at age 16 among pupils receiving free school meals (FSM) and other pupils are striking. While national level data appears to show a fairly constant FSM gap, this gap varies a lot by ethnicity. There are significant differences in the proportions not attaining at least five GCSEs A* C (including English and maths) by free school meal (FSM) status. In 211/12, under-attainment on this measure was 64 per cent for those pupils receiving free school meals compared with 37 per cent of students not in receipt of free school meals. Since 26/7, there has been a fall in the proportion of students in receipt of free school meals not attaining at least five GCSEs A* C (15 percentage points). However, this drop is not significantly larger than the drop among students not in receipt of free school meals (13 percentage points). Rather, the free school meal gap has remained relatively constant in recent years, falling only 2 percentage points over a six-year period. Progress in reducing the proportion of students not achieving the expected standards at age 16 has slowed for both FSM and non-fsm students. Since 26/7 the proportion of students not attaining at least five GCSEs A* C fell by between 3 5 per cent each year, while in 211/12 the drop was less than 2 percentage points. Recent changes to exam marking aimed at ending grade inflation are likely to be responsible for this slowdown, rather than any fall in teaching standards. Looking at this same data broken down by ethnicity, the difference in the proportions not attaining at least five GCSEs A* C (including English and maths) is even more striking. Among students not receiving free school meals the range is from 23 per cent for Chinese pupils to 47 per cent for Black Caribbean pupils. There is considerably more variation, however, among students who are in receipt of free school meals, with the lowest proportion of under-achieving students again from a Chinese background, compared with 7 per cent of White British FSM students failing to achieve five good GCSEs. In 212, the biggest gap in attainment based on free school meal status was among White British pupils (32 percentage points) followed by Indian pupils (18 percentage points). The attainment gap was smallest among Bangladeshi pupils (6 percentage points) and Chinese pupils (9 percentage points). 62 Monitoring poverty and social exclusion 213
68 Education Attainment at age 16 Chapter 3 Indicator: 21A While the proportion of students receiving free school meals but failing to meet expected standards has steadily decreased, the free school meals 'gap' has remained almost constant. Free school meals Non-free school meals Attainment gap Proportion not achieving at least five GCSEs at A*-C including English and maths (per cent) /7 27/8 28/9 29/1 21/11 211/12 Source: GCSE and equivalent attainment by pupil characteristics in England, DFE Indicator: 21B More than two-thirds of White British students in receipt of free school meals lack five good GCSEs, higher than any other ethnic group. Free school meals Non-free school meals Attainment gap Proportion not achieving at least five GCSEs A*-C including English and maths (per cent) Chinese Bangladeshi Indian Black African Pakistani White other Black Caribbean White British Source: Department for Education, 211/12; the data is for England The first graph shows the proportion of 16-year-old pupils lacking 5 GCSEs at A* C including English and maths. The second graph shows, for the latest year, the proportion of pupils failing to achieve 5 A* C grades including English and maths by ethnicity and broken down by whether or not they receive free school meals. The data is for all maintained schools (including academies and city technology colleges) in England and is based on number of pupils at the end of Key Stage 4 in each academic year. To receive free school meals, parents have to receive means-tested out-of-work benefits, i.e. they have to be workless. While this is the best available proxy measure, it excludes children in low-income working families around half of the children in low-income households and also excludes those who are eligible for but don t claim free school meals. Monitoring poverty and social exclusion
69 Chapter 3 Education 22 School performance at GCSE The likelihood of a school falling below the floor standard is much higher when it has a higher proportion of students in receipt of free school meals. Schools in London are the exception to this rule. There is considerable variation in the proportion of schools failing to reach the floor standard by the proportion of students receiving free school meals (FSM). The floor standard refers to the performance threshold for mainstream maintained secondary schools set out by the Department for Education. In schools where FSM pupils made up less than 1 per cent of the total pupils at GCSE, less than 1 per cent failed to reach the floor standard. The proportion of schools failing to meet the floor standard increases to 6 per cent among schools with between 21 and 3 per cent of FSM students and 13 per cent among schools with between 31 and 4 per cent of FSM students. 16 per cent of schools with more than 4 per cent of FSM pupils failed to reach the floor standard. A more detailed look at this same data suggests, however, that the relationship between the proportion of FSM students and the success of a school is not a straightforward one: where a school is located may also play a role. Most strikingly, London, which has the highest average proportion of disadvantaged pupils of all regions (38.5 per cent), has the lowest proportion of failing schools (3 per cent). Conversely, the East Midlands has the highest proportion of failing schools in England (11 per cent) and yet it has the sixth lowest average proportion of FSM students (21.5 per cent). Furthermore, even when regions differ little on one measure, there may be considerable differences between the given regions on the other: for example, despite the FSM intake being about the same, the proportion of failing schools in the South West is less than half that of the East Midlands. 64 Monitoring poverty and social exclusion 213
70 Education School performance at GCSE Chapter 3 Indicator: 22A Schools with a high proportion of pupils in receipt of free school meals are much more likely to be below the floor standard than other schools. Proportion of schools failing to reach the floor standard by the proportion of pupils receiving free school meals in the school (per cent) % 1% of pupils are disadvantaged 11% 2% 21% 3% 31% 4% More than 4% of pupils are disadvantaged All school average Source: Department for Education; the data is for England Indicator: 22B Despite having the highest proportion of students receiving free school meals, London has the lowest proportion of schools below the floor standard. Proportion of failing schools (left-hand axis) Average proportion of disadvantaged pupils (right-hand axis) Proportion of schools failing to reach the floor standard for GCSE attainment (per cent) East Midlands North East Yorkshire and the Humber North West East South East West Midlands South West London Average proportion of pupils receiving free school meals (per cent) Source: Department for Education, ; the data is for England The first graph looks at the proportion of schools failing to reach the floor standard for GCSE performance by the proportion of free school meal pupil intake. The second graph shows the distribution of failing schools by region and compares it with the average proportion of failing schools in that region. For 211/12, the Department for Education assessed mainstream maintained secondary schools performance against defined floor standards. Considered against these, a school was seen as underperforming if its Key Stage 4 results were: less than 4 per cent of pupils at the end of Key Stage 4 (KS4) achieving five or more GCSEs A* C (or equivalents) including English and maths GCSE; or a below average proportion (median for 21 was 7 per cent) of pupils at the end of KS4 making expected progress in English; or a below average proportion (median was 7 per cent) of pupils at the end of KS4 making expected progress in maths. The vast majority of schools not reaching the floor standard fail to meet the first of these criteria. Monitoring poverty and social exclusion
71 Chapter 3 Education 23 Looked-after children Looked-after children are twice as likely as their peers to lack five good GCSEs, while over a third are not in education, employment, or training (NEET). Since 24 the proportion staying in contact with services has fallen significantly. The proportion of children in the care system (looked-after children) who do not obtain five good GCSEs A* C is far higher than for children on average. In 212, about 85 per cent of looked-after children did not reach this threshold. This compares with about 42 per cent for all children. While the percentage of looked-after children not reaching this standard has fallen gradually over the period 28 to 212, the progress was greater for children in general. For looked-after children, the number who did not obtain five good GCSEs fell 4.4 percentage points, compared with 11.5 percentage points for all children. However, as the fall in the proportion of looked-after children failing to achieve five good GCSEs in 212 was higher than the fall for all children, for the first time in five years there is some indication that the attainment gap may be closing. In the period 24 to 29, the number of looked-after children who have left care but remained in contact with services declined from around 15 per cent to 6 per cent and has remained around this level. Meanwhile, the proportion of care leavers who are not in education, employment and training (NEET), which had remained around 29 per cent in the five years up to 28 has been increasing. While in 28, 29 per cent of care leavers were NEET, this figure had risen to 37 per cent by 212, with the largest year-on-year increase between 211 and 212 (4 percentage points). The total figure includes those who are NEET for reasons of illness and disability and those who are NEET for other reasons. However the increase from 28 consists entirely of a rise in the second of these categories. 66 Monitoring poverty and social exclusion 213
72 Education Looked-after children Chapter 3 Indicator: 23A 85 per cent of looked-after children lack five good GCSEs, twice the average. The gap between care leavers and other pupils is growing. Looked-after children All children Attainment gap Proportion lacking five GCSEs at A*-C including English and maths (per cent) Source: Department for Education; the data is for England Indicator: 23B The proportion of care leavers not in education/training/employment rose sharply in the last year. Not in education/ training/employment Not in touch with services Proportion of all care leavers at age 19 (per cent) Source: Department for Education; the data is for England The first graph shows the performance of children who have been looked after continuously for at least twelve months. It shows the proportion of looked-after children who obtained fewer than five GCSEs at A* C including English and maths as well as the figure for all children the national average. The second graph shows the destinations of care leavers at age 19. It shows the proportion of children in care at the age of 16 who, by the age of 19, were either not in education, employment or training or not in contact with Connexions services at all. The term looked-after was introduced by the Children Act 1989 and refers to children who are subject to care orders and those who are voluntarily accommodated. The graph shows a decreasing number of care leavers who lose touch with Connexions services. It is most likely that those not in touch with Connexions are not in education or work either so a decrease in the level losing touch should be considered an improvement. Monitoring poverty and social exclusion
73 Chapter 3 Education 24 Attainment at age 19 The attainment gap between pupils receiving free school meals and other pupils has closed for Level 2 but not Level 3 qualifications. The proportion of students going on to higher education is considerably higher in London, both for FSM and non-fsm students. In 212, 31 per cent of 19-year-olds eligible for free school meals (FSM) in Year 11 lacked a Level 2 qualification (GCSEs graded A* C and equivalents) and 66 per cent did not have a Level 3 qualification (AS/A levels and equivalents). This compares with 14 per cent of non-fsm 19-year-olds lacking a Level 2 qualification, less than half the FSM level. Similarly a total of 42 per cent of non-fsm students lacked a Level 3 qualification, 24 percentage points lower than among FSM students. Since 25, the proportion of FSM students without a Level 3 qualification has decreased by about 14 percentage points. This, coupled with the same decrease in the proportion of non-fsm students lacking a Level 3 qualification, has meant that the Level 3 attainment gap has remained around 25 per cent. There has however been some progress in reducing the Level 2 attainment gap. This gap has narrowed by 11 percentage points over the period, primarily due to significant decreases in the proportion of FSM students lacking Level 2 qualifications. There is considerable regional variation in the proportion of students going on to higher education aged 18 in 29/1 or 19 in 21/11. This ranged from 34 per cent in the South West to 48 per cent in Outer London for students not in receipt of free school meals, while this variation is much more pronounced among FSM students where it ranged from under 13 per cent in the South West and North East to 38 per cent in Inner London. Students in London schools are more likely than elsewhere to go on to higher education. This is true within FSM categories as FSM and non-fsm students outperform their respective peers outside of London as well as across them. For instance, students in receipt of free school meals in Inner London are more likely to go on to higher education than non-fsm students in all regions outside of London. 68 Monitoring poverty and social exclusion 213
74 Education Attainment at age 19 Chapter 3 Indicator: 24A 31 per cent of 19-year-olds who had been eligible for free school meals (FSM) in Year 11 lacked a Level 2 qualification, more than double the non-fsm level. Free school meals without Level 2 Free school meals with Level 2, without Level 3 Average without a Level 3 qualification Average without a Level 2 qualification Proportion of 19-year-olds (per cent) Source: Department for Education; the data is for England Indicator: 24B Students in receipt of free school meals in Inner London are more likely to go on to higher education than non-fsm students in all regions outside of London. Students eligible for free school meals Students not eligible for free school meals Proportion of school pupils aged 15 in 26/7 who entered higher education in 29/1 at age 18 or in 21/11 age 19 (per cent) Inner London Outer London West Midlands North West Yorkshire and the Humber East of England East Midlands South East South West North East Source: Department for Education; the data is for England The first graph shows the proportion of 19-year-olds that received free school meals at the age of 16 without a Level 2 qualification or with a Level 2 qualification and not a level 3 qualification. The proportion for non-fsm 19-year-olds has also been shown for comparison. The second graph shows the proportion of pupils going on to higher education by region and free school meal status. Level 2 qualifications include GCSEs grades A* C and equivalents. Level 3 qualifications include A Levels and equivalents. Monitoring poverty and social exclusion
75 Chapter 3 Education 25 Qualifications and employment The risk of lacking but wanting work is higher and has increased more for those with lower qualifications, but in 212/13 a fifth of the unemployed had a higher education qualification. In 212/13, more than one in five people with no qualifications lacked or wanted work. This level falls as qualification level rises; one in twenty people with a degree lacked and wanted work. For each level of qualification the proportion of adults lacking but wanting work was higher in 212/13 than ten years earlier. Those with no qualifications and those with only GCSEs saw the biggest growth with the proportion lacking but wanting work increasing by 5 percentage points. The group with the smallest increase were those with a degree, increasing by 1 percentage point. In 22/3 there was almost no difference in the risk of lacking but wanting work for those with some form of higher education and those with a degree, but in 212/13 there was a 2 percentage point gap. The difference between those with GCSEs only and those with an A Level has also grown. In 22/3 the gap was 2 percentage points; by 212/13 this had widened to 4 percentage points. In 212/13 an average of around 2.3 million people aged were unemployed. Almost 8, people aged were unemployed (a third of the total). The number of unemployed adults aged is much lower at 55, which in turn is higher than the number aged either or 45 54, both at around 4,. Around a fifth of the unemployed have some form of higher education (around half a million). This rises to at least a quarter for those aged and Monitoring poverty and social exclusion 213
76 Education Qualifications and employment Chapter 3 Indicator: 25A For every level of qualification the proportion of people lacking but wanting work has increased in the last ten years, but the growth has been bigger for those with lower qualifications. 22/3 212/13 Proportion of working-age lacking but wanting work (per cent) Degree Higher education A level GCSE grades A-C Other qualifications No qualifications Source: Labour Force Survey, ONS; the data is for the UK Indicator: 25B Almost 8, people aged were unemployed in 212/13, 2, higher than any other age group, and half of them have a post-16 qualification. Did not know No qualification Other qualifications GCSE grades A*-C or equivalent GCE, A Level or equivalent Higher education Degree or equivalent Unemployed people (thousands) Source: Labour Force Survey, ONS; the data is for 212/13 The first graph shows the proportion of working-age people lacking but wanting work in 22/3 and 212/13. The level is shown separately depending on the highest qualification of the individual. Lacking but wanting work includes the officially unemployed and those wanting work but not counted as unemployed (as they are not immediately available to start work and/or are not actively seeking work). For the 22/3 data working-age refers to men aged and women aged For the 212/13 data working-age refers to anyone aged The second graph shows the number of people that are unemployed in each age group by their highest level of qualification. The qualification levels include those listed and the equivalent levels of alternative qualifications. Monitoring poverty and social exclusion
77 Chapter 3 Education 26 Attainment among disadvantaged students by local authority Many of the local authorities with the lowest proportion of disadvantaged students not attaining the expected standards at age 16 are in London. Conversely, the South East, South West and Yorkshire and the Humber have the worst attainment rates for disadvantaged students. There is significant local variation in the proportion of students in receipt of free school meals (FSM) not attaining at least five GCSEs A* C including English and maths. 81 per cent of students in receipt of free school meals fail to achieve these expected standards. Peterborough in the East of England has the worst attainment rate of all local authorities in England, followed by West Berkshire in the South East and Barnsley in Yorkshire and the Humber. On average, the region with the highest proportion of FSM students lacking five good GCSEs is the South East, closely followed by South West and Yorkshire and the Humber. In contrast, the best performing local authority in England was Kensington and Chelsea with 23 per cent of FSM students failing to meet the expected standards. The next best performing authorities were Westminster (35 per cent), Tower Hamlets (41 per cent) and Lambeth (44 per cent). Indeed, 27 of the 3 local authorities with the lowest numbers of FSM students failing to achieve five good GSCES are in London, with 19 of these in the top 2 best performing authorities. The best performing local authorities on this measure outside of London were Birmingham in the West Midlands, followed by Trafford and Bury in the North West. 72 Monitoring poverty and social exclusion 213

78 Education Attainment among disadvantaged students by local authority Chapter 3 Indicator: 26 Over 75% 7% 75% 65% 7% 6% 65% Under 6% Source: DfE, GCSE and equivalent attainment by pupil characteristics This map shows the proportion of children on free school meals who do not attain five GCSEs at A* C. The map shows these proportions, for England only, for upper tier local authorities. Here, free school meals are used as a proxy for poverty. A child receives free school meals if their parent(s) receives an out-of-work benefit or child tax credit but not the working tax credit component. As such, children in low-income, working families are not included in this analysis. Monitoring poverty and social exclusion
79 Chapter 3 Education Commentary The proportion of students failing to reach expected standards has steadily decreased in recent years. This is true for both Key Stage 2 and Key Stage 4 (GCSE) pupils. Indeed, there is a very clear long-term trend in which the population as a whole has become more qualified. But the differences in attainment due to low income are striking. Poor children (i.e. children receiving free school meals the best available proxy for low income in education statistics) are consistently outperformed by their non-poor counterparts and progress in reducing this gap has been negligible. However, location also appears to play an important role. London merits particular mention in this respect as its schools/pupils perform better than the rest of the country on a series of measures. Not only does London have the lowest proportion of underperforming students (27 of the 3 local authorities with the lowest numbers of poor students failing to achieve five good GSCEs are in London), but the educational attainment gap between poor and non-poor students is also significantly smaller in London. Unsurprisingly, this smaller attainment gap also manifests itself in the proportion of students going on to higher education. This attainment gap is about a third of what it is elsewhere. Indeed, not only are poor students in London more likely to go on to higher education than their peers elsewhere in England, but they are also more likely to go on to higher education than their non-poor counterparts in all regions outside of London. The successes of state schools in London may be attributable to improvements in leadership and teaching through initiatives such as the London Challenge Programme and Teach First, as well as the presence of many successful academy chains in London. As such, these achievements in London inevitably call into question the recent charges of grade inflation. London saw its grades rise further and faster than any other part of the country and a narrowing of the attainment gap between poor and non-poor students, yet no one argues that these changes were not real. The challenge for other parts of the country, and indeed other public services, is how to copy this success. Effective public services, that work for those on lower incomes as well as those in the middle, are essential for tackling poverty. London s schools are an example of how professional leadership, funding and sharing good practice can drive up standards for everyone. 74 Monitoring poverty and social exclusion 213
80 Chapter 4 Social security and welfare reform Introduction 76 Choice of indicators Value of benefits Out-of-work benefits 8 29 Claimant counts and flows 82 3 Interval between JSA claims Disability benefits Tax credits Changes to benefits in JSA sanctions The Work Programme Out-of-work benefits across the UK 96 Commentary 98
81 Chapter 4 Social security and welfare reform Introduction Table 3 shows the major welfare changes since the start of 212, which is close to when the latest available income data ends (a full table can be found in the appendix). We will not therefore see the impact of these reforms for at least another year, and they include some of the more notable changes. Both the numbers of people or families affected, and the average loss varies widely. In general, the more people affected by a change, the smaller the average affect. For example, 9.6 million people are affected by 1 per cent increases in benefits, and face a relatively small loss of 3 a week (small relative to the other changes). At the other end of the scale, there are 4, households losing an average of 93 a week as a result of the overall benefit cap. These changes affect both people in and out of work. Table 3: Welfare changes since 212 Date Change Numbers affected Average weekly loss January 212 April 212 Under 35s only eligible for shared room rate of housing benefit Couples with children need to work 24 hours with at least one working 16 to qualify for working tax credits 62, , families Up to 75 May 212 One year time limit on contributory ESA 7, by 215/16 36 April 213 Under-occupancy penalty ( bedroom tax ) 66, 14 April 213 Local Housing Allowance uprated by CPI rather than rents There were 1.39 million LHA claimants in April 213 Notional loss April 213 Council Tax Benefit replaced with local Council Tax Support schemes 2.4 million 2.65 April 213 Disability Living Allowance replaced by Personal Independence Payment 45, lose existing entitlement by 218, 67, fewer than if DLA had remained Average amount of DLA received was in February 213 April 213 Benefits increased by 1% rather than CPI inflation 9.6 million 3 April 213 Overall benefit cap ( 35 for singles, 5 for others) 4, households 93 (mean), 62 (median) Note: All reforms apply to Great Britain except the reform of Council Tax Benefit which is England only. 76 Monitoring poverty and social exclusion 213
82 Social security and welfare reform Choice of indicators Many social security benefits are means-tested: they top up the income of poorer families (although some benefits are provided regardless of income, such as the state pension and Disability Living Allowance). Most households in poverty will claim or be entitled to some kind of social security benefit. This chapter explores data on benefit claims which tell us a lot about low-income households. It also looks at how these benefits are changing, as they will inevitably have a direct impact on poverty. The first indicator puts this discussion of benefits into context by looking at the value of benefits in terms of individual claimants and the Treasury, and how this has changed over time. The following three indicators (out-of-work benefits, claimant count flows and intervals between claims) explore the different ways of looking at benefit claims: the overall number of claimants, the duration of claims and the churn in the benefit system. The next indicator on tax credits explores to what extent this benefit, targeted at low-income families with children, has played a role in reducing poverty. The chapter then focuses on how social security has changed under the current government, first by looking at changes to benefits in 213 and then by looking at subtler changes to the conditions for claiming Jobseeker s Allowance in terms of sanctions and the work programme. Lastly we look at the overall benefit claims across the UK, which shows how these changes to benefits affect some areas more intensely than others. Chapter 4 Monitoring poverty and social exclusion
83 Chapter 4 Social security and welfare reform 27 Value of benefits The value of means-tested benefits has fallen for all groups in real terms in the last three years. The longer term trend is one of increasing expenditure on pensioners and housing benefits. Following below inflation rises in three of the last four years, the value of means-tested benefits for pensioners and working-age adults is now 7 per cent lower than five years ago in real terms. The fall for children is less pronounced, at 4 per cent. A pensioner couple claiming the state pension and full Pension Credit are now entitled to per week, down from in 28 (adjusted for inflation). This comes at a time when pensioner incomes are assumed to be protected by the triple lock uprating (whichever is the greatest of consumer price inflation, earnings or 2.5 per cent). But that only applies to the state pension Pension Credit is not uprated as generously. A working-age couple, in comparison, receives just over half the amount of a pensioner couple. Despite being lower than inflation, increases in means-tested benefits in 21 and 211 were greater than increases in average income (see indicator 1A). These increases helped to keep relative poverty down. The longer term trend is for pensioner and child benefits to rise and working-age benefits not to rise at all. In fact, the value of benefits for a working-age couple in 213 is the same, in real terms, as in Over the same period, pensioner benefits rose by 5 per cent and benefits for children more than trebled. So whereas in 197 pensioner couples and working-age couples received the same amount of means-tested benefits and both received more than two children did, working-age couples now receive far less than either of the other groups. These individual changes can be seen again in the aggregate expenditure. Between 22/3 and 212/13, spending on benefits rose from 161 billion to 223 billion (after adjusting for inflation). Of this 63 billion rise, 3 billion is accounted for by the increase in pensioner benefits, which now total 1 billion per year. Other increases are more modest in comparison, but still substantial. Spending on family benefits (which include Child Tax Credits and Child Benefit) rose from 33 billion to 48 billion. Spending on disability and incapacity-related benefits rose from 28 billion to 36 billion. The housing benefits bill rose from 17 billion to 26 billion, an increase of more than 5 per cent in ten years. 78 Monitoring poverty and social exclusion 213
84 Social security and welfare reform Value of benefits Chapter 4 Indicator: 27A The value of all means-tested benefits has fallen in real terms in the last four years. The longer-term trend is one of rises for children and pensioners, while working-age benefits are back at their 198 values. Working-age couple Pensioner couple Two children aged 2 and 12 Means-tested benefits in 213 prices ( per week) Source: DWP Summary Benefit Expenditure, HMRC receipts; the data is for the UK Indicator: 27B Almost half of the growth in benefit expenditure over the last decade is accounted for by pensioner benefits. Growth to 212/13 22/3 22/212 prices ( billions) Pensioner incomes Family benefits, Income Support and tax credits Incapacity, disability and injury benefits Housing Unemployment Other Source: HM Treasury Public Expenditure Analysis 28 and 213; the data is for the UK The first graph shows the real (inflation-adjusted) values of the principal means-tested benefit each year, separately for: a working-age couple; a pensioner couple; two dependent children aged two and twelve. The second graph shows the level of spending in each of the main categories of social security spending in 22/3 and the growth (after discounting the effects of inflation) between then and 212/13. Pensioner incomes includes the state retirement pension, Pension Credit and other benefits paid to pensioners on the grounds of their age. The spending figures are for Great Britain (with component UK data being reduced by 3 per cent to excluded Northern Ireland). Monitoring poverty and social exclusion
85 Chapter 4 Social security and welfare reform 28 Out-of-work benefits The number of jobseekers claiming an out-of-work benefit is 56, higher than a decade ago; the number of claims for incapacity is 3, lower. In February 213, some 5.2 million people in Great Britain were claiming an out-of-work benefit. This is around 5, lower than a year earlier, but 4, higher than five years earlier. The number of people claiming an out-of-work benefit was on a general downward trend between 23 and 28; falling from 5.1 million to 4.7 million, but then increased to 5.3 million in 29. Almost all of that increase was among jobseekers, the number of which grew from 8, to 1.4 million between 28 and 29. Those claiming for incapacity reasons made up the largest share of all claims at 2.5 million in 213 a fall of 11 per cent since 23 when it was 2.8 million. Meanwhile, the number of jobseekers claiming in 213 at 1.5 million was 6 per cent higher than ten years earlier (95,). The number of claimants eligible as lone parents has fallen every year between 23 and 213 and now stands at 5,. Between 23 and 28 it fell by 11, but between 28 and 213 it fell by more than double that at 24,. This is in part the result of a change in the eligibility criteria to claim an out-of-work benefit as a lone parent rather than as a jobseeker. Around a quarter (24 per cent) of out-of-work benefit claimants in 213 had only been claiming for less than six months, a further tenth had been claiming for more than six months but less than a year. Overall 37 per cent had been claiming for five years or more. The vast majority of this group were claiming for reasons of incapacity. Only 1 per cent of people claiming an out-of-work benefit were jobseekers claiming for more than five years. 8 Monitoring poverty and social exclusion 213
86 Social security and welfare reform Out-of-work benefits Chapter 4 Indicator: 28A The number of people claiming an out-of-work benefit fell in 213 for most of the main benefit types but total claims are still half-a-million higher than in the mid-2s. Others on income-related benefit Carer Lone parent ESA and incapacity Jobseeker Number of working-age adults claiming an out-of-work benefit (millions) Source: DWP Benefit Caseloads National Statistics (WPLS); the data is for February of each year, for Great Britain Indicator: 28B Of those claiming an out-of-work benefit for more than five years, most are claiming Employment Support Allowance or other incapacity benefits. 2 years and up to 5 years 17% Job seeking 1 year and up to 2 years 12% 6 months up to 1 year 1% 5 years and over 37% ESA and incapacity benefits Up to 6 months 24% Lone parent Carer Source: DWP Benefit Caseloads National Statistics (WPLS); the data is for February 213, for Great Britain The first graph shows the number of working-age adults in Great Britain claiming out-of-work benefits each year from 23 to 213. The numbers are broken down by the reason for claiming, rather than the benefit claimed. The second graph shows the proportion of working-age adults in Great Britain claiming an out-of-work benefit in 213 by the duration of their current claim. The group claiming for five years and over is also broken down by the reason for claiming. A person claiming for multiple reasons appears in the first category for which they are eligible, the order being Jobseeker s Allowance, Employment and Support Allowance and Incapacity Benefit, lone parents, carers and others on income-related benefit. The graph does not include Disability Living Allowance claimants as they can be in work as well. Monitoring poverty and social exclusion
87 Chapter 4 Social security and welfare reform 29 Claimant counts and flows The overall number of Jobseeker s Allowance claimants is higher than the pre-recession levels but the overall turnover is much higher too. Over the twelve months to June 213, 3.5 million new claims for Jobseeker s Allowance were made and 3.6 million claims ceased. This compares with a total stock of people claiming Jobseeker s Allowance of around 1.5 million. The flow of claims made over a year is more than double the number of claims at any one point. Half of claimants in June 213 (72,) had been claiming for less than six months; an additional 2 per cent (29,) had been claiming for less than a year; 3 per cent had been claiming for more than a year (43,). In 29, the number of new claims made for Jobseeker s Allowance increased by 1.3 million to reach 3.8 million, the biggest year-on-year increase in the series. The number of people claiming JSA for less than six months increased by 51, in the same period. In later years the number of people claiming for over a year increased. In June 213, 43, people claimed jobseeker s Allowance for more than a year, 29, higher than in 29. Of the 3.6 million JSA claims that ended in the year to June 213, three quarters (2.7 million) were claims of less than six months. Around 1.5 million claims ended because the claimant found work or increased the amount of work done, but a further 1.6 million claims ceased for unknown reasons. The proportion of claims ending because of a move into work was the same (47 per cent) for both those who had been claiming for one to three months, and those who had been claiming for over a year. 82 Monitoring poverty and social exclusion 213
88 Social security and welfare reform Claimant counts and flows Chapter 4 Indicator: 29A The flow of claims on and off Jobseeker s Allowance in the last year is 1 million higher than five years ago and more than twice the number claiming at any one time. Off-flow On-flow Claiming for over a year Claiming for 6 months to a year Claiming less than 6 months Number of people claiming and number of claims (million) Source: NOMIS; flows measured as the year to June, number claiming as at June each year; the data is for the UK Indicator: 29B Most of those ending a JSA claim were on the benefit for less than three months, but the reason for over half of these off-flows is unknown. All other Defective or reviewed claim Claimed other benefit Education or training Ceased claiming, failed to sign or not known Found or increased work Number of ended JSA claims (thousands) 1,2 1, Less than one month One to three months Three to six months Six to 12 months Over 12 months Source: NOMIS, 12 months to June 213; the data is for the UK The first graph shows two things the bars show the average number of people claiming Jobseeker s Allowance (JSA) in each year and the lines show the total number of new claims or inflows in each period. The lines show claims, not people, implying that a person may be counted twice in any particular period. This could happen, for example, when someone makes a new claim for JSA in say January, then finds work, then claims again within six months. The second graph shows the number of JSA claims that ended in June 212 with the results broken down according to the duration of claim and whether the claimant was leaving JSA for i) work, ii) full-time education or training, iii) to transfer to another benefit, iv) moving abroad or other reasons (like person retired, was in prison, had a defective claim, deceased), v) reason not known because failed to sign or reason not known. Monitoring poverty and social exclusion
89 Chapter 4 Social security and welfare reform 3 Interval between JSA claims The overall level of churn in jobseekers is substantial, particularly in the years following the recession. Of the 23, claims for Jobseeker s Allowance made by men in the first quarter of 213, almost half (47 per cent) were made within six months of a previous claim ending. Of the 88, new claims by women, a third (34 per cent) were within six months of a previous claim ending. Throughout the late 199s and 2s, this level fluctuated but did not vary by much until 29. In 29 the proportion of new claims made by men of women dropped by 9 percentage points for men and 7 for women. In the same year there was an overall increase in the number of new claims. Much of this increase was among people who had not made a claim for at least six months. But in 21 and 211, the proportion of new claims made by men whose last claim had ceased within six months peaked at 52 per cent. This suggests that following the increase in claims in 29 many of the men who stopped claiming did not secure long-term employment and were claiming again within six months. By 212 and 213 this level had fallen back again to the level typical of the mid-2s. The change was similar for women; a fall in 28 then a rise in 29/1 before settling back to around 3 per cent this year. Between April 211 and April 213 an estimated 4.8 million adults claimed Jobseeker s Allowance. Of these 1.5 million were claiming at the start of the two-year period (March 211). So a further 3.3 million more people started to claim Jobseeker s Allowance between April 211 and 213. Of these new claims, most (1.8 million) had not claimed Jobseeker s Allowance before, while the remaining 1.5 million had. 84 Monitoring poverty and social exclusion 213
90 Social security and welfare reform Interval between JSA claims Chapter 4 Indicator: 3A Half of men and a third of women making a new claim for JSA were doing so within six months of their previous claim. Women Men Proportion of claims starting in the period where the last claim was within the previous six months (per cent) Source: Table 6.23, JUVOS cohort, ONS; the data is for first quarter of each year; the data is for Great Britain Indicator: 3B 4.8 million adults had claimed JSA at some point in the two years to April 213, of which two-fifths had never claimed before. New claim, never claimed before 1,8, Claiming at end of March 211 1,5, New claim, claimed previously before April 211 1,5, Source: JUVOS cohort data from Labour Market Statistics, ONS, and claimant count data from NOMIS; the data covers the period from April 211 to April 213; the data is for Great Britain The first graph shows the likelihood that someone making a new claim for Jobseeker s Allowance (JSA) was last claiming the benefit less than six months previously, for men and women. The second graph shows the total number of people who claimed JSA in the period between April 211 and April 213. It shows three separate elements: those who made a new claim for JSA between the second quarter of 211 and the first quarter of 213 having never claimed JSA before, those who made a new claim between the second quarter of 211 and the first quarter of 213, having claimed in the past but whose previous claim had ended by the second quarter of 211 and the numbers already claiming at the beginning of the second quarter of 211. This graph shows the number of people not claiming. We have made estimates of the number of people making multiple claims and removed these from the total to avoid double counting. Monitoring poverty and social exclusion
91 Chapter 4 Social security and welfare reform 31 Disability benefits Although the focus of many cuts and changes, the number of working-age people claiming disability benefits has changed little over the last decade. In 213, around 5 per cent of working-age adults were claiming Disability Living Allowance (DLA), up from 4.6 per cent a decade earlier. Over the same period, the proportion of under-16s receiving DLA rose from 2.3 per cent to 3.1 per cent. The proportion of over 65s receiving DLA rose much faster, from 6.3 per cent to 8.8 per cent. The reason for this is not necessarily increased need, however. When DLA was introduced in 1992, it was only available to people of working age while attendance allowance was paid to those past retirement age. But on retirement, the DLA claim would remain live, so the proportion of over 65s was bound to rise initially. With that in mind it is interesting to note that the rise appears to have slowed in the most recent year. In graph 28A we showed that the number of people claiming out-of-work benefits for reasons of incapacity or disability has fallen over the last decade. So in total, there is no evidence that more working-age people are claiming disability benefits now than previously. There is a range of cuts that will impact on the incomes of disabled people. Some of them relate directly to their disability, for example the time limitations to Employment and Support Allowance (ESA) will affect 7, people, all of whom are disabled. Likewise the reassessment of incapacity benefits and the replacement of DLA with personal independence payment will affect around 6, people. But disabled people will also be affected by the cuts to non-specific benefits. So the single largest impact in terms of numbers affected has been the change in uprating of all benefits. This will reduce the incomes (compared with the previous system) of around 3.7 million disabled people. Some 1.4 million disabled people will be affected by the localisation of Council Tax. 86 Monitoring poverty and social exclusion 213
92 Social security and welfare reform Disability benefits Chapter 4 Indicator: 31A While the proportion of children and over-65s receiving DLA has risen significantly over the last decade, the proportion of working-age people receiving it has risen only slightly, and not at all since 29. Over 65 Working-age Under 16 Proportion in each age group claiming DLA (per cent) Source: DWP statistics via NOMIS; the data is for Great Britain Indicator: 31B Disabled people will be affected by both disability-related benefit cuts and more general benefit changes. General cuts Disability-specific cuts 4, 3,5 3, 2,5 2, 1,5 1, 5 1% cap on benefit rises Localisation and 1% cut for Council Tax Benefit Freezing Child Benefit Change to Local Housing Allowance Time limitation of WRAG (Employment and Support Allowance) Reassessment of Incapacity Benefit Introduction of Personal Independent Payment Uprating and cuts to tax credits Bedroom tax Number of disabled people affected by each cut (thousands) Source: DEMOS analysis of DWP impact assessments; the data is for Great Britain The first graph shows the proportion of people receiving Disability Living Allowance, broken down by age group. Proportions are shown separately for children, working-age adults and pensioners. The second graph shows the number of disabled people affected by a range of different benefit cuts. The data comes from a report by Demos, Destination Unknown, in which the various impact assessments of different changes are compiled. Not all changes are included, as some affect numbers of people too small to show on this graph. Often these changes, such as the household benefit cap, will affect a small number of people by a large amount of money. Monitoring poverty and social exclusion
93 Chapter 4 Social security and welfare reform 32 Tax credits The number of children in poverty who get tax credits has been increasing, but so has the number dependent on tax credits to lift them out of poverty. In 211/12 around 1.4 million children were lifted out of poverty by tax credits. So for these children, the income provided by tax credits moves their household from below the poverty line to above it. There were also another 1.5 million children in families that received tax credits but were still in poverty, so while their household income was increased by tax credits, it did not push them over the poverty line. A further 7, were in poverty in the UK and did not receive tax credits. The number of these children has been on a general downward trend, falling by 11, over five years, while the number in poverty receiving tax credits has increased by 12,. So while there has been only a slight change in the overall number of children in poverty over the last five years, more of these children are benefiting from tax credits. The biggest change in the last five years has been the number of children requiring tax credits to lift them out of poverty, increasing by a third (345,) in five years. In 213 around 2.7 million families with children were in work and receiving tax credits. Most of them (1.6 million) were couple families. Of the 1.2 million lone parents in work and in receipt of tax credits, most work part-time with 55, working between 16 and 23 hours per week. A quarter (55,) were work full-time (at least 35 hours a week). 72 per cent (1.1 million) of couple households did more than 35 hours of work per week, but this may mean that both adults are working part-time. 88 Monitoring poverty and social exclusion 213
94 Social security and welfare reform Tax credits Chapter 4 Indicator: 32A By 211/12, tax credits lifted around 1.4 million children out of poverty, but another 1.5 million were still in poverty despite receiving tax credits. Tax credits lifting out of poverty In poverty with tax credits In poverty no tax credits Children in working families (millions) /4 24/5 25/6 26/7 27/8 28/9 29/1 21/11 211/12 Source: NPI analysis of Households Below Average Income, DWP; the data is for the UK Indicator: 32B There are 4, more working couples receiving tax credits than lone parents and 8, more doing at least 3 hours of work per week. 35 or more hours 3-34 hours hours hours Families with children receiving tax credits (thousands) 1,8 1,6 1,4 1,2 1, Singles Couples Source: HMRC Child and Working Tax Credit statistics, 213; the data is for the UK The first graph shows an analysis of the number of children in working families where, excluding tax credits, the household is in low income. For each year, it shows the number of children in three categories: not in receipt of tax credits; in receipt of tax credits but still on a low income and in receipt of tax credits and, as a result, no longer in low income. The second graph shows the proportion of families with children that were in work and in receipt of work working tax credits in 213. The data is broken down to show lone parent families and couple families and by the number of hours worked in the family per week. Monitoring poverty and social exclusion
95 Chapter 4 Social security and welfare reform 33 Changes to benefits in 213 The benefit cut which affected the most families in April 213 was the change to Council Tax Support. Most of those affected were already living in poverty. In the financial year 213/14, an estimated 2.6 million families (8 per cent of families in the UK) saw their benefit entitlement cut as the result of three welfare reforms. The change from Council Tax Benefit to Council Tax Support, the under-occupation penalty and the overall benefit cap were all absolute cuts introduced from April 213. Around 44, families were affected by more than one of these cuts: the under-occupation penalty and Council Tax Support. These families lost on average 16.9 a week. This compares with 14 less a week for those affected only by the bedroom tax and 2.6 for those only affected by Council Tax Support. Two million families saw only a reduction to their Council Tax Support. This is the largest group affected by only one benefit loss. Of the 66, families hit by the bedroom tax, most of them (44,) have also had their Council Tax Support cut. The household benefit cap is the change that affected the smallest number of families at 4,. This group is so small that it is not possible to analyse the overlap with the other benefit cuts. However, the average cut to these families is estimated at 93 per week. Almost two-thirds (63 per cent) of the 2.6 million families affected by an absolute cut also claim an out-of-work benefit. In April these families also experienced a fall in real terms in the value of their other benefits as they were uprated by 1 per cent when inflation was 2.2 per cent. There were around 2.9 million working-age claimants of Council Tax Benefit in England at the start of 213 (of which 2.4 million would have seen their benefit cut in April 213). Most of these families were in poverty with a household income of less than 6 per cent of the median after housing costs. Around 1.5 million of these families were in deep poverty with an income below 5 per cent of the median. 9 Monitoring poverty and social exclusion 213
96 Social security and welfare reform Changes to benefits in 213 Chapter 4 Indicator: 33A The change to Council Tax Benefit reduced the incomes of around 2.5 million families. Around one-fifth of these were also affected by the under-occupation penalty. Not claiming an out-of-work benefit Claiming an out-of-work benefit Number of families affected by each change (thousands) 2,5 2, 1,5 1, 5 Council Tax Benefit only Under-occupation penalty only Council Tax and under-occupation penalty Household benefit cap Source: NPI analysis of Family Resources Survey, 28/9 to 21/11, except for the benefit cap which is from the DWP impact assessment; the data is for the UK Indicator: 33B 2 million of the working-age families that claimed Council Tax Benefit were already in poverty and three-quarters of these were in deep poverty. Below the poverty line Below 5% of median income 1.5 million 5% 6%.4 million 6% 7%.3 million Above 7%.7 million Above the poverty line Source: NPI analysis of FRS 29/1 and 21/11 and DWP benefit caseload data; figures are for England The first graph shows the number of families affected by any of the three absolute benefit cuts introduced from April 213. These are: the replacement of Council Tax Benefit with Council Tax Support (which only applies in England), the under-occupation penalty (commonly referred to as the bedroom tax), and the overall benefit cap. It also shows the number of these families in receipt of certain out-of-work benefits (Income Support, income-based Jobseeker s Allowance, and income-based Employment Support Allowance). It was not possible to identify the correct number of families affected by the household benefit cap using the Family Resources Survey as estimated by the DWP. As such they were excluded from our overlap analysis and the DWP estimate is used. The second graph shows working-age families estimated to have been in receipt of Council Tax Benefit at the start of 213. The data is broken down to show where the family lies in the income distribution relative to the after housing costs poverty line (6 per cent of median income). Monitoring poverty and social exclusion
97 Chapter 4 Social security and welfare reform 34 JSA sanctions The number of sanctions of Jobseeker s Allowance claimants has continued to grow despite the overall number of claims being flat; a disproportionate share of these sanctions are levied on the under 25s. There were 1.6 million referrals and 8, actual sanctions of Jobseeker s Allowance claimants in the 12 months to October 212. Both of these figures have risen year-on-year since 26, when the numbers stood at 54, and 29, respectively. But the level of increase has not been the same year-on-year. The biggest increase was between 29 and 21, when the number of referrals increased by 48, (up 57 per cent) and the number of actual sanctions increased by 22, (up 54 per cent). This rise coincides with the change in government, and the introduction of a harsher interpretation of the existing sanction rules. As we noted earlier, the level of Jobseeker s Allowance claims in 213 was higher than in the mid-2s, which could account for some of this recent increase in sanctions. But while the number of claimants increased in 29 and has since remained quite flat, the number of sanctions has continued to rise. The dip in 211 coincides with the introduction of the Work Programme. As this new welfare-to-work scheme was being introduced, it took time to become a source of new sanctions. Once the scheme was established, sanctions rose to and eventually exceeded their previous levels. A disproportionate share of these sanctions are being levied on those aged under 25. They accounted for just over a quarter (27 per cent) of Jobseeker s Allowance claimants in November 212. But they accounted for almost half (47 per cent) of all sanctions between January and October 212. The data in this indicator (the most recent available), only goes up to October 212, when a new sanctions regime came into place. This new regime is intended to be harsher than its predecessor, so it is likely that the number of sanctions will increase further. 92 Monitoring poverty and social exclusion 213
98 Social security and welfare reform JSA sanctions Chapter 4 Indicator: 34A Around 8, JSA claimants received some sort of sanction in the last year. Both the number of referrals for sanctioning and the actual number of sanctions have doubled since 29. Referrals for sanctions Actual sanctions Number of sanctions (thousands) 1,8 1,6 1,4 1,2 1, Source: DWP tabulation tool; years are the 12 months to October; the data is for Great Britain Indicator: 34B Under-25s make up around a quarter of JSA claimants but around a half of those are sanctioned Proportion of each group (per cent) Claimants Sanctions Source: DWP tabulation tool; JSA statistics are for November 212, sanctions statistics are for the year to October 212; the data is for Great Britain The first graph shows the number of referrals of Jobseeker s Allowance claimants for sanctions and the number where the referral resulted in a sanction. The data shows the total number of sanctions in the 12 months ending in October of the given year. The second graph shows two things. The bar on the left shows the age distribution of Jobseeker s Allowance claimants as a snapshot in November 212. The bar on the right looks at the total number of sanctions of Jobseeker s Allowance claimants between January and October 212 and shows the distribution of these sanctions by the age of the claimant. It is possible for one jobseeker to be sanctioned more than once. Monitoring poverty and social exclusion
99 Chapter 4 Social security and welfare reform 35 The Work Programme Many providers are struggling to meet even the minimum targets for job outcomes through the Work Programme. After a year of operation, more jobseekers have been sanctioned for not attending the Work Programme than have found a job through it. The first graph looks at the three main customer groups on the work programme young JSA claimants (aged under 25), other long-term JSA claimants and ESA claimants. It shows the proportion of job outcomes for each group. A job outcome is someone being placed in paid work that lasts at least six months. The target for younger JSA claimants in the second year of operation of the Work Programme was for 33 per cent of participants to find sustained work. Just under half of providers hit this minimum target. The lowest performing provider achieved this outcome for 25 per cent of its participants. The best performing provider did so for 42 per cent of participants. Job outcomes for older JSA claimants were not quite as good, though the targets themselves are lower. In this group, half of the providers reached the target of 27 per cent job outcomes. The lowest performing provider achieved 16 per cent, and the highest 45 per cent a wider range of outcomes. Both JSA groups fared much better than ESA claimants. Even the best performing provider failed to reach the minimum target of 16 per cent job outcomes, only achieving round half this rate. Half of providers achieved job outcomes of 5 per cent or less and the poorest performing provider did not achieve a single job outcome. This disappointing performance is worth contrasting with the sanctions numbers in indicator 34. Not attending a Work Programme appointment is sufficient reason for a JSA claimant to be sanctioned. Since the Work Programme began, more people have been sanctioned for not participating in it than have found a job through it. As the Work Programme was getting established both the number of sanctions and the number of job outcomes were low. It takes six months to achieve a job outcome whereas a sanction can be applied straight away, but even if we compare sanctions to job outcomes six months later it is still the case that more people got sanctions than found work. 94 Monitoring poverty and social exclusion 213
100 Social security and welfare reform The Work Programme Chapter 4 Indicator: 35A Around half of providers meet the minimum targets for job outcomes for JSA claimants. Not one provider met the minimum target for ESA claimants. Lowest provider Median provider Highest provider Minimum target Proportion of referrals resulting in a job outcome payment (per cent) JSA JSA 25+ ESA Source: DWP Information, Governance and Security Directorate, inclusion calculations; the data is for April 212 to March 213 for Great Britain Indicator: 35B The number of people sanctioned for not attending the Work Programme is greater than the number of people who find work through it. Sanctions Job outcomes JSA claimants (thousands) Sept 211 Oct 211 Nov 211 Dec 211 Jan 212 Feb 212 March 212 April 212 May 212 June 212 July 212 Aug 212 Sept 212 Oct 212 Source: DWP tabulation tool; the data is for Great Britain The first graph shows the performance of different Work Programme providers for three different client groups Jobseeker s Allowance (JSA) claimants under 25, JSA claimants over 25 and ESA claimants. The lowest, highest and median performers are shown for each group, and compared with the minimum target set by the DWP. The second graph shows the number of job placements for JSA claimants through the Work Programme and the number of JSA claimants sanctioned through the Work Programme month by month. The data only runs to October 212, after which the Work Programme did become more effective, but it is likely the sanctions regime also became more punitive. Monitoring poverty and social exclusion
101 Chapter 4 Social security and welfare reform 36 Out-of-work benefits across the UK Within England there is a clear north/south difference in out-of-work benefit claims, but claim rates in Northern Ireland are higher than anywhere else in the UK. In February 213, around 13 per cent of working-age people across the UK claimed an out-of-work benefit. The map shows, however, that in some areas the rate was very much higher. In 59 out of a total of 46 local authorities, at least 18 per cent of working-age people claimed. The map highlights the half of local authorities with the highest rate of out-of-work benefit claims (the 22 local authorities where at least 12 per cent of working-age people claimed). It shows that in Northern Ireland every local authority was in this half. In fact the four local authorities with the highest rate in the UK are in Northern Ireland (Derry, Strabane, Belfast and Limavady and all had rates of at least 25 per cent). All of the local authorities in the North East also rank in the bottom half of the UK on this measure. While in five of its twelve local authorities more than 18 per cent of working-age people claimed an out-of-work benefit, unlike Northern Ireland none of them were above 25 per cent. Within England there is a clear north/south divide. The north had much higher rates, the Midlands about average and only isolated areas of London and the south had a particularly high rate of claims. There were only seven local authorities in the south and east where more than 16 per cent of working-age people claimed an out-of-work benefit. Excluding the two in London, the rest were coastal. The pattern in Wales is broadly similar to that in the North of England. Scotland fared slightly better with around half of its areas in the bottom half for the UK and half in the top, much like the levels in the Midlands. 96 Monitoring poverty and social exclusion 213
102 Social security and welfare reform Out-of-work benefits across the UK Chapter 4 Indicator: 36 Orkney Islands Shetland Islands Greater London Over 18% 16% 18% 14% 16% 12% 14% Less than 12% Source: DSDNI client group analysis, DWP Benefit Caseloads National Statistics (WPLS) for February 213 and ONS 212 mid-year population estimates Monitoring poverty and social exclusion
103 Chapter 4 Social security and welfare reform Commentary Welfare reform has been a major preoccupation of governments for some time. There were substantial changes under the previous Labour Government, such as introducing working and child tax credits, and replacing Incapacity Benefit with Employment and Support Allowance. The Coalition has introduced a wide range of changes: the glossary at the end of this report details more than 2. These reforms affect people both in and out of work. As a package, the reforms so far (excluding the limited introduction of Universal Credit) alter or at least challenge long-standing principles of the social security system. Benefits, which in the past have increased in line with either earnings (up until 198) or inflation, are now being arbitrarily increased by a rate of 1 per cent for three years. The concept of a basic personal allowance for benefits, the amount of money set aside for subsistence, has been challenged by the localisation of Council Tax Support. In some local authorities, claimants are required to pay part of their Council Tax out of this subsistence amount. These are large changes in principle to the operation of the welfare state, and may turn out to be more significant than Universal Credit. The relationship between claimants and the state may also be changing. It is now expected that the claimant commitment part of Universal Credit (UC) (what a claimant agrees to do in exchange for receiving the benefit) will be brought in regardless of whether UC itself is. Part of this cultural change is that people in work are not exempt. Those who work but do not earn enough (equivalent to 35 hours at the minimum wage) are subject to requirements to look for more work or better-paid work. Clearly, the social security system is a key tool in tackling poverty, but it cannot be the only one. The focus on its reform as the only way, or even the main way, to improve low household incomes is misplaced. Moreover, what we have seen in the last 18 months is not real reform, but simply cuts. 98 Monitoring poverty and social exclusion 213
104 Chapter 5 Housing Introduction 1 Choice of indicators Poverty and tenure Affordability Housing benefit claims 16 4 Housing benefit values Repossessions Overcrowding Homelessness Housing benefits across Great Britain 116 Commentary 118
105 Chapter 5 Housing Introduction In 211 there were 27 million dwellings in Great Britain; 17 million were owner-occupied (65 per cent) and the remaining were split fairly evenly between the social (4.9 million) and private (4.6 million) rented sector. Although the private rented sector is the smallest tenure it is the only tenure to have experienced any real growth in the last ten years: the stock of social rented housing fell by 4, between 21 and 211, the owner-occupied stock increased by 3, but the private rented sector almost doubled, increasing by 2.2 million. Looking further back, this is not the largest that the private rented sector has ever been. In million homes were privately rented accounting for about half of the stock. But the ten years to 211 marked the first time since then that private renting has seen any major growth and the first time since then that growth in owner-occupation has stalled. Meanwhile the social rented stock continued its 3-year contraction. Long-term view of tenure Social rented Private rented Owner-occupied Number of dwellings (millions) Source: DCLG live tables; the data is for Great Britain But it is the more recent changes that this report is concerned with. The huge growth in the private rented sector is the point at which our analysis begins. 1 Monitoring poverty and social exclusion 213
106 Housing Choice of indicators For many people housing costs are the largest basic living expense, and this can have a dramatic effect on disposable income. The first indicators explore this by looking at the relationship between tenure and poverty and how this links to the affordability of housing costs. The next two indicators look at how the housing benefits caseload and values have changed. As housing benefits are provided to renters deemed to not have enough income to meet their basic housing costs, these indicators consider a group at the bottom of the income distribution for whom housing costs are problematic. The chapter then looks at the consequence of not being able to afford housing. It looks at the extreme case of homes being repossessed by a county court bailiff. But the indicator on overcrowding looks at a subtler measure of housing problems when the lack of housing either through cost and/or supply means that families live in overcrowded conditions. Finally we look at homelessness where a family s situation is so severe that they are unable to secure any form of suitable housing and the local authority is legally obliged to house them. Chapter 5 Monitoring poverty and social exclusion
107 Chapter 5 Housing 37 Poverty and tenure A fall in the poverty rate and the overall size of the social rented sector means it is no longer the dominant tenure for people in poverty. With an increase of 1.7 million in poverty in the private rented sector over ten years, there are almost as many private as social renters in poverty. In 1996/97 each tenure type had a distinct poverty rate: the highest was 56 per cent for people living in the social rented sector, followed by private renters at 43 per cent, 17 per cent among those who own outright and 12 per cent for those with a mortgage. Over the following 15 years the poverty rate in the social rented sector saw a steady decline, falling to reach a low of 43 per cent in 21/11 and 211/12. The poverty rate among those who own outright has also slowly fallen to reach a low of 12 per cent in 21/11 and 211/12 (this trend is closely linked to the fall in pensioner poverty). The poverty rate for private renters fell towards the end of the 199s but has fluctuated since: in 211/12 it was 37 per cent. For owners with a mortgage it has remained the same at 12 per cent. As a result, there has been a convergence in the poverty rate for social and private renters and a convergence for outright and mortgaged owners. But the poverty rate for renters in 211/12 was still at least three times that of owners. The overall number of people in poverty at 13 million in 211/12 is not much different to that in 21/2. But within this there has been considerable change by tenure. This is the result of changes to the poverty rate but also the number of households overall in each tenure. The number of owners with a mortgage and those that own outright in poverty was slightly lower in 211/12 than in 21/2. But most of the change has been among renters. The number of social renters in poverty fell by 1.5 million and the number of private renters in poverty increased by 1.7 million. In 21/2 the number of social renters in poverty was 2.5 million higher than any other tenure. But by 211/12 there were almost as many private renters in poverty at 3.9 million as social renters at 4.2 million. 12 Monitoring poverty and social exclusion 213
108 Housing Poverty and tenure Chapter 5 Indicator: 37A Fifteen years ago the poverty rate for social renters stood out as much higher than all other tenures. Now the poverty rate for all renters stands out compared with the much lower rate for owners. Social rent Private rent Owned outright Owned with mortgage Proportion of people in low-income households (per cent) / / / / 2/1 21/2 22/3 23/4 24/5 25/6 26/7 27/8 28/9 29/1 21/11 211/12 Source: Households Below Average Income, DWP; the data is for Great Britain to 22/3, and the UK thereafter Indicator: 37B Although the total number in poverty has barely changed over ten years, there have been big changes by tenure. The number of private renters in poverty increased by 1.7 million but for social renters it fell by 1.5 million. Owned outright Owned with mortgage Private rent Social rent Number of people in low-income households (millions) /2 211/12 Source: Households Below Average Income, DWP; the data is for the UK The first graph shows the proportion of people in poverty by tenure group: owned outright, owned with a mortgage, social rented and private rented. The second graph shows the number of people in poverty by tenure in 21/2 and 211/12. People are said to be in poverty if the household income is less than 6 per cent of the median income. Income is disposable household income after housing costs. All data is equivalised (adjusted) to account for differences in household size and composition. In the second graph the data for 21/2 has been adjusted from GB to UK to make it comparable with the 211/12 figure. Monitoring poverty and social exclusion
109 Chapter 5 Housing 38 Affordability The poorest households typically spend more than a quarter of their net income on housing. Poor private renters spend even more. In 211/12 people in the bottom fifth of the income distribution spent on average 29 per cent of their income on housing, twice as much as those on average incomes (15 per cent) and three times the level of the richest fifth (9 per cent). For all income groups, housing costs as a proportion of income rose from 22/3 to 28/9. The poorest fifth saw the biggest increase, of around 6 percentage points. By 21, they were spending, on average, 3 per cent of their income on housing costs. Increases elsewhere in the income distribution were more modest 3 percentage points for the middle fifth and 2 percentage points for the richest fifth. The reason for the fall in 29/1 was due to a fall in the housing costs for owner-occupiers with a mortgage as a result of record low interest rates. The proportion of income spent on housing remained at the 28/9 levels for renters and those who own outright. It follows, then, that the fall should be greatest among the richest fifth, who are the most likely to be mortgage holders. For each tenure group the poorest fifth spend the highest proportion of their income on housing and for each income group, private renters spend the highest proportion of their income on housing. Private renters in the bottom fifth of the income distribution spend on average 56 per cent of their income on housing. The next highest group is owners with a mortgage in the poorest fifth at 34 per cent and social renters in the poorest fifth at 33 per cent. Owner-occupiers without a mortgage had the lowest housing costs as a proportion of their income; never more than 3 per cent regardless of where they were in the income distribution. 14 Monitoring poverty and social exclusion 213
110 Housing Affordability Chapter 5 Indicator: 38A The poorest households spend on average a quarter of their income on housing costs. Poorest fifth Middle fifth Richest fifth Average proportion of income spent on housing costs (per cent) / / / / / / 2/1 21/2 22/3 23/4 24/5 25/6 26/7 27/8 28/9 29/1 21/11 211/12 Source: Households Below Average Income, DWP; the data is for Great Britain to 22/3, and the UK thereafter Indicator: 38B For every income group, private renters spend a greater share of their income on housing and for each tenure the poorest spend a greater share. Poorest fifth Middle fifth Richest fifth Average proportion of income spent on housing costs (per cent) Own outright Own with mortgage Social rent Private rent Source: Households Below Average Income, DWP; the data is the average for 29/1 to 211/12 for the UK The first graph shows for each year and level of income, housing costs as a proportion of disposable income. The second graph shows the average proportion of income spent on housing by income group and tenure. Housing costs are calculated as total income before deducting housing costs less total income after deducting housing costs in the Households Below Average Income dataset. They comprise such items as rent service charges, ground rents, mortgage interest (but not capital) and buildings insurance. For people in receipt of housing benefits, the benefit itself is treated as income while the rent it covers is treated as housing costs. The income groups (quintiles) are based on disposable household income before deducting housing costs. This is preferable, in this instance, to the after housing costs measure which may include in the lower quintiles some households who have high incomes but exceptionally high housing costs. Monitoring poverty and social exclusion
111 Chapter 5 Housing 39 Housing benefit claims After increasing by 1 million between 27 and 212 the growth in the number of housing benefit claims slowed in 213. Much of this was due to a fall in claims by younger single adults. In 213 there were 5 million housing benefit claimants; 3.4 million in the social rented sector and 1.7 million in the private rented sector. In the five years to 212 the number of housing benefit claims grew by 1 million; most of the growth was among claimants in the private rented sector (up by 74,). As a result the proportion of all housing benefit claimants living in the social rented sector has fallen from more than three-quarters (77 per cent) in 27 to two-thirds (67 per cent) in 212. Between 212 and 213, the number of housing benefit claims grew by only 4,, compared with increases of more than 1, in each of the preceding three years. But almost all of this growth (35,) was in private rented sector claims. However, in the year to May 213 the number of single adults under 35 claiming housing benefit fell by 19, in the private rented sector and 7, in the social rented sector. For all other family types the number of claims in the private rented sector grew. The number of claimants aged 6 and over in the social rented sector also fell; this was almost entirely among those aged 7 plus. Given that there has been a number of changes to Local Housing Allowance (LHA the name for housing benefit for people living in the private rented sector) introduced under the current government it is not surprising that growth in housing benefit claims has slowed. But it appears that the change that has made the biggest impact is lowering the bedroom entitlement of single people aged 25 to 35, from a one-bedroom property to a single room in a shared house. 16 Monitoring poverty and social exclusion 213
112 Housing Housing benefit claims Chapter 5 Indicator: 39A The number of housing benefit claims was around one million higher in 213 than 27. Most of this increase was in the private rented sector. Private rent Social rent Number of housing benefit claimants (millions) Source: Housing Benefit Statistics, DWP; the data is for Great Britain Indicator: 39B Overall housing benefit claims by private renters grew by 35, between 212 and 213, but there was a fall in claims by single younger adults. Private rent Social rent -3 Single, no child dependent Single with child dependent(s) Couple, with or without child dependent(s) Single, no child dependent Single with child dependent(s) Couple, with or without child dependent(s) Change in the number of housing benefit claims between 212 and 213 (thousands) Under Overall Source: Stat-Xplore, DWP; the data is for May 213 for Great Britain The first graph shows the number of people claiming a housing benefit in the private and social rented sectors. There is no data for 28 when Local Housing Allowance was introduced to replace Housing Benefit in the private rented sector. Data before 29 was based on clerical returns from local authorities. More recent data is based on a monthly electronic scan of local authorities claimant level data. The second graph shows the change in the number of housing benefit claims made by different family types and age groups. Monitoring poverty and social exclusion
113 Chapter 5 Housing 4 Housing benefit values Many factors have contributed to the increase in spending on housing benefit in the last ten years: an increase in claimants, the increase in rent levels and the shift of claimants from the social to private sector. The average housing benefit claim in 213 was 9 per week. Housing benefit values were 3 per cent higher in the private rented sector at 16 per week than in the social rented sector at 82 per week. As the social rented sector is regulated and subsidised the rents charged to tenants are restricted; 7 per cent of housing benefit claims in the social rented sector in 213 were for between 5 and 1 per week. In the private rented sector there is no such regulation landlords are free to set the rent levels. Only 47 per cent of private rented housing benefit claims were for 5 to 1 per week, a further 4 per cent were for claims of more than 1 per week, twice the level of the social rented sector (19 per cent). Between 23 and 213 the average benefit amount in the private rented sector grew 48 per cent (up by 34) and in the social rented sector it grew by 57 per cent (up by 3). This is not surprising: the amount of housing benefit claimed will generally increase in line with rents. But the overall housing benefit amount claimed grew by 61 per cent over ten years, higher than either sector. This is because there has been a shift in the proportion of claimants living in the more expensive private rented sector. In the last two years the average value of housing benefit in the private rented sector fell, by 5 in 212 and 1 in 213, despite rising rents. This is probably mainly due to the changes to Local Housing Allowance entitlement (housing benefit for private renters) from April 211, which included capping the amount that can be claimed to the cost of the cheapest 3 per cent of properties in an area and limiting growth in claims to the lower of either average market rent growth or the consumer price index. 18 Monitoring poverty and social exclusion 213
114 Housing Housing benefit values Chapter 5 Indicator: 4A Since 211 the average amount of housing benefit paid to private renters has fallen, but for social renters it continues to increase. Private rent Social rent All tenures Average housing benefit claim amount ( per week) Source: Housing Benefit Statistics, DWP; the data is for Great Britain Indicator: 4B Around 7 per cent of housing benefit claims in the social rented sector are for between 5 and 1 per week; claims in the private rented sector are on average much higher and more widely spread. Private rented sector Social rented sector Proportion of housing benefit claimants in sector (per cent) Up to to 5 5 to to 1 1 to to to to 2 2 to to and above Source: Stat-Xplore, DWP; the data is for May 213 for Great Britain The first graph shows the average housing benefit claim amount in pounds per week each year from 23 to 27 and 29 to 213. It also shows the values for the social rented sector and the private rented sector separately. There is no data for 28 when Local Housing Allowance was introduced to replace Housing Benefit in the private rented sector. Data before 29 was based on clerical returns from local authorities. More recent data is based on a monthly electronic scan of local authorities claimant level data. The second graph shows the proportion of housing benefit claimants in the social and private rented sectors, by the amount of housing benefit claimed per week in 25 bands. Monitoring poverty and social exclusion
115 Chapter 5 Housing 41 Repossessions Mortgage repossessions are on a general downward trend and landlord repossessions an upward one, but the landlord repossession problem is dominated by London whereas mortgage repossession is still a bigger problem in the North of England. County court bailiffs repossessed around 18, mortgage-holding homes in 212/13, but the number of landlord repossessions was almost double at 33,. After increasing over a period of five years, the level of mortgage repossessions peaked in 28/9 when just under 37, homes were repossessed by a county court bailiff. Four years later this number had halved, although the fall has not been consistent year-on-year. From the mid-2s the number of landlord repossessions was on a downward trend, falling from 33, in 25/6 to a low of 25, in 29/1, but since then the number has risen. Excluding 28/9 and 29/1 the number of landlord repossessions has been higher than the number of mortgage repossessions. In Wales and every region in England the rate of landlord repossessions was higher in 212/13 than it was in 21/11. London has by far the highest rate at 8.5 per cent, more than double any other region. It has also seen the biggest growth, up from 5.6 per cent. But the rate in the South and East, although much smaller, has almost doubled from 1.7 per cent, to 2.9 per cent. In every area shown in the graph the rate of mortgage repossessions has fallen. The North of England had the highest rate of mortgage repossessions at 3.3 per cent, closely followed by Wales at 3.2 per cent. These are the only two areas where the rate of mortgage repossessions is higher than that for landlords. The data points to a north/south divide: mortgage repossessions being the bigger issue in the North and Wales, and landlord repossessions being a big and growing issue in London and even the South and East. 11 Monitoring poverty and social exclusion 213
116 Housing Repossessions Chapter 5 Indicator: 41A The number of mortgage possessions has exceeded the number of landlord possessions in only two of the last ten years. Landlord possession Mortgage possession Number of possessions by a county court bailiff (thousands) /4 24/5 25/6 26/7 27/8 28/9 29/1 21/11 211/12 212/13 Source: Mortgage and landlord possession statistics, Ministry of Justice; the data is for England and Wales Indicator: 41B In London the rate of landlord orders is twice that of any other region. The north of England has an average level of landlord orders but the highest level of mortgage orders. 21/11, landlord 212/13, landlord 21/11, mortgage 212/13, mortgage Number of landlord/mortgage possessions per 1, renting/mortgage-holding households London Midlands North and Yorkshire South and East Wales North and Yorkshire Wales Midlands London South and East Landlord Mortgage Source: Mortgage and landlord possession statistics, Ministry of Justice and English Housing Survey, DCLG The first graph shows the number of mortgaged homes and rented homes that were repossessed by a county court bailiff in each financial year from 23/4 to 212/13. The second graph shows the number of landlord repossessions per 1, renting households and the number of mortgage repossessions per 1, mortgage-holding households. This rate is given for 21/11 and 212/13 across different parts of England and Wales. Monitoring poverty and social exclusion
117 Chapter 5 Housing 42 Overcrowding Overall levels of overcrowding have hardly changed, but this masks the increase in the overcrowding rate in rented households and the high level in cities. The social rented sector is the most overcrowded tenure, followed by the private rented sector and then owner-occupiers. In 1996/ per cent of social rented households were overcrowded. The rate for private renters was 3.1 per cent and for owners it was 1.7 per cent. But in the following 15 years the proportion of private rented homes that were overcrowded increased almost every year to reach 5.7 per cent in 211/12. In the last ten years the rate of overcrowding in the social rented sector has also increased, but in the last year it has fallen to 6.6 per cent. So the rate of overcrowding in both rented tenures has risen and converged. Conversely in the owner-occupied sector the level of overcrowding has fallen slightly each year and reached a low of 1.3 per cent in 211/12. The level of overcrowding is generally higher in cities. London is the most overcrowded city in England and Wales: in 211, 12 per cent households in London were overcrowded, the only city where the level of overcrowding was above 1 per cent. 18 per cent of London s renting households were overcrowded. As the level of overcrowding is so much higher in the social and private rented sectors, the overall level in an area depends in part on what proportion of all households are rented. Bristol, Sheffield and Cardiff rank fifth to seventh in terms of overall level of overcrowding at 5 per cent. But they rank third to fifth in terms of overcrowding in the social rented sector, at 8 to 1 per cent. This is because the social rented sector makes up a smaller share of their housing than in other cities. The level of overcrowding in Manchester, Nottingham and Newcastle is notably higher in the private rented sector than in the social rented sector (by at least 2 percentage points). 112 Monitoring poverty and social exclusion 213
118 Housing Overcrowding Chapter 5 Indicator: 42A Around 6 per cent of renting households were overcrowded in 211/12, more than four times the level for owner-occupiers. Social renters Private renters All tenures Owner-occupiers Proportion of households that are overcrowded (bedroom standard) (per cent) / / / / 2/1 21/2 22/3 23/4 24/5 25/6 26/7 27/8 28/9 29/1 21/11 211/12 Source: Survey of English Housing up to and including 27/8, English Housing Survey 28/9 onwards, DCLG; the data is a three-year moving average for England Indicator: 42B The level of overcrowding in the private rented sector is just as high or higher than in the social rented sector in some cities. Social rented Private rented or Living rent free All households Proportion of households that are overcrowded bedroom standard (per cent) London Birmingham Manchester Nottingham Bristol, City of Sheffield Cardiff Newcastle upon Tyne Liverpool Leeds Elsewhere in England and Wales Source: Census 211 via NOMIS The first graph shows the proportion of households that were overcrowded by tenure for each year from 1996/97 to 211/12. The data is a three-year rolling average ending with the year labelled on the axis. The second graph shows the proportion of households that were overcrowded in 211 in different urban areas and for the rest of England and Wales. The rate is shown separately for social rented households, private rented households or those that live rent free, and for households of any tenure (including owner-occupation). Overcrowding is measured using the bedroom standard which is an indicator of occupation density. The required number of bedrooms is calculated for each household according to its composition the age, gender and relationships of its members. Households are overcrowded if they have fewer bedrooms available than the number required by the bedroom standard. Monitoring poverty and social exclusion
119 Chapter 5 Housing 43 Homelessness Homelessness acceptances have been increasing since 29/1 and households in temporary accommodation have been increasing since 21/11. But there has also been a disproportionate growth in households placed outside their borough and those becoming homeless following a shorthold tenancy. After increasing for three consecutive years, the number of households accepted as homeless in England reached 53, in 212/13. But this is still much lower than its peak of 135, in 23/4. The number of homelessness acceptances fell sharply between 23/4 and 29/1 and the subsequent increase has been much more gradual. But the increase has been consistent and given that the steps taken to reduce homelessness in the mid-2s cannot be repeated, the rise should be of real concern. The number of households living in temporary accommodation as the result of being homeless shows a similar trend to homelessness acceptances but lags about a year behind. It peaked at 11, in 24/5 and reached a low point six years later at 48, in 21/11. It is also now increasing and reached 55, in 212/13. Most households in temporary accommodation were located within the local authority in which they lived previously. Over the last ten years between 5, and 12, households have been placed outside their area. This number has grown at a faster rate than households placed within their area. At the end of 212/13 16 per cent of households in temporary accommodation were living outside of their area (9, households) compared with 11 per cent (5,4 households) in 29/1. Between 29/1 and 212/13 the number of homelessness acceptances rose from 4, to 53, (up by 34 per cent). The most common reason for homelessness in 212/13 was that relatives/friends were no longer willing to provide accommodation. This accounted for 17, homeless households, up by 3, since 29/1. But households becoming homeless because of the end of a shorthold tenancy more than doubled over three years to reach 12, in 212/13. This reason alone accounts for more than half of the growth in homelessness acceptances since 29/ Monitoring poverty and social exclusion 213
120 Housing Homelessness Chapter 5 Indicator: 43A Despite rising in recent years, the number of households accepted as homeless is still much lower than its 23/4 peak. In temporary accommodation within their area In temporary accommodation outside their area Accepted as homeless Number of households (thousands) /3 23/4 24/5 25/6 26/7 27/8 28/9 29/1 21/11 211/12 212/13 Source: Quarterly P1(E) returns, DCLG; the data is for England Indicator: 43B Much of the growth in homelessness is due to tenancies being ended. The number has more than doubled in three years. 29/1 212/13 Households accepted as owed a main homelessness duty (thousands) Relatives/friends no longer able or willing to provide accommodation Relationship breakdown with partner Mortgage or rent arrears End of assured shorthold tenancy Other Source: Quarterly P1(E) returns, DCLG; the data is for England The first graph shows the number of households newly accepted by their local authority as unintentionally homeless and falling within a priority need group each year. The bars show the number of people living in temporary accommodation under homelessness provision at the end of the financial year. It is split to show whether or not the accommodation is within the local authority area in which they were originally accepted as homeless. The second graph shows those newly accepted as unintentionally homeless and falling within a priority need group in 29/1 and 212/13 by their reason for homelessness. It is important to note that the measures in the first graph are different types. The number of people newly accepted as homeless is cumulative over the period while the number of people living in temporary accommodation is a point-in-time number at the end of the year. Monitoring poverty and social exclusion
121 Chapter 5 Housing 44 Housing benefits across Great Britain There are high levels of housing benefit claims across London and the North East but there are still isolated areas where there are high levels across the South of England. In May 213 around 2 per cent of households relied on housing benefit to cover some or all of their housing costs. But in just over half of local authorities in Great Britain (194 out of 379) less than 17 per cent of households claimed housing benefit. The average of 2 per cent, despite the majority of local authority areas having a rate below this, can be explained by the much higher rates in some local authority areas. In 5 local authorities at least a quarter of households claimed housing benefit. The highest rates tended to be in London; 8 of the 1 highest local authorities, where at least a third of households claimed housing benefit, were in London. London s high rate of housing benefit claims is linked to the high proportion of people who rent their homes generally. Housing benefit can only be claimed by those who pay rent, so an area with a high proportion of renters will have higher proportion of households that might claim. But a high level of renting does imply an issue of housing costs generally as fewer households are able to access home ownership. While London contains the areas with the very highest rates of housing benefit claimed, every local authority in the North East is in the top half. In 6 of the 12 local authority areas in the North East more than 25 per cent of households claimed housing benefit. Alongside London and the North East, Wales, the North West, Yorkshire and the Humber and Scotland all have more than half of their local authorities in the bottom half of the distribution (i.e. more than their fair share). Within England, and excluding London, there does seem to be a north/south divide with many more areas with high housing benefit claims in the north, fewer areas in the south and an average amount in the midlands. But there are also a number of isolated areas in the South and East of England with high levels of housing benefit claims, often, but not exclusively, in larger urban centres or coastal towns. The map shows the proportion of households that rely on housing benefit to cover their housing costs in each local authority area in Great Britain. Local authorities have been split into five groups based on the proportion of housing benefit claimants in that area: the lowest half of authorities, and the remaining half split into four broadly equal size groups. The data is derived by dividing the number of housing benefit claimants in May 213 by the number of households in the local authority area according to the Census. 116 Monitoring poverty and social exclusion 213


122 Housing Housing benefits across Great Britain Chapter 5 Indicator: 44 Orkney Islands Shetland Islands Greater London 25% or more 22% up to 25% 2% up to 22% 17% up to 2% Less than 17% Source: Stat-Xplore, DWP and Census, ONS; the data is for May 213 Monitoring poverty and social exclusion
123 Chapter 5 Housing Commentary In the last ten years the private rented sector was the only growing tenure. Private renting need not be linked to poverty, but at the moment it clearly is. Accepting that the sector is now a major share of the housing stock, making improvements within it is a sensible approach. In 212 and 213 the Communities and Local Government Committee conducted an inquiry into the private rented sector. The result was a list of sensible if predictable measures: clearer regulation, flexibility for councils, clamping down on rogue landlords, longer tenancies, and a more systematic approach to rent levels. However there was no mention of poverty in the report. This chapter has shown a rising inequality between renters and owners. For owners the situation is fair or improving (lower housing costs and overcrowding levels, falling repossessions). For renters the situation is bad or worsening (high poverty rates and housing costs, increasing homeless acceptances). In addition, through changes to housing benefit (LHA caps, the under-occupation penalty and the overall benefit cap) the government is exacerbating the problem. As the impact is felt solely on renters towards the bottom of the income scale, not only will the gap between renters and owners grow but so will the gap between the higher and lower income renters. This shift in poverty from the social rented sector to the private rented sector (see indicator 37B) raises another issue for policy. The social rented sector has regulated rents and large registered landlords, so the cost of housing is contained and landlords have to visibly meet their obligations to the tenant. In the private rented sector no such systems are in place. The increasing number of low-income families living in the tenure with the fewest rights, the highest mobility and with no obvious channel of engagement poses a new challenge for tackling poverty. 118 Monitoring poverty and social exclusion 213
124 Chapter 6 Health Introduction 12 Choice of indicators Infant mortality Childhood obesity Under-age pregnancy Premature death Unpaid caring responsibilities 13 5 Life expectancy by local authority 132 Commentary 134
125 Chapter 6 Health Introduction The overall trends in health across the UK over the medium term are very positive. People live longer and are in better health today than ever before. The graph below shows one aspect of that; the proportion of people aged 55 who do not live to age 75. The graph goes back to 198, when 5 per cent of men aged 55 would not live for 2 more years. That figure is now 24 per cent. For women, the proportion fell from 3 per cent to 18 per cent, a smaller fall in both absolute and proportionate terms. Proportion of men and women aged 55 not living to age 75 Men aged 55 Women aged 55 Proportion of people aged 55 not living to age 75 (per cent) Source: ONS life tables; the data is for the UK This is one of the recurring patterns of these indicators that overall levels of health are improving, and at a faster rate for men than for women, closing the overall gap in outcomes between them. But inequalities between genders are only part of the picture. This chapter looks in more depth at inequalities by income, from infants to older adults. Those gaps are not closing as consistently, and that is where the challenge for policy-makers lies. 12 Monitoring poverty and social exclusion 213
126 Health Choice of indicators This chapter takes a life-course approach, beginning with an indicator on infant mortality. This analysis gives us a starting point for the chapter, and shows how health inequalities are established early. The next indicator looks at slightly older children, aged 4 and 11, and looks at rates of obesity for boys and girls. Again, the inequalities by income are stark. Under-age pregnancy does have implications for the health of the mother and child, but it is often seen as indicative of some other form of exclusion or deprivation. The trends and geographical patterns form the analysis here. Completing the life course approach we look at premature death, that is death before the age of 65, and inequalities in life expectancy. This indicator more than any other shows how health outcomes have improved for all, but not at the same rate, meaning inequalities are widening. The final pair of graphs in this chapter look at the number of people with caring responsibilities a different aspect of poor health. The link with poverty here is the high proportion of carers who are not in paid work, simply because their caring responsibilities come first. The chapter ends with a map of life expectancy across the local authorities of England, Scotland and Wales. Chapter 6 Monitoring poverty and social exclusion
127 Chapter 6 Health 45 Infant mortality Although inequalities remain, rates of infant mortality have fallen for all social groups and in all parts of the country. Between 21 and 211, the rate of infant mortality (deaths among children aged under one, excluding stillbirths) fell among all social classes. The lowest rate remains among children born to parents in managerial and professional jobs, at just under 3 per 1, live births in 211. In 21, the rate was 3.7 per 1,. The highest rates are found among babies born to parents in routine and semi-routine jobs, although this group has also seen the largest fall in the infant mortality rate. In 211, 4.8 babies per 1, live births died before the age of one, compared with 6.9 a decade earlier. So the gap in the rate between the routine and semi-routine classes and the managerial and professional classes has narrowed from 3.2 to 2.7 deaths per 1, live births. The rate of infant mortality of babies born to parents in routine and semi-routine jobs is now around the level of those born to parents in intermediate jobs a decade ago. Though less eye-catching, there has also been a fall in the infant mortality rate for babies born to parents in intermediate professions, from 4.7 in 21 to 3.5 in 211. This, again, has closed the gap on the managerial and professional social class, from 1 death per 1, to.5. The rate of infant mortality among the intermediate social class is now around where the managerial social class was a decade ago. Similarly, there have been falls in infant mortality across all regions of England and Wales. The region with the highest level is the West Midlands, with an infant mortality rate of 5.8 per 1,. Yorkshire and the Humber is the only other region with a rate above 5 per 1,. The lowest rates are found in the South East and South West; 3.7 and 3.6 respectively. In fact, the rate in the West Midlands and Yorkshire are, despite recent falls, higher than the rate in the South East and South West ten years ago. 122 Monitoring poverty and social exclusion 213
128 Health Infant mortality Chapter 6 Indicator: 45A Despite falling in the last decade, the rate of infant mortality for babies whose parents work in routine jobs is almost double that for those whose parents are in the managerial or professional class Infant deaths per 1, live births Managerial and professional Intermediate, small employers and lower supervisory Routine and semi routine Source: Infant and perinatal mortality in England and Wales by social and biological factors, ONS; the data is for 211 Indicator: 45B While infant mortality has fallen in all regions, the overall pattern remains the same, with the higher rates in the West Midlands and Yorkshire and the lowest rates in the South East and South West Infant mortality per 1, live births West Midlands Yorkshire and the Humber North West East Midlands London Wales East of England North East South East South West Source: Neighbourhood Statistics, ONS; the data is for England The first graph shows a breakdown of infant mortality by the social class of the father. Births outside marriage where the father is not present at the birth are not included. The class Never worked and long-term unemployed is also excluded for reasons of small numbers. Infant mortalities are deaths before the age of one and exclude stillbirths. They are expressed as a proportion of live births. The second graph shows changes over time in England s regions and Wales. Figures are three-year averages. Monitoring poverty and social exclusion
129 Chapter 6 Health 46 Childhood obesity The level of obesity is rising, if slowly, among teenagers. There are significant differences in rates by gender and, particularly, income. Over the five years from 26/7 to 211/12 there was little change in the proportion of reception-aged children (four-year-olds) who were obese. Over this period, a fairly constant 1 per cent of boys and 9 per cent of girls were obese. It is possible to discern a slight fall in the level among boys, but it is a fall of less than 1 percentage point. Among children in Year 6 (1- to 11-year-olds) not only is the level of obesity higher, but it is rising. Roughly twice as many Year 6 boys as reception-aged boys are obese 21 per cent in 211/12 compared with 1 per cent. For girls, the difference between age groups is also double 18 per cent compared with 9 per cent. This also means that the gap between boys and girls is greater among Year 6 than reception-age children. Among those in Year 6, the level of obesity has grown in the last five years by 2 percentage points for both boys and girls. However, most of that growth was earlier in the series. It may be that the trend has now flattened. As well as differences by gender, there are stark differences by deprivation rates of obesity rise in direct proportion to the level of deprivation. Some 12 per cent of reception-age children living in the most deprived decile of areas are obese, compared with 7 per cent of children in the least deprived areas and 1 per cent of children on average. In Year 6, the proportion of obese children in the most deprived areas reaches 24 per cent compared with 14 per cent in the least deprived areas and 2 per cent on average. So not only is obesity more common among older children, but the gap between deprived and non-deprived areas grows. 124 Monitoring poverty and social exclusion 213
130 Health Childhood obesity Chapter 6 Indicator: 46A In the last five years there has been a small increase in levels of obesity among Year 6 pupils but no increase among reception-age pupils. Boys Girls Proportion of children who are obese (per cent) /7 27/8 28/9 29/1 21/11 211/12 Reception 26/7 27/8 28/9 29/1 21/11 211/12 Year 6 Source: Health and Social Care Information Centre, Department of Health; the data is for England Indicator: 46B The proportion of children who are obese in both Reception and Year 6 rises with the deprivation of the area they live in. Children in the most deprived decile are almost twice as likely to be obese as those in the least deprived decile. Reception Year 6 Proportion of children that are obese (per cent) Least deprived decile Most deprived decile Source: Health and Social Care Information Centre, Department of Health; the data is for 211/212 for England The first graph shows levels of obesity among boys and girls at two different ages age 4 (Reception) and age 11 (Year 6). Childhood obesity is measured relative to the height and weight of the child population in that age group, rather than using the fixed threshold used for adults. The second graph shows levels of obesity for two age groups according to the deprivation of the area in which the school is located according to the Indices of Multiple Deprivation. Monitoring poverty and social exclusion
131 Chapter 6 Health 47 Under-age pregnancy Long seen as emblematic of the problem of child poverty in the UK, the rate of under-age pregnancy has fallen significantly in recent years, and every part of the country has seen a fall. In 211, the rate of under-age conceptions (including births and abortions) fell to just over 6 per 1, girls aged This is the lowest level over the period for which we have data, and compares with a rate of 9 per 1, in In 211, both births (2.4 per 1,) and abortions (3.7 per 1,) were at their lowest level over this period. This fall is part of a broader trend in teenage (not necessarily under-age) pregnancies, which in 211 reached their lowest level since the 196s. As recently as 27, rates of under-age conception were around 8 per 1, girls aged 13 15, the same level as Having barely fallen at all for eight years, they have fallen steeply and consistently in the four years since, births falling by.7 per 1, and abortions by 1.3 per 1,. Over the longer term, though, births have fallen by more than abortions. The differential fall in rates of under-age pregnancy across regions may help explain the overall fall. In some areas, such as the North East and North West, there has been little or no change in the rate, remaining at 9.5 and 8 per 1, respectively. In London, however, the fall has been much more pronounced. From 1 per 1, in 21 23, the highest rate in the country, the rate of under-age pregnancy fell to just under 7 per 1,, almost exactly the national average. It is worth noting that although the rates of change may be different between English regions, not one region saw a rise in under-age conceptions over the course of the last decade. The fall in Wales was also notable, from 8 per 1, to 7 per 1,. 126 Monitoring poverty and social exclusion 213
132 Health Under-age pregnancy Chapter 6 Indicator: 47A The rate of under-age pregnancy is now at its lowest in at least 13 years. After years of little change both births and abortions have been falling since 27. Births Abortions Conceptions per 1, girls aged Source: Teenage conception and outcome, ONS; the data is for England and Wales Indicator: 47B Under-age conceptions have fallen throughout England and Wales. The biggest fall was in London, which used to have the highest rate and is now at the average level Conceptions per 1, girls aged North East Yorkshire and the Humber North West West Midlands Wales London East Midlands South West East of England South East Source: Under-16 conception numbers and rates by area, ONS; the data is for England and Wales The first graph shows the number of conceptions to girls aged under 16 as a proportion of the 13- to 15-year-old population. The second graph shows the levels of under-age conception in England s regions and Wales. A three-year average is used to make the statistic more reliable. Monitoring poverty and social exclusion
133 Chapter 6 Health 48 Premature death Overall improvements in health mean that the rates of premature death have fallen substantially over the last two decades. As the gap closes between male and female health outcomes, the gap between deprived and non-deprived areas gets wider. In 211, the rate of premature death that is, the number of deaths under the age of 65 fell to 22 per 1, for men and 132 per 1, for women. Twenty years ago, the figures were 322 and 191 respectively. This means the rate for men has fallen much more quickly than for women, though from a much higher starting point. In fact, the rate for men in 211 is around the same as the rate for women in The second graph looks at life expectancy, again analysing changes for men and women over time. It also looks at differences by the deprivation of the area. Men in less deprived areas have longer life expectancies than men in areas of average deprivation. In the least deprived fifth, male life expectancy is 2.7 years higher than the male average. It is 1.3 years higher in the next least deprived fifth. Both these figures are very slightly higher than at the beginning of the last decade. In more deprived areas life expectancy is lower than the average, and this gap is growing. Male life expectancy is now 5.5 years below average in the most deprived fifth, compared with 5.2 years in 24. So the gap between the middle and the bottom is greater than the gap between the middle and the top, and it is growing faster. Women s life expectancy is longer than men s for any given level of deprivation but this gap is closing. This is most notable among women in the most deprived fifth of areas. Whereas between 21 and 24 their life expectancy was.7 years above the male median, it is now the same. So the average male can now expect to live as long as the poorest fifth of women. Men in the least deprived fifth now have a life expectancy above women in the poorest two-fifths. This was not the case at the beginning of the 2s. 128 Monitoring poverty and social exclusion 213
134 Health Premature death Chapter 6 Indicator: 48A The risk of premature mortality has fallen substantially over the last 2 years. The risk for men has fallen fastest, closing the gap between men and women. Men Women Deaths under the age of 65 per 1, standardised population Source: ONS for England and Wales and GRO for Scotland Indicator: 48B Health inequalities have declined between men and women but have grown between deprived and non-deprived areas. Average male life expectancy is now the same as that for women in the most deprived areas. Difference from male median 21 4 Difference from male median 27 1 Difference in life expectancy compared with male median in that year (years) Least deprived fifth 4 Median 2 Most deprived fifth Least deprived fifth 4 Median 2 Most deprived fifth Women Men Source: Inequalities in disability-free life expectancy by area deprivation, ONS; the data is for 21-4 to 27-1 for England The first graph shows the rate of premature deaths for men and women. Premature deaths are deaths before the age of 65. Changes in the age profile of the overall population will increase or decrease the number of premature deaths, so to calculate the rate the population is standardised to make year-on-year comparisons possible. The second graph shows life expectancy for men and women compared with the male median. The graph shows the difference between the life expectancy of each group men and women, by the deprivation of the area they live in and the life expectancy of a man in an area of average deprivation (essentially, the male average). If the bar is above the line, then that group has a greater life expectancy than the male average. Below the line means the life expectancy is less than the male average. The bars show the difference in 21 4 and the difference in Monitoring poverty and social exclusion
135 Chapter 6 Health 49 Unpaid caring responsibilities Although those most likely to provide 2 hours of care are not working-age, over a third of carers are also in work. In 211, 3.9 per cent of people in England and Wales provided at least 2 hours of unpaid care per week. The proportion of people providing unpaid care was lowest among younger age groups and increases with age. For those aged 25 34, 2.3 per cent provided care, rising with each age group to 7.2 per cent for those aged In 21, 3.4 per cent of people in England and Wales provided at least 2 hours of unpaid care, so there has been a small increase.3 percentage points over ten years but for different age groups the direction of change has varied. Among those aged 44 and under the level has hardly changed since 21. Meanwhile for those aged the level has gone down; the biggest fall was of a percentage point for those aged to 5 per cent. But for those aged 75 and over the level has increased by 2 percentage points. Over a third of people who provide at least 2 hours care per week were also in work in 211: 22 per cent were in full-time work and 14 per cent were in part-time work. Although this is lower than the average for people who do not provide unpaid care (62 per cent are in work), it is high given that this work is done alongside providing at least 2 hours of unpaid care. Also many of the rest are not of working-age: 36 per cent are retired. The work rates for adults who provide 1 to 19 hours per week of care are very similar to those that do not provide care at 66 and 62 per cent respectively. Although, for those providing care, a greater share of the work done is part-time; 22 per cent of these carers work part-time compared with 16 per cent of non-carers. 13 Monitoring poverty and social exclusion 213
136 Health Unpaid caring responsibilities Chapter 6 Indicator: 49A The proportion of people with unpaid caring responsibilities has risen for all age groups with the exception of those aged Proportion of people in age group providing 2 or more hours of unpaid care per week (per cent) Source: Census 21 and 211; the figures are for England and Wales Indicator: 49B Over half of those who provide over 2 hours care per week are either retired or economically inactive. Still, however, around 2 per cent are in full-time work. Other Economically inactive Retired Unemployed Part time Full time Proportion of people aged 16+ excluding students (per cent) Provides no unpaid care Provides 1 19 hours unpaid care a week Provides 2 or more hours unpaid care a week Source: Census 211, via NOMIS; the data is for England and Wales The first graph shows the proportion of people in different age groups that provided 2 or more hours of unpaid care per week in 21 and 211. The second graph shows the economic activities breakdown of people aged 16 and over. The data is shown separately for those who do not provide unpaid care, those who provide 1 19 hours of unpaid care per week and those who provide at least 2 hours of unpaid care per week. Full-time students have been removed from the second graph. A person is a provider of unpaid care if they look after or give help or support to family members, friends, neighbours or others because of long-term physical or mental ill-health or disability, or problems related to old age. This does not include any activities as part of paid employment. The care can be provided within or outside their own household. Monitoring poverty and social exclusion
137 Chapter 6 Health 5 Life expectancy by local authority Below average life expectancy is most common in the North of Britain, which can in part be explained by the number of large cities in the North. Above average life expectancy is concentrated in the rural south. There is a clear north/south divide in life expectancy in Great Britain. Of the ten local authorities where male life expectancy is below 75, seven are in Scotland and the remaining three are in the North West. Almost every single local authority where male life expectancy is over 81 is in the South of England. Part of the north/south split is explained by a significant urban/rural difference. The north has more large cities, and places like Birmingham, Manchester, Liverpool, Glasgow, Sheffield and Newcastle all have life expectancies well below the average. Most of the areas with high life expectancies are more rural areas in the south, but rural areas in the north also have longer average life expectancies than urban areas. But while the north/south urban/rural differences do matter, the most striking difference is between Scotland and elsewhere. All of Scotland bar one local authority is below the national average for life expectancy, and Glasgow stands out, with a life expectancy of 71.6, almost seven years below the national average. The gap between Glasgow and Manchester, the English local authority with the lowest life expectancy, is 2.1 years. That range covers the 15 local authorities in England with the lowest life expectancies. The map shows life expectancy for all local authority areas across the UK. It uses a three-year average of as this is the most recent available for all four countries. 132 Monitoring poverty and social exclusion 213

138 Health Life expectancy by local authority Chapter 6 Indicator: 5 Orkney Islands Shetland Islands Greater London Under Over 81 Source: ONS Interim Life Tables for England and Wales, GRO Scotland and NISRA Interim Life Tables for Northern Ireland Monitoring poverty and social exclusion
MONITORING POVERTY AND SOCIAL EXCLUSION 2013
 MONITORING POVERTY AND SOCIAL EXCLUSION 213 The latest annual report from the New Policy Institute brings together the most recent data to present a comprehensive picture of poverty in the UK. Key points
Monitoring poverty and social exclusion 2009
 Monitoring poverty and social exclusion 29 December 29 Findings Informing change The New Policy Institute has produced its twelfth annual report of indicators of poverty and social exclusion in the United
MONITORING POVERTY AND SOCIAL EXCLUSION 2015
 MONITORING POVERTY AND SOCIAL EXCLUSION 2015 This annual review by the New Policy Institute brings together indicators covering poverty, work, education and housing. It looks at changes over the last parliament
MONITORING POVERTY AND SOCIAL EXCLUSION IN SCOTLAND 2015
 MONITORING POVERTY AND SOCIAL EXCLUSION IN SCOTLAND 2015 This study is the seventh in a series of reports monitoring poverty and social exclusion in Scotland since 2002. The analysis combines evidence
MONITORING POVERTY AND SOCIAL EXCLUSION 2016
 MONITORING POVERTY AND SOCIAL EXCLUSION 2016 This latest annual report from the New Policy Institute brings together the most recent data to present a comprehensive picture of poverty in the UK. Key points
DECEMBER 2006 INFORMING CHANGE. Monitoring poverty and social exclusion in Scotland 2006
 DECEMBER 2006 findings INFORMING CHANGE Monitoring poverty and social exclusion in Scotland 2006 The New Policy Institute has produced its 2006 edition of indicators of poverty and social exclusion in
MONITORING POVERTY AND SOCIAL EXCLUSION IN NORTHERN IRELAND 2016
 MONITORING POVERTY AND SOCIAL EXCLUSION IN NORTHERN IRELAND 216 This Findings from the New Policy Institute brings together the latest data to show the extent and nature of poverty in. It focuses on the
Poverty and Income Inequality in Scotland: 2013/14 A National Statistics publication for Scotland
 Poverty and Income Inequality in Scotland: 2013/14 A National Statistics publication for Scotland EQUALITY, POVERTY AND SOCIAL SECURITY This publication presents annual estimates of the percentage and
INDICATORS OF POVERTY AND SOCIAL EXCLUSION IN RURAL ENGLAND: 2009
 INDICATORS OF POVERTY AND SOCIAL EXCLUSION IN RURAL ENGLAND: 2009 A Report for the Commission for Rural Communities Guy Palmer The Poverty Site www.poverty.org.uk INDICATORS OF POVERTY AND SOCIAL EXCLUSION
Monitoring poverty and social exclusion
 Monitoring poverty and social exclusion The New Policy Institute has constructed the first set of indicators to present a wide view of poverty and social exclusion in Britain. Forty-six indicators show
Can the changes to LHA achieve their aims in London s housing market?
 Can the changes to LHA achieve their aims in London s housing market? A report by New Policy Institute for Shelter This report was written by New Policy Institute. It was commissioned by Shelter with funding
MONITORING POVERTY AND SOCIAL EXCLUSION 2016
 MONITORING POVERTY AND SOCIAL EXCLUSION 216 This publication can be provided in alternative formats, such as large print, Braille, audiotape and on disk. Please contact: Communications Department Joseph
MONITORING POVERTY AND SOCIAL EXCLUSION IN WALES 2013
 MONITORING POVERTY AND SOCIAL EXCLUSION IN WALES 213 The New Policy Institute analyses the latest data on poverty and exclusion in Wales. Key points Over the three years to 211/12, 69, people (23%) were
A Minimum Income Standard for London Matt Padley
 A Minimum Income Standard for London 2017 Matt Padley December 2017 About Trust for London Trust for London is the largest independent charitable foundation funding work which tackles poverty and inequality
DOES UNIVERSAL CREDIT ENABLE HOUSEHOLDS TO REACH A MINIMUM INCOME STANDARD?
 REPORT DOES UNIVERSAL CREDIT ENABLE HOUSEHOLDS TO REACH A MINIMUM INCOME STANDARD? Donald Hirsch and Yvette Hartfree This report looks at the impact Universal Credit (UC) will have on the disposable incomes
Incomes and inequality: the last decade and the next parliament
 Incomes and inequality: the last decade and the next parliament IFS Briefing Note BN202 Andrew Hood and Tom Waters Incomes and inequality: the last decade and the next parliament Andrew Hood and Tom Waters
Monitoring poverty and social exclusion in Scotland (2002)
") Monitoring poverty and social exclusion in Scotland (22) Using the latest available data, a report by the New Policy Institute contains an independent selection of indicators, maps and commentary that
Monitoring poverty and social exclusion in Scotland (22) Using the latest available data, a report by the New Policy Institute contains an independent selection of indicators, maps and commentary that
Poverty figures for London: 2010/11 Intelligence Update
 Poverty figures for London: 2010/11 Intelligence Update 11-2012 Key points The number of Londoners living in poverty has seen little change. Children, particularly those in workless households, remain
The cost of a child in Donald Hirsch
 The cost of a child in 2013 Donald Hirsch August 2013 The cost of a child in 2013 Donald Hirsch August 2013 CPAG promotes action for the prevention and relief of poverty among children and families with
Monitoring poverty and social exclusion 2010
 Monitoring poverty and social exclusion 21 This publication can be provided in alternative formats, such as large print, Braille, audiotape and on disk. Please contact: Communications Department Joseph
MULTIPLE CUTS FOR THE POOREST FAMILIES
 OXFAM RESEARCH REPORTS APRIL 2014 MULTIPLE CUTS FOR THE POOREST FAMILIES 1.75 million of the poorest families have seen their benefits cut due to welfare reform HANNAH ALDRIDGE & TOM MACINNES New Policy
London s Poverty Profile 2011
 London s Poverty Profile 2011 Trust for London and the New Policy Institute have updated a wide range of indicators related to poverty and inequality in London. These indicators use government data to
A minimum income standard for the UK in 2011
 A minimum income standard for the UK in 2011 Donald Hirsch www.jrf.org.uk A minimum income standard for the UK in 2011 Donald Hirsch July 2011 This is the 2011 update of the Minimum Income Standard for
Age, Demographics and Employment
 Key Facts Age, Demographics and Employment This document summarises key facts about demographic change, age, employment, training, retirement, pensions and savings. 1 Demographic change The population
Poverty Fact Book. Data, Information and Analysis for Leeds. Financial Inclusion Team
 Poverty Fact Book Data, Information and Analysis for Leeds Financial Inclusion Team March 2018 About the Poverty Fact Book The Poverty Fact Book was developed to be a useful document to share widely across
The Money Statistics. August
 The Money Statistics August 2018 Welcome to the August 2018 edition of The Money Statistics The Money Charity s monthly round-up of statistics about how we use money in the UK. These were previously published
A minimum income standard for the UK in 2011
 Loughborough University Institutional Repository A minimum income standard for the UK in 2011 This item was submitted to Loughborough University's Institutional Repository by the/an author. Citation: HIRSCH,
GUIDE TO WELFARE REFORMS
 GUIDE TO WELFARE REFORMS 2010 2017 Since coming to power in 2010, the coalition government has undertaken a radical reform of our welfare system; introducing measures to cut overall welfare expenditure
Monitoring poverty and social exclusion 2008
 Monitoring poverty and social exclusion 28 This publication can be provided in alternative formats, such as large print, Braille, audiotape and on disk. Please contact: Communications Department Joseph
Economic Standard of Living
 DESIRED OUTCOMES New Zealand is a prosperous society where all people have access to adequate incomes and enjoy standards of living that mean they can fully participate in society and have choice about
Findings of the 2018 HILDA Statistical Report
 RESEARCH PAPER SERIES, 2018 19 31 JULY 2018 ISSN 2203-5249 Findings of the 2018 HILDA Statistical Report Geoff Gilfillan Statistics and Mapping Introduction The results of the 2018 Household, Income and
The Money Statistics. April
 The Money Statistics April 2018 Welcome to the April 2018 edition of The Money Statistics The Money Charity s monthly round-up of statistics about how we use money in the UK. These were previously published
Pensioners Incomes Series: An analysis of trends in Pensioner Incomes: 1994/ /16
 Pensioners Incomes Series: An analysis of trends in Pensioner Incomes: 1994/95-215/16 Annual Financial year 215/16 Published: 16 March 217 United Kingdom This report examines how much money pensioners
Hard to Swallow The Facts about Food Poverty
 Hard to Swallow The Facts about Food Poverty Key Findings This report, conducted on behalf of Kellogg s by the Centre for Economics and Business Research (CEBR) 1 attempts to measure food poverty, and
Poverty and income inequality in Scotland:
 A National Statistics Publication for Scotland Poverty and income inequality in Scotland: 2008-09 20 May 2010 This publication presents annual estimates of the proportion and number of children, working
Monitoring poverty and social exclusion 2000
 Monitoring poverty and social exclusion 2 Mohibur Rahman, Guy Palmer, Peter Kenway, and Catherine Howarth December 2 JR J O S E P H R O W N T R E E F O U N D AT I O N Acknowledgements Our first thanks
RESTRICTED: STATISTICS
 Households Below Average Income 2008/09 Peter Matejic (DWP) HBAI Publication Private households in United Kingdom Main source DWP Family Resources Survey Measurement of living standards as determined by
Poverty, inequality and policy since 1997
 Poverty, inequality and policy since 1997 February 2009 Findings Informing change This study examines what has happened to different aspects of inequality in Britain, and how this relates to policies adopted
The Money Statistics March 2017
 The Money Statistics March 2017 Welcome to the March 2017 edition of The Money Statistics The Money Charity s monthly round-up of statistics about how we use money in the UK. These were previously published
The Money Statistics. September
 The Money Statistics September 2017 Welcome to the September 2017 edition of The Money Statistics The Money Charity s monthly round-up of statistics about how we use money in the UK. These were previously
Economic Standard of Living
 DESIRED OUTCOMES New Zealand is a prosperous society, reflecting the value of both paid and unpaid work. All people have access to adequate incomes and decent, affordable housing that meets their needs.
Poverty. David Phillips, p, IFS May 21 st, Institute for Fiscal Studies
 Poverty David Phillips, p, IFS May 21 st, 2010 Poverty: the story under Labour After poverty rose between 2004/5 and 2007/8 200,000000 for each of pensioners and children 200,000 for working age adults
Monitoring poverty and social exclusion in Northern Ireland 2006
 Monitoring poverty and social exclusion in Northern Ireland 26 This publication can be provided in alternative formats, such as large print, Braille, audiotape and on disk. Please contact: Communications
CIH Response to Budget and Future Directions. 30 March 2011 Sam Lister, Policy and Practice Officer, CIH
 CIH Response to Budget and Future Directions 30 March 2011 Sam Lister, Policy and Practice Officer, CIH sam.lister@cih.org Political context The Context Work and Pensions is largest budget more than entire
CIH written evidence on the Benefit cap Inquiry (2018)
") About CIH 1.1 The Chartered Institute of Housing (CIH) is the independent voice for housing and the home of professional standards. Our goal is simple to provide housing professionals and their organisations
About CIH 1.1 The Chartered Institute of Housing (CIH) is the independent voice for housing and the home of professional standards. Our goal is simple to provide housing professionals and their organisations
WORK IS THE BEST FORM OF WELFARE (SAVINGS): THE PROCESS IS THE POLICY. BILL WELLS
: THE PROCESS IS THE POLICY. BILL WELLS") WORK IS THE BEST FORM OF WELFARE (SAVINGS): THE PROCESS IS THE POLICY. BILL WELLS BEVERIDGEAN WELFARE STATE PRINCIPLES: in SOCIAL INSURANCE AND ALLIED SERVICES. [1944] The first principle is that any proposals
WORK IS THE BEST FORM OF WELFARE (SAVINGS): THE PROCESS IS THE POLICY. BILL WELLS BEVERIDGEAN WELFARE STATE PRINCIPLES: in SOCIAL INSURANCE AND ALLIED SERVICES. [1944] The first principle is that any proposals
The Money Statistics. December.
 The Money Statistics December 2018 Welcome to the December 2018 edition of The Money Statistics, The Money Charity s monthly roundup of statistics about how we use money in the UK. If you have any questions,
Monitoring poverty and social exclusion 2007
 Monitoring poverty and social exclusion 27 This publication can be provided in alternative formats, such as large print, Braille, audiotape and on disk. Please contact: Communications Department Joseph
The Coalition s Record on Housing: Policy, Spending and Outcomes
 Summary Working Paper 18 January 2015 The Coalition s Record on Housing: Policy, Spending and Outcomes 2010-2015 Rebecca Tunstall Coalition Ministers were highly critical of the state of UK housing when
The impact of tax and benefit reforms by sex: some simple analysis
 The impact of tax and benefit reforms by sex: some simple analysis IFS Briefing Note 118 James Browne The impact of tax and benefit reforms by sex: some simple analysis 1. Introduction 1 James Browne Institute
Report of the National Equality Panel: Executive summary
 Report of the National Equality Panel: Executive summary January 2010 The independent National Equality Panel was set up to examine how inequalities in people s economic outcomes such as earnings, incomes
Poverty and income inequality
 Poverty and income inequality Jonathan Cribb Public Economics Lectures, Institute for Fiscal Studies 17 th December 2012 Overview The standard of living in the UK Income Inequality The UK income distribution
Economic standard of living
 Home Previous Reports Links Downloads Contacts The Social Report 2002 te purongo oranga tangata 2002 Introduction Health Knowledge and Skills Safety and Security Paid Work Human Rights Culture and Identity
Economic Standard of Living
 DESIRED OUTCOMES New Zealand is a prosperous society, reflecting the value of both paid and unpaid work. All people have access to adequate incomes and decent, affordable housing that meets their needs.
Monitoring the Impact of Welfare Reform in Cambridgeshire. September 2013
 Monitoring the Impact of Welfare Reform in Cambridgeshire September 2013 16/10/2013 1 Contents: Page Background 3 Executive Summary 3 Summary Points 4 Monitoring information from districts 8 Monitoring
Living standards, poverty and inequality in the UK: to Andrew Hood Tom Waters
 Living standards, poverty and inequality in the UK: 2017 18 to 2021 22 Andrew Hood Tom Waters Living standards, poverty and inequality in the UK: 2017 18 to 2021 22 Andrew Hood Tom Waters Copy-edited by
Changes to work and income around state pension age
 Changes to work and income around state pension age Analysis of the English Longitudinal Study of Ageing Authors: Jenny Chanfreau, Matt Barnes and Carl Cullinane Date: December 2013 Prepared for: Age UK
Open Seminar Tackling Child Poverty: Lessons from the UK and New Frontiers in Japan Doshisha University Kyoto January
 Open Seminar Tackling Child Poverty: Lessons from the UK and New Frontiers in Japan Doshisha University Kyoto January 9 2012 Until 1945 financial needs of children not recognised by the state poor law,
Asda Income Tracker. Report: December 2015 Released: January Centre for Economics and Business Research ltd
 Asda Income Tracker Report: December 2015 Released: January 2016 M a k i n g B u s i n e s s S e n s e Centre for Economics and Business Research ltd Unit 1, 4 Bath Street, London EC1V 9DX t 020 7324 2850
IFS. Poverty and Inequality in Britain: The Institute for Fiscal Studies. Mike Brewer Alissa Goodman Jonathan Shaw Andrew Shephard
 IFS Poverty and Inequality in Britain: 2005 Mike Brewer Alissa Goodman Jonathan Shaw Andrew Shephard The Institute for Fiscal Studies Commentary No. 99 Poverty and Inequality in Britain: 2005 Mike Brewer
ROYAL LONDON POLICY PAPER Will we ever summit the pension mountain? ROYAL LONDON POLICY PAPER 21. Will we ever summit the pension mountain?
 ROYAL LONDON POLICY PAPER ROYAL LONDON POLICY PAPER 21 1 Will we ever summit the pension mountain? ABOUT ROYAL LONDON POLICY PAPERS The Royal London Policy Paper series was established in 2016 to provide
Welfare Reform - the impact on child poverty
 Welfare Reform - the impact on child poverty Jon Shaw November 2012 www.cpag.org.uk Overview Headline figure: UK child poverty is predicted to rise by 800,000 by 2020/21 Key questions: Why will this happen?
Universal Credit: an overview October 2018
 Universal Credit: an overview October 2018 What is Universal Credit? 2 Areas of the country where you can claim UC 2 Who will be able to claim UC? 3 Payment of UC 4 Making a claim 4 How is UC calculated?
Living standards, poverty and inequality in the UK: Jonathan Cribb Agnes Norris Keiller Tom Waters
 Living standards, poverty and inequality in the UK: 2018 Jonathan Cribb Agnes Norris Keiller Tom Waters Living standards, poverty and inequality in the UK: 2018 Jonathan Cribb Agnes Norris Keiller Tom
Multiple Jeopardy? The impacts of the UK Government s proposed welfare reforms on women in Scotland
 Multiple Jeopardy? The impacts of the UK Government s proposed welfare reforms on women in Scotland An Engender Briefing Paper January 2012 1. Introduction Since the June 2010 emergency budget the UK government
ANNUAL REPORT for the Child Poverty Strategy for Scotland
 ANNUAL REPORT for the Child Poverty Strategy for Scotland 2016 ANNUAL REPORT FOR THE CHILD POVERTY STRATEGY FOR SCOTLAND 2016 1 CONTENTS MINISTERIAL FOREWORD 02 1. INTRODUCTION 04 2. CHILD POVERTY IN SCOTLAND
Future demand for long-term care in the UK
 Future demand for long-term care in the UK Future demand for long-term care in the UK A summary of projections of long-term care finance for older people to 2051 Raphael Wittenberg, Adelina Comas-Herrera,
Michelle Jones, Stephanie Tipping
 Economy READER INFORMATION Need Identified Lead Author Date completed Director approved Economy Michelle Jones, Stephanie Tipping To be signed off To be signed off Key needs Economic inactivity The employment
MYTHS. The Truth about Poverty in Abbotsford
 The Truth about Poverty in Abbotsford MYTHS Abbotsford has experienced tremendous growth in recent years. The population expanded by 7.2% between 2001 and 2006, higher than the provincial average. During
Housing and Poverty Dundee Fairness Commission
 Housing and Poverty Dundee Fairness Commission Douglas Robertson Email d.s.robertson@stir.ac.uk Presentation Overview Housing & poverty Housing costs & the experience of poverty Housing & poverty changes
The Cumulative Impact of Welfare Reform in Hounslow
 The Cumulative Impact of Welfare Reform in Hounslow Contents Executive Summary... 4 The cumulative impact of welfare reform... 4 The impact of individual welfare reforms... 4 The impact of Universal Credit...
CIH Briefing on the White Paper for Welfare Reform. Universal Credit: welfare that works
 CIH Briefing on the White Paper for Welfare Reform Universal Credit: welfare that works November 2010 1) Introduction The government has published its White Paper on welfare reform which sets out its proposals
All in it Together? Measuring the Impact of Austerity, Housing Strategy & Welfare Changes on Vulnerable Groups in Social Housing
 Human City HEADLINES Bulletin No. 10 March 2012 All in it Together? Measuring the Impact of Austerity, Housing Strategy & Welfare Changes on Vulnerable Groups in Social Housing SUMMARY This Bulletin is
Crisis Policy Briefing Universal Credit: Frequently Asked Questions. March 2017
 Crisis Policy Briefing Universal Credit: Frequently Asked Questions March 2017 Crisis Policy Briefing: Universal Credit Frequently Asked Questions 2 Introduction Universal Credit is the Government s new,
Northern Ireland Northern Ireland Universal Credit Information Booklet
 Northern Ireland Northern Ireland Universal Credit Information Booklet July 2016 September 2016 Issued by: DfC Analytical Services Unit, 1st Floor, Lighthouse Building, 1 Cromac Place, Gasworks Business
Universal Credit The Children s Society key concerns
 Universal Credit The Children s Society key concerns The first trial of Universal Credit starts on 29 April 2013, in parts of Cheshire and greater Manchester, with Ashton-under-Lyne the first job centre
Food poverty in London: A submission from Child Poverty Action Group
 Food poverty in London: A submission from Child Poverty Action Group Child Poverty Action is the leading national charity working to end poverty among children, young people and families in the UK. Our
Tackling poverty from the DWP: a briefing for the Secretary of State
 Tackling poverty from the DWP: a briefing for the Secretary of State Julia Unwin: Chief Executive, Joseph Rowntree Foundation Julia.unwin@jrf.org.uk Key points To substantially reduce poverty levels in
Welfare isn t working
 Welfare isn t working Child Poverty Frank Field MP Ben Cackett June 2007 The authors Frank Field has been the Member of Parliament for Birkenhead since 1979. He accepted the position of Minister for Welfare
Income Poverty. Chris Belfield 16 th July Institute for Fiscal Studies
 Income Poverty Chris Belfield 16 th July 2015 Outline Recent trends in income poverty how has poverty changed since the recession and why? how have different groups been affected? Relationship between
BUDGET Quebecers and Their Disposable Income. Greater Wealth
 BUDGET 2012-2013 Quebecers and Their Disposable Income Greater Wealth for All Paper inside pages 100% This document is printed on completely recycled paper, made in Québec, contaning 100% post-consumer
10. The (changing) effects of universal credit
 effects of universal credit") 10. The (changing) effects of universal credit James Browne, Andrew Hood and Robert Joyce (IFS) Summary The government is in the process of integrating six means-tested benefits and tax credits for working-age
10. The (changing) effects of universal credit James Browne, Andrew Hood and Robert Joyce (IFS) Summary The government is in the process of integrating six means-tested benefits and tax credits for working-age
Consultation response
 Consultation response Age UK s Response to the Work and Pensions Committee Inquiry into changes to Housing Benefit September 2010 Name: Sally West Email: sally.west@ageuk.org.uk Age UK Astral House, 1268
The 2008 Statistics on Income, Poverty, and Health Insurance Coverage by Gary Burtless THE BROOKINGS INSTITUTION
 The 2008 Statistics on Income, Poverty, and Health Insurance Coverage by Gary Burtless THE BROOKINGS INSTITUTION September 10, 2009 Last year was the first year but it will not be the worst year of a recession.
Consumer Debt and Money Report Q making business sense
 Consumer Debt and Money Report Q3 2012 3 making business sense Executive summary & commentary The StepChange Debt Charity Consumer Debt and Money Report Q3 2012 expands on previous reports to build a nuanced
Introduction to the guide
 02 2013 Introduction to the guide Contents Council Tax Reduction Scheme see page 03 You might have heard a lot recently about changes to how the benefits systems work. It can be extremely confusing, and
Women s pay and employment update: a public/private sector comparison
 Women s pay and employment update: a public/private sector comparison Report for Women s Conference 01 Women s pay and employment update: a public/private sector comparison Women s employment has been
Living standards during the recession
 Living standards during the recession IFS Briefing Note 117 James Browne 1. Introduction Living standards during the recession James Browne Institute for Fiscal Studies 1 We are used to our incomes rising
CEPR CENTER FOR ECONOMIC AND POLICY RESEARCH
 CEPR CENTER FOR ECONOMIC AND POLICY RESEARCH The Wealth of Households: An Analysis of the 2016 Survey of Consumer Finance By David Rosnick and Dean Baker* November 2017 Center for Economic and Policy Research
A MINIMUM INCOME STANDARD FOR THE UK IN 2013
 REPORT A MINIMUM INCOME STANDARD FOR THE UK IN 2013 Donald Hirsch This is the 2013 update of the Minimum Income Standard (MIS) for the United Kingdom, based on what members of the public think people need
Mitigating the impact of welfare reform on health and NHS services, service users and employees.
 Mitigating the impact of welfare reform on health and NHS services, service users and employees. Outcome Focused Plan March 2018 Published by NHS Health Scotland on behalf of The Scottish Government s
DISPOSABLE INCOME INDEX
 DISPOSABLE INCOME INDEX Q1 2018 A commissioned report for Scottish Friendly CREDIT CARD 1234 5678 9876 5432 JOHN SMITH Executive summary The Scottish Friendly Disposable Income Index uses new survey data
Poverty. Chris Belfield, IFS 15 th July Institute for Fiscal Studies
 Poverty Chris Belfield, IFS 15 th July 2014 Outline Income based measures how has poverty changed since the recession and why? which groups have been affected by recent changes? Non-income based measures
Micro-simulating child poverty in 2010 and Mike Brewer, James Browne and Holly Sutherland
 Micro-simulating child poverty in 2010 and 2020 Mike Brewer, James Browne and Holly Sutherland The Joseph Rowntree Foundation has supported this project as part of its programme of research and innovative
Economic Standard of Living
 DESIRED OUTCOMES New Zealand is a prosperous society, reflecting the value of both paid and unpaid work. Everybody has access to an adequate income and decent, affordable housing that meets their needs.
2011 Community Development Halton, all rights reserved.
 May 2011 2011 Community Development Halton, all rights reserved. Copies of this document may be reproduced non-commercially for the purpose of community awareness or community development with appropriate
ROYAL LONDON POLICY PAPER 9 The Mothers Missing out on Millions
 9 ABOUT ROYAL LONDON POLICY PAPERS The Royal London Policy Paper series was established in 2016 to provide commentary, analysis and thought-leadership in areas relevant to Royal London Group and its customers.
Debt Statistics. November 2013 Edition.
 Debt Statistics November 2013 Edition STRIKING NUMBERS Welcome to the November 2013 edition of The Money Charity s (formerly Credit Action) monthly Debt Statistics. The Debt Statistics provide a detailed
The Living Standards Audit 2018
 REPORT The Living Standards Audit 2018 Adam Corlett, Stephen Clarke, Conor D Arcy & John Wood July 2018 resolutionfoundation.org info@resolutionfoundation.org +44 (0)203 372 2960 Acknowledgements 2 Acknowledgements
Superannuation account balances by age and gender
 Superannuation account balances by age and gender October 2017 Ross Clare, Director of Research ASFA Research and Resource Centre The Association of Superannuation Funds of Australia Limited (ASFA) PO