Emil Tesliuc and Phillippe Leite November 23, 2009
|
|
|
- Leo Bell
- 6 years ago
- Views:
Transcription

1 Emil Tesliuc and Phillippe Leite November 23, 2009 ADePT SP (developed by HDNSP-SSN SSN team and Development Research Group -Poverty Team ) ADePT SP is a Stata routine built as a special module in ADePT. Through consistent set of methods and assumptions, ADePT SP produces up to 24 standardized tables and 3 graphs to examine how equitable, efficient and effective social protection programs are. ADePT SP generate indicators about benefits or beneficiaries across quintiles and deciles of a monetary welfare or a non-monetary welfare; and broken-down by other population groups. THE QUALITY OF OUTPUTS DEPENDS ON DATA QUALITY AND DATA MANIPULATION GARBAGE IN GARBAGE OUT 2 1
2 ADePT SP (developed by HDNSP-SSN SSN team and Development Research Group -Poverty Team )) Value Added of ADePT SP Current practice: estimate only a partial set of indicators; without sensitivity testing; ti different, non-transparent t algorithms by different researchers. ADePT SP: 1. A simplified framework for judging the impact of a SN program on poverty based on a set of intermediate outcome indicators dpg = f(coverage, Generosity, Targeting accuracy) 2. Can be used for ex-ante analysis of a new or re-designed d social protection program 3. Facilitates benchmarking, comparisons across programs and countries (generated using a standard procedure) 3 First step preparation of input data Main source of information: Household Surveys (HBS, IES, LSMS) Key Variables: Household identification Location of the household (Urban or Rural) The welfare level of the households, typically expressed as a per capita or per adult equivalent consumption or income; Poverty line (s) Expansion factor (individual or household) Sample frame design Social programs benefits or beneficiaries (either individual amount or household amount) 4 2
3 Individual Input File Amount Amount received Amount Household Adult Age of the Total received Participation in Household Individual Urban location =1; Household Head of the Poverty by the household received by the STRATA PSU expansion equivalent household household from old scholarship Identification Identification Rural location=2 Size household line from household from factor scale member income age programs Oportunidades Pro Campo pensions id_hh id_ind strata psu urban hhweight hhsize adul_eq head age hh_income pob_ing apos becas_ toport tprocam Household Input File Household Identification Individual Identification STRATA PSU Urban location =1; Rural location=2 Household Household expansion Size factor Adult Age of the Head of the equivalent household household scale member Total household income Poverty line Amount received from old age pensions Participation in scholarship programs Amount received by the household from Oportunidades Amount received by the household from Pro Campo id_hh id_ind strata psu urban hhweight hhsize adul_eq head age hh_income pob_ing apos becas_ toport tprocam


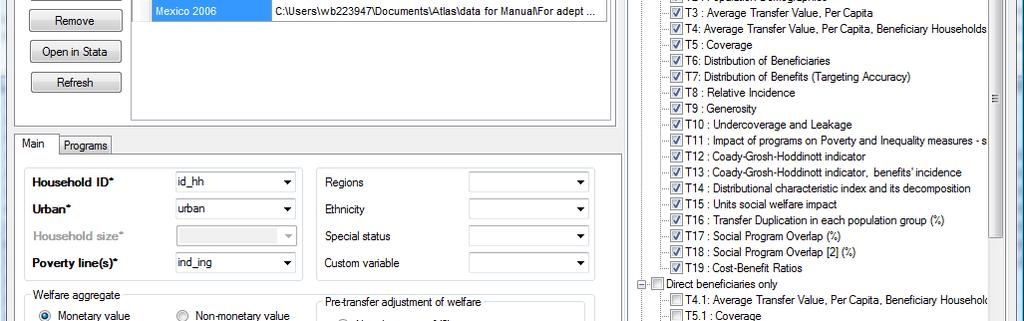
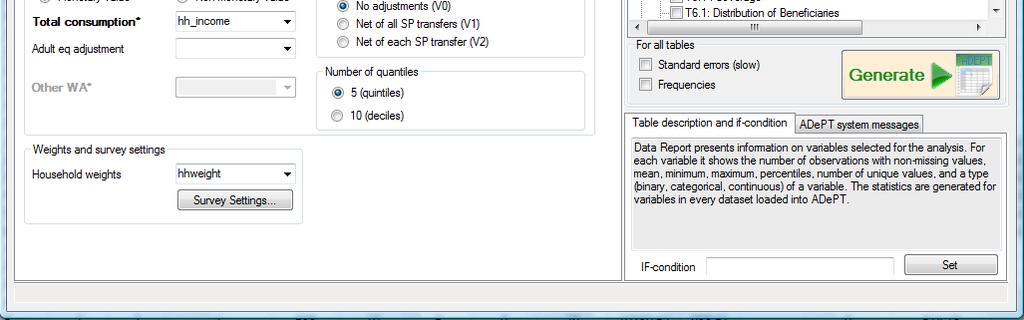
4 ADePT SP snapshot (developed by HDNSP-SSN SSN team and Development Research Group -Poverty Team ) 8 4
 9")

5 ADePT SP snapshot (developed by HDNSP-SSN SSN team and Development Research Group -Poverty Team ) 9 ADePT SP snapshot (developed by HDNSP-SSN SSN team and Development Research Group -Poverty Team ) 10 5

 11 -Poverty")
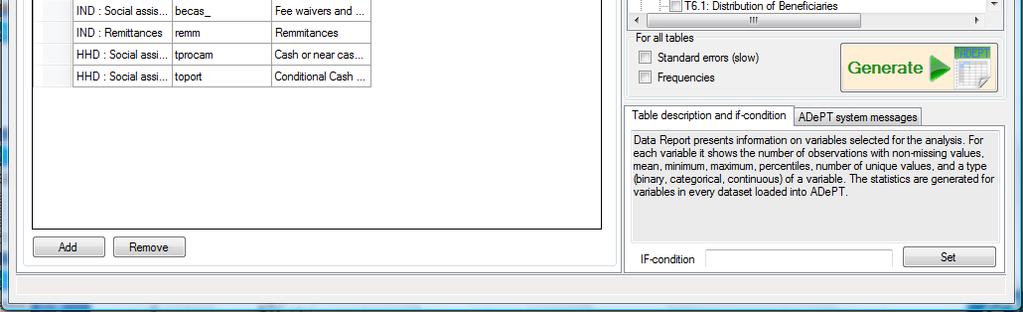
6 ADePT SP snapshot (developed by HDNSP-SSN SSN team and Development Research Group -Poverty Team ) 11 ADePT SP snapshot (developed by HDNSP-SSN SSN team and Development Research Group -Poverty Team ) 12 6
7 ADePT SP snapshot (developed by HDNSP-SSN SSN team and Development Research Group -Poverty Team ) 13 What ADePT SP tables will tell you? Focusing on few tables Tbl Table 1: Sample and Population sizes Table 5: Coverage Table 7: Distribution of Benefits Table 9: Generosity Table 10: Undercoverage and Leakage Table 11: Impacts of program on Poverty and Inequality Table 19: Cost-Benefit ratios 14 7
8 Table 1 : Sample and Population Sizes Table 1 : Sample and Population Sizes Sample size* Population** Transfer Households Individuals Recipient Households Individuals Recipient amount Level*** declared? All observations 20,875 83,624 26,639, ,434,304 For households that receive the indicated transfer only All social protection 6,777 30,104 11,936 7,704,894 33,188,158 12,627,162 Yes HHold All social insurance 2,122 7,471 2,329 2,885,613 10,049,597 3,163,608 Yes HHold Old Age Pension 2,116 7,439 2,322 2,875,903 9,986,142 3,151,370 Yes Ind Occupational injury / Sickness benefits ,238 73,567 12,238 Yes Ind All labor market programs Yes HHold All social assistance 4,838 23,474 9,690 5,056,774 24,152,556 9,577,819 Yes HHold Fee waivers, education 647 3, ,702 3,479, ,540 Yes Ind Conditional Cash Transfers 3,908 19,462 7,998 3,913,758 19,168,138 7,806,388 Yes Ind Non contributory pension 1,074 5,097 1,091 1,053,189 4,784,885 1,068,693 Yes Ind All remittances 4,977 18,026 5,985 6,245,825 22,155,677 7,479,059 Yes HHold Remittances 4,977 18,026 5,985 6,245,825 22,155,677 7,479,059 Yes HHold *) The sample size columns show the number of households, individuals and recipients of SP programs in the survey. **) The population columns show the number of households, individuals and recipients of SP programs, expanded to the population using expansion factors. ***) The Level collumn specifies whether the information on program participation is collected at individual or household level Table 5 : Coverage - Direct and indirect beneficiaries Table 5 : Coverage Direct and indirect beneficiaries Quintiles of pc consumption Poverty Status Area of Residence Total Q1 Q2 Q3 Q4 Q5 P NP Urban Rural All social protection All social insurance Old Age Pension Occupational injury / Sickness benefits All labor market programs All social assistance Fee waivers, education Conditional Cash Transfers Non contributory pension All remittances Remittances Notes: Program coverage is the portion of population in each group that receives the transfer. Specifically, coverage is: (Number of individuals in the group who live in a household where at least one member receives the transfer)/(number of individuals in the group). Program coverage is calculated setting as expansion factor the household expansion factor multiplied by the household size. 8
9 Table 7: Distribution of Benefits (Targeting Accuracy) Table 7: Distribution of Benefits (Targeting Accuracy) Quintiles of pc consumption Poverty Status Area of Residence Total Q1 Q2 Q3 Q4 Q5 P NP Urban Rural All social protection All social insurance Old Age Pension Occupational injury / Sickness benefits All labor market programs n.a. n.a. n.a. n.a. n.a. n.a. n.a. n.a. n.a. n.a. All social assistance Fee waivers, education Conditional Cash Transfers Non contributory pension All remittances Remittances Notes: Benefits' incidence is the transfer amount received by the group as a percent of total transfers received by the population Specifically, benefits' incidence is: (Sum of all transfers received by all individuals in the group)/(sum of all transfers received by all individuals in the population). Aggregated transfer amounts are estimated using household size-weighted expansion factors. Table 7: Distribution of Benefits with standard errors Table 7: Distribution of Benefits (Targeting Accuracy) Quintiles of pc consumption Q1 Q2 Q3 Q4 Q5 Conditional Cash Transfer standard error Confidence interval Upper Lower
10 Figure 1: Concentration curves Social assistance programs Figure 1: Concentration curves Social assistance programs 100 per capita consumption Cash or near cash transfer Conditional Cash Transfer 80 Line of equality Cumulative % of benefits Cumulative % of population, ranked by consumption 10
11 Table 9 : Generosity - Direct and indirect beneficiaries Table 9 : Generosity Direct and indirect beneficiaries Quintiles of pc consumption Poverty Status Area of Residence Total Q1 Q2 Q3 Q4 Q5 P NP Urban Rural All social protection All social insurance Old Age Pension Occupational injury / Sickness benefits 6.6 n.a n.a All labor market programs n.a. n.a. n.a. n.a. n.a. n.a. n.a. n.a. n.a. n.a. All social assistance Fee waivers, education Conditional Cash Transfers Non contributory pension All remittances Remittances Notes: Generosity is the mean value of the share transfer amount received by all beneficiaries in a group as a share of total welfare aggregate of the beneficiaries in that group. Generosity is calculated setting as expansion factor the household expansion factor multiplied by the household size. Generosity expressed in LCU. Table 10 : Undercoverage and Leakage Table 10 : Undercoverage and Leakage Direct and indirect beneficiaries Coverage of the poor (1) Under- coverage (2) Leakage (# of Leakage beneficiaries) (benefits) (3) (4) Targeting differential (5) = (1) - (3) All social protection All social insurance Old Age Pension Occupational injury / Sickness benefits All labor market programs n.a. n.a. n.a. n.a. n.a. All social assistance Fee waivers, education Conditional Cash Transfers Non contributory pension All remittances Remittances Notes: Undercoverage is percent of poor individuals that do not receive transfer. Leakage is percent of individuals that receive transfer and are not poor. Sample of all htaouseholds. Undercoverage and leakage are calculated across this sample, setting as expansion factor the household expansion factor multiplied by the household size. The targeting differential is the difference between the coverage rate and the participation rate for nonpoor. 11
12 Table 11 : Impact of SP programs on poverty simulating the absence of the program Table 11 : Impact of programs on Poverty and Inequality measures - simulating the absence of the program Poverty Indicator Inequality FGT0 FGT1 FGT2 Gini GE(0) GE(1) GE(2) Indicator Indicator without listed transfer All social protection All social insurance Old Age Pension Occupational injury / Sickness benefits All labor market programs n.a. n.a. n.a. n.a. n.a. n.a. n.a. All social assistance Fee waivers, education Conditional Cash Transfers Non contributory pension All remittances Remittances Notes: The simulated impact is the change in a poverty or inequality indicator due to transfer, assuming that household welfare with diminish by the full value of that transfer Table 19 : Cost-Benefit Ratios Table 19 : Cost-Benefit Ratios Simulated poverty gap At Actual Difference without poverty gap (dpg) transfer Total amount spent in the program (X) Cost- Benefit (dpg0/x) All social protection 7,546,296,736 6,100,966,849 1,445,329,887 14,686,891, All social insurance 6,470,215,583 6,100,966, ,248,734 11,738,290, Old Age Pension 6,470,215,583 6,100,966, ,248,734 11,726,179, Occupational injury / Sickness benefits 6,100,966,849 6,100,966, ,111, All labor market programs n.a. n.a. n.a. n.a. n.a. All social assistance 7,146,362,530 6,100,966,849 1,045,395,681 2,948,600, Fee waivers, education 6,138,825,322 6,100,966,849 37,858, ,205, Conditional lcash Transfers 6,944,402, ,100,966, ,435, ,689,155, Non contributory pension 6,253,200,955 6,100,966, ,234, ,239, All remittances 7,951,441,508 6,100,966,849 1,850,474,659 12,299,478, Remittances 7,951,441,508 6,100,966,849 1,850,474,659 12,299,478, Notes: Cost-Benefit is the poverty gap reduction in $ for each unity ($1) spent in the social program. Amounts in LCU. 12
13 Figure 3: Cost-Benefit Ratios for the total (upper) poverty line Conditional Cash Transfers All social assistance Non contributory pension Remittances All remittances Fee waivers, education $ reduction in poverty gap for each $1 spend in the program Next Steps Baseline: All poor OVC receives KHS500 a month Hypothesis: We assume we have a good welfare indicator for all households in Kenya Scenario 1: Only poor OVC according to a score index receives a transfer of KHS X a month Hypothesis: We don t know the welfare indicator but we have a simple score card that classifies households as poor or non poor using easy to verify indicators. Scenario 2: Only poor OVC according to a PMT receives a transfer of KHS X a month Hypothesis: We don t know the welfare indicator but we have a PMT score that classifies households as poor or non poor using easy to verify indicators


14 27 Next steps on Manual and on the Agenda Add sections: How to perform sensitivity analysis? How to simulate new programs, or changes in the parameters of existing programs? Receive feedback The team plans to develop both on-line and on-site training materials on how to use ADePT SP lecture format interactive exercise face-to-face training distance learning Next steps on the Agenda 28 Production of a Social Protection World Atlas By the end of the fiscal year 09, the HDNSP-SSN SSN team has piloted the Social Protection World Atlas (SP Atlas) using the ADePT SP and ECA region is working on a regional study. 14
 by able-bodies beneficiaries.")

15 Next steps on the Agenda Overall Social Assistance Coverage of Poorest Quintile (%) Next steps on the Agenda 30 Upgrades: Developing outcomes to examine dependency d on SA income(s) by able-bodies beneficiaries. Profile of the typical beneficiary of each individual SP program, compared with the "typical household" in the country Incorporating simulation feature to simulate a new program, or to simulate changes in few parameters of existing programs. Generating more graphs based on the current tabular output based on the sensitivity analysis (different welfare counterfactuals) 15
How to use ADePT Social Protection. December 4th, 2013
 How to use ADePT Social Protection December 4th, 2013 1 2 What is ADePT? ADePT is a software Platform for Automated Economic Analysis. ADePT uses micro-level data from various types of household surveys,
How to use ADePT for Social Protection Analysis
 How to use ADePT for Social Protection Analysis Pension Core Course Washington D.C. - May 2015 Objective To learn how to use ADePT Social Protection while analyzing the performance of specific SPL programs
How to use ADePT for Social Protection Analysis
 How to use ADePT for Social Protection Analysis Public Disclosure Authorized Public Disclosure Authorized Public Disclosure Authorized Social Safety Nets Core Course Washington D.C. - April 25 May 6, 2016
ASPIRE: Atlas of Social Protection Indicators of Resilience and Equity
 ASPIRE: Atlas of Social Protection Indicators of Resilience and Equity Maddalena Honorati Economist, Social Protection and Labor World Bank Core Course on Pensions March 5, 2014 1 Objectives 1. Create
Assessing Targeting and Poverty Performance
 Assessing Targeting and Poverty Performance ADePT SP December 5th, 2013 Session Overview Session objective: understand targeting data to inform program design & measure performance Moving from targeting
Module 3a: Financial Protection
 Module 3a: Financial Protection Catastrophic and Impoverishing Health Expenditure This presentation was prepared by Adam Wagstaff, Caryn Bredenkamp and Sarah Bales 1 The basic idea Out-of-pocket spending
Evaluation design and methodological challenges in the Kenya CT-OVC impact evaluation
 Evaluation design and methodological challenges in the Kenya CT-OVC impact evaluation Alternative measures of evaluating targeting effectiveness within the particular context of community based programs
Chapter 5 Poverty, Inequality, and Development
 Chapter 5 Poverty, Inequality, and Development Distribution and Development: Seven Critical Questions What is the extent of relative inequality, and how is this related to the extent of poverty? Who are
Solidaridad: a story of co-responsibilities in the Dominican Republic. Ludovic SUBRAN Social Protection, Latin America and the Caribbean
 Solidaridad: a story of co-responsibilities in the Dominican Republic Ludovic SUBRAN Social Protection, Latin America and the Caribbean Poverty and Social Impact Analysis Workshop May 23, 2011 Genesis
Module 1a: Inequalities and inequities in health and health care utilization
 Module 1a: Inequalities and inequities in health and health care utilization Concentration curve and concentration index This presentation was prepared by Adam Wagstaff, Caryn Bredenkamp and Sarah Bales
Development. AEB 4906 Development Economics
 Poverty, Inequality, and Development AEB 4906 Development Economics http://danielsolis.webs.com/aeb4906.htm Poverty, Inequality, and Development Outline: Measurement of Poverty and Inequality Economic
Module 3: Financial Protection
 Module 3: Financial Protection Catastrophic and Impoverishing Health Expenditure This presentation was prepared by Adam Wagstaff and Caryn Bredenkamp 1 Financial Protection in a nutshell Financial protection
The Role of Conditional Cash Transfers in the Process of Equitable Economic Development
 The Role of Conditional Cash Transfers in the Process of Equitable Economic Development Francisco H.G. Ferreira The World Bank & Dept. of Economics, PUC-Rio 1 Latin America (and Africa) are highinequality
Economic Development. Problem Set 1
 Economic Development Problem Set 1 Sherif Khalifa DueTuesday,March,8th,2011 1. (a) What is the usual indicator of living standards? (b) How is it calculated? (c) What are the problems with this indicator?
ECON 450 Development Economics
 and Poverty ECON 450 Development Economics Measuring Poverty and Inequality University of Illinois at Urbana-Champaign Summer 2017 and Poverty Introduction In this lecture we ll introduce appropriate measures
Case Study: ROMANIA Boosting Work Incentives for Poor Social Assistance Beneficiaries
 Case Study: ROMANIA Boosting Work Incentives for Poor Social Assistance Beneficiaries Presenter: Ms. Lacramioara Corches General Director Ministry of Labor, Family and Social Protection, Bucharest 2 Context
How Much? Spending on SSN Programs
 How Much? Spending on SSN Programs Cem Mete Senior Economist World Bank December 6, 2011 1 Outline 1. The macro decisions: how much to spend on safety nets? 2. At the program level: how much to pay? Benefit
THE CONSUMPTION AGGREGATE
 THE CONSUMPTION AGGREGATE MEASURE OF WELFARE: THE TOTAL CONSUMPTION 1. People well-being, or utility, cannot be measured directly, therefore, consumption was used as an indirect measure of welfare. The
Social experiment. If you have P500 pesos in your wallet, what would you do with it?
 Social experiment If you have P500 pesos in your wallet, what would you do with it? xxxxxxx xxxxxxx Anna from Infanta, Quezon, 10 years old and is the 3 rd among children of 7 Dropped out of school at
Updating the Poverty Estimates in Serbia in the Absence of Micro Data
 Public Disclosure Authorized Policy Research Working Paper 6889 WPS6889 Public Disclosure Authorized Public Disclosure Authorized Updating the Poverty Estimates in Serbia in the Absence of Micro Data A
Dalisay S. Maligalig. 2 August 2012 IPS, Sri Lanka
 Incorporating a Social Protection ti Module in Household Surveys Presentation ti by Dalisay S. Maligalig 2 August 2012 IPS, Sri Lanka Data Sources for Social Protection Index Expenditure and beneficiary
PRO-POOR TARGETING IN IRAQ Tools for poverty targeting
 June, 2015 PRO-POOR TARGETING IN IRAQ TOOLS FOR POVERTY TARGETING Step 1: Exclusion of conflict-affected governorates (Nineveh, Anbar, and Salah ad-din) PRO-POOR TARGETING IN IRAQ Tools for poverty targeting
ECON 256: Poverty, Growth & Inequality. Jack Rossbach
 ECON 256: Poverty, Growth & Inequality Jack Rossbach Measuring Poverty Many different definitions for Poverty Cannot afford 2,000 calories per day Do not have basic needs met: clean water, health care,
A PROXY MEANS TEST FOR SRI LANKA
 Public Disclosure Authorized Poverty & Equity Global Practice Working Paper 173 A PROXY MEANS TEST FOR SRI LANKA Public Disclosure Authorized Public Disclosure Authorized Public Disclosure Authorized Ashwini
THE IMPACT OF SOCIAL TRANSFERS ON POVERTY IN ARMENIA. Abstract
 THE IMPACT OF SOCIAL TRANSFERS ON POVERTY IN ARMENIA Hovhannes Harutyunyan 1 Tereza Khechoyan 2 Abstract The paper examines the impact of social transfers on poverty in Armenia. We used data from the reports
Questions: Question Option 1 Option 2 Option 3
 Bangladesh EquityTool: Update released November 1, 2016 The EquityTool has been updated based upon new source data. The original version is no longer active but is available upon request. Previous version
Analysing tax and social security policy: examples from Mexico and the UK David Phillips, Senior Research Economist, IFS
 Analysing tax and social security policy: examples from Mexico and the UK David Phillips, Senior Research Economist, IFS Analysing tax, benefits and pensions policy Quantitative analysis of tax, benefits
Social Accounting Matrix and its Application. Kijong Kim Levy Economics Institute GEM-IWG summer workshop July
 Social Accounting Matrix and its Application Kijong Kim Levy Economics Institute GEM-IWG summer workshop July 01 2009 Basic Structure Balanced matrix representation of flow of funds in the economy (row
Module 5: Data Preparation
 Module 5: Data Preparation This presentation was prepared by Adam Wagstaff and Caryn Bredenkamp 1 Which data? Which data? In what form? WHICH VARIABLES? Minimum data requirements: Health lhoutcomes module
Sean Higgins and Claudiney Pereira Department of Economics Tulane University. LASA 2013, Washington, DC May 31, 2013
 Sean Higgins and Claudiney Pereira Department of Economics Tulane University LASA 2013, Washington, DC May 31, 2013 Inequality and poverty in Brazil Other studies Immervoll et al. (2009) Nogueira et al.
CONTENTS CHAPTER 1 INTRODUCTION
 Particulars LIST OF TABLES LIST OF FIGURES LIST OF APPENDIX LIST OF ANNEXURE ABBREVIATIONS CONTENTS Page No. CHAPTER 1 INTRODUCTION 1-17 1.1 1.2 1.3 1.4 1.5 1.6 1.7 1.8 Trends in Poverty at National and
Poverty, Inequality, and Development
 Poverty, Inequality, and Development Outline: Poverty, Inequality, and Development Measurement of Poverty and Inequality Economic characteristics of poverty groups Why is inequality a problem? Relationship
Fiscal Incidence Analysis. B. Essama-Nssah World Bank Poverty Reduction Group Washinton D.C. June 03, 2008
 Fiscal Incidence Analysis B. Essama-Nssah World Bank Poverty Reduction Group Washinton D.C. June 03, 2008 Introduction Key questions Who benefits from public spending? Who bears the burden of taxation?
CONSUMPTION POVERTY IN THE REPUBLIC OF KOSOVO April 2017
 CONSUMPTION POVERTY IN THE REPUBLIC OF KOSOVO 2012-2015 April 2017 The World Bank Europe and Central Asia Region Poverty Reduction and Economic Management Unit www.worldbank.org Kosovo Agency of Statistics
Understanding Income Distribution and Poverty
 Understanding Distribution and Poverty : Understanding the Lingo market income: quantifies total before-tax income paid to factor markets from the market (i.e. wages, interest, rent, and profit) total
CASH TRANSFERS, IMPACT EVALUATION & SOCIAL POLICY: THE CASE OF EL SALVADOR
 CASH TRANSFERS, IMPACT EVALUATION & SOCIAL POLICY: THE CASE OF EL SALVADOR By Carolina Avalos GPED Forum September 8th, 2016 Vanderbilt University Nashville, TN El Salvador El Salvador is the smallest
IMPROVING SOCIAL SAFETY NETS PROGRAMS IN EUROPEAN COUNTRIES
 IMPROVING SOCIAL SAFETY NETS PROGRAMS IN EUROPEAN COUNTRIES CASE STUDY ROMANIA Presentation by Elena Dobre, Adriana Vlad, Rodica Andreea Carausu, Martin Vavrinčík, Erkin Mamadaliev, and Victoria Strokova
Development Economics Lecture Notes 4
 Development Economics Lecture Notes 4 April 2, 2009 Hausmann-Rodrik-Velasco Growth Diagnostics 1. Low return on economic activity 1.1 Low Social returns 1.2 Low Appropriability 2. High cost of Finance
between 2002/3 and 2007/8? East Asia and Pacific Region The World Bank November 2009
 DidPoverty ReallyStagnateinMongolia between 2002/3 and 2007/8? An Exploration of the Data East Asia and Pacific Region The World Bank November 2009 Outline Puzzleof no poverty reduction Possible explanations
CHAPTER \11 SUMMARY OF FINDINGS, CONCLUSION AND SUGGESTION. decades. Income distribution, as reflected in the distribution of household
 CHAPTER \11 SUMMARY OF FINDINGS, CONCLUSION AND SUGGESTION Income distribution in India shows remarkable stability over four and a half decades. Income distribution, as reflected in the distribution of
Defining Eligibility for Social Pensions 1
 Public Disclosure Authorized Public Disclosure Authorized Public Disclosure Authorized Public Disclosure Authorized Highlight As a poverty reduction tool, social pensions are less effective than broader
MEASURING FINANCIAL INCLUSION: THE GLOBAL FINDEX. Asli Demirguc-Kunt & Leora Klapper
 MEASURING FINANCIAL INCLUSION: THE Asli Demirguc-Kunt & Leora Klapper OVERVIEW What is the Global Findex? The first individual-level database on financial inclusion that is comparable across countries
INSURANCE: Ali Ghufron Mukti. Master in Health Financing Policy and Health Insurance management Gadjah Mada University
 SOCIAL SECURITY AND HEALTH INSURANCE: EQUITY AND FAIR FINANCING Ali Ghufron Mukti Master in Health Financing Policy and Health Insurance management Gadjah Mada University 1 Interpretation of the equity
1. Overall approach to the tool development
 Poverty Assessment Tool Submission USAID/IRIS Tool for Serbia Submitted: June 27, 2008 Updated: February 15, 2013 (text clarification; added decimal values to coefficients) The following report is divided
Scenic Rim Regional Council Community Sustainability Indicators 2009
 Scenic Rim Regional Council Community Sustainability Indicators 2009 Draft July 2009 This report was commissioned by Scenic Rim Regional Council and the Queensland Government through the Boonah Rural Futures
Pension Diagnostic Assessment and Conceptual Framework Philippines SPL Course March 9, 2016
 Public Disclosure Authorized Public Disclosure Authorized Public Disclosure Authorized Pension Diagnostic Assessment and Conceptual Framework Philippines SPL Course March 9, 2016 Mark C. Dorfman Pensions
On the Always Vexing Question of Targeting:
 On the Always Vexing Question of Targeting: How are LAC CCTs doing? International Symposium: the Contribution of CCTs to the Creation of Rights-Based Social Protection Systems Mexico City Sept. 28-30,
WOMEN AND FINANCIAL INCLUSION: Results from the Global Findex Asli Demirguc-Kunt, Leora Klapper, & Dorothe Singer
 WOMEN AND FINANCIAL INCLUSION: Results from the Global Findex Asli Demirguc-Kunt, Leora Klapper, & Dorothe Singer OVERVIEW Goal to collect comparable cross-country data on financial inclusion by surveying
FISCAL POLICY INCIDENCE AND POVERTY REDUCTION: EVIDENCE FROM TUNISIA
 PROSPERITY EQUALITY AND SUSTAINABILITY CONFERENCE FISCAL POLICY INCIDENCE AND POVERTY REDUCTION: EVIDENCE FROM TUNISIA Ahmed Moummi, Nizar Jouini and Nora Lustig (New-Delhi, June 2016) AFRICAN DEVELOPEMENT
Halving Poverty in Russia by 2024: What will it take?
 Public Disclosure Authorized Public Disclosure Authorized Public Disclosure Authorized Public Disclosure Authorized Halving Poverty in Russia by 2024: What will it take? September 2018 Prepared by the
POVERTY PROFILES. Serbia National Poverty Analysis Workshop March 31 April 4, 2008
 POVERTY PROFILES Serbia National Poverty Analysis Workshop March 31 April 4, 2008 Giovanni Vecchi Universita di Roma Tor Vergata giovanni.vecchi@uniroma2.it PLAN OF THE LECTURE 1) The Many Facets of a
Automated labor market diagnostics for low and middle income countries
 Poverty Reduction Group Poverty Reduction and Economic Management (PREM) World Bank ADePT: Labor Version 1.0 Automated labor market diagnostics for low and middle income countries User s Guide: Definitions
SESSION 8 Fiscal Incidence in South Africa
 DG DEVCO Staff Seminar on Social Protection - from strategies to concrete approaches - 26-30 September 2016, Brussels SESSION 8 Fiscal Incidence in South Africa Jon JELLEMA Associate Director for Africa,
Recall the idea of diminishing marginal utility of income. Recall the discussion that utility functions are ordinal rather than cardinal.
 Lecture 11 Chapter 7 in Weimer and Vining Distributional and other goals. Return to the Pareto efficiency idea that is one standard. If a market leads us to a distribution that is not Pareto efficient,
Motivation. Conditional cash transfer (CCT) programs have become very popular: first in Latin America and now across the world
 programs have become very popular: first in Latin America and now across the world") Motivation Conditional cash transfer (CCT) programs have become very popular: first in Latin America and now across the world Motivation Conditional cash transfer (CCT) programs have become very popular:
Motivation Conditional cash transfer (CCT) programs have become very popular: first in Latin America and now across the world Motivation Conditional cash transfer (CCT) programs have become very popular:
The World Bank in Pensions Executive Summary
 The World Bank in Pensions Executive Summary Forthcoming Background Paper for the World Bank 2012 2022 Social Protection and Labor Strategy Mark Dorfman and Robert Palacios March 2012 JEL Codes: I38 welfare
World Bank Support for Pensions
 World Bank Support for Pensions Mark Dorfman, World Bank Social Protection Conference Abidjan, June 2015 1 2 World Bank Twin Goals Ending extreme poverty by 2030 < 3% of global pop. below $1.25 a day Boosting
PERFORMANCE IMPROVEMENT PLANNING MODEL PERFORMANCE ASSESSMENT SYSTEM PROJECT
 PERFORMANCE NING MODEL PERFORMANCE ASSESSMENT SYSTEM PROJECT Contents 2 1. Approach to Performance improvement planning model 2. Data Entry and Forecasts 3. Module I: Performance Assessment 4. Module II:
Nazaire Houssou and Manfred Zeller
 Operational Models for Improving the Targeting Efficiency of Agricultural and Development Policies A systematic comparison of different estimation methods using out-of-sample tests Nazaire Houssou and
The Moldovan experience in the measurement of inequalities
 The Moldovan experience in the measurement of inequalities Veronica Nica National Bureau of Statistics of Moldova Quick facts about Moldova Population (01.01.2015) 3 555 159 Urban 42.4% Rural 57.6% Employment
Pensions Core Course Mark Dorfman The World Bank March 2, 2014
 Pensions Diagnostic Assessment and Conceptual Framework Pensions Core Course Mark Dorfman The World Bank March 2, 2014 Organization 1. Diagnostic assessment process 2. Conceptual framework design typology
Social Protection and Targeted Cash Transfer: Bangladesh Case. Legislation and Policies Specific to Social Security in Bangladesh;
 Social Protection and Targeted Cash Transfer: Bangladesh Case 1 Presentation Outline Key Macro Metrics of Bangladesh; Progress with Human Development; Legislation and Policies Specific to Social Security
Day 6: 7 November international guidelines and recommendations Presenter: Ms. Sharlene Jaggernauth, Statistician II, CSO
 Day 6: 7 November 2011 Topic: Discussion i of the CPI/HIES in T&T in the context t of international guidelines and recommendations Presenter: Ms. Sharlene Jaggernauth, Statistician II, CSO Concept of poverty
Income and Non-Income Inequality in Post- Apartheid South Africa: What are the Drivers and Possible Policy Interventions?
 Income and Non-Income Inequality in Post- Apartheid South Africa: What are the Drivers and Possible Policy Interventions? Haroon Bhorat Carlene van der Westhuizen Toughedah Jacobs Haroon.Bhorat@uct.ac.za
1. Overall approach to the tool development
 Poverty Assessment Tool Submission USAID/IRIS Tool for Ethiopia Submitted: September 24, 2008 Revised (correction to 2005 PPP): December 17, 2009 The following report is divided into six sections. Section
A Quantitative Evaluation of the Greek Social Solidarity Income
 The World Bank Social Protection and Jobs Global Practice A Quantitative Evaluation of the Greek Social Solidarity Income Public Disclosure Authorized Public Disclosure Authorized Public Disclosure Authorized
Poverty: Analysis of the NIDS Wave 1 Dataset
 Poverty: Analysis of the NIDS Wave 1 Dataset Discussion Paper no. 13 Jonathan Argent Graduate Student, University of Cape Town jtargent@gmail.com Arden Finn Graduate student, University of Cape Town ardenfinn@gmail.com
Social Situation Monitor - Glossary
 Social Situation Monitor - Glossary Active labour market policies Measures aimed at improving recipients prospects of finding gainful employment or increasing their earnings capacity or, in the case of
Launch of a flagship anti-poverty program in Romania (VMI)
") Launch of a flagship anti-poverty program in Romania (VMI) Nuts and Bolts of SPL systems in Urban Areas: from Strategy to Delivery Costin Mihalache and Elena Dobre, Chancellery and Ministry of Labor, Family,
Launch of a flagship anti-poverty program in Romania (VMI) Nuts and Bolts of SPL systems in Urban Areas: from Strategy to Delivery Costin Mihalache and Elena Dobre, Chancellery and Ministry of Labor, Family,
Stata as a tool for transparency and statistics dissemination: measuring multidimensional poverty in México
 Stata as a tool for transparency and statistics dissemination: measuring multidimensional poverty in México April 29, 2010 www.coneval.gob.mx Forewords Objectives of CONEVAL Regulate and coordinate the
Background Notes SILC 2014
 Background Notes SILC 2014 Purpose of Survey The primary focus of the Survey on Income and Living Conditions (SILC) is the collection of information on the income and living conditions of different types
SOCIAL SAFETY NETS IN PAKISTAN: PROTECTING AND EMPOWERING POOR AND VULNERABLE HOUSEHOLDS FOCUS GROUP DISCUSSION
 SOCIAL SAFETY NETS IN PAKISTAN: PROTECTING AND EMPOWERING POOR AND VULNERABLE HOUSEHOLDS FOCUS GROUP DISCUSSION Cem Mete, Senior Economist, The World Bank Xiaohui Hou, Economist, The World Bank Iffat Idris,
The Impact of the Public Distribution System on Living Standards Some Microsimulations 5
 The Impact of the Public Distribution System on Living Standards Some Microsimulations 5 1. Introduction According to the World Bank (2007), the Iraqi Public Distribution System (PDS) is probably the largest
Building a Targeting System for Bangladesh based on Proxy Means Testing
 S P D I S C U S S I O N P A P E R NO. 0914 Building a Targeting System for Bangladesh based on Proxy Means Testing Iffath A. Sharif August 2009 Building a Targeting System for Bangladesh based on Proxy
Reducing Inequality and The Brazilian Social Protection System. South-South Learning Forum 2014 Rio de Janeiro, March 17
 Reducing Inequality and The Brazilian Social Protection System South-South Learning Forum 2014 Rio de Janeiro, March 17 REAL GDP PER CAPITA* AND GINI INDEX** (*) Values updated by the GDP deflator (2011).
Pension Diagnostic Assessment Pensions Core Course April 27, Mark C. Dorfman Pensions Team SPL Global Practice The World Bank
 Pension Diagnostic Assessment Pensions Core Course April 27, 2015 Mark C. Dorfman Pensions Team SPL Global Practice The World Bank Organization I. Pension Diagnostic Assessment A. Evaluation Process &
INCOME INEQUALITY AND OTHER FORMS OF INEQUALITY. Sandip Sarkar & Balwant Singh Mehta. Institute for Human Development New Delhi
 INCOME INEQUALITY AND OTHER FORMS OF INEQUALITY Sandip Sarkar & Balwant Singh Mehta Institute for Human Development New Delhi 1 WHAT IS INEQUALITY Inequality is multidimensional, if expressed between individuals,
REDUCING CHILD POVERTY IN GEORGIA:
 REDUCING CHILD POVERTY IN GEORGIA: A WAY FORWARD REDUCING CHILD POVERTY IN GEORGIA: A WAY FORWARD TINATIN BAUM ANASTASIA MSHVIDOBADZE HIDEYUKI TSURUOKA Tbilisi, 2014 ACKNOWLEDGEMENTS This paper draws
Measuring Financial Inclusion:
 Measuring Financial Inclusion: The Global Findex Data Leora Klapper Finance and Private Sector Development Team Development Research Group World Bank GLOBAL FINDEX Financial Inclusion data In depth data
COMMITMENT TO EQUITY: DIAGNOSTIC QUESTIONNAIRE. Working Paper No. 2. August By Nora Lustig
 COMMITMENT TO EQUITY: DIAGNOSTIC QUESTIONNAIRE Working Paper No. 2 August 2012 By Nora Lustig Commitment to Equity: Diagnostic Questionnaire Nora Lustig * CEQ Working Paper Series August 2012 The Commitment
Chapter 9 Chapter Friday, June 4 th
 Chapter 9 Chapter 10 Sections 9.1 9.5 and 10.1 10.5 Friday, June 4 th Parameter and Statisticti ti Parameter is a number that is a summary characteristic of a population Statistic, is a number that is
Social Spending, Taxes and Income Redistribu8on in Colombia. Nora Lus4g; Tulane University, CEQ Director Marcela Meléndez
 Social Spending, Taxes and Redistribu8on in Colombia Nora Lus4g; Tulane University, CEQ Director Marcela Meléndez October 18, 13 Impact of social spending and taxes on inequality and poverty Gini coefficient
Estimating Rates of Return of Social Protection
 Estimating Rates of Return of Social Protection A business case for non-contributory social transfers Franziska Gassmann Andrés Mideros Pierre Mohnen Bangkok, 14 September 2012 Acknowledgments UNICEF Cambodia
Protecting the Poor and Vulnerable 1
 Emil Tesliuc, Lucian Pop and Richard Florescu INDEX Protecting the Poor and Vulnerable 1 I. Overview of the Social Protection System...119 II. The Impact of Social Protection Programs on Income Distribution...124
NEPAL. Public Disclosure Authorized. Public Disclosure Authorized. Public Disclosure Authorized. Public Disclosure Authorized
 Public Disclosure Authorized Public Disclosure Authorized Public Disclosure Authorized Public Disclosure Authorized Health Equity and Financial Protection DATASHEET NEPAL The Health Equity and Financial
Evaluating the effectiveness of the rural minimum living standard guarantee (Dibao) programme in China
 programme in China") Global Development Institute Working Paper Series 2018-022 August 2016 Evaluating the effectiveness of the rural minimum living standard guarantee (Dibao) programme in China Nanak Kakwani 1, Shi Li 2,
Global Development Institute Working Paper Series 2018-022 August 2016 Evaluating the effectiveness of the rural minimum living standard guarantee (Dibao) programme in China Nanak Kakwani 1, Shi Li 2,
Developing Poverty Assessment Tools
 Developing Poverty Assessment Tools A USAID/EGAT/MD Project Implemented by The IRIS Center at the University of Maryland Poverty Assessment Working Group The SEEP Network Annual General Meeting October
Project Information Document/ Identification/Concept Stage (PID)
") Public Disclosure Authorized The World Bank Public Disclosure Authorized Public Disclosure Authorized Project Information Document/ Identification/Concept Stage (PID) Concept Stage Date Prepared/Updated:
Public Disclosure Authorized The World Bank Public Disclosure Authorized Public Disclosure Authorized Project Information Document/ Identification/Concept Stage (PID) Concept Stage Date Prepared/Updated:
1. Setting up a Registry of Beneficiaries (RoB)
") Business Processes or how to : 1. Setting up a Registry of Beneficiaries (RoB) Washington, D.C. December 6, 2012 Rogelio Gómez Hermosillo M WB Consultant Contents Basic features of a RoB Processes in RoB:
Business Processes or how to : 1. Setting up a Registry of Beneficiaries (RoB) Washington, D.C. December 6, 2012 Rogelio Gómez Hermosillo M WB Consultant Contents Basic features of a RoB Processes in RoB:
Questions: Question Option 1 Option 2 Option 3. Q1 Does your household have a television? Q2 a mobile telephone? Yes No. Q3 a refrigerator?
 Myanmar EquityTool: Released September 11, 2018 The EquityTool has been updated based upon new source data. The original version is no longer active but is available upon request. Previous version Released
Measuring the Incidence of Fuel Subsidies
 Measuring the Incidence of Fuel Subsidies June 10, 2013 Benedict Clements Division Chief Fiscal Affairs Department International Monetary Fund Welfare impact of fuel subsidy reform Higher domestic prices
Annex 1 to this report provides accuracy results for an additional poverty line beyond that required by the Congressional legislation. 1.
 Poverty Assessment Tool Submission USAID/IRIS Tool for Kenya Submitted: July 20, 2010 Out-of-sample bootstrap results added: October 20, 2010 Typo corrected: July 31, 2012 The following report is divided
PART 4 - ARMENIA: SUBJECTIVE POVERTY IN 2006
 PART 4 - ARMENIA: SUBJECTIVE POVERTY IN 2006 CHAPTER 11: SUBJECTIVE POVERTY AND LIVING CONDITIONS ASSESSMENT Poverty can be considered as both an objective and subjective assessment. Poverty estimates
Socioeconomic Processes in the Cis Countries
 Doi:10.5901/mjss.2014.v5n24p331 Abstract Socioeconomic Processes in the Cis Countries Battalova A.R Abdullin I.A. Kazan Federal University, Institute of Management, Economics and Finance, Kazan, 420008,
Creating Labor Market Diagnostics in LICs and MICs
 Creating abor Market Diagnostics in ICs and MICs March 2009 otation ational level variables: P- Poverty measure population U number of unemployed in the economy number of economically active (employed
Formulating the needs for producing poverty statistics
 Formulating the needs for producing poverty statistics wynandin imawan, wynandin@bps.go.id BPS-Statistics Indonesia 2 nd EGM on Poverty Statistics StatCom OIC, Ankara 19-20 November 2014 19 NOV 2014 1
A Risk and Vulnerability Assessment
 a This research has been possible by the financial support of the International Development Research Center (IDRC), provided through the Community Based Monitoring System (CBMS) initiative of the Partnership
Setting up a Registry of Beneficiaries for SSN interventions. Rogelio Gómez Hermosillo M WB Consultant December 8, 2011
 Setting up a Registry of Beneficiaries for SSN interventions Rogelio Gómez Hermosillo M WB Consultant December 8, 2011 Contents Uses of the Registry of Beneficiaries Steps and processes to create the Registry
Measuring Poverty in Armenia: Methodological Features
 Working paper 4 21 November 2013 UNITED NATIONS ECONOMIC COMMISSION FOR EUROPE CONFERENCE OF EUROPEAN STATISTICIANS Seminar "The way forward in poverty measurement" 2-4 December 2013, Geneva, Switzerland
A Risk and Vulnerability Assessment
 a This research has been possible by the financial support of the International Development Research Center (IDRC), provided through the Community Based Monitoring System (CBMS) initiative of the Partnership