Endo International plc
|
|
|
- Collin Kelly
- 6 years ago
- Views:
Transcription

1 Endo International plc Q Earnings Report August 8, 2017
2 Forward Looking Statements; Non-GAAP Financial Measures This presentation contains forward looking statements within the meaning of the Private Securities Litigation Reform Act of 1995 and Canadian securities legislation. Statements including words such as believes, expects, anticipates, intends, estimates, plan, will, may, look forward, intend, guidance, future projects or similar expressions are forward looking statements. Because these statements reflect our current views, expectations and beliefs concerning future events, these forward looking statements involve risks and uncertainties. Although Endo believes that these forward looking statements and information are based upon reasonable assumptions and expectations, readers should not place undue reliance on them, or any other forward looking statements or information in this news release. Investors should note that many factors, as more fully described in the documents filed by Endo with securities regulators in the United States and Canada including under the caption Risk Factors in Endo s Form 10-K, Form 10-Q and Form 8-K filings, as applicable, with the Securities and Exchange Commission and with securities regulators in Canada on System for Electronic Document Analysis and Retrieval ( SEDAR ) and as otherwise enumerated herein or therein, could affect Endo s future financial results and could cause Endo s actual results to differ materially from those expressed in any forward looking statements. The forward looking statements in this presentation are qualified by these risk factors. Endo assumes no obligation to publicly update any forward looking statements, whether as a result of new information, future developments or otherwise, except as may be required under applicable securities law. This presentation may refer to non-gaap financial measures, including, among others, adjusted diluted EPS and adjusted EBITDA, that are not prepared in accordance with accounting principles generally accepted in the United States and that may be different from non-gaap financial measures used by other companies. Investors are encouraged to review Endo s current report on Form 8-K furnished to the SEC for Endo s reasons for including those non-gaap financial measures in this presentation. Except as noted on Form 8-K, reconciliation of non-gaap financial measures to the nearest comparable GAAP amounts have been provided within the appendix at the end of this presentation. 1
3 Today s Agenda Overview & Q Snapshot Q Business Unit Performance U.S. Generic Pharmaceuticals U.S. Branded Pharmaceuticals International Pharmaceuticals Q Financial Results Manufacturing restructuring Mesh update 2017 Financial Guidance Update 2
4 Overview Continued operational execution focus drives strong performance Product sales mix and savings from previously announced restructurings grew adjusted EBITDA in Q vs. prior year Delivered solid adjusted bottom-line Q results while making progress on several strategic initiatives Update of FY 2017 Financial Guidance 3
5 Q Snapshot Revenue (US $M) Q Q Y/Y Growth % U.S. Generic Pharmaceuticals $563 $ U.S. Branded Pharmaceuticals $245 $288 (15%) International Pharmaceuticals $67 $67 -- Total $876 $921 (5%) Table may not total due to rounding 4
6 Q Performance: U.S. Generic Pharmaceuticals 600 Reported Revenues in $ Millions $563m Strong performance driven by Sterile Injectables & New Launches / Alternative Dosages % +27% -34% Q Q Base Sterile Injectables New Launches / Alternative Dosages Sterile Injectables: Vasostrict grew 24% vs. prior year Adrenalin gaining share as unapproved products exit New launches / Alt Dosages: Strong performance driven by Q4 16 FTF s; KCl liquid/powder and new injectable launches Launched 5 products in Q2 17 Base business: Declined 34% vs. prior year, due in part, to annualization of 2016 competitive events and product discontinuances; Price erosion in line with our previous expectations 5

7 U.S. Generics: 2017 Progress and Current Pipeline YTD Progress and 2017 Scorecard 9 launches year-to-date; expect >20 product launches with estimated market value: $6bn* 6 regulatory submissions year-to-date; expect to file ~20 regulatory submissions Unapproved sources of Adrenalin starting to vacate the market Expect majority share of the KCl powder market ~40 Confirmed FTF/FTM ~110 Total ANDAs Filed ~90 Total In Dev Total ANDAs as of Q2 17 * Market value defined by IMS sales for 12 months 6
8 Q Performance: U.S. Branded Pharmaceuticals Reported Revenues in $ Millions $245m -15% -30% +16% Specialty: +16% driven by XIAFLEX (+18%) and SUPPRELIN LA (+11%) Continue to expect FY 17 Specialty portfolio and XIAFLEX to grow high-single to lowdouble digit Established Products: -30% driven by Q2 continued decline of pain products, and the Q divestiture of STENDRA - Q Q Specialty Established Products 7
9 Q Performance: International Pharmaceuticals Reported Revenues in $ Millions $67m -11% 13% Q Q Paladin: Q2 17: $28m +10% due to uptake on Nucynta & Xiaflex in addition to delayed competition on certain products Expect 2017 sales to decline midsingle digit due to LOE, but solid gross margin in the high 50% s Litha & Somar: Q2 17: $33m Divested Litha closed on July 3 rd, 2017 Agreement to divest Somar close expected beginning of Q4 17 Paladin & other* Litha & Somar * Includes sales from Endo Ventures Limited and Par UK 8
10 Q2 2017: Financial Results (Continuing Operations*) (US $M, except EPS) Q Q GAAP Non-GAAP GAAP Non-GAAP Revenue $876 $876 $921 $921 Gross Margin 38.4% 61.8% 31.3% 59.1% Operating Income (Loss) ($587) $359 ($48) $312 (Loss) Income from Continuing Operations ($696) $207 $390 $192 Effective Tax Rate NM 13.8% NM 2.0% Diluted Income (Loss) per share Weighted Average Diluted Shares Outstanding ($3.12) $0.93 $1.75 $ * Continuing Operations includes Endo and Par and excludes ASTORA (formerly known as AMS Women s Health) For reconciliation of GAAP to Non-GAAP, please refer to Reconciliation tables in the Q earnings press release 9
11 U.S. Generics: 2017 Manufacturing Restructuring Estimated Financial Impact Cumulative Revenue Reduction ~$10-$15M ~$45-$50M ~$60M Savings, Net of Revenue Reduction ~$5-$10M ~$50-$60M ~$55-$65M One-Time Charges [1] Increase in Inventory Reserve Levels ~$10M N/A ~$10M Intangible Asset Impairments ~$60M N/A ~$60M Fixed Asset Impairment ~$30M N/A ~$30M Fixed Asset Accelerated Depreciation ~$125M ~$40M ~$165M Other Restructuring Expenses ~$50M ~$10M ~$60M [1] Amounts reflected on a U.S. GAAP basis 10
12 Q Mesh Legal Liability Update Mesh Liability Cash Call ($ in millions) Product Liability Accrual (3/31/17) $714 Remaining liability related to previous Master Settlement Agreements (MSAs) Q Payments from QSF / to claimants ($195) Additional Product Liability Accrual (Q2 17) $775 Covers ~22,000 U.S. claims; all known Ex- U.S. claims and other Mesh-related matters Total Product Liability Accrual as of 6/30/17 $1,295 Amount Funded in QSF as of 6/30/17 ($359) Total Remaining Cash Call ~$935 Estimated Phasing: H2 2017: ~$160-$ : ~$500-$ : ~$240-$265 Table may not total due to rounding 11
13 2017 Financial Guidance (Continuing Operations*) Measure Revenue Adjusted EBITDA FY 2017 Financial Guidance $3.38B - $3.53B $1.48B - $1.56B Adjusted Diluted EPS $ $3.65 GAAP Diluted (Loss) per share ($4.76) - ($4.46) The Company s 2017 financial guidance is based on the following assumptions: Adjusted gross margin of approximately 62.5% to 63.5% Adjusted operating expenses as a percentage of revenues to be approximately 22.5% Adjusted interest expense of approximately $490 million to $500 million Adjusted effective tax rate of approximately 14.0% Adjusted diluted EPS and GAAP Diluted (Loss) per share from continuing operations assumes full-year adjusted diluted shares outstanding of approximately 224 million shares and 223 million shares, respectively. H2 Phasing: ~50% of revenue and ~45% of adjusted diluted EPS in Q3 Note: FY 17 net cash tax receipts of approximately $15 million * Continuing Operations includes Endo and Par and excludes ASTORA (formerly known as AMS Women s Health) 12
14 2017: Cash Flow Update $ in Millions FY 2017 Guidance Q2 17 YTD Low High Adjusted EBITDA Range $866 $1,480 $1,560 Cash Interest ($220) ~($465) Changes in Working Capital and Other Assets & Liabilities $227 $220 Cash Taxes, net refund (payments) $9 ~$15 Milestone/Commercial Payments ($6) ~($40) Restructuring and Integration Related Costs [1] ($59) ~($100) Cash Flow from Operations Pre-Mesh and Other Settlements $816 ~$1,110 ~$1,190 Cash into the QSF and paid mesh legal expenses: YTD 17 $547M FY 17 $735M Non-Mesh Settlement Payments [2] ($10) ~($50) Cash Distributions to Settle Mesh Claims and Related Legal Expenses [3] ($465) ~($975) Cash Flow from Operations $341 ~$85 ~$165 Change in Restricted Cash ($83) ~$240 Capital Expenditures ($60) ~($140) Other [4] ($79) ~$80 Cash Flow Prior to Debt Payments [5] $119 ~$265 ~$345 [1] FY 17 Guidance includes restructuring and integration related costs of ~$30M related to the Pain/Branded Restructuring, ~$20M of Severance costs related to the Corporate and R&D restructuring, ~$40M in restructuring costs related to the Generics restructuring and rationalization, ~$10M in costs associated with ASTORA Women s Health [2] Non-Mesh Settlement Payments represent additional legal settlements and expenses that Endo paid Q2 17 YTD and expects to pay in FY 17 [3] Cash Distributions to Settle Mesh Claims and Related Legal Expenses for Q2 17 YTD and FY 17 represent direct payments and payments from Qualified Settlement Funds to settle mesh product liabilities, as well as mesh related legal expenses [4] Other FY 17 includes proceeds from the divestiture of Litha Products, Somar and the Charlotte manufacturing facility, as well as contingent consideration payments 13 [5] Q2 YTD Cash Flow Prior to Debt Payments includes $21M related to Litha and Somar, which is classified as Movement in cash held for sale on the Statement of Cash Flows, and excludes $29M of net debt proceeds from the Q2 refinancing. Table may not total due to rounding
15 Q&A
16 Appendix
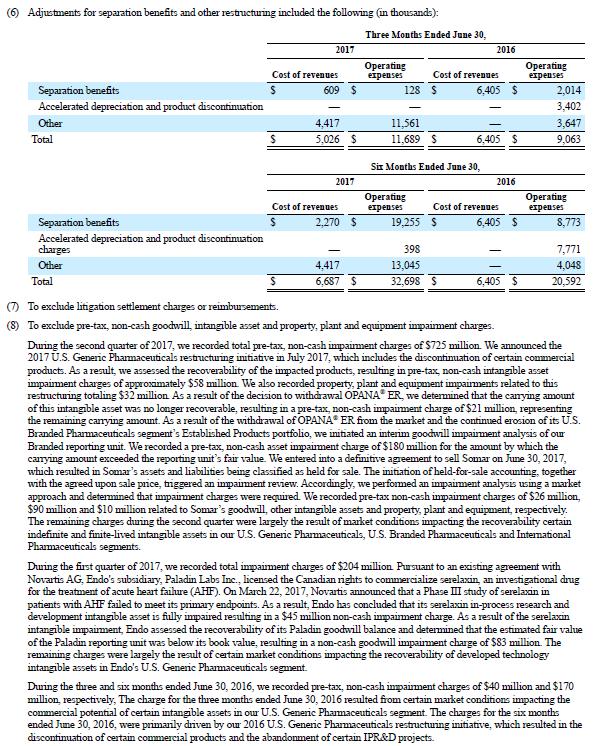
17 Q Mesh Update Beginning in the second quarter of 2017, Endo aggressively executed a settlement strategy in connection with our U.S. Mesh product liability litigation and we have reached agreements to resolve virtually all known U.S. product liability claims and are engaged in discussions to resolve the known remaining U.S. claims at reasonable values. We believe that, in considering the potential costs and continued distraction of litigation, putting this litigation substantially behind us through settlements enables us to move forward with even greater focus on executing against our core strategic priorities. We also believe this action will assist most mesh claimants in moving forward with their lives. The $775M mesh product liability charge in Q2 17 reflects an estimate for the expected future payments related to the resolved U.S. mesh product liability claims (resolved claims are subject to a validation process), the small portion of known unresolved U.S. claims, all of the known international mesh product liability claims and other mesh-related matters. With respect to the resolved claims, Endo agreed to make installment payments beginning in the fourth quarter of 2017 and continuing through the fourth quarter of We are unable to estimate the number of claims that might be made in the future; however, our expectation is that future cases will not be brought on a mass basis due to a number of factors; specifically, case management orders, global resolution with all key plaintiff attorneys, we are no longer selling mesh (as of March 31, 2016); settlements entered into by other manufacturers / decrease in advertising and the continued running of statutes of limitations. Confidential 16
18 Cash Conversion Cycle We use days sales outstanding (DSO), days inventory outstanding (DIO) and days payable outstanding (DPO), the sum of which is the cash conversion cycle, to evaluate our working capital performance. The following table summarizes the details of the financial metrics used to calculate these working capital performance statistics for the quarters ended June 30, 2017, March 31, 2017, December 31, 2016 and December 31, 2015 (in thousands except for ratios): June 30, 2017 March 31, 2017 December 31, 2016 December 31, 2015 Total Revenue $ 875,731 $ 1,037,600 $ 1,241,513 $ 1,073,697 DSO: Accounts Receivable, net of allowance $ 580,123 $ 689,602 $ 992,153 $ 1,014,808 Less: Returns and allowances (310,852) (321,408) (332,455) (356,932) Accounts Receivable, adjusted for non-cash items $ 269,271 $ 368,194 $ 659,698 $ 657,876 Total revenues per day $ 9,623 $ 11,529 $ 13,495 $ 11,671 DSO DIO: Inventories, net $ 489,752 $ 549,138 $ 555,671 $ 752,493 Plus: Long-term inventory 27,169 24,923 22,705 24,891 Less: Inventory step-up (438) (538) (652) (111,190) Inventory, adjusted for long-term and non-cash items $ 516,483 $ 573,523 $ 577,724 $ 666,194 Total revenues per day $ 9,623 $ 11,529 $ 13,495 $ 11,671 DIO DPO: Trade Accounts Payable $ 114,710 $ 97,681 $ 126,712 $ 146,450 Plus: Accrued Royalties and Partner Payables 63, , , ,622 Plus: Accrued Rebates and Chargebacks paid in cash 236, , , ,479 Trade Accounts Payable, adjusted for royalties and rebates $ 415,109 $ 463,651 $ 578,943 $ 635,551 Total revenues per day $ 9,623 $ 11,529 $ 13,495 $ 11,671 DPO Cash Conversion Cycle

19 Reconciliation of Non-GAAP Measures 18

20 Reconciliation of Non-GAAP Measures 19

21 Reconciliation of Non-GAAP Measures 20

22 Reconciliation of Non-GAAP Measures 21

23 Reconciliation of Non-GAAP Measures 22

24 Reconciliation of Non-GAAP Measures 23
25 Reconciliation of Non-GAAP Measures 24
26 Endo International plc Q Earnings Report August 8, 2017
Endo International plc
 Endo International plc Q4 2017 Earnings Report February 27, 2018 Forward Looking Statements; Non-GAAP Financial Measures This presentation contains forward looking statements within the meaning of the
Endo International plc
 Endo International plc UBS Healthcare Conference May 23, 2017 Forward Looking Statements; Non-GAAP Financial Measures This presentation contains forward looking statements within the meaning of the Private
Endo International plc
 Endo International plc Q2 2015 Earnings Report August 10, 2015 Forward Looking Statements; Non-GAAP Financial Measures This presentation contains forward-looking statements within the meaning of the Private
Endo International plc
 Endo International plc Q1 2015 Earnings Report May 11, 2015 Forward Looking Statements; Non-GAAP Financial Measures This presentation contains forward-looking statements within the meaning of the Private
Endo International plc
 Endo International plc UBS Global Healthcare Conference May 21, 2014 Forward Looking Statements; Non-GAAP Financial Measures This presentation contains forward-looking statements within the meaning of
Endo Health Solutions
 Endo Health Solutions 4Q 2013 Earnings Report and Announcing The New Endo February 28, 2014 Forward Looking Statements; Non-GAAP Financial Measures This presentation contains forward-looking statements
Endo International plc Bank of America Merrill Lynch Healthcare Conference May 10, 2016
 Endo International plc Bank of America Merrill Lynch Healthcare Conference May 10, 2016 Forward Looking Statements; Non-GAAP Financial Measures This presentation contains forward-looking statements within
ENDO REPORTS FOURTH-QUARTER AND FULL-YEAR 2017 FINANCIAL RESULTS
 ENDO REPORTS FOURTH-QUARTER AND FULL-YEAR 2017 FINANCIAL RESULTS Fourth-quarter 2017 revenues of $769 million; Full-year 2017 revenues of $3,469 million Fourth-quarter 2017 Sterile Injectables revenues
Endo International plc Q Financial Results and Revised Financial Guidance May 5, 2016
 Endo International plc Q1 2016 Financial Results and Revised Financial Guidance May 5, 2016 Forward Looking Statements; Non-GAAP Financial Measures This presentation contains forward-looking statements
Endo Health Solutions
 Endo Health Solutions 3Q 2013 Earnings Report and A Compelling Combination: Endo Health Solutions and Paladin Labs November 5, 2013 Offer Language Disclosures This communication is not intended to and
McKesson Corporation Q2 Fiscal 2019 Financial Performance. Financial Results and Company Highlights October 25, 2018
 McKesson Corporation Q2 Fiscal 2019 Financial Performance Financial Results and Company Highlights October 25, 2018 Forward-Looking Statements Some of the information in this presentation is not historical
Fourth Quarter and Full Year 2017 Results. March 1, 2018
 1 Fourth Quarter and Full Year 2017 Results March 1, 2018 Impax Cautionary Statement Regarding Forward Looking Statements 2 "Safe Harbor" statement under the Private Securities Litigation Reform Act of
SWK Holdings Corporation Announces 2017 Third Quarter Financial Results
 Source: SWK Holdings Corporation November 10, 2017 08:49 ET SWK Holdings Corporation Announces 2017 Third Quarter Financial Results Total revenues of approximately $5.5 million for the third quarter of
Cardinal Health, Inc. Earnings Investor/Analyst call May 1, 2017
 Q3 FY2017 Cardinal Health, Inc. Earnings Investor/Analyst call May 1, 2017 Copyright 2017, Cardinal Health, Inc. or one of its subsidiaries. All rights reserved Forward-looking statements and GAAP reconciliation
First Quarter 2019 Earnings Presentation February 6, 2019
 First Quarter 2019 Earnings Presentation February 6, 2019 Cautionary statements This presentation contains forward-looking statements that are subject to known and unknown risks and uncertainties, many
Mar. 31, Jun. 30, 2017
 Consolidated GAAP Statements of Operations ($ in thousands, except EPS) March 31, ended Net Revenues $921,580 $1,059,429 $1,134,224 $191,972 $209,032 $195,443 $593,755 $1,190,202 $199,725 Consumer 870,959
Allegion Second-Quarter 2018 Results. July 26, 2018
 Allegion Second-Quarter 2018 Results July 26, 2018 Safe Harbor This presentation contains "forward-looking statements" within the meaning of the Private Securities Litigation Reform Act of 1995, including
Sabre reports third quarter 2018 results
 Sabre reports third quarter 2018 results Sabre third quarter revenue increased 7.7% to $970.3 million Travel Network revenue rose 10.7%; bookings grew 7.7% Airline Solutions revenue increased 1.1% Hospitality
Q3 Fiscal Year 2018 Investor Presentation Financial Results Conference Call
 February Sept 6, 2018 2017 Q3 Fiscal Year 2018 Investor Presentation Financial Results Conference Call Mark D. Morelli President and Chief Executive Officer Gregory P. Rustowicz Vice President Finance
Teva Pharmaceutical Industries Ltd. Fourth Quarter 2018 Results February 13, 2019
 Teva Pharmaceutical Industries Ltd. Fourth Quarter 2018 Results February 13, 2019 Cautionary Note Regarding Forward-Looking Statements This presentation contains forward-looking statements within the meaning
Second Quarter 2018 Earnings Presentation May 8, 2018
 Second Quarter 2018 Earnings Presentation May 8, 2018 Cautionary statements This presentation contains forward-looking statements that are subject to known and unknown risks and uncertainties, many of
2
 News Release 1 2 3 4 5 6 Ashland Global Holdings Inc. and Consolidated Subsidiaries Table 1 STATEMENTS OF CONSOLIDATED INCOME (LOSS) (In millions except per share data - preliminary and unaudited) Three
First Quarter 2018 Earnings Call Financial Results & Corporate Update. May 8, 2018
 First Quarter 2018 Earnings Call Financial Results & Corporate Update May 8, 2018 Disclaimer This presentation includes certain statements that constitute forward-looking statements within the meaning
Mylan Q EARNINGS November 5, Q Earnings All Results are Unaudited
 Mylan Q3 EARNINGS November 5, Q3 Earnings All Results are Unaudited Forward-Looking Statements This presentation contains forward-looking statements. These statements are made pursuant to the safe harbor
Quarterly Fact Sheet - Q4 FY16
 Amounts in millions, except per share amounts, ASP, percentages 1 Updated as of September 7, 2016 Revenue $4,035 $3,824 $3,764 $3,728 $3,804 $3,972 $3,703 $3,651 $3,943 $3,888 $3,550 $3,191 $3,360 $3,317
ACQUISITION AND INTEGRATION EXPENSES - 19,
 Unaudited Investors Report 2015 2016 2017 2018 ($ in Thousands, Except Per Share Data) Total Total 1st Qtr 2nd Qtr 6 mos 3rd Qtr 9 mos 4th Qtr Total 1st Qtr 2nd Qtr 6 mos 3rd Qtr 9 mos 4th Qtr Total REVENUE
Fourth Quarter and Fiscal 2018 Supplemental Information (1) (Dollars and shares in millions, except per share data, unaudited)
 (Dollars and shares in millions, except per share data, unaudited)") Fourth Quarter and Fiscal 2018 Supplemental Information (1) (Dollars and shares in millions, except per share data, unaudited) Q4FY18 Q4FY17 Y/Y Growth FY18 FY17 Y/Y Growth Revenues and Earnings Results
Fourth Quarter and Fiscal 2018 Supplemental Information (1) (Dollars and shares in millions, except per share data, unaudited) Q4FY18 Q4FY17 Y/Y Growth FY18 FY17 Y/Y Growth Revenues and Earnings Results
2
 1 2 3 4 5 6 Ashland Global Holdings Inc. and Consolidated Subsidiaries Table 1 STATEMENTS OF CONSOLIDATED INCOME (LOSS) (In millions except per share data - preliminary and unaudited) Three months ended
McKesson Corporation Fiscal 2018 Financial Performance Fiscal 2019 Annual Outlook. Financial Results and Company Highlights May 24, 2018
 McKesson Corporation Fiscal 2018 Financial Performance Fiscal 2019 Annual Outlook Financial Results and Company Highlights Forward-Looking Statements Some of the information in this presentation is not
News Release H&R Block Announces Fiscal 2014 Results CEO Perspective
 News Release For Immediate Release: June 11, 2014 H&R Block Announces Fiscal 2014 Results Total revenues increased $118 million, or 4%, to $3.024 billion 1 EBITDA increased 8% to $940 million, or 31% of
Albemarle Corporation Second Quarter 2018 Earnings and Non-GAAP Reconciliations Conference Call/Webcast Wednesday, August 8 th, :00am ET
 Albemarle Corporation Second Quarter 2018 Earnings and Non-GAAP Reconciliations Conference Call/Webcast Wednesday, August 8 th, 2018 9:00am ET Forward-Looking Statements Some of the information presented
GILAT SATELLITE NETWORKS LTD. CONDENSED CONSOLIDATED STATEMENTS OF OPERATIONS U.S. dollars in thousands (except share and per share data)
") CONDENSED CONSOLIDATED STATEMENTS OF OPERATIONS (except share and per share data) 2016 2015 2016 2015 Audited Revenues $ 279,551 $ 197,543 $ 80,345 $ 67,682 Cost of revenues 204,061 143,318 56,147 47,181
CONDENSED CONSOLIDATED STATEMENTS OF OPERATIONS (except share and per share data) 2016 2015 2016 2015 Audited Revenues $ 279,551 $ 197,543 $ 80,345 $ 67,682 Cost of revenues 204,061 143,318 56,147 47,181
Twitter. 1Q 2014 Earnings Report
 Twitter 1Q 2014 Earnings Report 1 Forward-looking statements and non-gaap information This presentation and the accompanying press release and conference call contain forward-looking statements that are
Cardinal Health, Inc. Earnings Investor/Analyst call November 6, 2017
 Q1 FY2018 Cardinal Health, Inc. Earnings Investor/Analyst call November 6, 2017 Copyright 2017, Cardinal Health, Inc. or one of its subsidiaries. All rights reserved Forward-looking statements and GAAP
Quarterly Fact Sheet - Q1 FY17
 Non-GAAP Financial Measures Update Beginning with the financial guidance provided for the Company's second fiscal quarter 2017, the Company has revised the presentation of its non-gaap financial results
FLEX RECONCILIATION OF GAAP TO NON-GAAP FINANCIAL MEASURES (In thousands, except per share amounts)
") FLEX RECONCILIATION OF GAAP TO NON-GAAP FINANCIAL MEASURES (In thousands, except per share amounts) Q1 FY17 Q2 FY17 Q3 FY17 Q4 FY17 Q1 FY18 GAAP gross profit $ 405,995 6.9% 313,691 5.2% 416,455 6.8% 384,804
FLEX RECONCILIATION OF GAAP TO NON-GAAP FINANCIAL MEASURES (In thousands, except per share amounts) Q1 FY17 Q2 FY17 Q3 FY17 Q4 FY17 Q1 FY18 GAAP gross profit $ 405,995 6.9% 313,691 5.2% 416,455 6.8% 384,804
INC Research Q4 & Full Year 2016 Financial Results. February 28, 2017
 INC Research Q4 & Full Year 2016 Financial Results February 28, 2017 Forward Looking Statements & Non-GAAP Financial Measures Forward-Looking Statements Except for historical information, all of the statements,
LENDINGTREE REPORTS RECORD FOURTH QUARTER RESULTS; INCREASES 2015 OUTLOOK
 Exhibit 99.1 LENDINGTREE REPORTS RECORD FOURTH QUARTER RESULTS; INCREASES 2015 OUTLOOK Record Revenue of $43.9 million; up 21% over fourth quarter 2013 Record Variable Marketing Margin of $17.5 million;
Mylan: Q EARNINGS August 8, Q Earnings All Results are Unaudited
 Mylan: Q2 2018 EARNINGS August 8, 2018 Q2 2018 Earnings All Results are Unaudited Forward-Looking Statements This presentation contains forward-looking statements. These statements are made pursuant to
DELL INC. Condensed Consolidated Statement of Financial Position (in millions) (unaudited)
 (unaudited)") Condensed Consolidated Statement of Financial Position Assets: Cash & cash equivalents $ 13,913 $ 14,061 $ 14,623 $ 13,293 $ 13,852 $ 10,635 $ 13,913 $ 13,852 Short-term investments 452 418 509 545 966
Condensed Consolidated Statement of Financial Position Assets: Cash & cash equivalents $ 13,913 $ 14,061 $ 14,623 $ 13,293 $ 13,852 $ 10,635 $ 13,913 $ 13,852 Short-term investments 452 418 509 545 966
Q Earnings. Supplemental Financials. September 25, 2018
 Q3 2018 Earnings Supplemental Financials September 25, 2018 Forward-looking statements This presentation contains forward-looking statements within the meaning of the federal securities laws, including
Net sales $ 1,890 $ 1,738 $ 7,745 $ 7,467 Cost of sales 1,444 1,406 5,794 5,683 Gross profit ,951 1,784
 Condensed Consolidated Statements of Operations - Unaudited Three Months Ended Twelve Months Ended December 31, December 31, 2012 2011 2012 2011 Net sales $ 1,890 $ 1,738 $ 7,745 $ 7,467 Cost of sales
Third Quarter Fiscal 2018 Supplemental Information (1)
") Third Quarter Fiscal 2018 Supplemental Information (1) (Dollars and shares in millions, except per share data, unaudited) Q3FY18 Q3FY17 (2) Y/Y Growth Revenues and Earnings Results GAAP Revenues $1,209
Third Quarter Fiscal 2018 Supplemental Information (1) (Dollars and shares in millions, except per share data, unaudited) Q3FY18 Q3FY17 (2) Y/Y Growth Revenues and Earnings Results GAAP Revenues $1,209
Cardinal Health, Inc. Earnings Investor/Analyst call May 3, 2018
 Q3 FY18 Cardinal Health, Inc. Earnings Investor/Analyst call May 3, 2018 Copyright 2018, Cardinal Health, Inc. or one of its subsidiaries. All rights reserved Forward-looking statements and GAAP reconciliation
Alphabet Announces Fourth Quarter and Fiscal Year 2017 Results
 Alphabet Announces Fourth Quarter and Fiscal Year 2017 Results MOUNTAIN VIEW, Calif. February 1, 2018 Alphabet Inc. (NASDAQ: GOOG, GOOGL) today announced financial results for the quarter and fiscal year
Q Financial Results
 Q4 2016 Financial Results February 2, 2017 Copyright Fortinet Inc. All rights reserved. Safe Harbor Statement Information, statements and projections contained in these presentation slides and related
Fourth Quarter and Full-Year 2018 Earnings Call February 20, 2019
 Fourth Quarter and Full-Year 2018 Earnings Call February 20, 2019 1 2019 2017 ServiceSource International, Inc. All rights reserved. Important Information This presentation refers to certain non-gaap financial
Cardinal Health, Inc. Earnings Investor/Analyst call February 8, 2018
 Q2 FY2018 Cardinal Health, Inc. Earnings Investor/Analyst call February 8, 2018 Copyright 2018, Cardinal Health, Inc. or one of its subsidiaries. All rights reserved Forward-looking statements and GAAP
Alphabet Announces Fourth Quarter and Fiscal Year 2018 Results
 Alphabet Announces Fourth Quarter and Fiscal Year 2018 Results MOUNTAIN VIEW, Calif. February 4, 2019 Alphabet Inc. (NASDAQ: GOOG, GOOGL) today announced financial results for the quarter and fiscal year
Fourth Quarter and FY 2018 Earnings Presentation November 28, 2018
 Fourth Quarter and FY 2018 Earnings Presentation November 28, 2018 Cautionary statements This presentation contains forward-looking statements that are subject to known and unknown risks and uncertainties,
Grace Reports Third Quarter 2012 Adjusted EPS of $1.04 and Narrows 2012 Earnings Outlook
 Media Relations Mike Jones T +1 410.531.8228 mike.jones@grace.com Investor Relations Mark Sutherland T +1 410.531.4590 mark.sutherland@grace.com Grace Reports Third Quarter 2012 Adjusted EPS of $1.04 and
EMC CORPORATION Consolidated Income Statements (in millions, except per share amounts) (unaudited)
 (unaudited)") EMC CORPORATION Consolidated Income Statements (in millions, except per share amounts) Three Months Ended Twelve Months Ended December 31, December 31, December 31, December 31, 2013 2012 2013 2012 Revenues:
EMC CORPORATION Consolidated Income Statements (in millions, except per share amounts) Three Months Ended Twelve Months Ended December 31, December 31, December 31, December 31, 2013 2012 2013 2012 Revenues:
Manitex International, Inc. (NASDAQ:MNTX)
") Manitex International, Inc. (NASDAQ:MNTX) Conference Call Fourth Quarter March 6th, 2017 Forward Looking Statements & Non GAAP Measures Safe Harbor Statement under the U.S. Private Securities Litigation
Manitex International, Inc. (NASDAQ:MNTX) Conference Call Fourth Quarter March 6th, 2017 Forward Looking Statements & Non GAAP Measures Safe Harbor Statement under the U.S. Private Securities Litigation
W. R. Grace & Co. Fourth Quarter 2014 Business Update. Investor Presentation February 5, 2015
 W. R. Grace & Co. Fourth Quarter Business Update Investor Presentation February 5, 2015 Disclaimer Statement Regarding Safe Harbor For Forward-Looking Statements This presentation contains forward-looking
Management Presentation. Fourth Quarter 2017 Results. February 22, 2018
 Management Presentation Fourth Quarter 207 Results February 22, 208 FORWARD LOOKING STATEMENTS & OTHER INFORMATION This presentation, including our 208 Financial Outlook, contains forward-looking statements.
SELLING, GENERAL AND ADMINISTRATIVE EXPENSES 170, ,985 41,506 45,195 86,702 44, ,068 46, ,219 45,556 46,792 92,348 50, ,820
 Unaudited Investors Report 2015 2016 2017 2018 ($ in Thousands, Except Per Share Data) Total Total 1st Qtr 2nd Qtr 6 mos 3rd Qtr 9 mos 4th Qtr Total 1st Qtr 2nd Qtr 6 mos 3rd Qtr 9 mos REVENUE 2,299,321
BOSTON SCIENTIFIC ANNOUNCES RESULTS FOR THIRD QUARTER ENDED SEPTEMBER 30, 2014
 FOR IMMEDIATE RELEASE BOSTON SCIENTIFIC ANNOUNCES RESULTS FOR THIRD QUARTER ENDED SEPTEMBER 30, 2014 Marlborough, Mass. (October 22, 2014) -- Boston Scientific Corporation (NYSE: BSX) generated sales of
Q Financial Results
 Q1 2018 Financial Results May 3, 2018 Copyright Fortinet Inc. All rights reserved. Safe Harbor Statement Information, statements and projections contained in these presentation slides and related conference
FLEX RECONCILIATION OF GAAP TO NON-GAAP FINANCIAL MEASURES
 FLEX RECONCILIATION OF GAAP TO NON-GAAP FINANCIAL MEASURES (In thousands, except per share amounts) Q1 FY17 Q2 FY17 Q3 FY17 Q4 FY17 Q1 FY18 Q2 FY18 GAAP gross profit $ 405,995 6.9% $ 313,691 5.2% $ 416,455
Q3 Fiscal Year 2019 Financial Highlights
 Q3 Fiscal Year 2019 Financial Highlights For the quarter ended October 31, 2018 November 29, 2018 Forward Looking Statements Certain statements in this communication may contain forward looking statements
Sanmina. Q3 FY 18 Results. July 30, 2018 WHAT WE MAKE, MAKES A DIFFERENCE
 Sanmina Q3 FY 18 Results July 30, 2018 WHAT WE MAKE, MAKES A DIFFERENCE Concept to Delivery / Advanced Technology / Manufacturing & Global Supply Chain Solutions / Systems & Intelligence Safe Harbor Statement
Q Earnings. November 2, 2016
 Q4 2016 Earnings November 2, 2016 Forward-Looking Statements and Non-GAAP Measures Forward-Looking Statements This presentation contains certain forward-looking statements within the meaning of the U.S.
Safe Harbor and Non-GAAP Measures
 Safe Harbor and Non-GAAP Measures Forward-Looking Statements This presentation contains statements about future events and expectations that constitute forward-looking statements. Forward-looking statements
Quest by the Numbers: Capital Efficient, Profitable Growth. Mark Guinan Senior Vice President and Chief Financial Officer
 Quest by the Numbers: Capital Efficient, Profitable Growth Mark Guinan Senior Vice President and Chief Financial Officer SAFE HARBOR DISCLOSURE The statements in the following presentation that are not
Gates Industrial Reports Record Third-Quarter 2018 Results
 Gates Industrial Reports Record Third-Quarter 2018 Results Denver, CO, November 1, 2018 Third-Quarter 2018 Highlights Net sales up 8.9% year-over-year to third-quarter record of $828.4 million. Net income
2Q17 EARNINGS AUGUST 2017
 2Q17 EARNINGS AUGUST 2017 FORWARD-LOOKING STATEMENTS The statements contained in this release that refer to plans and expectations for the next quarter, the full year or the future are forward-looking
Trimble Second Quarter 2018 Results Summary
 Trimble Second Quarter 2018 Results Summary Forward-looking statements Certain statements made in this presentation and any subsequent Q&A period are forward-looking statements, within the meaning of Section
Q4 FY18 CARDINAL HEALTH, INC. EARNINGS CALL AUGUST 6, 2018
 Q4 FY18 CARDINAL HEALTH, INC. EARNINGS CALL AUGUST 6, 2018 1 Forward-looking statements and GAAP reconciliation Cautions Concerning Forward-Looking Statements This presentation contains forward-looking
Explanation of Non-GAAP Financial Measures
 Explanation of Non-GAAP Financial Measures We report our financial results in accordance with U. S. generally accepted accounting principles ( GAAP ). However, management believes that, in order to more
Q Earnings Report. Sabre Corporation August 4, 2015
 Q2 2015 Earnings Report Sabre Corporation August 4, 2015 1 Forward-looking Statements Forward Looking Statements Certain statements herein are forward-looking statements about trends, future events, uncertainties
Alphabet Inc. CONSOLIDATED BALANCE SHEETS (In millions, except share amounts which are reflected in thousands and par value)
") Assets Current assets: Alphabet Inc. CONSOLIDATED BALANCE SHEETS (In millions, except share amounts which are reflected in thousands and par value) As of December 31, 2015 As of December 31, 2016 (unaudited)
Assets Current assets: Alphabet Inc. CONSOLIDATED BALANCE SHEETS (In millions, except share amounts which are reflected in thousands and par value) As of December 31, 2015 As of December 31, 2016 (unaudited)
Data. Insights. Results.
 Image Area Data. Insights. Results. Raymond James 26 th Annual Institutional Investors Conference March 2005 Safe Harbor Certain statements we make today are forward-looking within the meaning of US federal
Q4 Fiscal Year 2018 Investor Presentation Financial Results Conference Call
 May Sept 30, 2018 2017 Q4 Fiscal Year 2018 Investor Presentation Financial Results Conference Call Mark D. Morelli President and Chief Executive Officer Gregory P. Rustowicz Vice President Finance & Chief
Fact Sheet. February 22, 2018
 Fact Sheet February 22, 2018 Financial summary FINANCIAL SUMMARY GUIDANCE [E] ($ millions, except per share data) Q1 FY16 Q2 FY16 Q3 FY16 Q4 FY16 FY16 Q1 FY17 Q2 FY17 Q3 FY17 Q4 FY17 FY17 Q1 FY18 Q2 FY18
Q EARNINGS PRESENTATION
 Q4 2018 EARNINGS PRESENTATION December 18, 2018 International is a registered trademark of, Inc. Safe Harbor Statement and Other Cautionary Notes Information provided and statements contained in this report
NET SALES $2,774 $2,645 5% COST OF SALES 1,612 1,543 4% GROSS MARGIN 1,162 1,102 5% % of Net Sales 41.9% 41.7% 0.2 pts
 BAXTER -- PAGE 11 Consolidated Statements of Income Three Months Ended December 31, 2017 and 2016 (in millions, except per share and percentage data) Three Months Ended December 31, 2017 2016 Change NET
ACTELION LTD FIRST QUARTER 2015 FINANCIAL REPORT.
 ACTELION LTD FIRST QUARTER 2015 FINANCIAL REPORT. APRIL 21, 2015 2 CONTENTS 03 FIRST QUARTER 2015 FINANCIAL REVIEW 15 UNAUDITED FIRST QUARTER 2015 CONSOLIDATED FINANCIAL STATEMENTS Disclaimer and notes
(Unaudited) Reconciliation GAAP to Non-GAAP (In thousands) Pro Forma As Adjusted. Pro Forma Adjustments. Pro Forma As Adjusted. Pro Forma Adjustments
 Reconciliation GAAP to Non-GAAP (In thousands) Pro Forma As Adjusted. Pro Forma Adjustments. Pro Forma As Adjusted. Pro Forma Adjustments") Supplemental Presentation of Selected Quarterly Non-GAAP Financial Information for Fiscal Years 2014-2015, Including Proforma Related to Automotive Business Divesture and Reconciliation to GAAP As announced
Supplemental Presentation of Selected Quarterly Non-GAAP Financial Information for Fiscal Years 2014-2015, Including Proforma Related to Automotive Business Divesture and Reconciliation to GAAP As announced
PCM Reports Record First Quarter 2018 Results
 PCM Reports Record First Quarter 2018 Results April 25, 2018 Net Sales Grew 4% to a First Quarter Record $542.8 Million Gross Profit Margin Improves 40 Basis Points to a Record 15.4% Sales of Services
First Quarter 2016 Business Update
 Focused. First Quarter 2016 Business Update Innovative. Investor Presentation April 27, 2016 Performance Driven. Disclaimer Statement Regarding Safe Harbor For Forward-Looking Statements This presentation
Alphabet Announces Third Quarter 2018 Results
 Alphabet Announces Third Quarter 2018 Results MOUNTAIN VIEW, Calif. October 25, 2018 Alphabet Inc. (NASDAQ: GOOG, GOOGL) today announced financial results for the quarter ended. "Our business continues
Q1 Fiscal Year 2019 Financial Highlights
 Fiscal Year 2019 Financial Highlights For the quarter ended April 30, 2018 May 31, 2018 Forward-Looking Statements Certain statements in this communication may contain forward-looking statements within
Sabre reports first quarter 2018 results
 Sabre reports first quarter 2018 results First quarter revenue increased 8.0% Travel Network revenue rose 8.7%, with bookings growth of 5.7% Airline Solutions revenue grew 6.7% Hospitality Solutions revenue
Lee Enterprises reports fourth quarter earnings
 Exhibit 99.1 - News Release Fourth fiscal quarter ended September 27,. NEWS RELEASE 201 N. Harrison St. Davenport, IA 52801 www.lee.net Lee Enterprises reports fourth quarter earnings DAVENPORT, Iowa (December
3 rd Quarter 2018 Earnings Release Conference Call
 3 rd Quarter 2018 Earnings Release Conference Call October 31, 2018 1 2018 Belden Inc. belden.com @beldeninc Safe Harbor Statement Our commentary and responses to your questions may contain forward-looking
Q Earnings. April 26, 2017
 Q2 2017 Earnings April 26, 2017 Forward-Looking Statements and Non-GAAP Measures Forward-Looking Statements This presentation contains certain forward-looking statements within the meaning of the U.S.
EMC CORPORATION Consolidated Income Statements (in millions, except per share amounts) (unaudited)
 (unaudited)") EMC CORPORATION Consolidated Income Statements (in millions, except per share amounts) Three Months Ended March 31, March 31, 2016 2015 Revenues: Product sales $ 2,682 $ 2,905 Services 2,793 2,708 5,475
EMC CORPORATION Consolidated Income Statements (in millions, except per share amounts) Three Months Ended March 31, March 31, 2016 2015 Revenues: Product sales $ 2,682 $ 2,905 Services 2,793 2,708 5,475
Q Investor Highlights. August 8, 2018
 Q2 2018 Investor Highlights August 8, 2018 Forward Looking Statements This document contains forward-looking statements, that is, information related to future, not past, events. Such statements generally
DANAHER CORPORATION Second Quarter 2018 Earnings Release. July 19, 2018
 DANAHER CORPORATION Second Quarter 2018 Earnings Release July 19, 2018 Forward Looking Statements Statements in this presentation that are not strictly historical, including any statements regarding the
CORNING INCORPORATED AND SUBSIDIARY COMPANIES CONSOLIDATED STATEMENTS OF OPERATIONS (Unaudited; in millions, except per share amounts)
") CONSOLIDATED STATEMENTS OF OPERATIONS (Unaudited; in millions, except per share amounts) For the three months ended March 31, 2005 2004 Net sales $ 1,050 $ 844 Cost of sales 621 544 Gross margin 429 300
CONSOLIDATED STATEMENTS OF OPERATIONS (Unaudited; in millions, except per share amounts) For the three months ended March 31, 2005 2004 Net sales $ 1,050 $ 844 Cost of sales 621 544 Gross margin 429 300
Illumina Q Financial Results August 1, Illumina, Inc. All rights reserved.
 Illumina Q2 2017 Financial Results August 1, 2017 2017 Illumina, Inc. All rights reserved. Safe Harbor Statement This communication may contain forward-looking statements that involve risks and uncertainties,
TEVA REPORTS FOURTH QUARTER AND FULL YEAR 2018 FINANCIAL RESULTS. Revenues $18.9 billion $4.6 billion
 TEVA REPORTS FOURTH QUARTER AND FULL YEAR 2018 FINANCIAL RESULTS FY 2018 Q4 2018 Revenues $18.9 billion $4.6 billion Cash flow from operations $2.4 billion $0.4 billion GAAP loss per share $2.35 $2.85
Fiscal 2018 Third Quarter Results. 28 June 2018
 Fiscal 2018 Third Quarter Results 28 June 2018 Safe harbor and non-gaap Cautionary Note Regarding Forward-Looking Statements: All statements in these materials and the related presentation that are not
Fourth Quarter 2015 Earnings Call February 11, 2016
 Fourth Quarter 205 Earnings Call February, 206 Copyright 206 Quintiles Forward Looking Statements and Use of Non-GAAP Financial Measures This presentation contains forward-looking statements within the
American Eagle Outfitters Report Second Quarter Results, Comp Sales Increased 2%, Sales and EPS Above Expectations
 NEWS RELEASE American Eagle Outfitters Report Second Quarter Results, Comp Sales Increased 2%, Sales and EPS Above Expectations 8/23/2017 PITTSBURGH--(BUSINESS WIRE)-- American Eagle Outfitters, Inc. (NYSE:AEO)
FORWARD-LOOKING STATEMENTS:
 Safe Harbor FORWARD-LOOKING STATEMENTS: This presentation contains forward-looking statements concerning management's expectations, goals, objectives and similar matters, which are subject to risks and
Fourth Quarter and Full Year February 22, 2018
 Fourth Quarter and Full Year 2017 February 22, 2018 Forward-Looking Statements This presentation contains forward-looking statements within the meaning of the Private Securities Litigation Reform Act of
FINAL NEWS RELEASE CONTACTS: News Media Colin Wheeler (303) Investor Relations Dave Dunnewald (303)
 Investor Relations Dave Dunnewald (303)") FINAL NEWS RELEASE CONTACTS: News Media Colin Wheeler (303) 927-2443 Investor Relations Dave Dunnewald (303) 927-2334 Molson Coors Reports Higher Net Sales and Underlying After-Tax Income for the Third
FINAL NEWS RELEASE CONTACTS: News Media Colin Wheeler (303) 927-2443 Investor Relations Dave Dunnewald (303) 927-2334 Molson Coors Reports Higher Net Sales and Underlying After-Tax Income for the Third
Third quarter 2011 Adjusted EBITDA was $11.9 million, up 88% compared with $6.3 million in the comparable prior year quarter.
 At the Company: Akorn, Inc. Tim Dick, Chief Financial Officer (847) 279-6150 FOR IMMEDIATE RELEASE Akorn Reports Record Third Quarter 2011 Financial Results -Revenues of $36.67 million or a 69% increase
3Q 2017 Earnings Presentation. November 9, 2017
 3Q 2017 Earnings Presentation November 9, 2017 Cautionary Statement Concerning Forward-Looking Statements and Non-GAAP Financial Measures This presentation contains forward-looking statements within the