Cuban Public Opinion Survey
|
|
|
- Piers Chambers
- 6 years ago
- Views:
Transcription


1 Cuban Public Opinion Survey
2 Survey Methodology Dates of Interviewing: The fieldwork was conducted January 28 - February 10, Data Collection Method: Stratified-intercept methodology based on personal, face-to-face interviews in Cuba. Sample Size: 463 Cuban adults (age 18 and older). Sample: Interviews were conducted in twelve (12) Cuban provinces: Ciudad de La Habana, Provincia de La Habana, Pinar del Río, Matanzas, Sancti Spiritus, Villa Clara, Cienfuegos, Ciego de Ávila, Camaguey, Holguín, Guantánamo, Las Tunas. The sample was stratified by province, then by sub-units within each province. Interviewees were allocated by gender and age quotas. The final selection of each interviewee was random. Respondents: The sample selection for province, gender and age are based on the last available Cuban census data, released in Maximum Sample Margin of Error: Margin of error of ± five percent for a 95 percent level of confidence.
3 Demographics


4 Demographics: Gender and Age Gender Age Female 46.0% Male 54.0% 30 to % 40 to % 50 to % 18 to % 60 or Older 17.1% 4
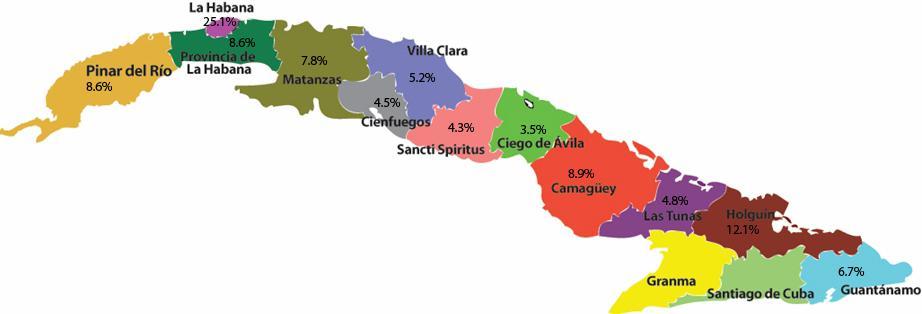
5 Demographics: Province 5

6 Demographics: Education and Race Education Race University or Higher 22.0% No Answer 3.7% Do Not Know 5.2% None 6.3% Primary 9.7% White 55.7% Intermediary 24.0% Secondary 29.2% Afro-Cuban 44.3% 6


7 Demographics: Profession or Job Full Sample Those Not Working (N = 125) 12.5% 1.9% 13.6% 27.0% 35.2% 40.0% 3.2% 24.8% 40.8% Works for the Cuban Government in a Leading Position Works for the Cuban Government as an Employee Works for a Mixed or Foreign Company Works as Autonomous, Farmer or Private Business Owner Works Full-Time in the House Works in the Informal Economy as Main Source of Income Not Working 0.9% Not Working Student Retired/Pensioner 7


8 Demographics: Receiving Remittances from Family Members or Friends Abroad Full Sample Those Receiving Remittances (N = 118) No Answer 2.4% Yes 25.5% At Least Every Year 38.8% At Least Every Six Months 30.6% No 72.1% Once a Month 30.6% 8
9 Perspectives on Cuba
10 Generally speaking, would you say things in Cuba are going very well, well, so-so, badly or very bad? 40% 35% 30% 25% 35.3% 35.0% 31.4% 33.7% 28.9% 33.3% 31.3% 29.9% 26.7% 18.2% 22.2% 20.8% February 2011 August 2009 November 2008 April 2008 October % 15% 10% 9.8% 2.4% 15.3% 15.5% 15.4% 16.2% 13.8% 19.9% 19.9% 12.1% 5% 4.2% 1.6% 2.2% 1.3% 0.5% 1.0% 0.7% 1.4% 0% Very Well Well So, So-So Badly Very Badly No Answer 10
11 Generally speaking, would you say things in Cuba are going very well, well, so-so, badly or very bad? (by age) 100% 90% 80% 3.1% 11.9% 12.6% 6.3% 1.3% 2.5% 15.8% 15.2% 70% 60% 40.6% 38.7% 37.5% 22.4% 21.5% 50% 40% 30% 35.6% 34.2% 38.5% 36.8% 29.1% 20% 10% 0% 24.1% 21.1% 10.9% 13.5% 14.6% 7.6% 1.0% 0.9% 2.6% or Older Very Well Well So-So Badly Very Badly No Answer 11
12 Generally speaking, would you say things in Cuba are going very well, well, so-so, badly or very bad? (by education) 100% 90% 13.8% 4.4% 11.1% 1.8% 2.0% 10.8% 11.9% 11.8% 80% 70% 34.5% 24.4% 37.8% 36.3% 31.4% 60% 50% 40% 30% 41.4% 37.8% 36.0% 33.3% 36.3% 20% 10% 0% 10.3% 20.0% 17.8% 16.7% 12.6% 2.2% 0.9% 0.7% 2.0% None Primary Intermediary Secondary University or Higher Very Well Well So-So Badly Very Badly No Answer 12
13 What do you think is the biggest problem in Cuba? 0% 10% 20% 30% 40% 50% 60% 70% Low Salaries / High Cost of Living Food Scarcity Double Currency Standard Lack of / Dilapidated Housing Lack of Freedoms / Political System Embargo / Isolation Health / Lack of Medicines Poor Transportation Infrastucture Other (Drugs, Insecurity, Corruption) There are No Problems No Answer Do Not Know 12.7% 19.7% 12.8% 6.8% 11.6% 11.2% 12.0% 7.6% 13.8% 2.2% 5.0% 1.4% 7.9% 2.4% 3.8% 1.3% 9.5% 6.9% 8.9% 18.2% 3.5% 8.8% 6.4% 8.5% 4.8% 1.1% 1.6% 2.5% 4.1% 0.2% 0.4% 2.3% 4.7% 4.1% 3.6% 0.4% 0.2% 1.7% 2.5% 1.2% 2.4% 2.8% 3.5% 1.5% 6.3% 0.4% 0.5% 1.4% 2.7% 1.4% 0.9% 40.0% 42.6% 43.1% 42.5% February 2011 August 2009 November 2008 April 2008 October % Hurricanes 1.9% 13

14 What do you think is the biggest problem in Cuba? (by age) 14

15 What do you think is the biggest problem in Cuba? (by education) 15
16 What do you think is the biggest problem in Cuba? (by receipt of remittances) 100% 90% 80% 70% 2.5% 4.4% 1.7% 8.9% 8.5% 4.3% 0.6% 6.5% 4.2% 4.3% 9.3% 60% 50% 40% 58.5% 67.4% 30% 20% 10% 0% 13.6% 10.9% 1.7%.9% Yes Do Not Receive Remittances Medicines Food Salary Double Currency Embargo Transportation Housing Lack of freedoms Other 16


17 Do you believe the current government will succeed in solving Cuba s biggest problem in the next few years? 17


18 Do you believe the current government will succeed in solving Cuba s biggest problem in the next few years? (by age) 18
19 Do you believe the current government will succeed in solving Cuba s biggest problem in the next few years? (by education) 100% 90% 80% 70% 6.9% 7.0% 5.5% 7.4% 3.4% 1.5% 12.9% 3.0% 60% 50% 40% 86.2% 74.4% 83.5% 76.3% 68.3% 30% 20% 10% 0% 3.4% 18.6% 11.0% 14.8% 15.8% None Primary Intermediary Secondary University or Higher Yes No No Answer Do Not Know 19


20 Overall, would you say your family s economic situation has gotten worse, improved or stayed the same from two years ago? 20
21 Attitudes Toward Political and Economic Change
22 If you were given the opportunity to vote to change from the current political system to a democratic system with multi-party elections, freedom of speech and freedom of expression would you vote in favor of, or against, that change? February % 9.3% 4.5% 8.0% August % 5.8% 19.0% November % 32.4% 4.6% April % 24.9% 13.6% October % 14.2% 10.2% 0% 10% 20% 30% 40% 50% 60% 70% 80% 90% 100% In Favor Opposed No Answer Do Not Know 22

23 If you could, would you vote in favor or against such a political change? (by age) 100% 90% 80% 6.9% 7.2% 3.6% 11.4% 9.4% 11.9% 14.5% 29.1% 70% 60% 24.1% 50% 40% 93.1% 89.2% 79.2% 73.7% 30% 20% 46.8% 10% 0% or Older In Favor Against No Answer 23
24 If you were given the opportunity to vote to change from the current political system to a democratic system with multi-party elections, freedom of speech and freedom of expression would you vote in favor of, or against, that change? (by education) 100% 90% 80% 70% 60% 50% 3.4% 10.3% 13.8% 11.1% 8.1% 8.9% 8.8% 0.9% 2.2% 8.1% 4.4% 2.9% 3.9% 11.1% 7.4% 40% 30% 72.4% 75.6% 82.9% 79.3% 84.3% 20% 10% 0% None Primary Intermediary Secondary University or Higher In Favor Against No Answer Do Not Know 24

25 If you were given the opportunity to vote to change from the current economic system to a market economy system with economic freedoms, including opportunities for Cubans to own property and run businesses would you vote in favor of, or against, that change? 25
26 If you were given the opportunity to vote to change from the current economic system to a market economy system with economic freedoms, including opportunities for Cubans to own property and run businesses would you vote in favor of, or against, that change? (by age) 100% 90% 2.0%.9% 1.8% 3.1% 2.6% 1.8% 5.2% 1.3% 2.6% 7.6% 7.6% 80% 15.2% 70% 60% 50% 40% 30% 98.0% 97.3% 90.6% 93.4% 69.6% 20% 10% 0% or Older In Favor Against No Answer Do Not Know 26
27 If you were given the opportunity to vote to change from the current economic system to a market economy system with economic freedoms, including opportunities for Cubans to own property and run businesses would you vote in favor of, or against, that change? (by education) 100% 90% 3.4% 10.3% 2.2% 6.7% 2.2% 2.7% 4.5% 0.7% 1.5% 0.7% 2.9% 1.0% 2.9% 80% 70% 60% 50% 40% 86.2% 88.9% 92.8% 97.0% 93.1% 30% 20% 10% 0% None Primary Intermediary Secondary University or Higher In Favor Against No Answer Do Not Know 27
28 Do you currently have a job? (N = 463) Formal Economy (N = 266) Informal Economy (N = 197) 28
29 How concerned are you that you will lose your job in the next 12 months? (Formal Economy; N = 266) 29
30 Does your salary cover your needs in a satisfactory manner? (Formal Economy; N = 266) 30
31 Does your salary cover your needs in a satisfactory manner? (by age) 100% (Formal Economy; N = 266) 90% 80% 31.3% 34.9% 41.3% 38.8% 45.5% 70% 60% 50% 40% 30% 54.2% 46.5% 46.0% 34.7% 36.4% 20% 10% 0% 18.4% 16.3% 14.6% 9.5% 18.2% 2.3% 3.2% 8.2% or Older It is Largely Sufficient It is Barely Sufficient It is Not Sufficient It is Not Sufficient At All 31
32 100% Does your salary cover your needs in a satisfactory manner? (by education) (Formal Economy; N = 266) 90% 80% 70% 25.0% 42.3% 38.1% 48.7% 26.9% 60% 50.0% 50% 40% 30% 20% 10% 0% 25.0% 42.3% 52.4% 7.7% 7.7% 39.7% 50.0% 19.2% 9.5% 10.3% 1.3% 3.8% None Primary Intermediary Secondary University or Higher It is Largely Sufficient It is Barely Sufficient It is Not Sufficient It is Not Sufficient At All 32
33 Have you participated in group discussions led by the Cuba government in anticipation of the April Communist Party Congress? 33


34 Do you feel that as a result of that participation, your opinion is likely to be incorporated in the decision process? (N = 88) 34
35 Cubans Access to Information Technology

36 Do you have access to the Internet or ? 36

37 How often do you have access to your or the Internet? 37
38 Do you have access to the Internet or ? (by age) 100% 90% 80% 70% 60% 57.4% 64.0% 78.1% 73.7% 50% 96.2% 40% 30% 20% 10% 0% 32.7% 32.4% 16.7% 21.1% 9.9% 3.6% 5.2% 5.3% 3.8% or Older Access to the Internet Only Account Nothing 38
39 Do you have access to the Internet or ? (by education) 100% 90% 80% 70% 51.0% 60% 82.8% 77.8% 79.3% 74.8% 50% 40% 30% 20% 10% 0% 17.2% 22.2% 17.1% 3.6% 17.0% 41.2% 8.1% 7.8% None Primary Intermediary Secondary University or Higher Access to the Internet Only Account Nothing 39


40 Do you regularly use a cellular phone? 40
41 Do you regularly use a cellular phone? (by age) 100% 90% 80% 70% 60% 50% 59.40% 64.90% 84.4% 75.0% 96.2% 40% 30% 20% 10% 0% 40.60% 35.10% 25.0% 15.6% 3.8% or Older Yes No 41
42 Do you regularly use a cellular phone? (by education) 100% 90% 80% 70% 60% 50% 40% 30% 89.7% 77.8% 76.6% 77.0% 60.8% 20% 10% 0% 10.3% 22.2% 23.4% 23.0% 39.2% None Primary Intermediary Secondary University or Higher Yes No 42
43 Do you regularly use a cellular phone? (by Internet access) 100% 90% 80% 39.1% 70% 60% 50% 40% 65.4% 80.1% 30% 60.9% 20% 10% 34.6% 19.9% 0% Access to the Internet Only Account Nothing Yes No 43
Cuban Public Opinion Survey June 30 July 13, 2011
 Cuban Public Opinion Survey June 30 July 13, 2011 Survey Methodology Dates of Interviewing: The fieldwork was conducted June 30 July 13, 2011. Data Collection Method: Stratified-intercept methodology based
Cuban Public Opinion Survey February 29 March 14, 2012
 Cuban Public Opinion Survey February 29 March 14, 2012 Survey Methodology Dates of Interviewing: Fieldwork conducted February 29 March 14, 2012. Data Collection Method: Stratified-intercept methodology
The Economist/YouGov Poll
 Interviewing: Sample: 1500 Adults nationwide online 1004 registered voters nationwide online Weekly Tracking For immediate release 2 1. Presidential Job Approval Historical Do you approve or disapprove
Cuentapropistas: A Survey of Cuban Entrepreneurs. October 26 November 25, 2017
 Cuentapropistas: A Survey of Cuban Entrepreneurs October 26 November 25, 2017 Methodology The survey was conducted by a research firm based in Latin America under the supervision of the Center for Insights
National Survey of Bangladeshi Public Opinion. April 10 May 21, 2018
 National Survey of Bangladeshi Public Opinion April 10 May 21, 2018 Detailed Methodology The survey was conducted by IRI s Center for Insights in Survey Research and Creative Research and Development under
HuffPost: Midterm elections March 23-26, US Adults
 1. Following midterm election news How closely have you been following news about the 2018 midterm elections? Gender Age (4 category) Race (4 category) Total Male Female 18-29 30-44 45-64 65+ White Black
How the Survey was Conducted Nature of the Sample: NPR/PBS NewsHour/Marist Poll of 1,075 National Adults
 How the Survey was Conducted Nature of the Sample: NPR/PBS NewsHour/Marist Poll of 1,075 This survey of 1,075 adults was conducted November 28 th through December 4 th, 2018 by The Marist Poll sponsored
UNIVERSITY OF SOUTH CAROLINA INSTITUTE FOR PUBLIC SERVICE AND POLICY RESEARCH
 UNIVERSITY OF SOUTH CAROLINA INSTITUTE FOR PUBLIC SERVICE AND POLICY RESEARCH South Carolinians Guardedly Optimistic About the Economy Columbia, SC -- As they make their way through the busy Christmas
Coloradans Perspectives on Health, Quality of Life, and Midterm Elections
 October 2018 Coloradans Perspectives on Health, Quality of Life, and Midterm Elections The Kaiser Family Foundation/Colorado Health Foundation Prepared by: Ashley Kirzinger, Bryan Wu, Liz Hamel, Mollyann
ASSOCIATED PRESS-LIFEGOESSTRONG.COM BOOMERS SURVEY CONDUCTED BY KNOWLEDGE NETWORKS March 16, 2011
 1350 Willow Rd, Suite 102 Menlo Park, CA 94025 www.knowledgenetworks.com Interview dates: March 04 March 13, 2011 Interviews: 1,490 adults, including 1,160 baby boomers Sampling margin of error for a 50%
Results by Oversampled Audiences June 2014
 Results by Oversampled Audiences June 2014 SURVEY OVERVIEW Methodology Penn Schoen Berland completed 3,279 telephone interviews between April 3, 2014 and May 6, 2014 This report includes the following
HuffPost: Trump and Immigration September 5-6, US Adults
 1. Most important issue Which two of these issues are the MOST important to you? Select up to TWO issues. The economy 37% 41% 33% 30% 36% 39% 41% 38% 29% 30% 51% Foreign policy 9% 10% 8% 6% 10% 9% 12%
Swaziland Strives To Reduce Poverty, Empower Women Swaziland Round 5 Release Event 4
 WWW.AFROBAROMETER.ORG Swaziland Strives To Reduce Poverty, Empower Women Swaziland Round 5 Release Event 4 What is the Afrobarometer? The Afrobarometer is an independent, nonpartisan research project that
How the Survey was Conducted Nature of the Sample: McClatchy-Marist Poll of 1,249 National Adults
 How the Survey was Conducted Nature of the Sample: McClatchy-Marist Poll of 1,249 This survey of 1,249 adults was conducted July 5 th through July 9 th, 2016 by The Marist Poll sponsored and funded in
Recession s Toll is Written in Cutbacks, Layoffs and Worry
 ABC NEWS/WASHINGTON POST POLL: ECONOMIC ANXIETY EMBARGOED FOR RELEASE AFTER 12:01 a.m. Wednesday, Dec. 17, 2008 Recession s Toll is Written in Cutbacks, Layoffs and Worry Across the country s kitchen tables,
Georgian National Study
 Georgian National Study March, 00 International Republican Institute Baltic Surveys Ltd. / The Gallup Organization The Institute of Polling And Marketing with funding from the United States Agency for
Voices of 50+ New Hampshire: Dreams & Challenges
 2011 Voices of 50+ New Hampshire: Dreams & Challenges Executive Summary AARP has a strong commitment to help improve the lives of the 50+ population. As part of the Association s continuous communication
PENSION POLL 2015 TOPLINE RESULTS
 PENSION POLL 2015 TOPLINE RESULTS RELEASED: FEBRUARY 6, 2015 The Reason-Rupe Pension Poll interviewed 1,003 adults on both mobile (501) and landline (502) phones, including 290 respondents without landlines,
Survey of Burma/Myanmar Public Opinion. March 9 April 1, 2017
 Survey of Burma/Myanmar Public Opinion March 9 April 1, 2017 Detailed Methodology Period : March 9, 2017 - April 1, 2017 Survey Type : In-person, in-home interviews Eligibility : The survey is a national
Hoover Institution Golden State Poll Fieldwork by YouGov December 9, January 4, List of Tables
 List of Tables 1. Family finances over the last year............................................................ 2 2. Family finances next six months............................................................
HuffPost: Political activity November 8-9, US Adults
 1. Politically active How politically active would you say you are? Very politically active 17% 22% 13% 17% 11% 17% 25% 19% 12% 11% 13% Somewhat politically active 32% 36% 29% 24% 29% 36% 38% 33% 33% 20%
Voices of African Americans 50+ in New York: Dreams & Challenges
 2011 Voices of African Americans 50+ in New York: Dreams & Challenges Executive Summary AARP has a strong commitment to help improve the lives of the 50+ population. As part of the Association s continuous
2015 Life + Money Survey: Americans Biggest Financial Fears
 Brought to you by 2015 Life + Money Survey: Americans Biggest Financial Fears v What Are Americans Biggest Financial Fears? GOBankingRates surveyed 5,001 U.S. adults, asking, What is your biggest financial
Random digital dial Results are weighted to be representative of registered voters Sampling Error: +/-4% at the 95% confidence level
 South Carolina Created for: American Petroleum Institute Presented by: Harris Poll Interviewing: November 18 22, 2015 Respondents: 607 Registered Voters in South Carolina Method: Telephone Sample: Random
with UNDP for the Republic of Cuba 31 July 2018 NDA Strengthening & Country Programming
 with UNDP for the Republic of Cuba 31 July 2018 NDA Strengthening & Country Programming PAGE 1 OF 29 Ver. 24 July 2018 Readiness and Preparatory Support Proposal How to complete this document? - A readiness
How the Survey was Conducted Nature of the Sample: MSNBC/Telemundo/Marist Poll of 1,446 National Adults
 How the Survey was Conducted Nature of the Sample: MSNBC/Telemundo/Marist Poll of 1,446 This survey of 1,446 adults was conducted March 23 rd through April 5 th, 2015 by The Marist Poll sponsored and funded
Reason-Rupe January 2015 National Poll Princeton Survey Research Associates International January 27, pm
 Reason-Rupe January 2015 National Poll Princeton Survey Research Associates International January 27, 2015 3pm N = 1,000 (500 from Landline RDD Sample / 500 from Cell RDD Sample) Interviewing dates: January
2005 Health Confidence Survey Wave VIII
 2005 Health Confidence Survey Wave VIII June 30 August 6, 2005 Hello, my name is [FIRST AND LAST NAME]. I am calling from National Research, a research firm in Washington, D.C. May I speak to the youngest
MONEY IN POLITICS JANUARY 2016
 JANUARY 2016 JANUARY 2016 PAGE 2 TABLE OF CONTENTS I. INTRODUCTION... 3 METHODOLOGY... 4 II. EXECUTIVE SUMMARY... 5 III. SUMMARY OF RESULTS... 8 IV. DATA TABLES... 27 V. DEMOGRAPHICS... 50 VI. QUESTIONNAIRE...
Results of SurveyUSA Election Poll # Page 1
 In North Carolina, Tillis-Hagan U.S. Senate Race Ends Where it Started, Exactly Even: One week till votes are counted in the high-profile, spare-no-expense contest for United States Senator from North
What America Is Thinking On Energy Issues February 2016
 What America Is Thinking On Energy Issues February 2016 South Carolina Presented by: Harris Poll Interviewing: January 22-31, 2016 Respondents: 600 Registered Voters Method: Telephone Weighting: Results
What America Is Thinking About Energy Issues February 2016 Presented by: Harris Poll
 What America Is Thinking About Energy Issues February 2016 Virginia Presented by: Harris Poll Interviewing: January 22 February 1, 2016 Respondents: 630 Registered Voters Method: Telephone Weighting: Results
Ukraine May 14-28, 2013
 Public Opinion Survey Residents of the Ukraine May -, International Republican Institute Baltic Surveys Ltd./The Gallup Organization Rating Group Ukraine with funding from the National Endowment for Democracy
July Sub-group Audiences Report
 July 2013 Sub-group Audiences Report SURVEY OVERVIEW Methodology Penn Schoen Berland completed 4,000 telephone interviews among the following groups between April 4, 2013 and May 3, 2013: Audience General
HuffPost: Net neutrality December 14-18, US Adults
 1. Heard of net neutrality Have you heard of the term "net neutrality"? Yes 67% 77% 57% 68% 55% 72% 71% 70% 51% 58% 84% No 33% 23% 43% 32% 45% 28% 29% 30% 49% 42% 16% Totals 100% 100% 100% 100% 100% 100%
February Franklin & Marshall College Poll PHILADELPHIA STATE OF THE CITY SUMMARY OF FINDINGS
 For immediate release Thursday, February 10, 2011 February 2011 Franklin & Marshall College Poll PHILADELPHIA STATE OF THE CITY SUMMARY OF FINDINGS Prepared by: Center for Opinion Research Floyd Institute
What America Is Thinking Access Virginia Fall 2013
 What America Is Thinking Access Virginia Fall 2013 Created for: American Petroleum Institute Presented by: Harris Interactive Interviewing: September 24 29, 2013 Respondents: 616 Virginia Registered Voters
EMBARGOED FOR RELEASE: Thursday, May 5 at 1:00 p.m.
 Interviews with 1,001 adult Americans conducted by telephone by ORC International on April 28 May 1, 2016. The margin of sampling error for results based on the total sample is plus or minus 3 percentage
MAJORITIES OF CALIFORNIANS SUPPORT THE NATION S NEW HEALTH CARE LAW, BUT THINK MORE HEALTH CARE SYSTEM CHANGES ARE NEEDED.
 THE FIELD POLL THE INDEPENDENT AND NON-PARTISAN SURVEY OF PUBLIC OPINION ESTABLISHED IN 1947 AS THE CALIFORNIA POLL BY MERVIN FIELD Field Research Corporation 601 California Street, Suite 900 San Francisco,
THE BIA REPORT ON CONSUMER CONFIDENCE THE UNIVERSITY OF NEW HAMPSHIRE SURVEY CENTER
 February 23, 2016 THE BIA REPORT ON CONSUMER CONFIDENCE THE UNIVERSITY OF NEW HAMPSHIRE SURVEY CENTER NH CONSUMERS OPTIMISTIC ABOUT NH BUSINESS CONDITIONS, BELIEVE HOUSEHOLD FINANCES WILL STAY THE SAME
ASSOCIATED PRESS-LIFEGOESSTRONG.COM BOOMERS SURVEY OCTOBER 2011 CONDUCTED BY KNOWLEDGE NETWORKS October 14, 2011
 2100 Geng Road Suite 100 Palo Alto, CA 94303 www.knowledgenetworks.com Interview dates: October 5 October 12, 2011 Interviews: 1,410 adults; 1,095 boomers Sampling margin of error for a 50% statistic with
Puerto Rico - Hispanic
 Puerto Rico - Hispanic 2011 53 State Survey Annotated Questionnaire 2011 Unweighted n=301; Sampling Error= ±5.5% The total percent of respondents in each question may add up to more than 100% due to rounding
2014 WINTER REPORT ON NEW JERSEY CONSUMER CONFIDENCE
 Embargoed for release 5am, Monday, March 3, 2014 Contact: Krista Jenkins Office: 973.443.8390 Cell: 908.328.8967 kjenkins@fdu.edu 13 pp. 2014 WINTER REPORT ON NEW JERSEY CONSUMER CONFIDENCE THE STATUS
HuffPost: Speaker Ryan resignation April 11-13, US Adults
 1. Congressional Republican job approval Overall, do you approve or disapprove of the way that Republicans in Congress are handling their jobs? Strongly approve 4% 5% 4% 5% 3% 5% 4% 5% 1% 4% 8% Somewhat
Marist College Institute for Public Opinion Poughkeepsie, NY Phone Fax
 Marist College Institute for Public Opinion Poughkeepsie, NY 12601 Phone 845.575.5050 Fax 845.575.5111 www.maristpoll.marist.edu NY1-Marist Poll Almost Two-Thirds Expect Another Storm NYC Will Be Ready,
February 24, 2014 Media Contact: Joanna Norris, Associate Director Department of Public Relations (904)
") February 24, 2014 Media Contact: Joanna Norris, Associate Director Department of Public Relations (904) 620-2102 University of North Florida Poll Reveals that a Vast Majority of Duval County Residents
February 24, 2014 Media Contact: Joanna Norris, Associate Director Department of Public Relations (904) 620-2102 University of North Florida Poll Reveals that a Vast Majority of Duval County Residents
HuffPost: Safe schools February 23-25, US Adults
 1. Most schools in the U.S. Generally speaking, how safe do you think most schools in the U.S. are? Very safe 14% 18% 10% 10% 16% 15% 14% 16% 10% 11% 10% Somewhat safe 38% 43% 33% 39% 32% 39% 43% 43% 30%
What is your gender? What is your age group? Are you of Hispanic, Latino or Spanish origin? Were you born in the United States?
 Survey Instrument What is your gender? Valid Female 248 49.5 49.5 49.5 Male 252 50.5 50.5 100.0 What is your age group? Valid 18-34 212 42.5 42.5 42.5 35-54 191 38.3 38.3 80.8 55+ 96 19.2 19.2 100.0 Are
EMBARGOED FOR RELEASE: Tuesday, March 7 at 6:00 a.m.
 Interviews with 1,025 adult Americans conducted by telephone by ORC International on March 1-4, 2017. The margin of sampling error for results based on the total sample is plus or minus 3 percentage points.
NEW JERSEY DIVIDED ON GAS TAX HIKE
 Please attribute this information to: Monmouth University Poll West Long Branch, NJ 07764 www.monmouth.edu/polling Released: Thursday, February 5, 2015 Contact: PATRICK MURRAY 732-263-5858 (office) 732-979-6769
Voices of 50+ Hispanics in New York: Dreams & Challenges
 2011 Voices of 50+ Hispanics in New York: Dreams & Challenges Executive Summary AARP has a strong commitment to help improve the lives of the 50+ population. As part of the Association s continuous communication
HuffPost: Family separation June 19-20, US Adults
 1. Congressional control Thinking ahead to the 2018 elections, which party would you rather see control Congress? The Democratic Party 34% 30% 37% 29% 36% 34% 34% 31% 53% 28% 30% The Republican Party 36%
Egyptian Public Opinion Survey April 14 April 27, Williams and Associates Salem, Massachusetts
 Egyptian Public Opinion Survey April 14 April 27, 2011 Williams and Associates Salem, Massachusetts www.williamspolls.com Survey Specifications With funding from the United States Agency for International
What America Is Thinking On Energy Issues January 2015
 What America Is Thinking On Energy Issues January 2015 South Carolina Offshore Drilling Presented by: Harris Poll Interviewing: January 13-15, 2015 Respondents: 604 Registered Voters Method: Telephone
How the Survey was Conducted Nature of the Sample: HBO Real Sports/Marist Poll of 1,298 National Adults
 How the Survey was Conducted Nature of the Sample: HBO Real Sports/Marist Poll of 1,298 This survey of 1,298 adults was conducted September 15 th through September 20 th, 2016 by The Marist Poll, sponsored
THE VALUE OF LABOR AND VALUING LABOR: The Effects of Employment on Personal Well-Being and Unions on Economic Well-Being
 FOR IMMEDIATE RELEASE THE VALUE OF LABOR AND VALUING LABOR: The Effects of Employment on Personal Well-Being and Unions on Economic Well-Being A Special Labor Day Report from the Life, Liberty, and Happiness
New Jersey economic issues poll April 5-14, 2018 Stockton Polling Institute Weighted frequencies
 New Jersey economic issues poll April 5-14, 2018 Stockton Polling Institute Weighted frequencies Q1. How would you rate the U.S. economy: Frequency Valid Valid Excellent 47 6.6 6.6 6.6 Good 302 42.1 42.1
Consumer Perceptions and Reactions to the CARD Act
 Consumer Perceptions and Reactions to the CARD Act Prepared for: Consumer Financial Protection Bureau Prepared by: Synovate Date: February 22 nd 11 Synovate 11 0 Contents Executive Summary 2 Research Overview
Registered voters Gender Age (4 category) Race (4 category)
 Race (4 category)") 1. Percentage voting What percentage of Americans do you think will vote in the upcoming midterm election? 0-10 2% 1% 2% 3% 5% 6% 0% 0% 2% 3% 7% 2% 10-20 1% 1% 2% 1% 3% 2% 1% 0% 1% 3% 3% 2% 20-30 5% 5%
1. Percentage voting What percentage of Americans do you think will vote in the upcoming midterm election? 0-10 2% 1% 2% 3% 5% 6% 0% 0% 2% 3% 7% 2% 10-20 1% 1% 2% 1% 3% 2% 1% 0% 1% 3% 3% 2% 20-30 5% 5%
Rising Consumer Confidence Lays Ground for Future Spending
 Rising Consumer Confidence Lays Ground for Future Spending Credit Crunch Tracking 2013 (1) Consumer Confidence is Up! The positive trend in consumer outlook for the Irish economy continues; with more people
HuffPost: Steve Bannon January 9-10, US Adults
 1. Trump favorability Do you have a favorable or unfavorable opinion of President Donald Trump? Very favorable 25% 29% 21% 10% 20% 28% 39% 30% 13% 10% 23% Somewhat favorable 15% 16% 13% 17% 17% 17% 6%
The American Dream Survey:
 The American Dream Survey: Hope and Fear in Working America Prepared by Lake Research Partners 1 Summary Description of Methods Interview Dates: August 14 and August 20, 2006. 800 interviews of a random
Opinion Poll. Small Businesses Support ACA Over Replacement Plan. March 23, 2017
 Opinion Poll Small Businesses Support ACA Over Replacement Plan March 23, 2017 Small Business Majority 1101 14 th Street, NW, Suite 950 Washington, DC 20005 (202) 828-8357 www.smallbusinessmajority.org
THE AP-GfK POLL December, 2013
 Public Affairs & Corporate Communications THE AP-GfK POLL December, 2013 Conducted by GfK Public Affairs & Corporate Communications A survey of the American general population (ages 18+) Interview dates:
Survey of Iraqi Public Opinion
 Survey of Iraqi Public Opinion www.iri.org June 3 July 3, 2010 SURVEY METHODOLOGY SURVEY METHODOLOGY Data collection was performed by trained employees of the International Republican Institute (IRI).
THE CUBAN LABOR MARKET: AVAILABILITY AND INTERPRETATION OF STATISTICS
 THE CUBAN LABOR MARKET: AVAILABILITY AND INTERPRETATION OF STATISTICS Jorge F. Pérez-López Labor market issues are front and center in current debates about the future of the Cuban economy. Since his designation
NATIONAL: HEALTH CARE IS TOP CONCERN OF AMERICAN FAMILIES
 Please attribute this information to: Monmouth University Poll West Long Branch, NJ 07764 www.monmouth.edu/polling Follow on Twitter: @MonmouthPoll Released: Tuesday, February 7, 2017 Contact: PATRICK
EMBARGOED NOT FOR RELEASE UNTIL: SUNDAY, FEBRUARY 23, 1992 UNEMPLOYMENT HITS MANY NJ HOUSEHOLDS; CONSUMERS ASSESS HOUSING, AUTOMOBILE
 EMBARGOED NOT FOR RELEASE UNTIL: SUNDAY, FEBRUARY 23, 1992 RELEASE: SL/EP 37-4 (EP 87-4) CONTACT: KEN DAUTRICH OR JANICE BALLOU RELEASE INFORMATION A story based on the survey findings presented in this
Production & Offshore Drilling July 2014
 Production & Offshore Drilling July 2014 Created for: American Petroleum Institute Presented by: Nielsen Interviewing: July 10 July 13, 2014 Respondents: 1012 Registered Voters Method: Telephone Sample:
Voices of 50+ New York:
 2011 Voices of 50+ New York: Dreams & Challenges Executive Summary AARP has a strong commitment to help improve the lives of the 50+ population. As part of the Association s continuous communication with
The margin of error for 812 interviews is ± 3.4%
 HART RESEARCH / PUBLIC OPINION STRATEGIES Study #10863c--page 1 1724 Connecticut Avenue, NW Interviews: 812 adults, including Washington, DC 20009 201 who only have a cell phone (202) 234-5570 Dates: September
The Coalition for Medicare Choices
 The Coalition for Choices MEDICARE ADVANTAGE POLLING PRESENTATION December 2018 Key Points Seniors on are more satisfied (90%) than seniors on traditional (76%) with their healthcare coverage. 47% are
May 5, To: Oregon Public Broadcasting From: DHM Research Re: Quarterly Omnibus Survey Topline Results
 239 NW 13 th Ave., #205 Portland, OR 97209 503.220.0575 www.dhmresearch.com Portland Seattle Washington DC May 5, 2014 To: Oregon Public Broadcasting From: DHM Research Re: Quarterly Omnibus Survey Topline
Voices of 50+ Delaware: Dreams & Challenges
 2011 Voices of 50+ Delaware: Dreams & Challenges Executive Summary AARP has a strong commitment to help improve the lives of the 50+ population. As part of the Association s continuous communication with
HuffPost: Omarosa August 14-16, US Adults
 1. Ever acceptable Do you think it is EVER acceptable for a white person to use the n-word? Yes 15% 15% 22% 9% 16% 20% 14% 12% 17% 8% 6% 22% No 69% 72% 65% 73% 64% 67% 71% 74% 67% 85% 70% 49% Prefer not
PPI ALERT November 2011
 PPI ALERT November 2011 50+ and Worried about Today and Tomorrow Older Americans Express Concerns about the State of the Economy and their Current and Future Financial Well-being In late August, 2011,
OCTOBER 1999 HEALTH NEWS INTEREST INDEX. -- TOPLINE RESULTS October 8, 1999
 OCTOBER 1999 HEALTH NEWS INTEREST INDEX -- TOPLINE RESULTS October 8, 1999 job # 99050 n=1,033 national adults, 18 years and older Margin of error: plus or minus percentage points 3.5 (square root of design
Life Insurance Association of Singapore Survey Results. 10 November 2006
 Life Insurance Association of Singapore Survey Results 10 November 2006 1 Research Objectives To ascertain : The general population s understanding of life insurance The general population s perception
Registered voters Gender Age (4 category) Race (4 category)
 Race (4 category)") 1. Following shutdown news How closely are you following news about the partial government shutdown? Very closely 34% 43% 35% 33% 20% 29% 37% 47% 37% 32% 27% 19% Somewhat closely 39% 40% 37% 40% 34% 34%
1. Following shutdown news How closely are you following news about the partial government shutdown? Very closely 34% 43% 35% 33% 20% 29% 37% 47% 37% 32% 27% 19% Somewhat closely 39% 40% 37% 40% 34% 34%
Access and Infrastructure National April 2014
 Access and Infrastructure National April 2014 Created for: American Petroleum Institute Presented by: Nielsen Interviewing: April 3-9, 2014 Respondents: 1,003 Registered Voters Method: Telephone Sample:
SOMALILAND OPINION SURVEY - HARGEISA DISTRICT - FIELDWORK : SEPTEMBER 28 OCTOBER 8, 2011
 SOMALILAND OPINION SURVEY - HARGEISA DISTRICT - FIELDWORK : SEPTEMBER 28 OCTOBER 8, 2011 Acronyms Legend UDUB United People s Democratic Party KULMIYE Peace, Unity and Development Party UCID Justice and
Toplines. May/June 2004 Health Poll Report Survey
 Toplines May/June 2004 Health Poll Report Survey June 2004 Methodology The Kaiser Family Foundation Health Poll Report Survey was designed and analyzed by Dr. Mollyann Brodie, Elizabeth Hamel, and Jaime
Massachusetts Health Reform Tracking Survey
 Toplines Kaiser Family Foundation/Harvard School of Public Health/Blue Cross Blue Shield of Massachusetts Foundation Massachusetts Health Reform Tracking Survey June 2007 Methodology The Kaiser Family
New Hampshire State Survey Annotated Questionnaire Weighted n=402; Sampling Error= ±5.0%
 S1. Are you over or under age 50? New Hampshire 2011 53 State Survey Annotated Questionnaire 2011 Weighted n=402; Sampling Error= ±5.0% The total percent of respondents in each question may add up to more
FOR RELEASE: MONDAY, SEPTEMBER 30 AT 6 AM
 Interviews with 803 adult Americans conducted by telephone by ORC International on September 7-9, 013. The margin of sampling error for results based on the total sample is plus or minus 3.5 percentage
EMBARGOED FOR RELEASE: Thursday, March 19 at 6:00 a.m. ET
 Interviews with 1,009 adult Americans conducted by telephone by ORC International on March 13-15, 2015. The margin of sampling error for results based on the total sample is plus or minus 3 percentage
EMBARGOED FOR RELEASE: 6:00 a.m. ET on Tuesday, March 17
 Interviews with 1,009 adult Americans conducted by telephone by ORC International on March 13-15, 2015. The margin of sampling error for results based on the total sample is plus or minus 3 percentage
YouGov May 26-27, US Adults
 1. Democratic Party Would you say the Democratic Party is: Allies to people like you 15% 16% 14% 13% 13% 18% 13% 14% 27% 7% 9% you 22% 23% 22% 26% 28% 17% 20% 20% 33% 20% 30% you 16% 15% 17% 18% 17% 14%
Public Opinion on Old Age Security Reform
 February 3, 2012 January 31 to February 2, 2012 n=1,209 Canadians, 18 years of age and older Methodology The survey was conducted online with 1,209 respondents in English and French using an internet survey
The Arkansas Poll, 2014 Summary Report
 nt CONTACTS: Janine Parry, Poll Director, 479-575-6439 or 479-409-0968, parry@uark.edu Barbara Jaquish, Director of Science and Research Communication, 479-575-2683, jaquish@uark.edu The Arkansas Poll,
HOW THE POLL WAS CONDUCTED
 HOW THE POLL WAS CONDUCTED This poll was conducted for Telemundo by Mason-Dixon Polling & Strategy, Inc. of Jacksonville, Florida from October 25 through October 30, 2018. A total of 625 registered Hispanic
How the Survey was Conducted Nature of the Sample: McClatchy-Marist National Poll of 1,197 Adults
 How the Survey was Conducted Nature of the Sample: McClatchy-Marist National Poll of 1,197 Adults This survey of 1,197 adults was conducted February 4 th through February 9 th, 2014 by The Marist Poll
Hunger Free Colorado
 Hunger Free Colorado Colorado Statewide Public Opinion Tracking & Issues Survey TOPLINE RESULTS December 1, 2016 Prepared By Kupersmit Research This survey of 400 telephone interviews was conducted among
WESTERN NEW ENGLAND UNIVERSITY POLLING INSTITUTE 2018 Massachusetts Statewide Survey October 10-27, 2018
 WESTERN NEW ENGLAND UNIVERSITY POLLING INSTITUTE 2018 Massachusetts Statewide Survey October 10-27, 2018 TABLES First, we'd like to ask you a few questions about public officials. Do you approve or disapprove
HuffPost: Hurricanes September 26-27, US Adults
 1. Following news - Hurricane Harvey How closely did you follow news about the effects of... Very closely 39% 41% 37% 17% 27% 47% 62% 41% 44% 21% 32% Somewhat closely 37% 37% 38% 44% 39% 35% 32% 38% 28%
NEW JERSEY: PUBLIC SPLIT ON MURPHY S FIRST YEAR
 Please attribute this information to: Monmouth University Poll West Long Branch, NJ 07764 www.monmouth.edu/polling Follow on Twitter: @MonmouthPoll Released: Tuesday, February 12, 2019 Contact: PATRICK
AMERICA AT HOME SURVEY American Attitudes on Homeownership, the Home-Buying Process, and the Impact of Student Loan Debt
 AMERICA AT HOME SURVEY 2017 American Attitudes on Homeownership, the Home-Buying Process, and the Impact of Student Loan Debt 1 Objective and Methodology Objective The purpose of the survey was to understand
FOR RELEASE: WEDNESDAY, JULY 23 AT 6 AM
 Interviews with 1,012 adult Americans conducted by telephone by ORC International on July 18-20, 2014. The margin of sampling error for results based on the total sample is plus or minus 3 percentage points.
Random digit dial Results are weighted to be representative of Maryland registered voters.
 Access and Infrastructure Maryland April 2014 Created for: American Petroleum Institute Presented by: Nielsen Interviewing: April 9 16, 2014 Respondents: 602 registered voters Method: Telephone Sample:
Sampling Design Report: Oxford Internet Survey 2003
 Sampling Design Report: Oxford Internet Survey 2003 Sampling was based on a two stage design. Firstly a random sample of 175 paired Enumeration Districts (EDs) stratified by region was selected. Then within